
Abstract
This study proposed to assess foot types and radiological examination of feet of individuals with hypermobility syndrome in comparison to healthy matched controls for age, sex, and body mass index. The relationship between foot angles and hypermobility scores of subjects in both groups were also assessed. Twenty individuals having joint hypermobility syndrome previously diagnosed according to Beighton and Bulbena scores were compared to 20 healthy subjects. Standing anteroposterior (AP) and lateral weigthbearing radiographs of feet of the individuals were taken. Foot angles and foot types were evaluated on the AP and lateral views. The mean ± SD of Beighton and Bulbena scores were significantly higher in the hypermobile individuals (p < .001) than in controls. In both groups, Egyptian and square types of feet were mostly encountered (p > .05). Bilateral calcaneal pitch (CP) angles (p < .001), bilateral talometatarsal (TM) angles (p < .01), and right apex angles (p < .05) were significantly low in hypermobile individuals, whereas first metatarsophalangeal (MTP) angles were significantly high (right foot, p < .01; left foot, p < .05) as compared to the control group. Hypermobility scores correlated negatively with bilateral CP and TM angles and positively with bilateral first MTP angles. No correlation was found for the other angles. These finding suggest that foot angles (especially CP, TM and first MTP angles) are in relation with severity of hypermobility. There was no difference between foot types in the hypermobile individuals and healthy controls. These angles may be useful for clinically monitoring the foot health in the hypermobile individuals
Introduction
The term hypermobility is used to describe a common disorder in which seemingly otherwise healthy individuals present with articular and/or spinal symptoms for which no explanation is forthcoming. 14 In 1967, Kirk et al. defined this syndrome for the first time. 16 In hypermobility syndrome (HMS) some symptoms may be seen, such as traction injuries in tendon and ligament cohesion places (entheses) and joint or tenosynovitis, chondromalacia patella, rotator cuff injuries depending on trauma and excessive usage, low back pain dependent on soft tissue or lumbar disc hernia. Furthermore, in these patients some other symptoms can be seen, such as joint instability, pes planus, subluxation, or luxation in shoulder, patella, metacarpophalangeal joint or temporomandibular joint. 7,11,12,16
Despite many studies describing the existence of pes planus in HMS, 1,2,4,5,8 there is no radiographic or clinical study in the literature on foot angles and types. Foot types are classified with respect to the structural configuration of the forefoot. There are three types of feet: Egyptian foot, in which the hallux is the longest toe; Greek foot, in which the first toe is shorter than the second; and square foot, in which the first toe is the same length as the second. This classification may help to explain the etiology of the various forefoot deformities and it may enable the clinician to predict the outcome of forefoot surgery. 26 Axial and angular measurements may provide important information that will be helpful in the evaluation and treatment of patients with disorders of the foot and ankle. The purpose of this study was to assess foot angles and types in patients with HMS and to evaluate the relationship between foot angles and joint hypermobility scores. Hence, from this investigation, we may learn which angles are clinically useful for hypermobile individuals.
Illustrations of foot angles (a, b), measurement of these angles in a control subject (
Materials and Methods
The feet of 20 hypermobile individuals (14 female, 6 male) and those of 20 healthy control subjects (15 female, 5 male) were evaluated. None of the subjects had congenital deformity or systemic rheumatic disease and none of the female subjects were pregnant. Joint mobility was estimated using Beighton and Bulbena scores. 3,5 Beighton scoring required at least 4 points out of 9, and Bulbena scoring required at least 5 points for males and 6 points for females out of 10, to diagnose hypermobility syndrome.
The anteroposterior (AP) and lateral weightbearing radiographs of feet were taken by the same technician with the subjects erect and standing. For an AP view, the x-ray source was centered on the midfoot and tilted 15° toward the ankle joint. For a lateral view, the x-ray source was oriented perpendicular to the foot at the level of the navicular tuberosity and 90 cm from the foot.
Foot types and indexes of the patients were determined with AP graphics. Calcaneal and first metatarsal fat pads were measured in millimeters using a compass. First metatarsophalangeal (MTP), apex of the arch (A), proximal navicular-articular surface (PN), proximal cuneiform-articular surface (PC), proximal first metatarsal-base (PFMB), Böhler's calcaneal pitch (CP), talometatarsal (TM), and talocalcaneal (TC) angles were measured using a goniometer 26 (Fig. 1), and foot types were evaluated on the AP and lateral views.
Fisher's exact test, Student t test, chi-square test, and Pearson and Spearman correlation tests were used in statistical analysis. Differences at the level of 5% were considered statistically significant.
Results
There was no difference between the control group and the hypermobile group in the age, gender, weight, height, and body mass index (BMI) (p > .05) (Table 1). Beighton scores of the control and hypermobile groups were mean 1.1 ± 0.96 and 7.55 ± 1.27, p < .001, respectively. Bulbena scores of the control and hypermobile groups were mean 2.75 ± 1.37 and 8.8 ± 1.0, p < .001, respectively. Egyptian and square types were the most frequently encountered foot types in both hypermobile and control groups (p > .05). Right foot was the dominant side in all subjects according to their self-reporting. In the both groups, bilateral CP angles, bilateral TM angles, right apex angles, and bilateral first MTP angles were significantly different. There was no difference in the other measurements (Table 2).
Gender distribution and anthropometric measurements (mean ± SD) for hypermobile individuals and healthy control group
Hypermobility scores and radiographic measurements (means ± SD) for hypermobile individuals and healthy control group
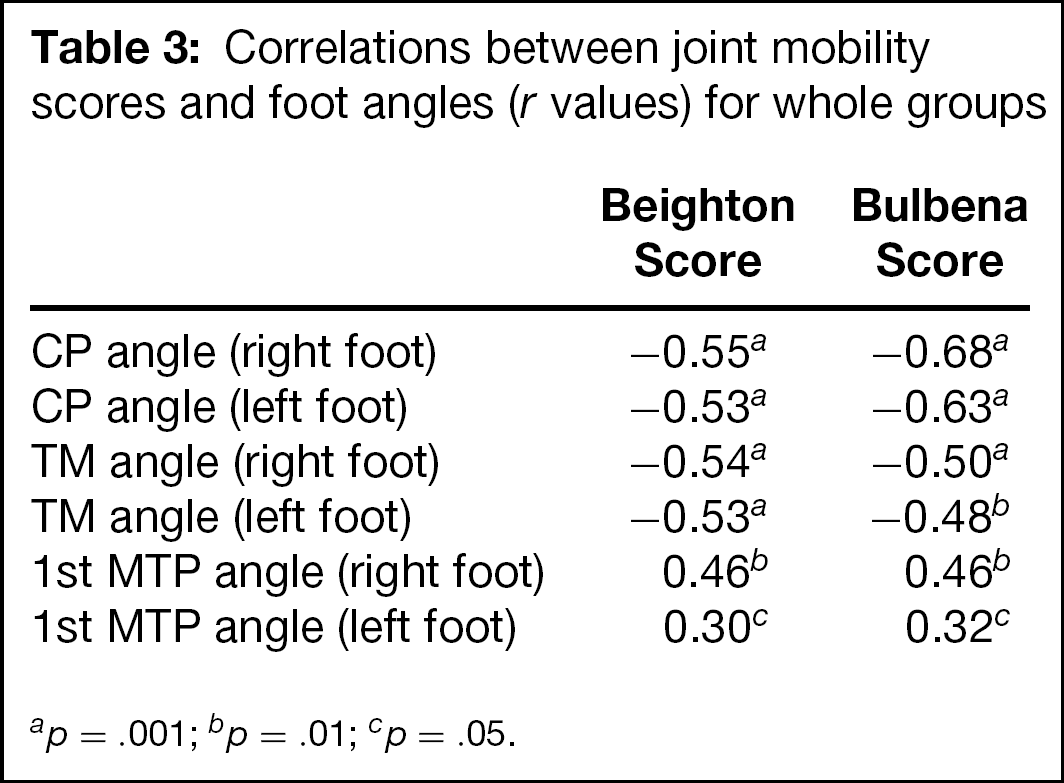
When all the study groups were evaluated together, hypermobility scores were negatively correlated with CP angle and TM angle (Fig. 2, A–D; Table 3). Hypermobility scores were positively correlated with heel fat pad only in the right foot (Beighton: r = .30, p = .057; Bulbena: right r = .36, p < .05) and with first MTP angles in both feet (Fig. 2, E and F; Table 3). In the hypermobile group first MTP, CP, TM, and TC angles displayed a large distribution as compared to those in the control group showing a compact distribution (Fig. 2).
Discussion
Joint hypermobility has been implicated as one of the etiological components in common foot problems. Joint laxity may be found in approximately 5–15% of healthy persons without any symptoms. 15,19,22 This rate changes with age, gender, and ethnic origin. 14 Hypermobility scores continuosly decrease with aging, and this change is more rapid during childhood. 10,20
The relationship between foot angles and hypermobility scores in both groups.
Correlations between joint mobility scores and foot angles (r values) for whole groups
p = .001
p = .01
p = .05.
Hypermobile individuals may suffer from readily identifiable traumatic and overuse lesions, such as traction injuries at tendon or ligament insertions, joint or tendon sheath synovitis, chondromalacia patellae, rotator cuff lesions, or back pain due to soft-tissue injury or disc prolapse. Joint instability is a commonly encountered musculoskeletal problem presented with flatfoot or recurrent dislocation or subluxation — notably of the shoulder, patella, metacarpophalangeal, or temporomandibular joints.
There are different studies verifying the incidence of pes planus and hallux valgus in hypermobile individuals. Carl et al. reported that there was a significant correlation between hallux valgus and generalized hypermobility in female patients. 6 It was reported that excessive motion of the first metatarsocuneiform joint in the sagittal and transverse plane correlates with hallux valgus deformity. 21 In several reports, authors describe hypermobility of the first tarsometatarsal joint as a major factor in the etiology of the hallux valgus complex. 13,25 However, none of these studies assessed the relationship between foot angles and types and joint hypermobility scores. 2,4,5,8,17
In the present study, we have determined foot angles and foot types of hypermobile individuals and the relationship between foot angles and hypermobility. A radiographic evaluation of the foot and ankle provides much information about structural abnormalities as well as local and systemic disorders affecting extremity. 6,23 Radiographs taken of the weightbearing foot demonstrate the foot in a more functional situation and may provide insight into the relationship among the soft tissues, the bones, and joints under physiologic loads. In this study, radiographs of feet were taken as described previously. CP angle is between 20° and 30° in healthy persons. 26 We found that this angle in the hypermobile group was significantly lower (approximately 18°) than in the control group (approximately 25°) (Table 2). There was a negative correlation between the CP angle and joint hypermobility scores. It was found that the CP angles correlate more positively for Bulbena scores as compared to Beighton scores. Bulbena scores may be more useful in the assessment of the foot in hypermobile individuals. The TM angles of hypermobile individuals were found to be bilaterally lower than those of controls (Table 1). Lower values of these angles represent more severe pes planus, and these angles were negatively related to hypermobility scores. The apex angle is an indicator of the longitudinal arch and it depicts a course toward pes planus. We found the apex angles were slightly higher in the hypermobile group than in the control group (Table 2).
In the general population, the incidence of pes planus has been reported to be between 2% and 18%. 9,18,24,27 It has been reported that the incidence of pes planus in the hypermobile patients is high. 2 Pes planus has been found in 31 of the 40 patients with Beighton scores of 5/9 and over. 17 The rate of ankle joint hypermobility has been reported to be 93% in hypermobile individuals. 5 In our study, the rate of pes planus was found to be 55% in hypermobile individuals and 15% in controls. We observed that foot angles showed an increased pes planus with the increase in hypermobility scores in hypermobile individuals, but in control subjects an increase in hypermobility did not correlate with increased pes planus scores. We found that the first MTP angles were higher in the hypermobile individuals than in controls (Table 2), and that there was a positive correlation between first MTP angles and joint hypermobility scores.
Consequently, we found relationships between various foot angles and hypermobile subjects. These findings suggest that hypermobile individuals are prone to pes planus derformity and these angles (especially CP, TM, and first MTP angles) may give invaluable information about foot deformity, not only in healthy subjects but also in hypermobile individuals.