
Abstract
Background:
Subchondral cysts are a type of osteochondral defect of the talus and can be a source of chronic ankle pain. The treatment modality of this cystic lesion is similar to that of other osteochondral defects, but results from previous reports are controversial. Therefore, we compared the clinical results and radiographic changes in small subchondral talar cystic lesions (less than 1.5 cm 2 ) to other noncystic defects after arthroscopic operations without bone grafting.
Methods:
The review covered about 2 years (January, 2001 to April, 2003) and included 38 patients with an average age of 36.9 years. Followup ranged from 24 to 36 months. Arthroscopic microfracture or abrasion arthroplasty was performed on 20 defects with subchondral cysts and 18 defects without cysts. Clinical results were assessed by the ankle-hindfoot scale of the American Orthopaedic Foot and Ankle Society (AOFAS); radiographic changes were assessed by the transverse long diameter and the area (mm 2 ) of the cyst on digital radiographs using a PACS (Picture Archiving Communication System).
Results:
At the last followup, AOFAS clinical scores improved similarly in cystic and noncystic defects. The average diameter of the cysts decreased from 8 ± 2 mm to 6 ± 2 mm (p < 0.01). The area attributed to the cyst also decreased, from 49 ± 17 mm 2 (24 to 84 mm 2 ) to 23 ± 8 mm 2 (4 to 34 mm 2 ) (p < 0.01). There were no differences in the clinical results between the cystic and noncystic defects.
Conclusions:
Good clinical and radiographic results were obtained after arthroscopic treatment of osteochondral defects with a small subchondral cyst. Our results suggest that a small cystic lesion can be treated by arthroscopic microfracture or abrasion arthroplasty and that the existence of a small cyst in an osteochondral defect lesion may not affect the postoperative prognosis.
INTRODUCTION
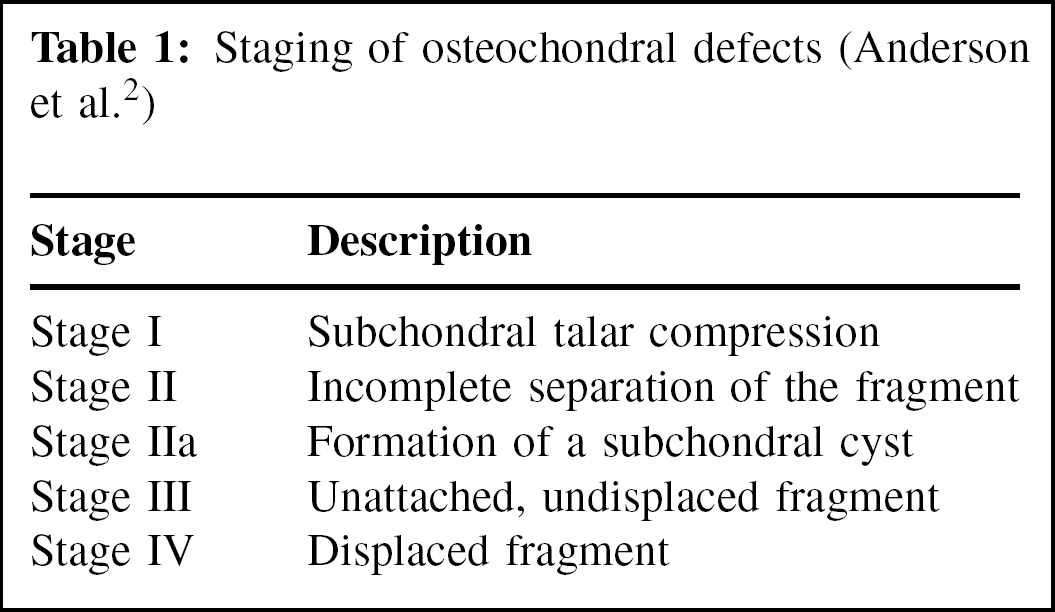
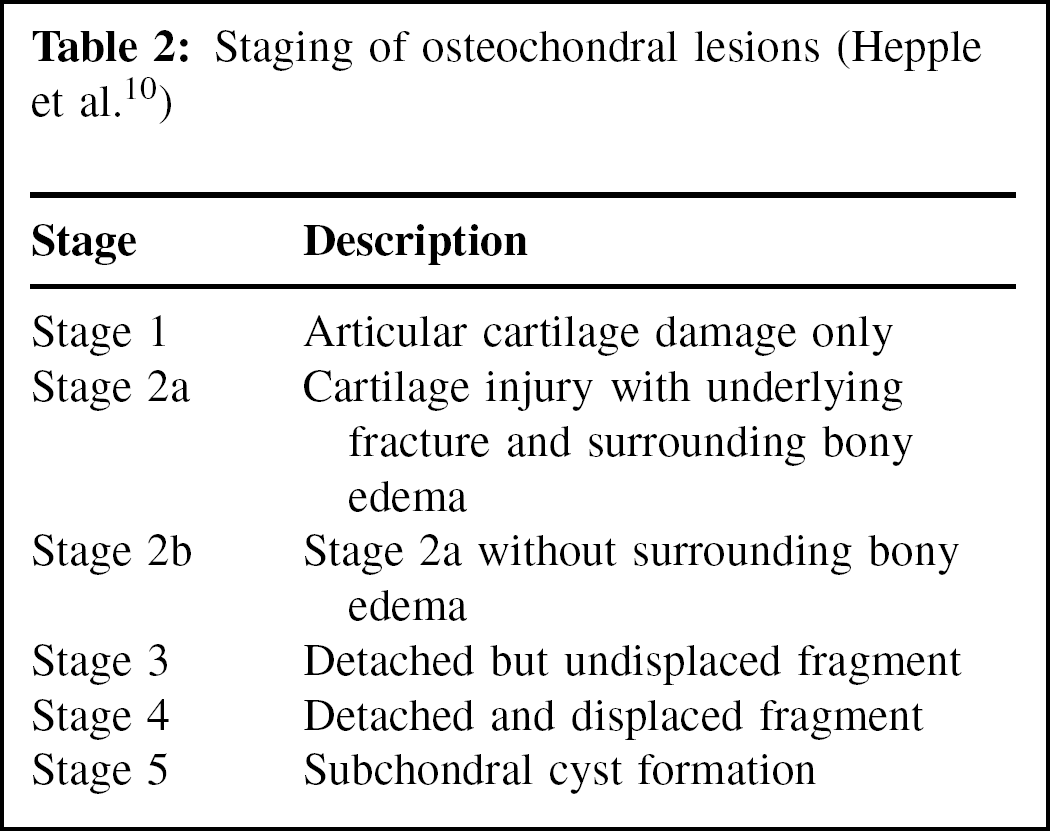
Osteochondral defects (OCD) of the talus are primarily associated with trauma, but their etiology remains obscure. 1,6,21 In 1959, Berndt and Harty 6 established the principles of treatment for this condition with their system for staging of the defects at the time of surgery, based on plain radiographs of the ankle. With the development of new diagnostic methods, classification criteria were modified using CT or MRI. In the newer classification systems, cystic lesions of the talus were introduced and their clinical importance emphasized. In CT-based staging system, 23 cystic lesions of the talus were classified as stages I and II, according to condition of the roof cartilage. In the MRI-based staging systems suggested by Anderson et al. 2 and Hepple et al., 10 cystic lesions of the talus were classified as stage IIA and stage V, respectively, according to treatment results.
These various classifications of osteochondral defects with subchondral cysts might be due to the uncertainty about the pathogenesis and disease progression of subchondral cystic lesions of the talus. The theories of the pathogenesis of these cystic lesions have been postulated. One involves intrusion of synovial fluid or herniation of the synovial membrane into the bone through articular defects. According to this theory, a chondral fracture extending through the underlying subchondral bony plate results in a buildup of pressure from the forceful entry of synovial fluid and subsequent cyst formation. Another theory involves mucoid degeneration of intramedullary connective tissue, probably preceded by focal ischemia or aseptic necrosis. 4,5,8,11
Various treatment modalities for subchondral cysts of the talus have been recommended, such as resection of the frayed cartilage, microfracture of the cyst base, subchondral drilling or abrasion, and bone grafting. 3,13,24 These operative methods have been used for noncystic osteochondral defects with generally positive results; however, the results for subchondral cystic lesions are controversial. 10,16,17,19
We compared the radiographic changes and clinical results of arthroscopic treatment of osteochondral defects of the talus with and without subchondral cysts to suggest treatment guidelines for defects with cystic lesions.
MATERIALS AND METHODS
Inclusion Criteria
Between January, 2001, and April, 2003, 38 patients with symptomatic osteochondral defects of the talus were treated with arthroscopic surgery. All had received at least 3 months of nonoperative treatment before operation. The 22 men and 16 women had an average age of 37 ± 13 years at the time of operation. The average duration of symptoms before the operation was 6 ± 5 months. Thirty-two (84.2%) had a history of trauma (ankle sprain) of the involved ankle.
Diagnosis and MRI Staging
Preoperative radiographs and MRI were used to confirm an osteochondral defect. We used the MRI staging systems described by Anderson et al. 2 and Hepple et al. 10 According to these two classifications, cystic lesions of the talus were classified as Anderson stage IIA (Table 1) and Hepple stage 5 (Table 2).
Operative Procedure
After induction of spinal or general anesthesia, the patient was placed supine with a sand bag under the upper thigh to flex the knee. Then noninvasive ankle distraction (6 to 8 kg) was applied by an ankle harness to widen the joint space. A pneumatic tourniquet was applied on the upper thigh. The ankle was distended with 15 to 20 ml of saline. The superior anteromedial portal adjacent to the anterior tibial tendon was used. A 3-mm longitudinal incision was made on the medial side of the anterior tibial tendon. With a mosquito dissector, the soft tissue was gently dissected until the joint capsule was exposed, avoiding nerve damage. An arthroscope 2.7-mm in diameter with a 30-degree viewing angle was inserted. A superior anterolateral portal adjacent to the peroneus tertius was made at the level of the medial portal. These portals were located 1 cm above the articular line of the talus. Most lesions (30 of the 38) were located in the medial aspect of the talar dome; they were examined with the ankle joint in plantarflexion.
Staging of osteochondral defects (Anderson et al. 2 )
The probe was inserted into the portal on the same side as the lesion and was used to open the mouth of the cyst and remove the gelatinous material from within the cyst. Grasping forceps and basket forceps were used to remove loose cartilage and the roof of the cyst. After removal of the cartilage cap, and curettage and debridement of the lesion, microfracture was done in areas where subchondral bone was intact or in cystic areas without bleeding. For areas with loss of subchondral bone or cysts with bleeding, abrasion arthroplasty was done. In five of the cystic lesions and 14 of the noncystic lesions, the cavity was abraded with a power shaver and burr; in 15 cystic lesions and four noncystic lesions, debridement was done with a curved curet and microfracture was done with a 3.5-mm microfracture awl (Linvatec Co., Largo, Florida, USA). The bleeding base was once more confirmed by release of the tourniquet and observation of punctate bleeding on the cancellous base of the lesion before the end of arthroscopic treatment. The portals were closed with a single nonabsorbable suture.
After the operation, patients with lesions smaller than 1.5 cm 2 were allowed weightbearing to tolerance. Those with larger lesions were restricted to partial weightbearing for 3 weeks. High-impact sports were limited for 3 months after the operation. Physical therapy was begun at one week to regain motion, strength, and proprioception. 17,18,19
Clinical Assessment
A standard protocol was to evaluate the patients before surgery and at last followup. Followup ranged from 24 to 36 months and averaged 30 ± 4 months. The American Orthopaedic Foot and Ankle Society (AOFAS) Ankle- Hindfoot Score was used to evaluate outcomes and patient satisfaction (90 to 100 points excellent; 75 to 89 points good; 50 to 74 points satisfactory; less than 50 points poor).
Staging of osteochondral lesions (Hepple et al. 10 )
Radiographic Assessment
Radiographs made with standardized methods were available for all 38 patients. True anteroposterior views were taken with an equal magnification ratio of 110% by using the magnification bar and positioner. All films were digitalized to 1672 × 2010 pixels using the direct digital interface of an FCR 9000 (Fusi film Medical System, Stamford, Connecticut, USA). The long diameter (greatest width) of the cystic lesion and the size of the cystic lesion were measured on radiograph. Using a PACS (Picture Archiving Communication System, General Electrics, Milwaukee, WI), the radiolucent area regarded as the cystic lesion was digitally segmented (Figure 1). The segmented area (mm 2 ) was measured by averaging three repeated measurements by three independent specialists. We compared the area of the cystic lesions before operation and at last followup.
Data Analysis
The clinical results according to different stages and cystic lesions were analyzed with one-way analysis of variance (ANOVA), the Spearman correlation coefficient test, and Student's t-test. Changes in the area of the cysts were statistically analyzed with a paired Student's t-test. Patient satisfaction was statistically analyzed with a chi-square test.
RESULTS
Clinical Assessment
Preoperative AOFAS scores of all patients averaged 53 ± 18 and improved to 77 ± 15 at last follow up (p < 0.0001). But, symptom duration (p = 0.5135) and trauma history (p = 0.2478) did not appear to affect the clinical results of the operation. Defects were classified according to the two MRI staging systems, and preoperative and postoperative scores were measured by independent specialists (Table 3). There were no differences in the distribution of age, gender, or symptom duration among the stages (p = 0.3633, p = 0.6957, and p = 0.7723, respectively). Even though statistical significance could not be reached because of the small number of available cases, the postoperative scores improved in all stages compared to the preoperative scores (p < 0.05), while no differences between preoperative and postoperative score increments were found between the stages (p = 0.1326) (Table 3).
Twenty of 38 patients had cystic lesions. The cystic group's preoperative average score of 57 ± 16 improved to a postoperative score of 82 ± 10 (p < 0.0001) (Table 4). However, two patients still had pain and did not show functional improvement. The average scores of the noncystic group (18 patients) improved from 48 ± 19 preoperatively to 71 ± 17 postoperatively (p < 0.0001). With the numbers available, there was no significant difference between the score increases in the cystic and noncystic groups (p = 0.7718) (Table 4). Patient satisfaction was 35% excellent and 45% good in the cystic group and 17% excellent and 56% good in the noncystic group. Overall, patient satisfaction was excellent in 80% and good in 73%.
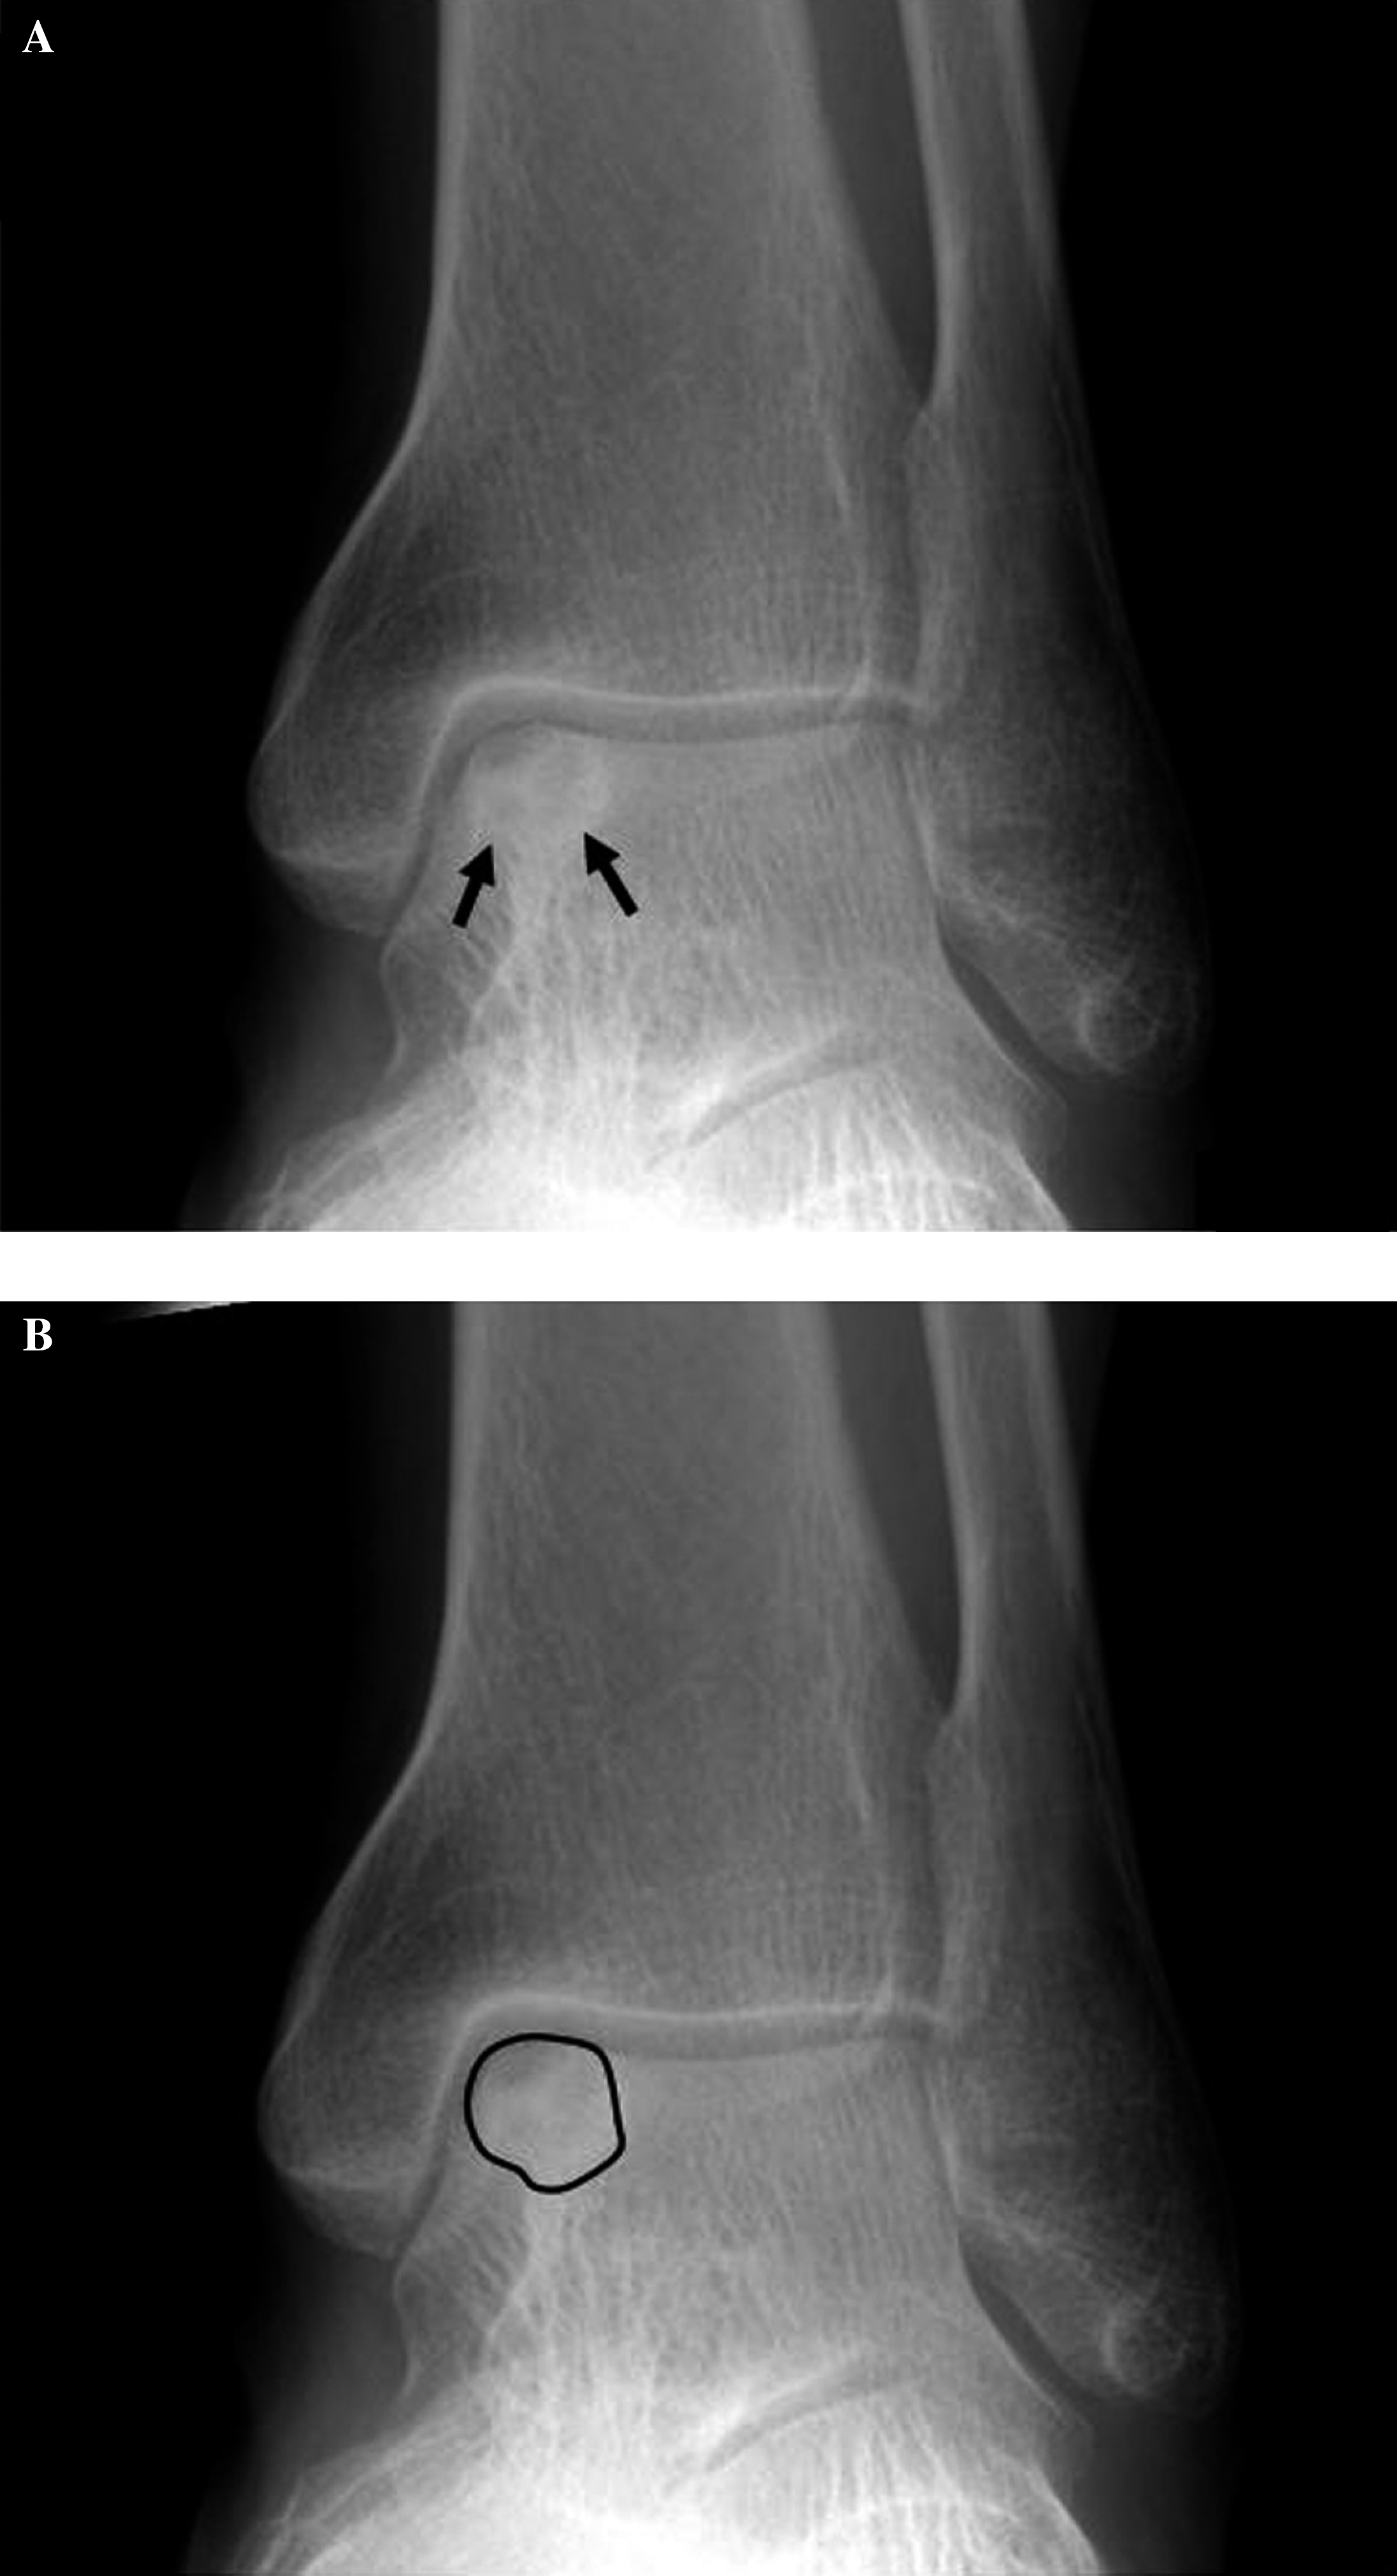
Digitized anteroposterior radiograph
Radiographic Findings and Assessment of Cystic Lesions of Talus
Of the 20 cystic lesions, 16 were visible on anteroposterior radiographs; four were identified by MRI. MRI showed a round, demarcated lesion with decreased T1 signal and increased T2 signal in the form of fluid, and bone marrow edema of the adjacent bone marrow was visible with gadolinium enhancement.
The radiolucent lesions were round, oval, and irregular. In some, a radiopaque rim was noted. The mean diameter of the radiolucent lesions was 8 ± 2 mm; at the last followup, the mean diameter was 6 ± 2 mm; (p < 0.001).
Preoperative and postoperative AOFAS scores according to stage
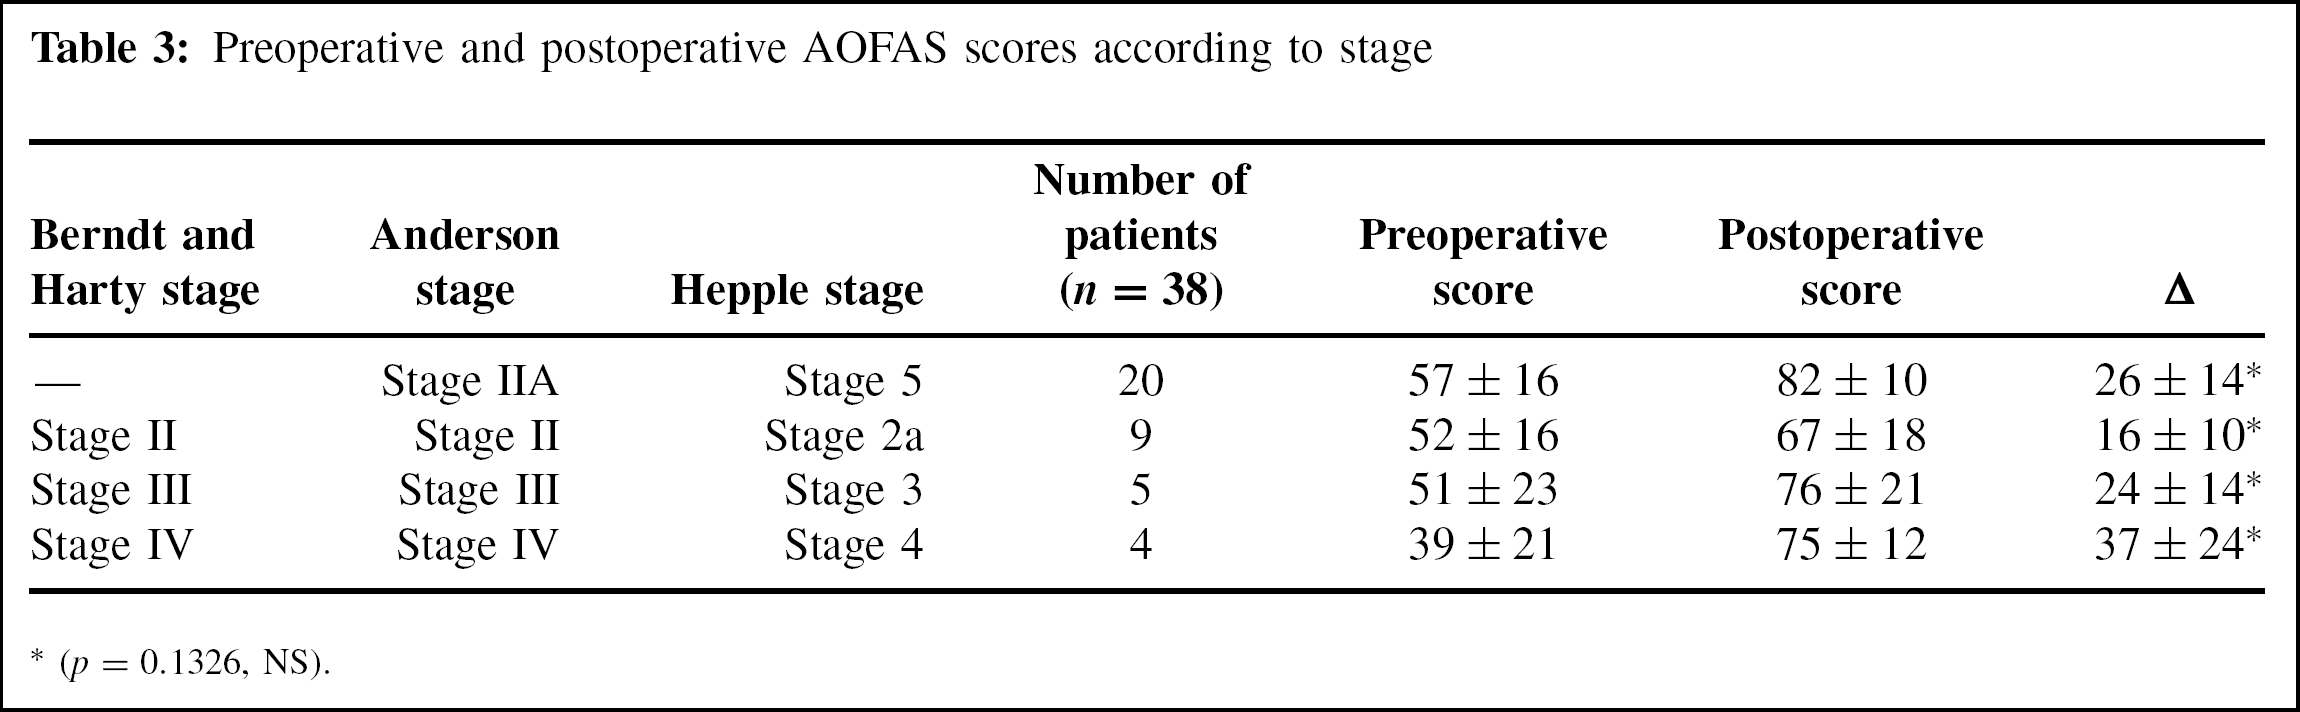
(p = 0.1326, NS).
Preoperative and postoperative AOFAS scores in osteochondral defects with and without cysts
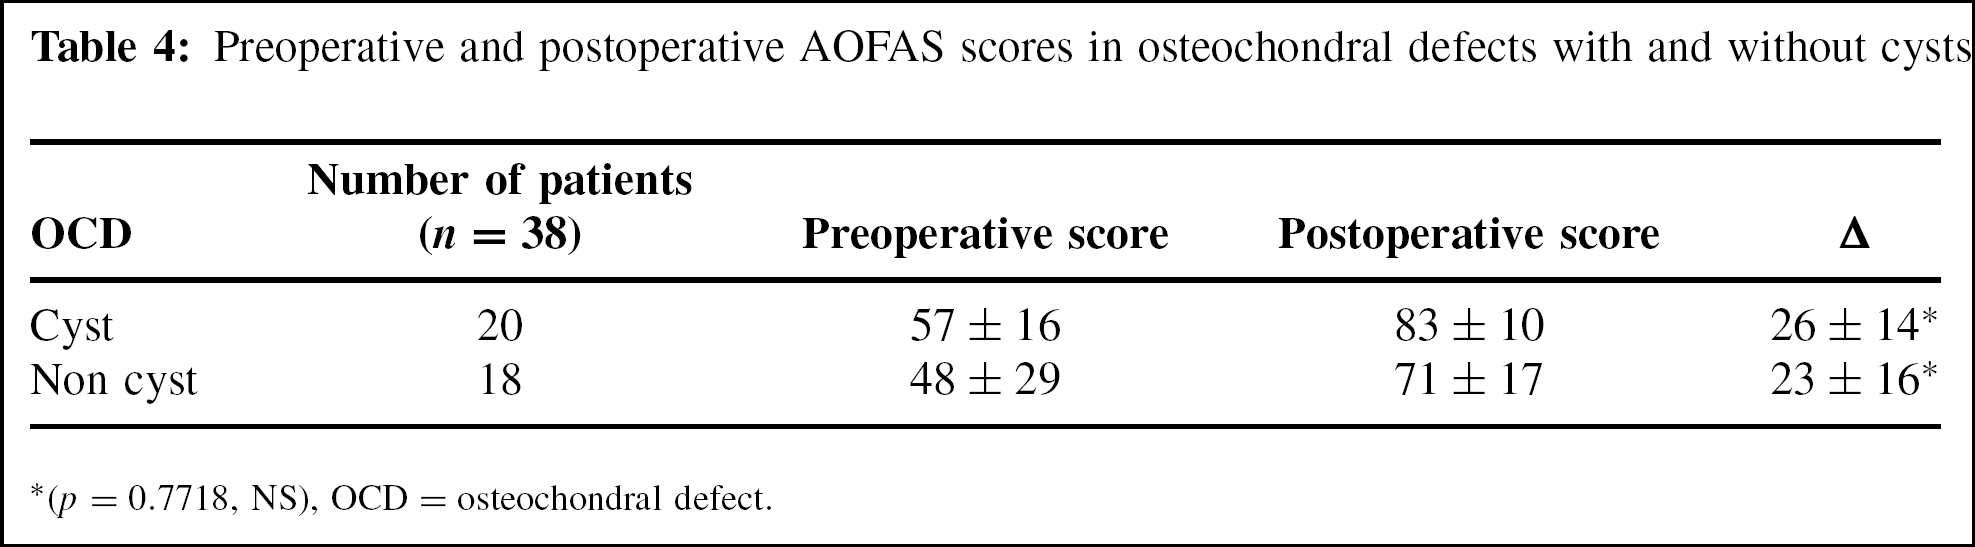
(p = 0.7718, NS), OCD = osteochondral defect.
After manual segmentation of the radiolucent lesion, the area of the lesion was measured using a PACS. The mean area for the preoperative cystic lesions was 49 ± 17 mm 2 (24 to 84 mm 2 ) and the mean area on the last followup radiograph was 23 ± 8 mm 2 (4 to 34 mm 2 ) (p < 0.001) (Figure 2).
Comparing radiographic results to clinical results, the preoperative cystic size did not correlate with the postoperative score increase (p = 0.5584), indicating that preoperative cystic size might not affect postoperative clinical results. The decrease in the cystic area and the increase in the clinical score did not correlate statistically (p = 0.2977), indicating that radiolographic improvement might not be correlated with clinical improvement. Decrease of the widest diameter of the cyst correlated well with the decrease in area (p < 0.001). Therefore, the area measuring method might be another parameter for radiographic assessment.
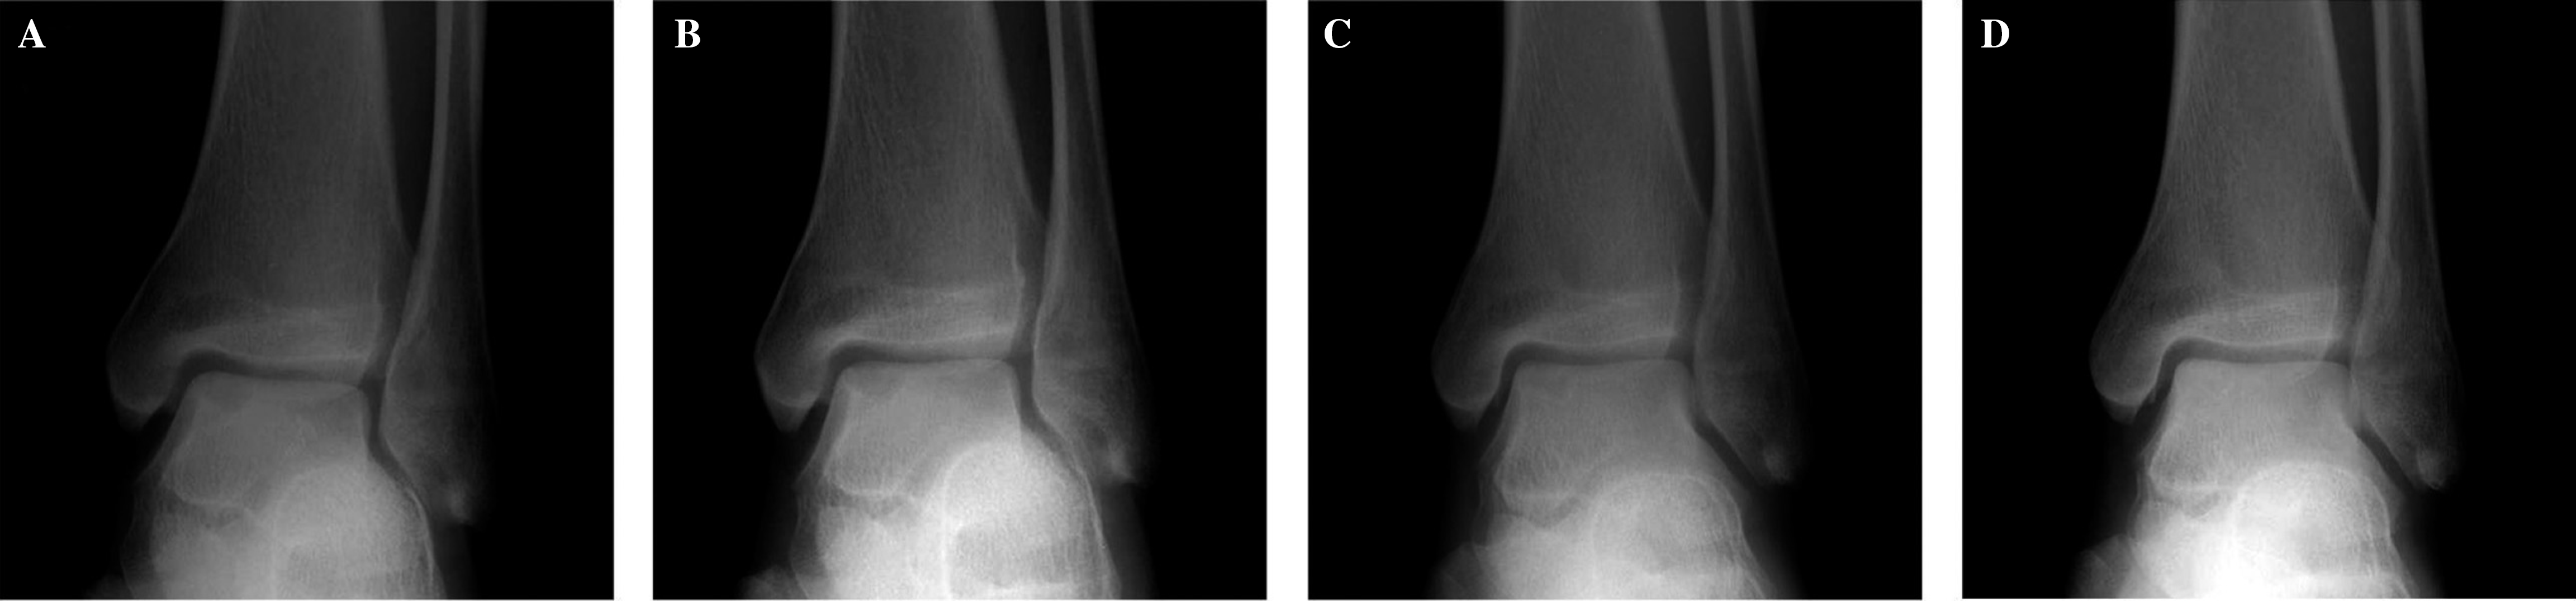
Anteroposterior radiograph before operation
DISCUSSION
Several methods have been suggested for the treatment of osteochondral defects accompanied by cysts. 10,16,17,19 The subchondral talar cysts in this study were commonly less than 1.5 cm 2 , which allowed treatments, such as microfracture or abrasion, as for osteochondral defects without a cyst. Giannini et al. 9 suggested microfracture or abrasion for defects of less than 1.5 cm 2 , and the results of these treatments have been reported as good. 14,15,26 Our results were similar in defects with a cyst and those without a cyst, indicating that the existence of a cyst does not seem to affect the clinical result after microfracture or abrasion. However, clinical results according to the size of the cyst were not fully analyzed in this study. Therefore, systemic studies should be done on the relationship between the size of the cyst and the results of operation.
We analyzed two staging systems based on MRI findings. The staging system of Anderson et al. 2 classified cystic lesions as stage IIA and described them as the progression from subchondral fracture to the formation of a subchondral cyst. The staging system of Hepple et al. 10 classified cystic lesions as stage 5 and described them as having the greatest amount of symptoms, representing the greatest therapeutic challenge and having the poorest outcomes. Except for the stage of the cystic lesion, the other stages are similar in description. Even though statistical significance could not be determined because of the small number of patients, the preoperative AOFAS score seemed to correlate with the Anderson staging system, in which the cystic lesion is classified in the early stage. Also, there was little difference between the postoperative AOFAS scores of the two staging systems.
Because surgery produced similar improvements in AOFAS scores regardless of the preoperative stage and because most of the cystic lesions were relatively small, there is a possibility that cystic lesions represent an early stage. Therefore, a new staging system that includes a cystic size factor may be needed, as well as, further studies analyzing operative treatment results according to cystic sizes larger than 15 mm.
In analyzing the radiographic results, we compared not only the widest diameter of the radiolucent lesion on radiograph but also the area of the radiolucent lesion measured on digitized radiographs using a PACS. This type of radiographic analysis is now being applied in many orthopaedic fields. 7,12,20,22 Previous studies were confined to describing cystic lesions using the widest diameter. However, cystic lesions are diverse in shape and can be round, oval, and irregular. So, using the longest diameter alone does not sufficiently represent various cystic lesions. By using a PACS, the area of an irregular lesion is easily measured. It may be more reasonable to compare preoperative and postoperative cystic lesions by CT or MRI, but these methods are difficult to apply at serial followups for all patients because of their cost. Thus, they are recommended only in complicated cases. When using the digitized picture, segmentation of the lesion is the important point. Suetens et al. 25 classified segmentation methods as manual, semi-automated, and automated and reported that semi-automated anatomical-based segmentation was more reliable than the other types. However, because we could not find the proper semi-automated segmentation computer program for digitized plain radiographs, we chose the manual segmentation method in PACS; we improve its reliability by segmentation and measurement by three independent specialists.
When comparing the area measuring method to the widest measurement, the methods correlated well with each other and demonstrated the radiographic results of arthroscopic treatment well. However, the numerical difference in area decrease was more remarkable than that of the widest diameter, 53% and 25%, respectively. Although we did not find any relationships between decrease in cystic area and increase in clinical score, two-dimensional area measuring by PACS might be more reliable than one-dimensional diameter measurements in variously shaped cystic lesions. Also, we suggest that digitized area measurements could be applied to other bony cystic lesions.
In summary, acceptable clinical results were obtained by arthroscopic treatment of osteochondral defects of the talus, in both subchondral cystic lesions and noncystic defects. This may have been related to the fact that all of the cysts were smaller than 15 mm, making it possible to use arthroscopic abrasion arthroplasty and microfracture. The increase in postoperative AOFAS scores and the decrease in cyst size indicate that subchondral cysts of the talus of less than 1.5 cm 2 (or 15 mm) can be treated by the same arthroscopic procedures used for osteochondral defects without cysts.