
Abstract
Background:
Patient-reported outcomes are increasingly used as measures of effectiveness of interventions. To make the tools more useful, therapeutic thresholds known as minimally important differences have been developed. The objective of this study was to calculate minimally important differences for the domains of the Foot and Ankle Outcome Score for hallux valgus surgery.
Methods:
The study was based on a retrospective analysis of patients newly scheduled for bunion correction surgery and completing patient-reported outcomes between October 2013 and January 2018. This study used anchor- and distribution-based approaches to calculate the minimally important difference for the instrument’s 5 domains. Confidence intervals were calculated for each approach. There were 91 participants included in the study.
Results:
Using anchor- and distribution-based approaches, the minimally important difference for the pain domain ranged from 5.8 to 10.2, from 0.3 to 6.9 for the symptoms domain, 8.3 to 10.3 for the activities of daily living domain, 7.4 to 11.1 for the quality of life domain, and from 7.0 to 15.7 for the sports and recreation domain. Small differences in the activities of daily living domain may be more clinically important for patients with better function.
Discussion:
The range of minimally important difference values for each domain indicate how the Foot and Ankle Outcome Score corresponded to bunion correction surgery. The sports and recreation domain showed considerable variability in the range of values and may be associated with the domain’s lack of responsiveness. Overall, most minimally important difference values for the domains of FAOS ranged from above 4 to below 16.
Level of Evidence:
Level III, retrospective comparative series.
Introduction
Patient-reported outcomes (PROs) are increasingly used as patient-centric measures of effectiveness of medical and operative interventions. The Foot and Ankle Outcome Score (FAOS) is a condition-specific PRO that has been validated for use among patients who have undergone bunion correction surgery.4,6,20-22,37,43,45 The FAOS has demonstrated acceptable measurement properties, including construct validity, reliability, and responsiveness, 15 for 4 of the 5 domains. Function in sport and recreational activities is the only domain that has shown little responsiveness among bunion correction patients, whereas the relevance of some of the FAOS’s items was rated low. 15 Hence, the FAOS is preferred for assessing hallux valgus outcomes over the American Orthopaedic Foot & Ankle Society Score (AOFAS) instrument. The American Orthopaedic Foot & Ankle Society has recommended the AOFAS score be discontinued 29 because of its measurement properties.2,35
Although the importance of PROs is well documented,7,12,16 their scores can be difficult to interpret and translate into clinical practice.31,40 An important barrier to broader use of PROs is the difference between a statistically significant change and a clinically important change in a PRO. Although statistical significance is notable, a statistically significant change in a PRO may be so small that it is not clinically relevant. To make PROs more useful, therapeutic thresholds known as minimally important differences (MIDs), have been developed.1,3,10,49 The MID has been accepted by clinicians and researchers as an important means of interpreting patients’ change in PROs relative to a therapeutic threshold.9,31,49 An MID is defined as the smallest change in PRO score that would likely be important or meaningful to the patient.9,31 Earlier referred to as minimal clinically important difference (MCID), 17 the MID is important to determining how patients’ PRO scores reflect the effect of treatment, both for individual patients over time and to compare between groups of patients who have undergone different treatments.9,49 There has been no guidance on the MID for the FAOS for bunion correction patients. This gap may limit the instrument’s application in clinical practice. The objective of this study was to calculate the MID for the FAOS instrument.
Methods
The study is a retrospective analysis of PROs data that were collected between October 2013 and January 2018. 37 Patients failing medical management and newly scheduled for bunion surgery were eligible for participation in the original study. Additional eligibility requirements included being at least 18 years old, living in the community (ie, not institutionalized), and being able to provide verbal and written consent (with or without assistance) in English. After consent, participants were mailed a survey package of several PROs, including the EQ5D(3L) and FAOS, to be completed and mailed back preoperatively and at 6 months postoperatively. Institutional review board approval was granted by the University of British Columbia.
Demographic and Clinical Data
Participants’ demographic and clinical data were extracted from hospital discharge data and include age at surgery, sex, and comorbidities. The analytic data set included an area-based SES measure developed from census data independent from this study, 46 based on areas’ residents’ income, education, and family size. Study participants’ characteristics were compared with nonparticipants using analysis of variance for continuous variables and chi-square tests for categorical variables.
There were 91 participants included in the study, representing a 48.5% participation rate among eligible patients, similar to other published studies.5,14 One participant did not complete the preoperative instruments, and another 5 participants had incomplete postoperative PROs. Only participants with complete data were included in the analysis. Participants were, on average, 3 years older than nonparticipants (data not shown). There were no other differences observed between participants and nonparticipants. As shown in Table 1, the study population was predominantly female (79%) with a mean age of 59.4 ± 9.4 years and no preoperative comorbidities (91.2%). Almost a quarter of the participants were categorized in the highest SES quintile, with the remaining quintiles ranging from 16% to 22%.
Descriptive Statistics of Bunion Surgery Participants.
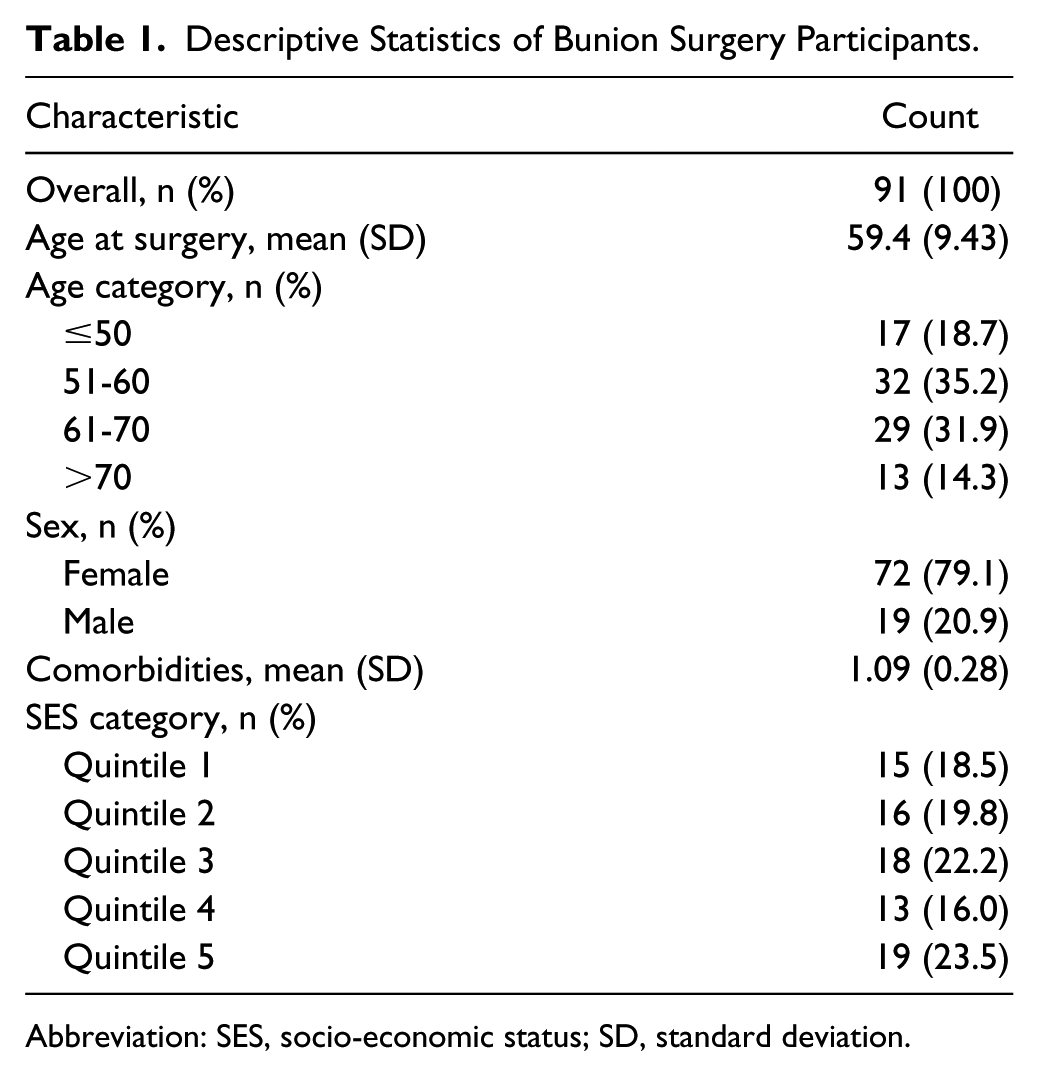
Abbreviation: SES, socio-economic status; SD, standard deviation.
Patient-Reported Outcome Instruments
The FAOS is an adaption of the Knee Injury and Osteoarthritis Outcome Score,33,34 designed to assess the patient perceptions regarding foot- and ankle-related problems. It has a total of 42 questions spanning 5 domains of foot and ankle-related health: pain (9 items), other symptoms (7 items), function in activities of daily living (17 items), function in sport and recreation (5 items), and foot- and ankle-related quality of life (4 items). Each item is scored on a 5-point Likert-type scale: none, mild, moderate, severe, and extreme problems (scored from 0 to 4, respectively). For each item, the recall period is the past week. The item scores were summed and normalized (ie, divided by the possible maximum score for the scale) into a domain score from 0 (extreme symptoms) to 100 (no symptoms). There was no overall summary measure; each domain was reported separately, 19 and as such, MIDs were also calculated for each domain separately. For any domain, if any 1 or 2 scores were missing, the missing scores were substituted with the average value for the domain. If more than 2 items were missing, no domain score was calculated. 19
The European Quality of Life-5 Dimensions Questionnaire (EuroQoL; EQ-5D[3L]) is a commonly used PRO for measuring changes in overall health-related quality of life. 41 The EQ-5D(3L) is composed of 5 domains: mobility, self-care, usual activities, pain/discomfort, and anxiety/depression. There are 3 levels within each domain: no problems, some problems, and extreme problems. The participant was asked to indicate his or her health level by selecting the most appropriate statement in each of the 5 domains. This decision resulted in a 1-digit utility value between 0 and 1—1 being perfect quality of life and 0 being quality of life as bad as death.
The EQ-5D(3L) also has a visual analog scale (VAS) to complement the 5 items. Participants indicated on a scale their health status, which ranged between 0, worst health status, and 100, perfect health status.
Calculation of MID
This study used multiple approaches for calculating the MID to determine a plausible range of values of the MID.9,49 Methods to calculate a PRO’s MID were classified into anchor- and distribution-based approaches. Anchor-based approaches compared PRO scores to an external indicator, such as a patient-reported global assessment question or change in value on another PRO (which must have had a nontrivial correlation, described as greater than 0.3). 32 For this study, the EQ-5D(3L) and its VAS were used as anchors for the FAOS domains.
For the calculation of the MID for each FAOS domain, a linear regression model was used, where the change in FAOS score was the dependent variable and the change in EQ-5D(3L) utility value was the independent variable, an approach recommended over the mean change method. 24 The MID for each domain was then calculated by subtracting the predicted mean FAOS score from the regression model when the EQ-5D(3L) utility value was set at 0, representing no change, from the predicted mean FAOS score when the EQ-5D(3L) utility score was set at 0.10, representing minimal change. The utility value of 0.10 was based on several studies reporting MID values for the EQ-5D ranging between 0.05 and 0.15 points.19,27,28,44 As the second anchor, the VAS score was now the independent variable and the MID for each domain was calculated similarly to the approaches described above. For this second anchor, a 20% threshold was used for minimal change based on other studies.18,32
Distribution-based approaches compared the change in PRO scores to a statistical measure of variability, such as the standard error or the standard deviation of the distribution. Two common distribution-based approaches were applied in this study, the half standard deviation and standard error of measurement. The half standard deviation method used 0.5 standard deviations as a representation of moderate or medium change in PROs’ scores. First devised by Cohen 8 and commonly used in sample size calculations, the MID was calculated by multiplying the PRO value’s baseline standard deviation by 0.5. There was empirical evidence demonstrating that 0.5 standard deviations was considered meaningful to patients. 26
The standard error of measurement (SEM) approach re-scaled the baseline standard deviation by the measurement error in the instrument. The SEM was the product of the standard deviation and the square root of 1 minus the reliability of the PRO
To incorporate uncertainty into MID estimates, 95% confidence intervals were calculated for each method. Most studies have not provided confidence intervals for MID values, making assessment of the estimated MIDs uncertain. In the present study, nonparametric bootstrapping with 1000 replications was used to calculate 95% bias-corrected and accelerated confidence intervals for each MID estimate without the need for distributional assumptions.
Analysis
Participants’ demographics, comorbidities, and FAOS scores were described using summary statistics. Changes between pre- and postoperative FAOS scores, in each domain, were tested with a paired t test. Floor or ceiling effects were deemed present if more than 20% of the participants achieved the worst or best possible score on any of the domains of the FAOS, 38 respectively. For each domain, MIDs were calculated using the 2 anchor-based and the 2 distribution-based approaches. The MIDs and their confidence intervals were visually contrasted to highlight differences in MID values between each approach.
Recent work on MIDs has demonstrated that MID values may vary based on a patient’s baseline state and may be a source of variation. 3 Therefore, the present study also evaluated whether the MID values were conditional on preoperative FAOS scores. Preoperative FAOS scores, for each domain, were divided into quartiles, with quartile 1 representing the lowest preoperative FAOS scores. To test for a possible dependence of preoperative FAOS scores on MID values, an interaction effect between each quartile group and the anchor was included in the linear models. Lastly, to address the possibility of differences in the MID values of the FAOS attributable to patients’ sex, 3 sex-specific MID values were also calculated by including an interaction effect between the anchor and sex variable in the linear regression models.
An alpha level of 5% for statistical significance was applied for reporting all statistical analyses. All analyses were conducted using R version 3.5.1. 30
Results
Table 2 summarizes participants’ preoperative and 6-month postoperative FAOS scores in each domain, the EQ-5D(3L) utility values, and its VAS scores. No floor or ceiling effects were observed in the domains of the FAOS. Participants reported statistically significant improvements in pain (11 points, P < .001), activities of daily living (10 points, P < .001), sports and recreation (8 points, P = .01), and quality of life domains (20 points, P < .001). The symptoms domain did see improvement, but the gain was not statistically significant (2.7 points, P = .12).
Summary Statistics of Patient-Reported Outcome Scores at Preoperative and Postoperative Time Points for the EQ-5D Utility Values and the 5 Domains of the Foot and Ankle Score. a
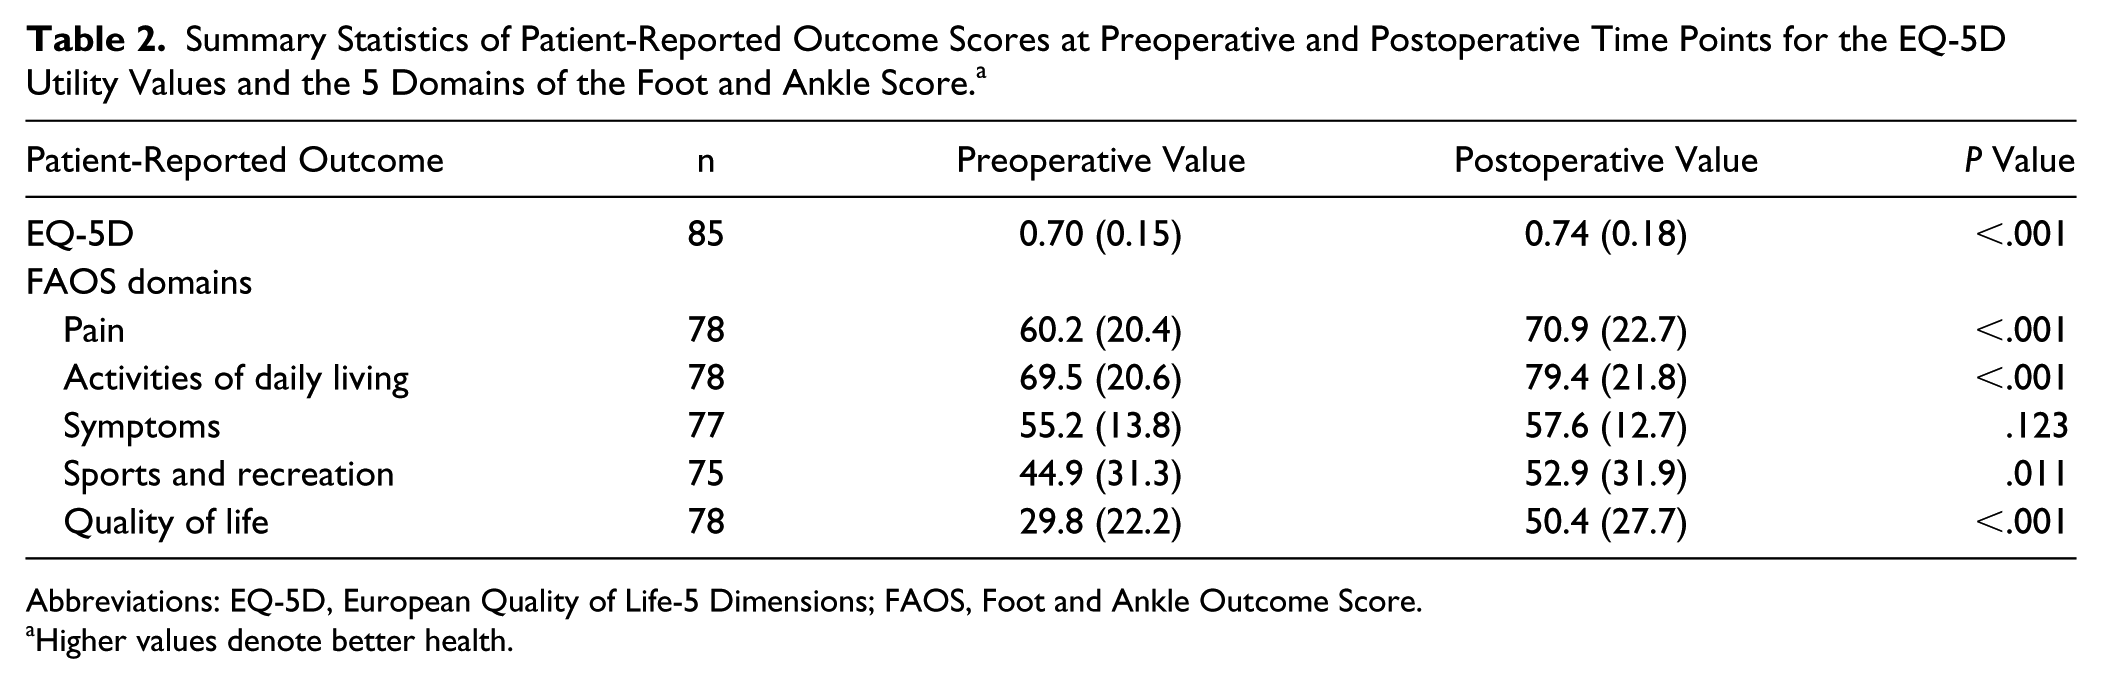
Abbreviations: EQ-5D, European Quality of Life-5 Dimensions; FAOS, Foot and Ankle Outcome Score.
Higher values denote better health.
The utility value of the EQ-5D(3L) also improved from 0.70 to 0.74 (P < .001). All domains of the FAOS met the required correlation threshold to use the EQ-5D(3L) as an anchor (r > 0.3). However, for the VAS anchor, the pain and symptoms domains of the FAOS did not meet the correlation threshold (r = 0.27 and 0.02, respectively).
The MID values for each domain of the FAOS is summarized in Figure 1. Using anchor- and distribution-based approaches, the MID values for the pain domain ranged from 5.8 to 10.2, out of a maximum of 100, the symptoms MID values ranged from 0.3 to 6.9 out of 100, activities of daily living MID values ranged from 8.3 to 10.3 out of 100, and lastly, the quality of life MID values ranged from 7.4 to 11.1 points out of 100. The domain with the most substantial variation among anchor- and distribution-based approaches was the sports and recreation domain, with the MID values ranging from 7.0 to 15.7 points out of 100. Table 3 contrasts the estimated MID values using the 4 approaches for each domain of the FAOS.
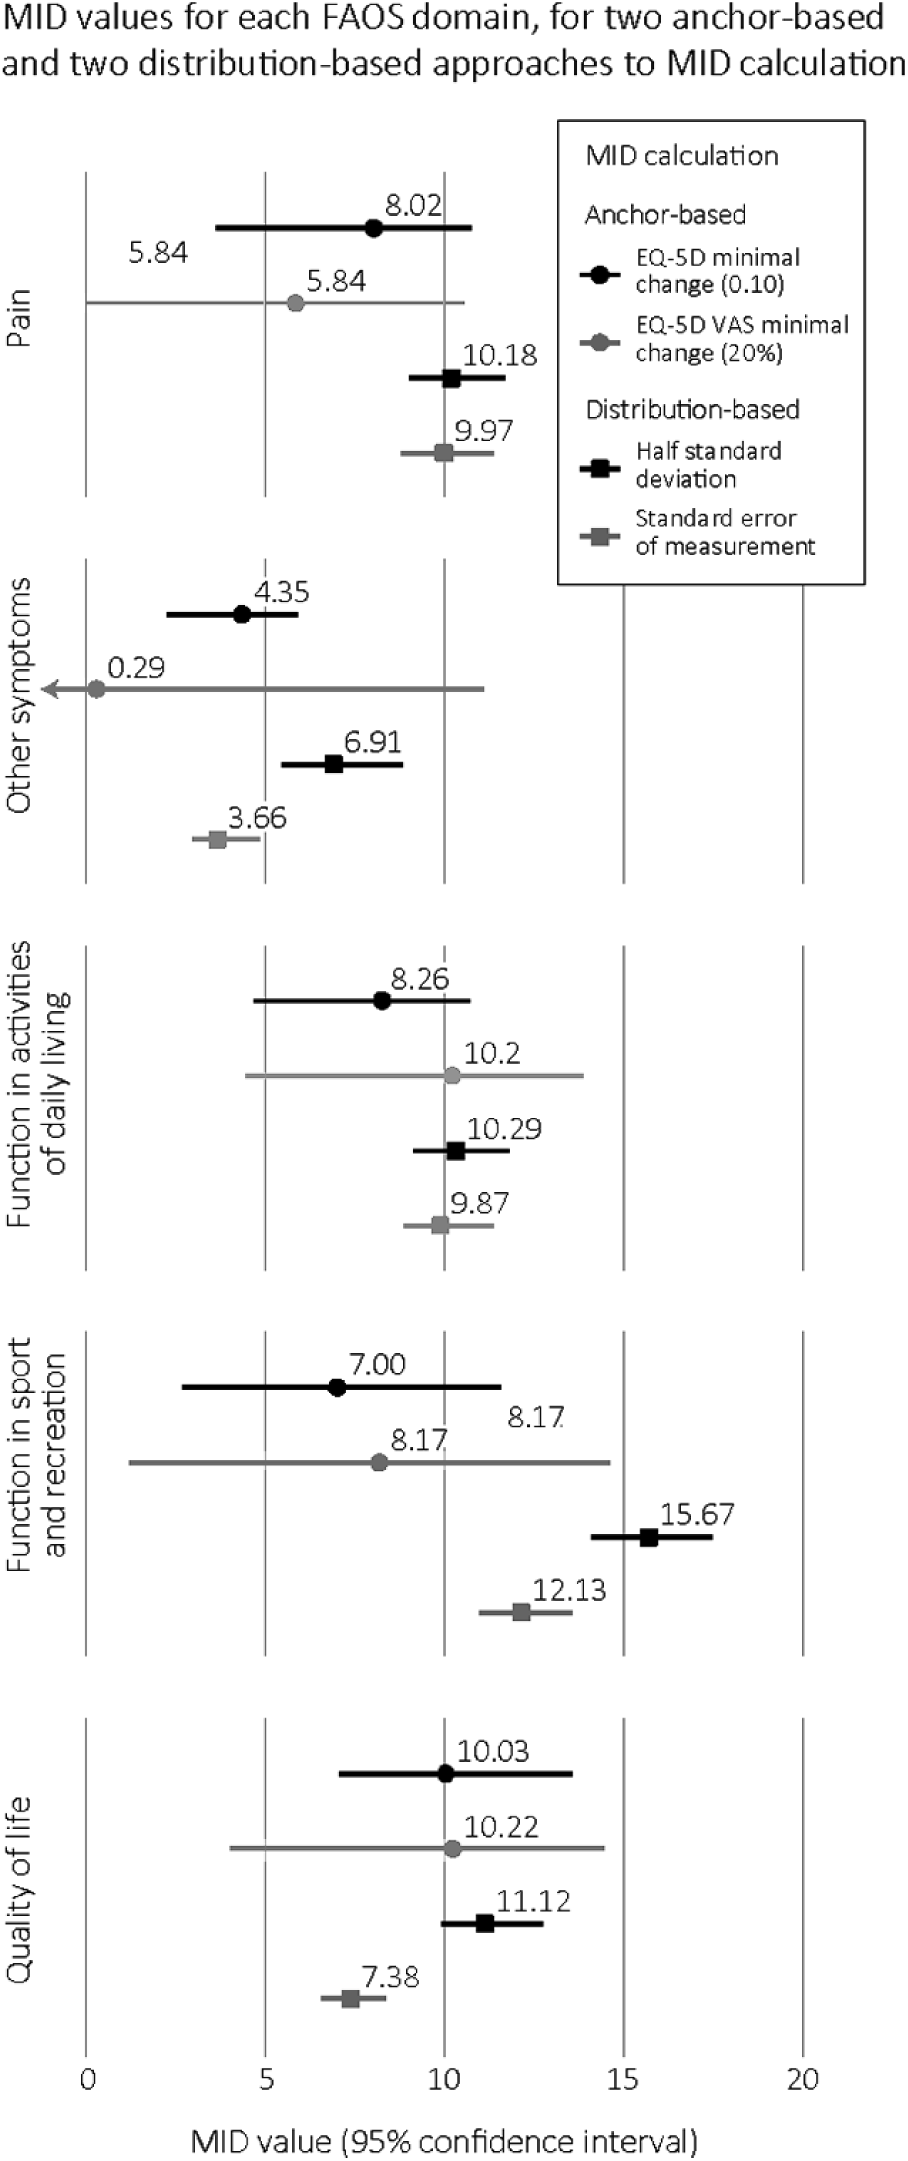
Minimally important difference values calculated with several scenarios and 95% confidence intervals for each domain of the FAOS. FAOS, Foot and Ankle Outcome Score; MID, minimally important difference; EQ-5D, European Quality of Life-5 Dimensions; VAS, visual analog scale.
Minimally Important Difference Values and 95% Confidence Intervals for Each Domain of the FAOS.
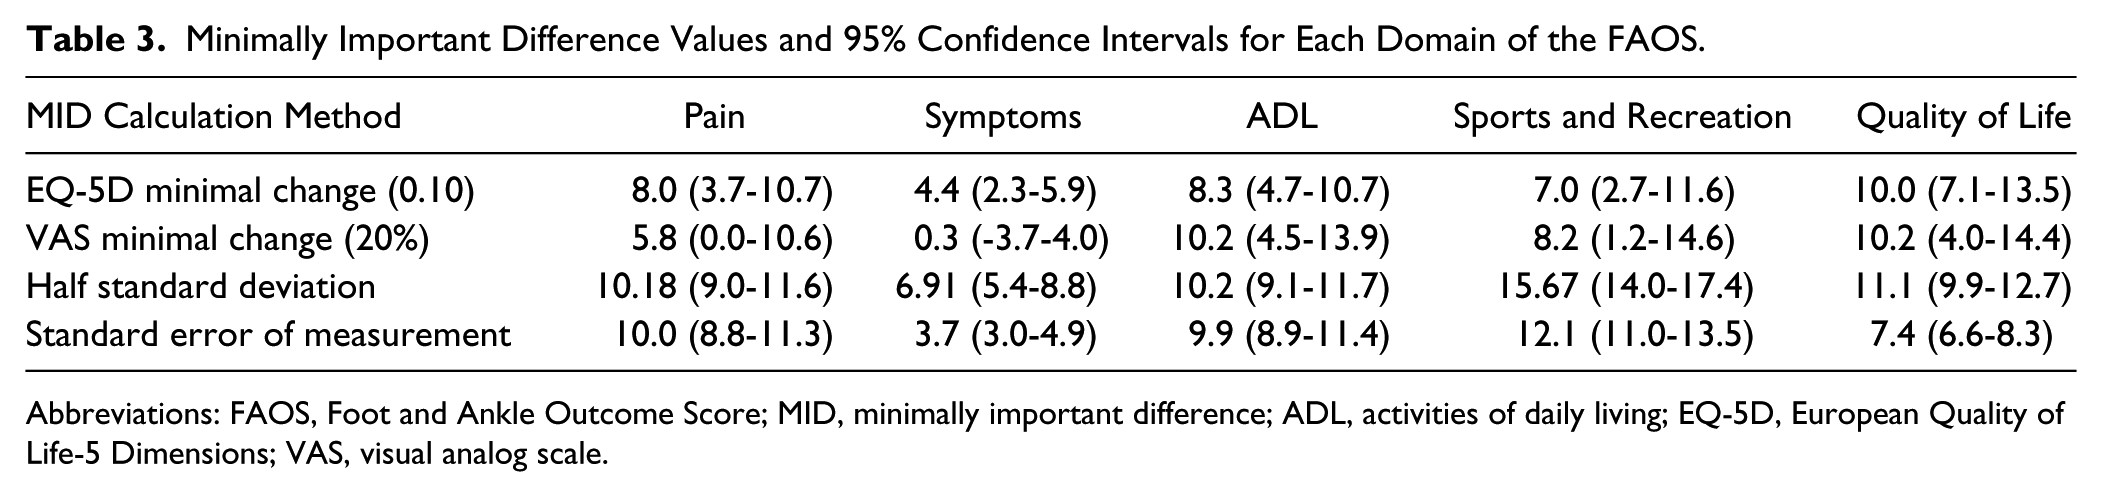
Abbreviations: FAOS, Foot and Ankle Outcome Score; MID, minimally important difference; ADL, activities of daily living; EQ-5D, European Quality of Life-5 Dimensions; VAS, visual analog scale.
Across anchor- and distribution-based MID calculation methods, only the sports and recreation domain exhibited a sex-based difference in MID value (Table 3). On average, males had a smaller MID for sports and recreation value compared with females, although the sample size of males was small (n=19).
Lastly, the present study explored whether the level of preoperative FAOS score had an impact on anchor-based MID values (Tables 4 and 5). Stratified by preoperative FAOS scores based on quartile groups, MID values were not different for pain, symptoms, sports and recreation, and quality of life domains. The activities of daily living domain, however, for which higher preoperative values were associated with lower MID values (P < .05), was impacted by the preoperative scores of the FAOS. In other words, a small difference in the activities of daily living domain may be more clinically important for patients with better function in activities of daily living (a higher score) preoperatively than for patients with impaired activities of daily living (low preoperative score).
Summary Statistics of Sex-Based Differences in Anchor-Based (EQ5D) Minimally Important Difference Values of the 5 Domains of the Foot and Ankle Score.
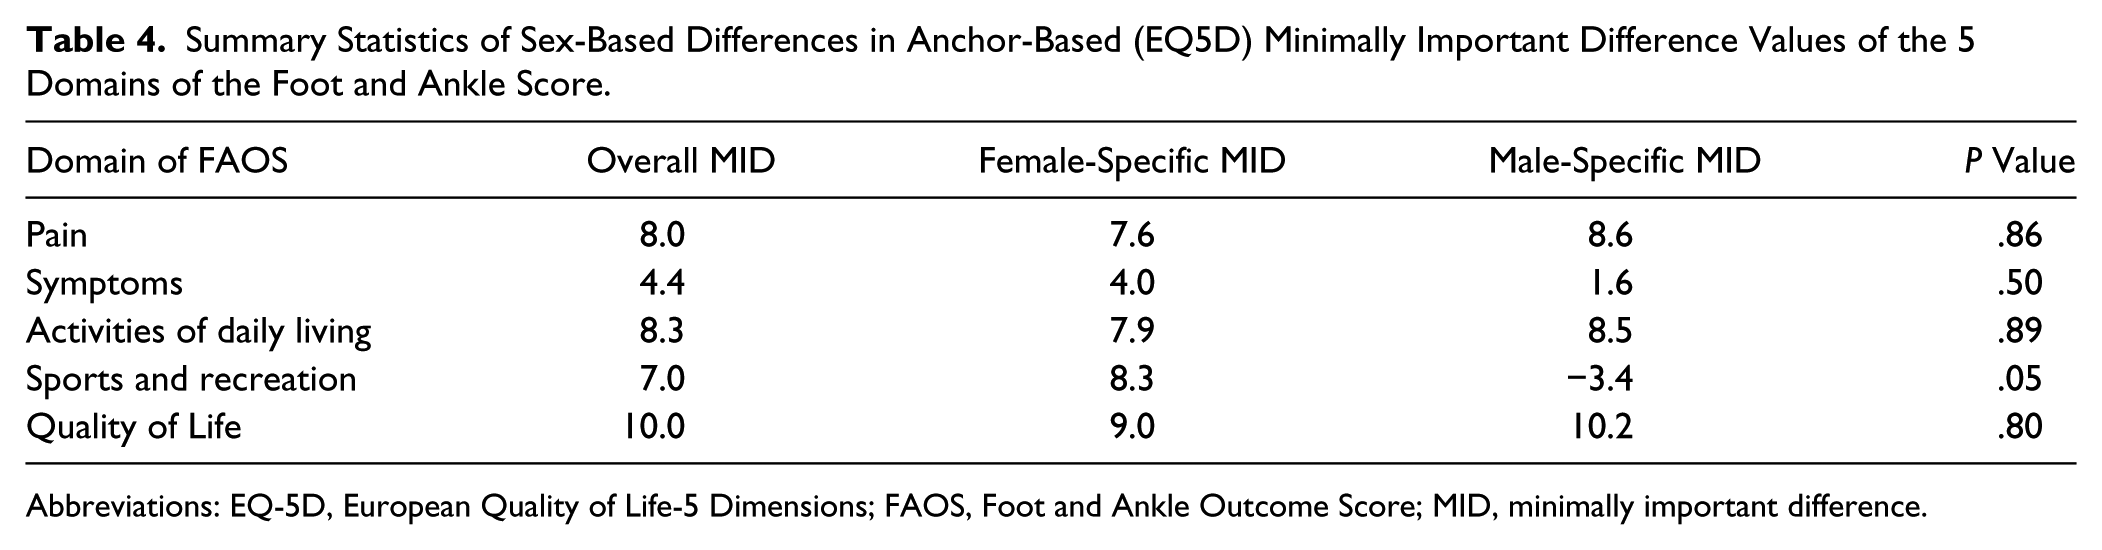
Abbreviations: EQ-5D, European Quality of Life-5 Dimensions; FAOS, Foot and Ankle Outcome Score; MID, minimally important difference.
Preoperative Foot and Ankle Outcome Score and Minimally Important Difference.
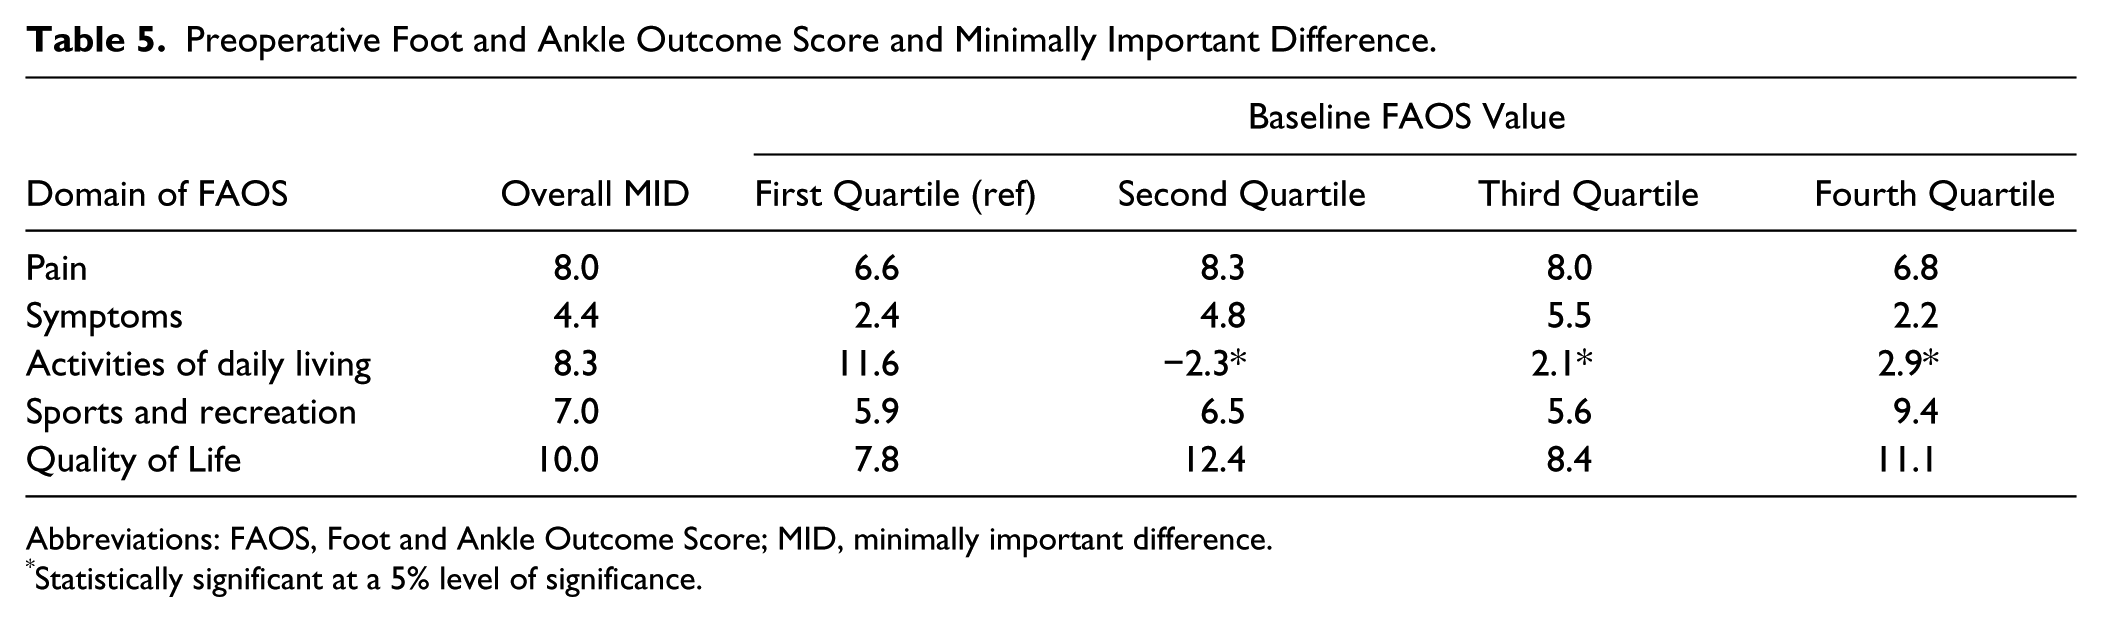
Abbreviations: FAOS, Foot and Ankle Outcome Score; MID, minimally important difference.
Statistically significant at a 5% level of significance.
Discussion
This study calculated a range of MID values for each domain of the FAOS among bunion correction operative patients based on a combination of anchor- and distribution-based methods: pain = 5.8 to 10.2, symptoms = 0.3 to 6.9, activities of daily living = 8.3 to 10.3, sports and recreation = 7.0 to 15.7, and quality of life = 7.4 to 11.1. The range of MID values for each domain of the FAOS in this study should provide clinicians and researchers a better idea of how bunion correction surgery corresponds to changes in the FAOS.
For the pain domain, the range of MID values were within 4.4 points of each other. It is important to note that the pain domain did not correlate well with VAS anchor (r = 0.27), and the MID value produced from the VAS anchor was widening the range. Given that the VAS response is patients’ self-assessment of their overall health on the day the questionnaire is administered, and does not correlate with the foot-specific questions, then excluding the VAS value from the MID range for the pain domain seems reasonable. If excluding the MID value for the pain domain from the VAS scale, the range of MID values was within a narrow 2.2 points (5.8 to 8.0). Similarly, the MID values for the symptoms domain ranged from 0.3 to 6.9, a difference of 6.6 points, however, the VAS anchor again was not correlated at all with this domain (r = 0.02); and we recommend excluding this MID from the range. This exclusion produces a range of MID for the symptoms domain from 3.7 to 6.9 using 1 anchor- and 2 distribution-based methods. On the other hand, the ranges of MID values for the domains of activities of daily living and quality of life were quite small. The range of MID values for activities of daily living was from 8.3 points to 10.3 points, a mere difference of 2 points between anchor- and distribution-based methods, whereas the MID value for quality of life domain ranged from 7.4 to 11.1, a difference of less than 4 points.
The sports and recreation domain showed considerable variability in the range of MID values (range: 7.0-15.7). This finding may be linked with FAOS’s validation study noting that this domain lacks responsiveness, 6 going so far as to recommending excluding the sports and recreation domain altogether. 6 In this study, one wonders if the relatively short postoperative follow-up of 6 months further negatively impacted the responsiveness of the sports and recreation domain in that patients may not have had sufficient time to resume full participation in sports and recreational activities.
Although some of the ranges for the point estimates for the MID values were small, there was some uncertainty in the variability of MID values based on bootstrapped confidence intervals. The uncertainties were widest for the regression-based methods indicating some sampling variation and imprecision in the calculated MID values, likely because of the relatively small sample size. Although there is no clear guidance on a minimum sample size for generating MIDs, studies on measurement properties of instruments have shown that greater than 100 patients is considered excellent 39 ; future studies should corroborate the current findings with larger samples. On the other hand, the uncertainties associated with distribution-based methods were small, as expected, as these methods are independent of the sample size and reflect the variability in the sample itself. 42
Other studies have reported that MID values are influenced by preoperative scores and patient characteristics.3,13,36 This study found limited evidence for sex-based differences in MID estimates. However, this study consisted of mostly females (79%), potentially rendering sex-specific effects difficult to identify. Future studies with larger sample sizes are needed to further assess the effect of sex on differing MID values for the FAOS.
Measuring whether the MID was the same irrespective of patients’ preoperative scores found that only the activities of daily living domain was differentially affected. This finding should provide some confidence that the MID in the other 4 domains can be applied irrespective of patients’ preoperative scores. However, users of these results should bear in mind that the lack of a preoperative effect across these domains could be attributable to type II errors (ie, false negative) as stratifying on preoperative scores is effectively subsetting the data into separate parts, and it is known that subsetting lowers the power and leads to imprecision in the findings.11,17 In the activities of daily living domain, however, patients with higher preoperative scores corresponded to a lower MID value. This finding suggests that perhaps patients see even small changes in impairment around activities of daily living as clinically relevant and it is an important factor in clinical management.
At 6 months postoperatively, participants’ average improvement in the domains of pain (11 points; MID 5.8-8.0), and quality of life (20 points; MID: 7.4-11.1) exceeded the largest MID values. For activities of daily living, the improvement of 10 points was greater than the 2 of the 4 MIDs (MID: 8.3-10.3). The quality of life domain has been shown to be the most relevant to bunion correction patients, and the 20-point improvement is nearly double the upper range of the MID value. This strongly suggests that the average participant saw a clinically meaningful improvement in foot function in 3 domains of foot function 6 months postoperatively.
There were some limitations to the present study. First, the MID values were limited to the present study’s population of bunion correction operative patients. These results do not reflect the MID of patients receiving medical management of their bunion. Also, while the study did send mail and telephone reminders to ensure maximum participant retention which resulted in a reasonable participation rate and no important differences between participants and non-responders, the risk of sampling bias cannot be ignored. Second, the postoperative follow-up time point was 6 months, and as patients’ MIDs may change over a longer follow-up time point, the current results should not be interpreted beyond the evaluated 6 months of follow-up. Finally, future studies of the FAOS should include a global assessment scale to use as an anchor to complement this study’s application of common methods.10,32,47
In conclusion, this study used multiple approaches to produce a range of plausible MID values for each domain of the FAOS. Although 1 single MID value for each domain was not identified, the results established, for the first time, a plausible range of MID values across all FAOS domains within which a meaningful change likely occurs. Overall, most minimally important difference values for the domains of FAOS ranged from above 4 to below 16. The range of MID values may guide clinicians in better interpretation of the FAOS, to make more meaningful clinical decisions regarding patient management, and more patient-centric evaluations of interventions in the bunion operative population. Researchers may also use these findings to estimate appropriate sample sizes when designing studies to detect meaningful changes in the FAOS.
Supplemental Material
FAI831392-ICMJE – Supplemental material for Minimally Important Difference in the Foot and Ankle Outcome Score Among Patients Undergoing Hallux Valgus Surgery
Supplemental material, FAI831392-ICMJE for Minimally Important Difference in the Foot and Ankle Outcome Score Among Patients Undergoing Hallux Valgus Surgery by Sameer Desai, Alexander C. Peterson, Kevin Wing, Alastair Younger, Trafford Crump, Guiping Liu, Andrea Veljkovic, Murray Penner and Jason M. Sutherland in Foot & Ankle International
Footnotes
Acknowledgements
This study was funded by the Canadian Institutes for Health Research (CIHR) and in-kind support of Vancouver Coastal Health (VCH) Authority. The last author is a Scholar of the Michael Smith Foundation for Health Research (MSFHR). CIHR, VCH, and MSFHR had no role in developing the methods, data analyses, interpreting the results, or manuscript preparation.
Declaration of Conflicting Interests
The author(s) declared no potential conflicts of interest with respect to the research, authorship, and/or publication of this article. ICMJE forms for all authors are available online.
Funding
The author(s) disclosed receipt of the following financial support for the research, authorship, and/or publication of this article: Government of Canada: Canadian Institutes of Health Research (CIHR) and Institute of Health Services and Policy Research.
References
Supplementary Material
Please find the following supplemental material available below.
For Open Access articles published under a Creative Commons License, all supplemental material carries the same license as the article it is associated with.
For non-Open Access articles published, all supplemental material carries a non-exclusive license, and permission requests for re-use of supplemental material or any part of supplemental material shall be sent directly to the copyright owner as specified in the copyright notice associated with the article.