
Abstract
Background:
Weakness of evertor strength is controversial in chronic ankle instability (CAI). Ankle evertor muscles are attached to the toe joints as well as to the metatarsal bone. Therefore, it is necessary to consider toe joint position for the measurement of evertor strength. The purpose of this study was to compare ankle evertor strength and muscle activity during eversion with and without toe flexion (TF) in individuals with CAI and individuals in a healthy group.
Methods:
Fifteen subjects with CAI and 15 healthy subjects participated in this study. Isometric ankle evertor strength and muscle activity of the peroneus longus (PL), peroneus brevis (PB), and extensor digitorum longus (EDL) were measured during eversion with and without TF.
Results:
The results indicated a significant interaction effect in evertor strength (P = .03) and no significant interaction effect on EMG of the PL (P = .08), PB (P = .12), and EDL (P = .28). However, measurements of muscle activity of the PL and PB between eversion with and without TF revealed a significant difference in the CAI group (P < .01) and no significant difference in the healthy group (PL: P = .07; PB: P = .13).
Conclusion:
The results indicated that subjects with CAI had increased EDL compensation and reduced selective activation of the PL and PB during eversion.
Clinical Relevance:
Our findings suggest that clinicians should consider the activation of EDL when training the evertor of patients with CAI.
Keywords
Introduction
Lateral ankle sprain is one of the most common musculoskeletal injuries that occur in physically active people, such as athletes.5,9,10,18,20 After the initial ankle sprain, some patients have persisting symptoms such as pain, swelling, ankle dysfunction, feeling of the ankle “giving way” and repetitive sprain.9,16-18 It is called chronic ankle instability (CAI) if these symptoms persist for more than a year after the initial injury.10,11,17 Previous research has shown that a significant percentage of people who have experienced ankle sprain develop CAI.4,5,9
Several reasons for the progression of lateral ankle sprain to CAI have been hypothesized. Authors of previous research suggested that the functional instability caused by the alteration of sensorimotor joint control after injury is the major contributing factor of progression to CAI.2,5,18,20 Hertel reported that functional instability may manifest as impaired balance, deficit of joint position sense, and ankle muscle weakness. 5 As ankle sprains are caused by excessive ankle inversion, many researchers have focused on the ankle evertor strength of CAI patients. 19 However, the results of studies on the ankle evertor strength of CAI patients are still conflicting. Donnelly et al 4 reported that the strength of peroneus longus (PL) and peroneus brevis (PB) of patients with CAI was decreased in both eversion in neutral and plantarflexion position compared to the healthy control group. Similarly, Willems et al 20 also reported a combination of evertor muscle weakness and diminished proprioception in CAI subjects. However, several other studies reported that there is no difference in evertor strength between CAI patients and individuals from a healthy control group.17-19
Muscles that cross the subtalar joint laterally can evert the foot at the subtalar joint. 11 The prime movers of ankle eversion are the PL and PB.4,13 The concentric actions of the PL and PB are a combination of plantarflexion and eversion of the ankle, as the PL and PB cross the ankle joint posteriorly and laterally. 13 Also, eccentric contraction of the PB resists the inversion moment, thereby preventing excessive inversion during functional tasks.4,16 The extensor digitorum longus (EDL) is another muscle located in the lateral compartment of the lower leg. 13 The EDL crosses the ankle joint anterolaterally, which courses from the proximal anterior fibula to the dorsal surface of toes 2-5. 13 Although the main function of the EDL is ankle dorsiflexion and toe extension, this muscle can act as a synergist of ankle eversion because it crosses the subtalar joint laterally. 13
If the agonist muscle is weakened because of excessive stretch or injury, the synergistic muscle becomes more dominant. 15 The excessive activation of a synergist and decreased activation of the prime mover can cause muscle imbalance. 15 Altered movement patterns due to muscle imbalance may lead to abnormal stress in the joint. 15 Therefore, dissociation of the agonist from the synergist in strength measurements and muscle training is an important factor for rehabilitation of musculoskeletal disorders. In patients with CAI, excessively lengthened or weakened PL and PB due to mechanical injury may lead to compensatory activation of the EDL. Although many studies have investigated the evertor muscle in patients with CAI, to our knowledge, no studies have determined whether inhibition of the EDL can affect evertor strength and muscle activity. Therefore, the purpose of this study was to compare the ankle evertor strength and muscle activity of the PL, PB, and EDL in eversion with and without toe flexion (TF) in individuals with CAI and individuals in a healthy group. The hypothesis of this study was that eversion with TF in the CAI group would decrease ankle evertor strength, increase EDL muscle activity, and decrease muscle activity of PL and PB compared to eversion without TF and that evertor strength and muscle activity in eversion with and without TF would show no significant difference in the healthy group.
Materials and Methods
Participants
This study was a case–control study. Fifteen subjects with CAI (men: 9, women: 6) and 15 healthy control individuals (men: 10, women: 5) participated in this study. The sample size was calculated using the G*Power 3.0 program (Franz Faul, Kiel University, Kiel, Germany) based on pilot study data including 3 subjects in each group. As a result of a priori analysis with a power of 0.8, set at α= .05, and an effect size of 1.09, at least 8 subjects were required for each group. For sufficient sample size, 15 subjects were recruited to each group. In addition, to determine if this sample size had sufficient power, a post hoc analysis was performed using a G*Power program. Post hoc analysis with an effect size of .44, total sample size of 30, and α of .05 showed a high power of .99. Those subjects recruited to the CAI group had their first ankle sprain longer than 1 year ago, had not injured their ankle within a 6-week time frame immediately prior to the experiment, had received a score of <85% on the Foot and Ankle Ability Measure Sports scale, and had a score >11 on the Identification of Functional Ankle Instability scale. 4 Individuals recruited to the healthy group had never experienced an ankle sprain. In addition, we excluded individuals with neurologic disorders, sensorimotor dysfunction, or lower extremity surgery from both groups. Characteristics of subjects are described in Table 1. Individuals who decided to participate voluntarily were recruited through a local flier. Prior to proceeding with the study, we explained to the participants the detailed procedure of the study and received written informed consent for each to participate in the study. This study was approved by our institutional review board.
Participant Demographic Information. a
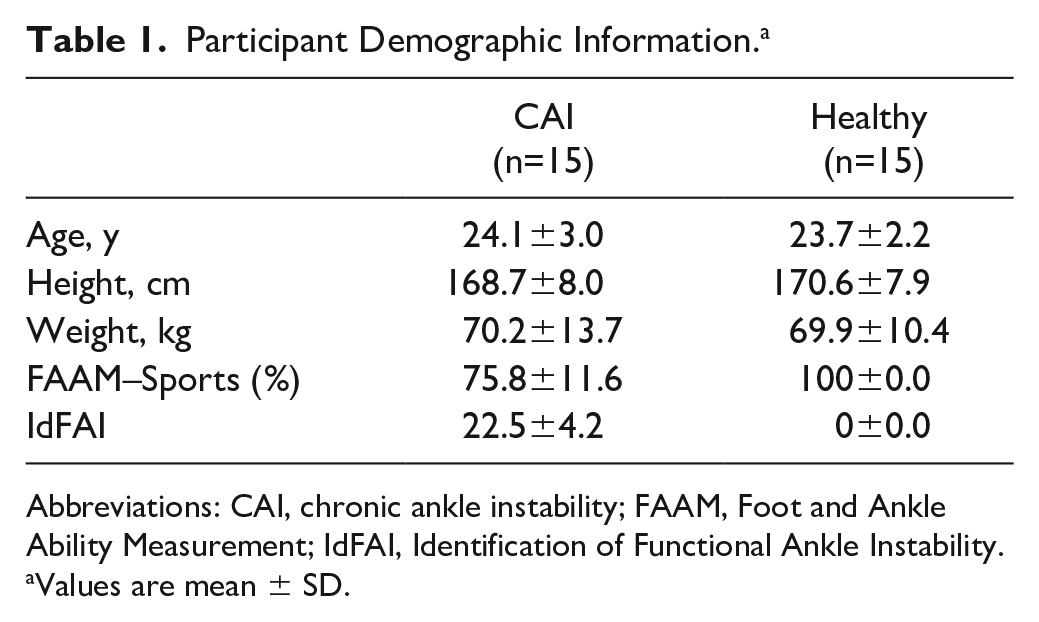
Abbreviations: CAI, chronic ankle instability; FAAM, Foot and Ankle Ability Measurement; IdFAI, Identification of Functional Ankle Instability.
Values are mean ± SD.
Instrumentation
Strength measurements
The Smart KEMA strength sensor (KOREATECH, Inc, Seoul, Korea) was used to measure ankle evertor strength. 1 This sensor measures the tension that occurs when being pulled from both ends. The size of this sensor is 65 (width) by 83 (length) by 28 (thickness) mm and weighs 110 g (Figure 1A). The 5-cm-width strap was attached to 1 end of the sensor applied to the subject’s distal end of the metatarsal bone. At the other end of the sensor, a length-adjustable nonelastic belt was attached to a fixed point on the floor.1,8 An adsorber was attached firmly to the floor during the measurement and served as a fixing point. The adsorber used in this study consisted of 3 adsorption pads with a vertical adsorption force of 150 kg (Figure 1B). The strength data were collected at a sampling frequency of 10 Hz. The measured data were transmitted to the tablet-based Smart KEMA application (KOREATECH, Inc) via Bluetooth. 7 The Smart KEMA application is an android software that can show the tension data in real time and can store and analyze the data. The Smart KEMA strength sensor has good to high intra- and inter-rater reliability (ICC3,1 >0.85, ICC2,1 >0.85).1,8
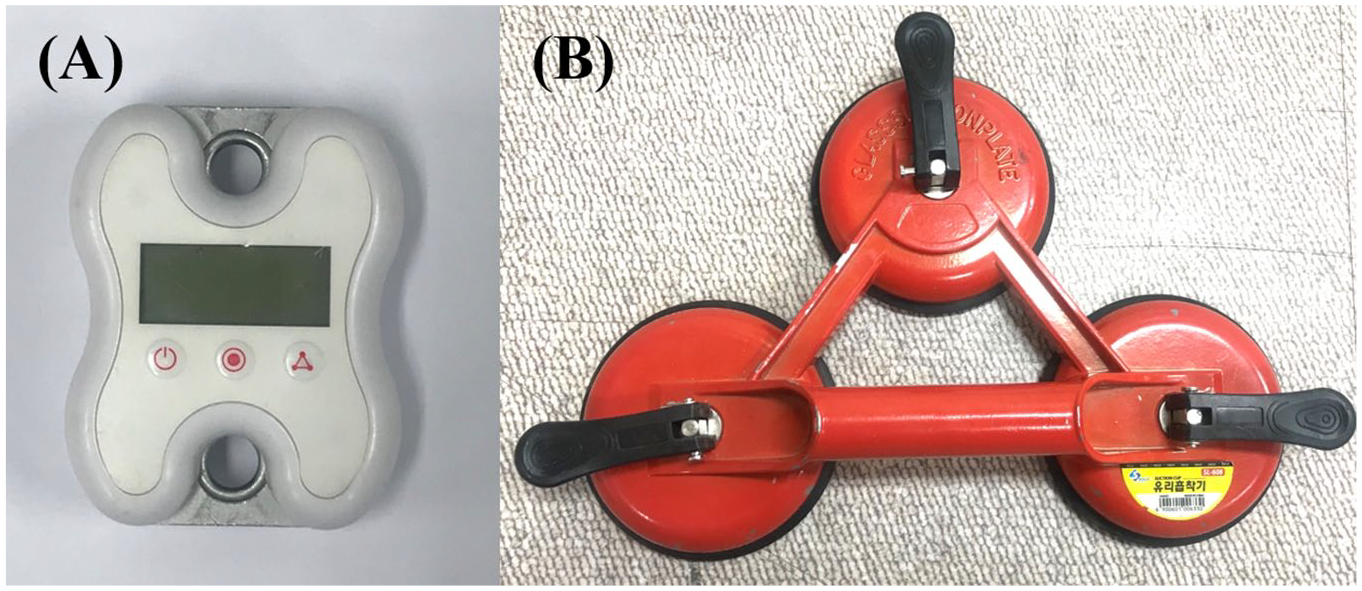
Strength measurement sensor and fixing point: (A) the Smart KEMA strength sensor, and (B) the adsorber.
Surface electromyography
Surface electromyography (EMG) was used to determine the muscle activity of the PL, PB, and EDL, which contributed to ankle eversion. Bipolar Ag/AgCl disposable electrodes were attached parallel to the muscle fibers. For the PL and PB, electrodes were attached on the lateral lower leg, distal to the fibular head at one-fourth and three-fourths of the fibula length, respectively. 4 For the EDL, the electrodes were attached to the anterolateral part of the distal lower leg where the muscle belly was palpated during toe extension.12,14 To minimize between the peroneal muscles and EDL, we confirmed there was no increase in muscle activity of PL and PB during toe extension and there was no increase in EDL muscle activity during plantarflexion and eversion. Prior to attaching the electrodes, the skin was shaved and disinfected with alcohol. Raw data were transmitted wirelessly from the transmitter to the desktop DTS EMG system (Noraxon, Inc, Scottsdale, AZ) at a sampling frequency of 1000 Hz.
Procedure
The subjects’ ankle evertor strength and muscle activity of the PL, PB, and EDL during ankle eversion, with and without TF, were measured in the neutral ankle position (Figure 2). The neutral position was set at 0 degrees and the investigator confirmed the ankle position using a standard goniometer in the starting position. 4 For the CAI group subjects, measurements were taken from the injured ankle, and for the healthy group subjects, measurements were taken from the dominant side ankle. The dominant side was the preferred leg for kicking a ball. 19 For the measurement, the subjects were asked to lie on their opposite sides to that of the leg to be measured. In that position, subjects were asked to bend their hip and knee to the front to allow half of the foot to be off of the table, while the other leg remained straight. At this point in the procedure, a low pillow was placed under the knee to prevent rotation of the pelvis. The strap of the strength sensor was applied to the distal end of the metatarsal, and the opposite side of the sensor was fixed to the absorber on the floor by the belt. The investigator fixed the subject’s distal tibia manually to prevent tibial external torsion and instructed the subject to evert the ankle with maximum force (Figure 3). To measure evertor strength in eversion with TF, subjects were asked to bend their toes slightly and instructed to maintain the TF during the measurement. To measure the strength of all subjects in the same manner, the tension of the sensor at the starting position was set equally for each subject. Because the strength sensor used in this study was a tensiometer, the tension in the starting position could have affected the measurement. Therefore, the initial tension was determined to be 3 kgf to minimize the effect on the ankle evertor strength by referring to the criteria of the previous study and the results of the pilot study. 8 In the starting position, the investigator maintained the ankle of the subjects in a neutral position and adjusted the length of the belt by the investigator so that the tension at the sensor was 3 kgf. Before starting the measurement, subjects practiced the movement to familiarize themselves with ankle eversion with and without TF. Evertor strength measurements were started after 5 minutes of rest after practice. Order of the measurement position (with and without TF) was randomized by www.randomization.com. Subjects performed ankle eversion with maximum force for 5 seconds, and each position was measured twice. Subjects rested for 3 minutes between each position to prevent muscle fatigue.
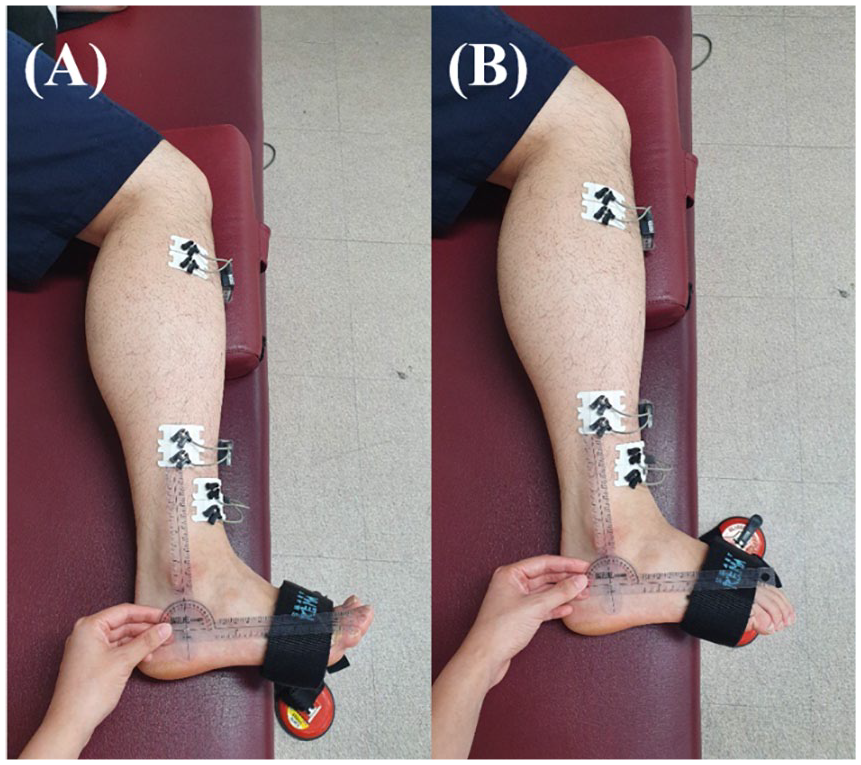
Ankle and toe positions while measuring the ankle evertor strength, and the location of electrodes for electromyography of the peroneus longus, peroneus brevis, and extensor digitorum longus. (A) Eversion without toe flexion, and (B) eversion with toe flexion.
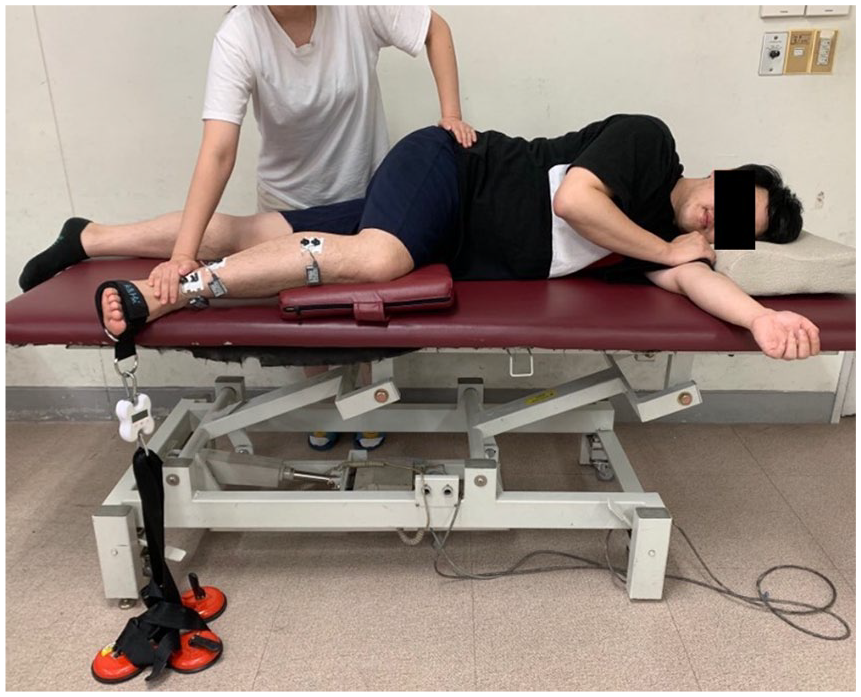
Ankle evertor strength measurement position and positioning of the Smart KEMA strength sensor and EMG sensor. EMG, electromyography.
Data Analysis
Ankle evertor strength
The ankle evertor strength (kgf) was collected over a 5-second period, and the average of the middle 3 seconds was processed. The strength data were divided by the subject’s body weight (BW) for normalization. 4
Surface electromyography
EMG data of the PL, PB, and EDL were collected during the ankle evertor strength measurement, and collected EMG data were filtered using the Myoresearch-XP 1.08 Master Edition (Noraxon, Inc) software with 10 to 500 Hz, and root mean square (RMS) values were calculated using a 150-ms moving window. The mean value of the middle 3 seconds of each 5-second period was calculated. RMS values were normalized to the maximal voluntary isometric contraction (MVIC) of each muscle. 4 For PL and PB MVIC, the subject’s ankle was placed in the plantarflexion and eversion position, and the investigator applied resistance in inversion and dorsiflexion. 3 For the EDL MVIC, the subject’s ankle was placed in the dorsiflexion and toe extension position, and the investigator applied resistance in the direction of plantarflexion and TF. 3 The subject contracted the muscle with maximum force to maintain ankle position. Each muscle MVIC value was measured twice, each time over a 5-second period, and the mean value of the middle 3 seconds was calculated. The average of 2 measurements was used as the MVIC value.
Statistical analysis
A normal distribution of data was confirmed using a Kolmogorov-Smirnov test. The intraclass correlation coefficients (ICCs) with 95% confidence intervals (CIs) were used to confirm the reliability between the 2 strength measurements. The ICC values are 0.5 to 0.69 for moderate, 0.7 to 0.89 for high, and >0.9 for very high. 8 Next, the 2-way mixed model analysis of variance was used to determine statistical differences of the strength and EMG data between the groups (CAI vs Healthy) and factor (with vs without TF). The level of significance was set at P equal to .05. If any significant interaction effect was observed between groups and factor, the simple effect was compared by paired t test or independent t test using Bonferroni corrections (P = .05/4 = .013). We also used a paired t test to identify any differences in the muscle activity of the PL, PB, and EDL during eversion with and without TF for each group (P = .05). Statistical analyses were conducted using the Statistical Package for Social Science, version 25.0 (IBM Corp, Armonk, NY).
Results
ICC values with 95% CIs of the evertor strength measurement for each measurement posture are reported in Table 2. The ICCs were “very high” in all measurements except for eversion with TF in the healthy group, which was “high” at 0.84.
Intraclass Correlation Coefficients (ICCs) and 95% Confidence Intervals (CIs) of Evertor Strength Measurements.
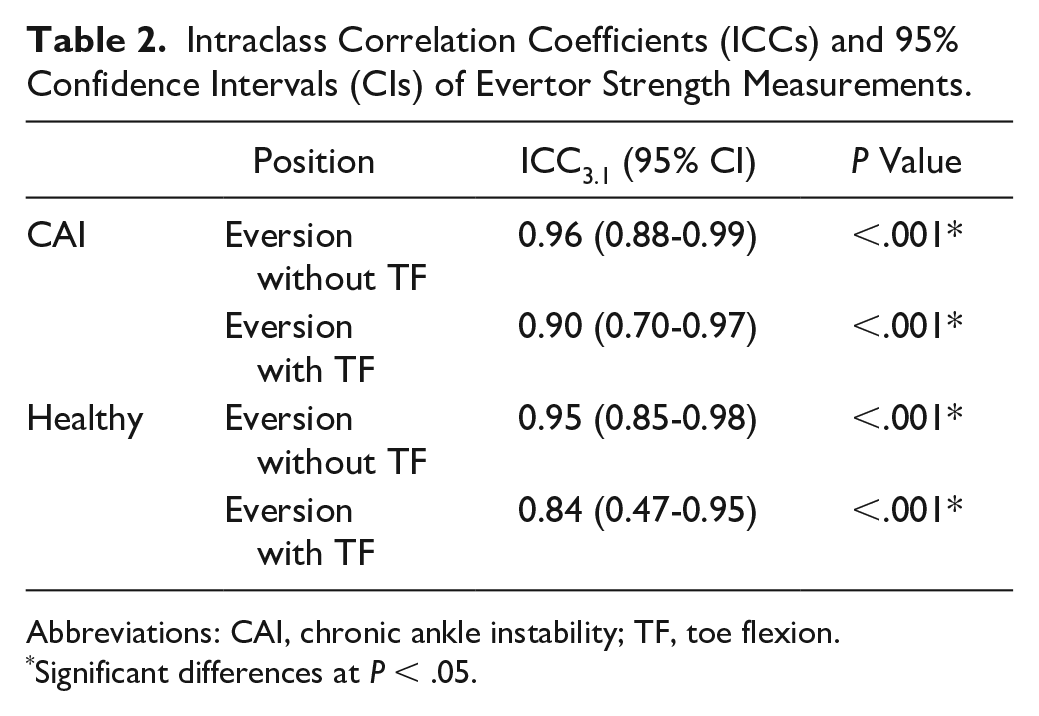
Abbreviations: CAI, chronic ankle instability; TF, toe flexion.
Significant differences at P < .05.
Results of the evertor strength tests showed a significant group by conditions factor (with TF vs without TF) interaction effect (F = 5.43; P = .03). An independent t test for identification of a simple effect showed no significant difference between the groups in eversion without TF (CAI: 21.55% ± 6.02% BW; Healthy: 23.89% ± 4.76% BW; P = .25), but there was a significant difference between the groups in eversion with TF (CAI: 15.33% ± 4.58% BW; Healthy: 21.37% ± 3.43% BW; P < .01). A paired t test revealed a significant difference between conditions in the CAI group (P < .01) and no significant difference in the healthy group (P = .04) (Figure 4).
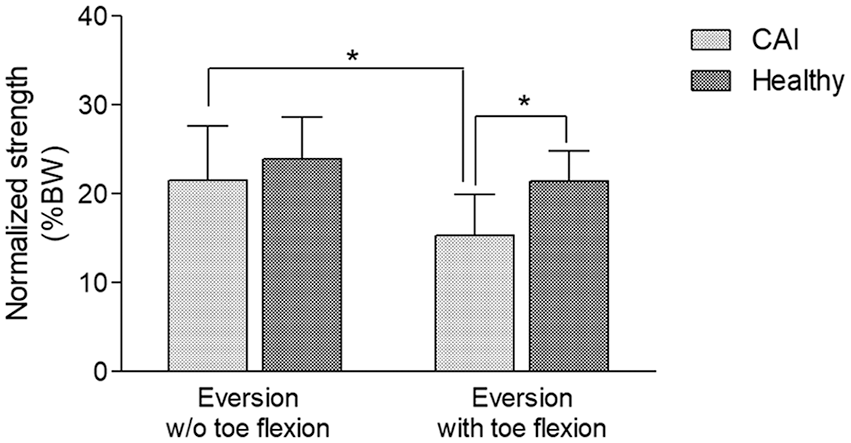
Ankle evertor strength measurements with and without toe flexion. *P < .01. BW, body weight; CAI, chronic ankle instability; w/o, without.
EMG data revealed no significant group by conditions factor interaction effects on EMG of the PL, PB, and EDL. The main effect of factor (with and without TF) of the EMG values were significantly decreased in all muscles in eversion with TF compared to those in eversion without TF (Table 3).
EMG Values of the PL, PB, and EDL During Ankle Eversion With and Without Toe Flexion and F and P Values for Interaction Effects.
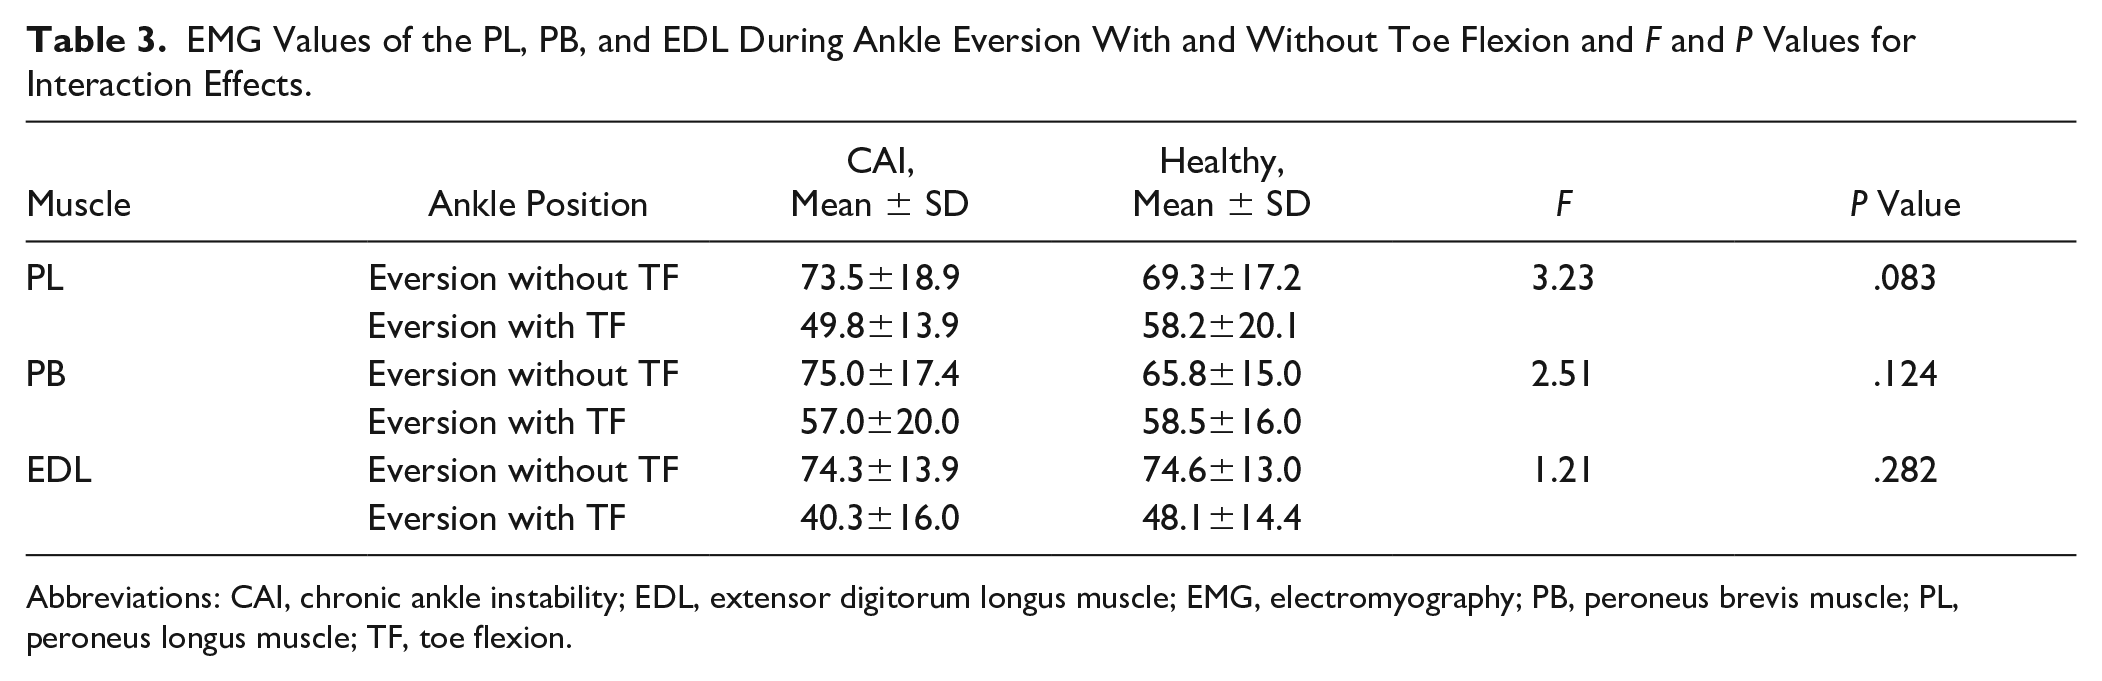
Abbreviations: CAI, chronic ankle instability; EDL, extensor digitorum longus muscle; EMG, electromyography; PB, peroneus brevis muscle; PL, peroneus longus muscle; TF, toe flexion.
Comparison of muscle activity of the PL, PB, and EDL between eversion with and without TF revealed a significant difference in the CAI group (PL: t = 5.60, P = .00; PB: t = 3.58, P = .00; EDL: t = 6.83, P = .00) and in the healthy group showed that there was a significant difference in muscle activity of EDL but no significant difference in PL and PB (PL: t = 1.99, P = .07; PB: t = 1.62, P = .13; EDL: t = 5.68, P = .00).
Discussion
This study compared the ankle evertor strength and muscle activity of the PL, PB, and EDL during eversion with and without TF in individuals with CAI and individuals in a healthy group. The results showed that evertor strength during eversion with TF was lower than without TF in the CAI group. In a comparison between the groups, no significant differences were revealed in the evertor strength in eversion without TF. However, the evertor strength in eversion with TF was significantly lower in the CAI group than in the healthy group. EMG data showed no significant difference between the groups, but EMG values were significantly lower for eversion with TF than for that without TF. In addition, muscle activity of the EDL was decreased in all groups because of TF, but EMG data of the PL and PB were significantly decreased in eversion with TF compared to those in eversion without TF only in the CAI group.
Previous studies have evaluated the evertor strength of patients with CAI, but the results are controversial. Willems et al 20 reported that the ankle evertor isokinetic peak torque was significantly lower in the CAI group than in the control group (CAI group: 0.30-0.36 Nm/kg; Control group: 0.38-0.46 Nm/kg). Similarly, Donnelly et al 4 also reported that the evertor strength was lower in the CAI group in both neutral and plantarflexion ankle positions than in the healthy group (neutral position: CAI, 1.64 Nm/kg; Healthy, 2.10 Nm/kg; plantarflexion position: CAI, 1.40 Nm/kg; Healthy, 1.73 Nm/kg). However, the study of Terrier et al 18 and Sierra-Guzmán et al 17 reported no significant difference between the CAI and healthy groups in the ankle evertor isokinetic peak torque. In this study, there was no significant difference between the groups in eversion without TF positions; however, the evertor strength of CAI was significantly lower for the CAI group than for the healthy group in eversion with TF.
The results of this study revealed that the evertor strength was significantly lower in eversion with TF than in that without TF in the CAI group, but there was no significant difference in the healthy group. TF causes the inhibition of the EDL, an evertor synergist. However, the eversion prime movers, PL and PB, attach to the first and fifth metatarsals, respectively, so that the toe position is less affected.13,14 Therefore, if the prime mover is used mainly in eversion, the difference in the muscle strength according to the toe position should be minimized. 15 Nevertheless, the evertor strength was significantly lower in eversion with TF than in that without TF in the CAI group, which explains the increased use of the synergist EDL during eversion in the CAI group.
The muscle activity of the PL and PB was decreased in eversion with TF compared to that in eversion without TF only in the CAI group. The PL and PB are innervated by superficial peroneal nerves, and the EDL is innervated by the deep peroneal nerve. 13 In the normal muscle, neuromuscular compartments can be independently activated by voluntary command. 6 However, in the CAI group, TF decreased the muscle activity of the EDL, which also affected the decrease in the muscle activity of the PL and PB. This explains the difficulty of the selective activation of the EDL, PL, and PB in subjects with CAI. Different capacities for selective activation between subjects may be due to large inter-individual differences in the branching of nerve innervation. 6 However, selective activation of evertor muscles was seen only in the CAI group in this study. We postulate that it is difficult to selectively activate only the PL and PB by dominantly using the EDL to compensate for the injured PL and PB during ankle eversion in individuals with CAI.
The EMG values of the PL, PB, and EDL were not significantly different between groups. Our hypothesis was that the CAI group would have decreased muscle activity of the PL and PB and increased muscle activity of the EDL compared to the healthy group during eversion with TF. However, the results showed no significant difference between the 2 groups in both eversion with and without TF. Few studies have measured the EMG value during isometric contraction of the evertor muscle. Donnelly et al 4 measured EMG values during an evertor strength measurement and reported no significant difference between a CAI group and a healthy group. In this study, there was no significant difference between the groups, comparable to the previous study. The results indicate that motor unit recruitment was similar in both CAI and healthy groups. Previous studies suggest that the evertor muscles of the CAI group are not affected by motor unit recruitment ability regardless of muscle damage. 4
This study has several limitations. First, subjects recruited were only young adults. Therefore, it is difficult to generalize the results of this study. Second, although we have monitored in advance to prevent crosstalk of the EDL EMG, crosstalk may have occurred because the EDL is located close to the PB. A fine-wire EMG study will be needed in future studies to acquire reliable EDL EMG data. Third, only evertor strength during isometric contraction was measured. Muscles functionally use concentric and eccentric contraction as well as isometric contraction. However, as this study only measured isometric strength, the results of this study may be difficult to explain in terms of concentric and eccentric contraction. Therefore, it is necessary to study evertor strength during concentric and eccentric contraction in future studies. Finally, future studies are needed to investigate the effect of ankle evertor strengthening exercise with and without TF on ankle function in subjects with CAI.
Conclusion
We found no significant difference in the evertor strength between the CAI and control groups in eversion without TF, and evertor strength in eversion with TF was significantly lower in the CAI group than in the healthy group. EMG data showed no significant difference between the groups, but EMG values were significantly lower for eversion with TF than for that without TF. In addition, EMG data of the PL and PB of the CAI group were significantly lower in eversion with TF than in that without TF, but there was no significant difference in the healthy group. Thus, subjects with CAI had increased EDL compensation during ankle eversion and reduced selective activation of the PL and PB during eversion, suggesting that clinicians should consider the activation of the EDL when performing strength measurements and training the evertor of patients with CAI. TF should be applied to inhibit the EDL for the selective assessment and training of the injured PL and PB in patients with CAI.
Supplemental Material
FAI898464_ICMJE_disclosures – Supplemental material for Comparison of the Strength and Electromyography of the Evertor Muscles With and Without Toe Flexion in Patients With Chronic Ankle Instability
Supplemental material, FAI898464_ICMJE_disclosures for Comparison of the Strength and Electromyography of the Evertor Muscles With and Without Toe Flexion in Patients With Chronic Ankle Instability by Sun-hee Ahn, Ui-jae Hwang, Gyeong-tae Gwak, Hwa-ik Yoo and Oh-yun Kwon in Foot & Ankle International
Footnotes
Acknowledgements
Declaration of Conflicting Interests
The author(s) declared no potential conflicts of interest with respect to the research, authorship, and/or publication of this article. ICMJE forms for all authors are available online.
Funding
The author(s) received no financial support for the research, authorship, and/or publication of this article.
References
Supplementary Material
Please find the following supplemental material available below.
For Open Access articles published under a Creative Commons License, all supplemental material carries the same license as the article it is associated with.
For non-Open Access articles published, all supplemental material carries a non-exclusive license, and permission requests for re-use of supplemental material or any part of supplemental material shall be sent directly to the copyright owner as specified in the copyright notice associated with the article.