
Abstract
Background:
Insertional Achilles tendinopathy (IAT) is characterized by tendon degeneration and thickening near the tendon-bone insertion.11 Calcaneal impingement is believed to contribute to the pathogenesis of IAT.5 However, it is unclear how increased tendon thickness in individuals with IAT influences impingement. This study aimed to compare Achilles tendon impingement in individuals with and without IAT.
Methods:
Eight healthy adults and 12 adults with clinically diagnosed symptomatic IAT performed a passive flexion exercise during which ankle flexion angle, anterior-posterior (A-P) thickness, and an ultrasonographic image sequence of the Achilles tendon insertion were acquired. The angle of ankle plantarflexion at which the calcaneus first impinges the Achilles tendon, defined as the impingement onset angle, was identified by (1) a anonymized observer (visual inspection method) and (2) a computational image deformation-based approach (curvature method).
Results:
Although the 2 methods provided different impingement onset angles, the measurements were strongly correlated (R2 = 0.751, P < .05). The impingement onset angle and the thickness of the Achilles tendon insertion were greater in subjects with clinically diagnosed IAT (P = .0048, P = .0047). Furthermore, impingement onset angle proved to have a moderate correlation with anterior-posterior thickness (R2 = 0.454, P < .05).
Conclusion:
Our findings demonstrated that increased tendon thickness in IAT patients is associated with larger impingement onset angles, raising the range of ankle angles over which the tendon is exposed to impingement.
Clinical Relevance:
Increased susceptibility to impingement may exacerbate or perpetuate the pathology, highlighting the need for clinical strategies to reduce impingement in IAT patients.
Introduction
Insertional Achilles tendinopathy (IAT) is a painful condition characterized by tendon degeneration and thickening near the tendon-bone insertion. 11 The pathology typically presents as swelling and tenderness at the back of the heel. 5 Commonly, conservative (ie, nonsurgical) interventions such as exercise, activity modification and eccentric heel lifts are prescribed to treat IAT. 24 However, failure of current nonoperative management is not uncommon, as approximately 50% of IAT patients eventually require surgery. 14 Hence, there is a need for improved conservative care for IAT patients.
Improved understanding of the underlying factors that cause and sustain IAT could help motivate novel clinical treatment strategies. Although the fundamental cause of IAT remains unknown, biomechanical factors have been implicated in its pathogenesis. For example, some studies report that IAT is common in active individuals, affecting 6.5% to 18% of recreational runners. 22 In addition, IAT patients exhibit reduced plantarflexion power and elevated use of functional ankle dorsiflexion, suggesting a potential link between a specific movement (ankle dorsiflexion) and IAT pathogenesis. 5 As the ankle dorsiflexes, the posterior-superior aspect of the calcaneus moves toward and ultimately impinges on the deep region of the tendon insertion (Figure 1), generating large local transverse compressive strains.6,12,20 Since the region of transverse compressive strain is the same area of the tendon most commonly affected by IAT, impingement and its biomechanical sequelae may play a role in triggering IAT. 8 The compositional changes observed in IAT tissue provide further evidence linking dorsiflexion, impingement and IAT. In particular, IAT tissue exhibits increased collagen II and aggrecan content, more rounded cells, and increased compressive modulus, suggesting transformation to a more fibrocartilage-like tissue adapted to resist compression generated by calcaneal impingement. 13
Because of pain experienced by IAT patients during activities that require ankle dorsiflexion, a prior study designed a custom exercise program to avoid ankle dorsiflexion and return patients to previous activities, with 67% of patients reporting satisfaction with the exercise. 10 The improved outcomes reported in this previous study indicate that dorsiflexion may aggravate IAT, possibly because of calcaneal impingement and transverse compressive strain in the deep Achilles tendon insertion. However, the dissatisfaction of 33% of study participants performing the custom exercise program suggests that for some subjects, the extent of ankle dorsiflexion generated by the exercise may have still been too great. 10 Specifically, calcaneal impingement may not have been avoided in the subset of the experimental cohort with poor outcomes. However, an exercise regimen that stretches the Achilles tendon without generating impingement may be optimal to treat IAT. Unfortunately, no method currently exists to quantitatively assess impingement and determine whether a tendon is impinged at a given ankle position or during a particular exercise.
Ultrasound elastography is a well-established technique that has been effectively utilized to quantify tissue mechanics through measurements of tissue motion. 21 In this technique tissue deformation, caused by either physiological forces or external forces, is captured in a sequence of ultrasonographic images. Comparison of ultrasound signal locations between select frames of interest allows for measurement of a spatially varying displacement field, and that displacement field can be used to infer mechanical information from the imaged tissue. 15 A limitation of ultrasound elastography is that relatively large displacements can lead to poor displacement estimates.3,23 Nonrigid image registration strain estimators have been employed in 3D static ultrasound elastography and 2D intravascular ultrasound elastography to combat and improve poor displacement estimates.16,17 In a previous study by our group, a nonrigid image registration algorithm was used to accurately track transverse displacements and estimate the 2D strain tensor field of the Achilles tendon deformation. 6 In a reliability test, the ultrasound elastography technique only underestimated a caliper-induced strain on a phantom by 2.2%, which was shown not to be a proportional bias between measurements. 6 The same ultrasound elastography technique was used to effectively measure transverse and axial strain in both the deep and superficial regions of healthy and IAT symptomatic Achilles tendons. 4 The ability of our registration technique to quantify large displacements and strains, accumulated over many frames of an ultrasonographic sequence, makes it ideal for measuring the large strains of the Achilles tendon during dorsiflexion. However, this technique has not previously been applied to detect tendon impingement.
In this study, our objective was to use ultrasound elastography to develop and validate methods to evaluate the ankle angle at which the calcaneus impinges on the Achilles tendon (the impingement onset angle) and compare this angle in individuals with and without IAT. We hypothesized that IAT individuals would experience impingement earlier (ie, at larger ankle angles) and that impingement onset angle would be correlated with tendon anterior-posterior thickness.
Methods
Study Design
Twenty individuals, 8 healthy adults without IAT or foot or ankle pain and 12 adults with clinically diagnosed symptomatic IAT, participated in this study. Patients were recruited by surgeons at the Foot & Ankle Division of the Department of Orthopaedics at the University of Rochester Medical Center. IAT diagnosis was made through radiographical and clinical findings. Patients were categorized as having IAT based on a clinical diagnosis. Specifically, the clinically diagnosed IAT group demonstrated clear clinical signs of insertional Achilles tendinopathy which included insertional tenderness, prominence, and tendon thickening. Participants with clinically diagnosed symptomatic IAT were excluded if they had midportion Achilles tendinopathy, rheumatological disease, diabetes, or history of ankle surgery. Healthy controls with no history of tendon injury and no pain at the insertion were recruited through use of fliers. Healthy controls were excluded if they had Achilles tendinopathy or had ever experienced Achilles pain at the insertion. The Victorian Institute of Sport Assessment–Achilles Questionnaire (VISA-A), a validated measure of Achilles tendon pain and function, was used to determine the severity of IAT in symptomatic subjects. 18 Severity scores range from 0 (inability to complete daily tasks such as walking) to 100 (ability to complete daily tasks and participate in sports). IAT participants had an average VISA-A score of 56 with an SD of 23. The purpose of this study was to compare the mechanics of tendon impingement in patients with IAT in vivo to people without tendon pathology. Therefore, the comparison group was purposively not age- or BMI-matched (Table 1), because older age and higher BMI are known risk factors for tendinopathy. 19 All of the study participants were informed of the study procedures and signed a consent form approved by the University of Rochester Institutional Research Subject Review Board.
Demographics.
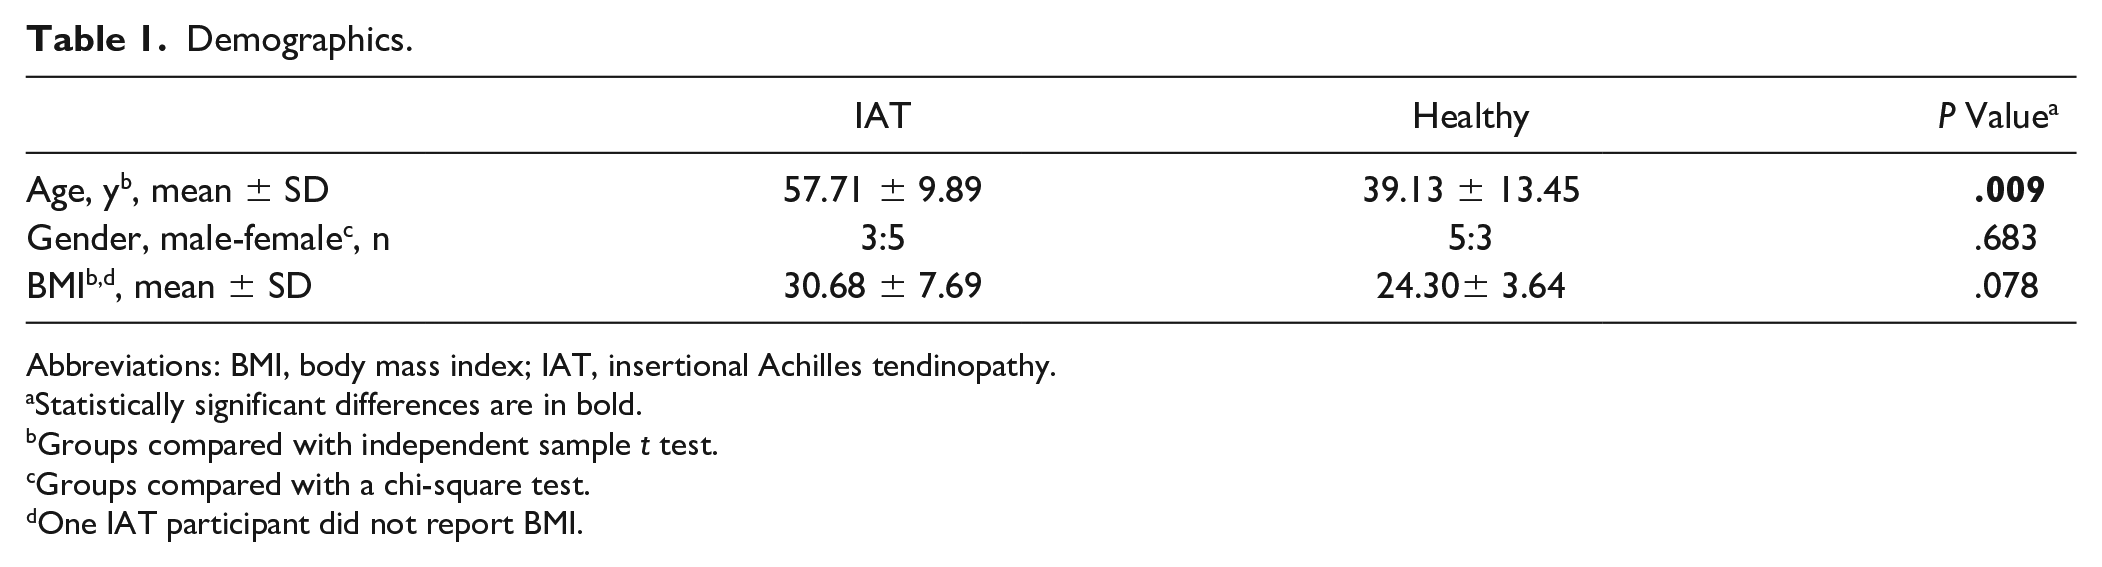
Abbreviations: BMI, body mass index; IAT, insertional Achilles tendinopathy.
Statistically significant differences are in bold.
Groups compared with independent sample t test.
Groups compared with a chi-square test.
One IAT participant did not report BMI.
Experimental Methods
Participants completed 2 trials of a bilateral, weightbearing, passive heel-lowering task. Pilot testing revealed that at standing position (neutral ankle angle), the posterior-superior aspect of the calcaneus was impinged on the Achilles in all participants. To ensure participants were not impinged at the start of the task, the participants were positioned into ankle plantarflexion using an inflatable platform (Figure 2). The platform was raised to a 17-degree inclination, placing the participants at 17 ± 3.7 degrees plantarflexion. The platform was positioned using an inclinometer, calibrated to a level surface. Four of the 12 clinically diagnosed IAT participants were removed from this study because they could not comfortably be positioned in the 17-degree plantarflexed starting position. Therefore, these participants could not reach an angle of plantarflexion to avoid impingement at the beginning of the task. During the task, the air bladder on the platform was deflated, passively lowering the subject’s heel to level ground (reducing the angle of plantarflexion) over a time period of approximately 5 seconds.
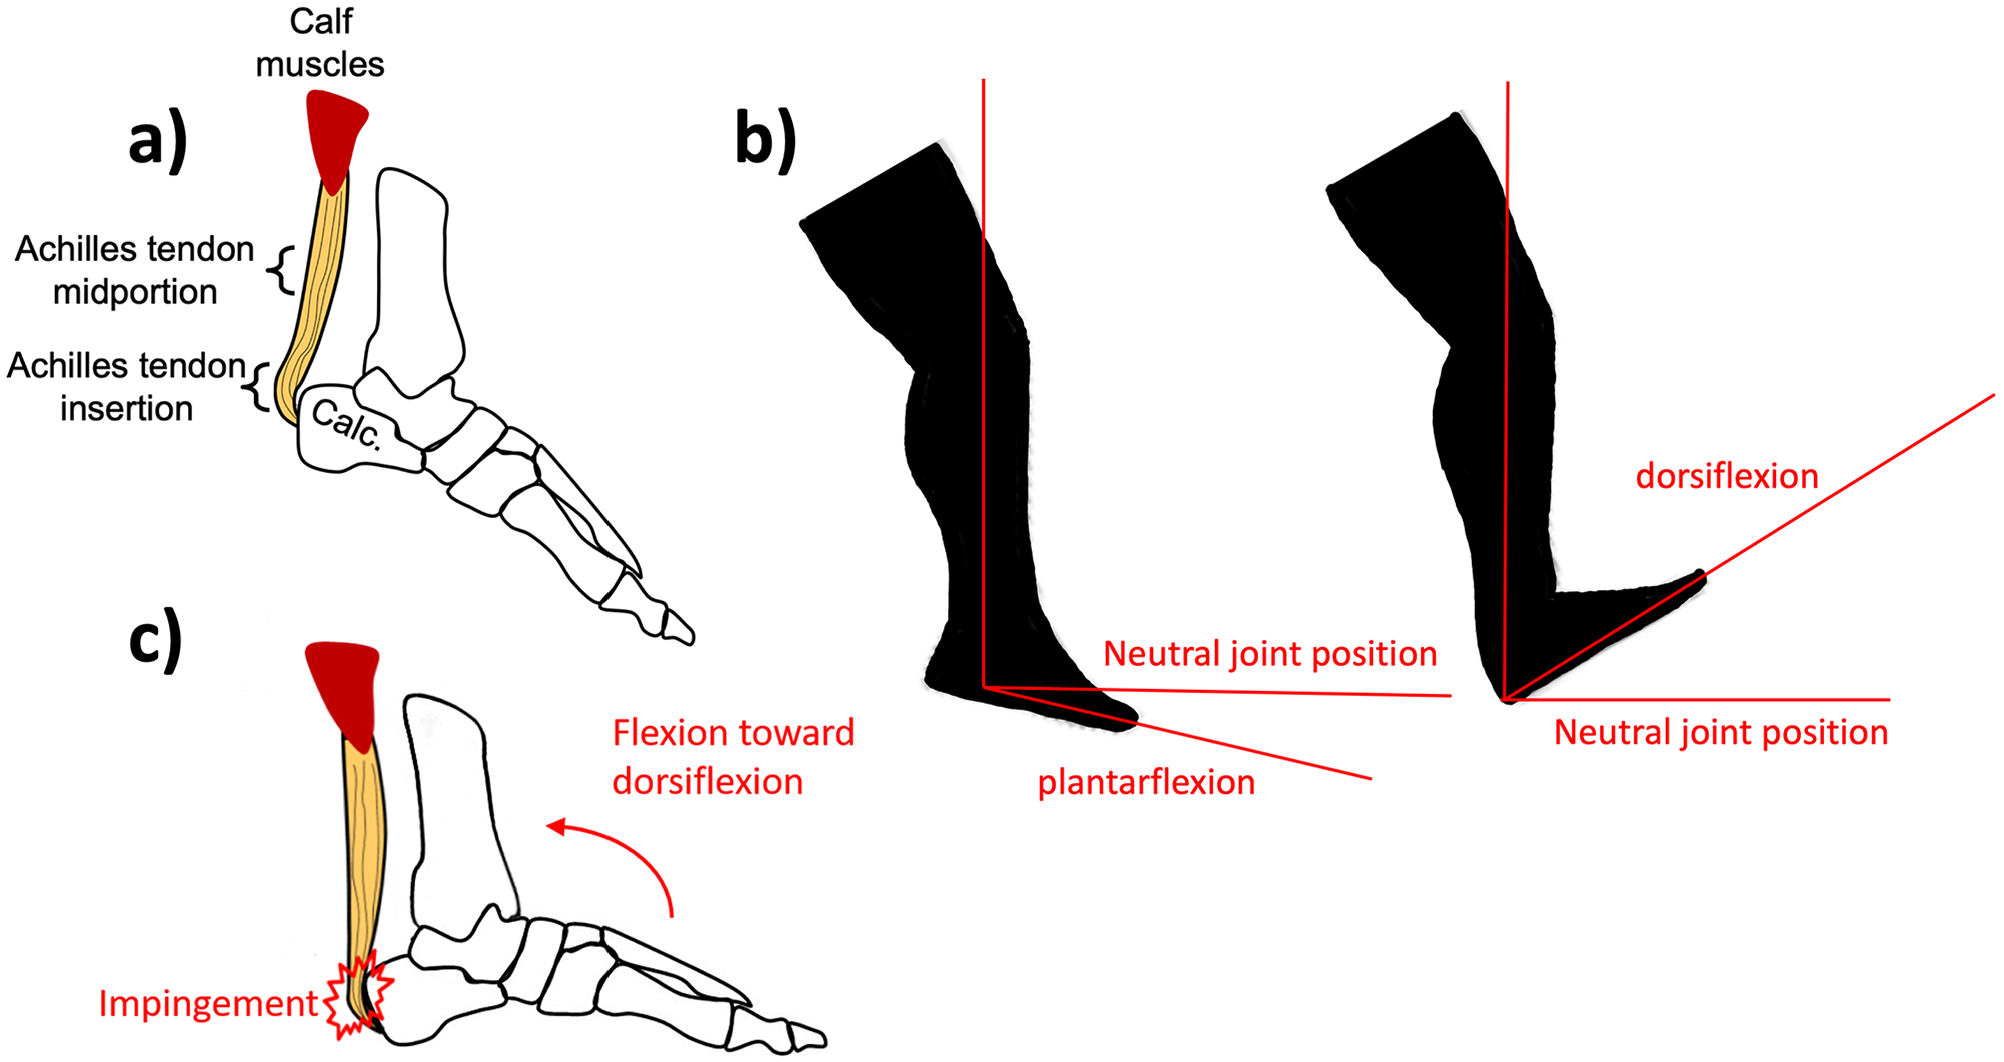
Graphical representation of ankle anatomic positioning and Achilles insertion anatomy. (A) Illustration of relevant ankle anatomy. (B) Schematic representing anatomic position and terms used to reference ankle position. (C) Illustration representing Achilles tendon impingement as the ankle is flexed up toward a dorsiflexed position.
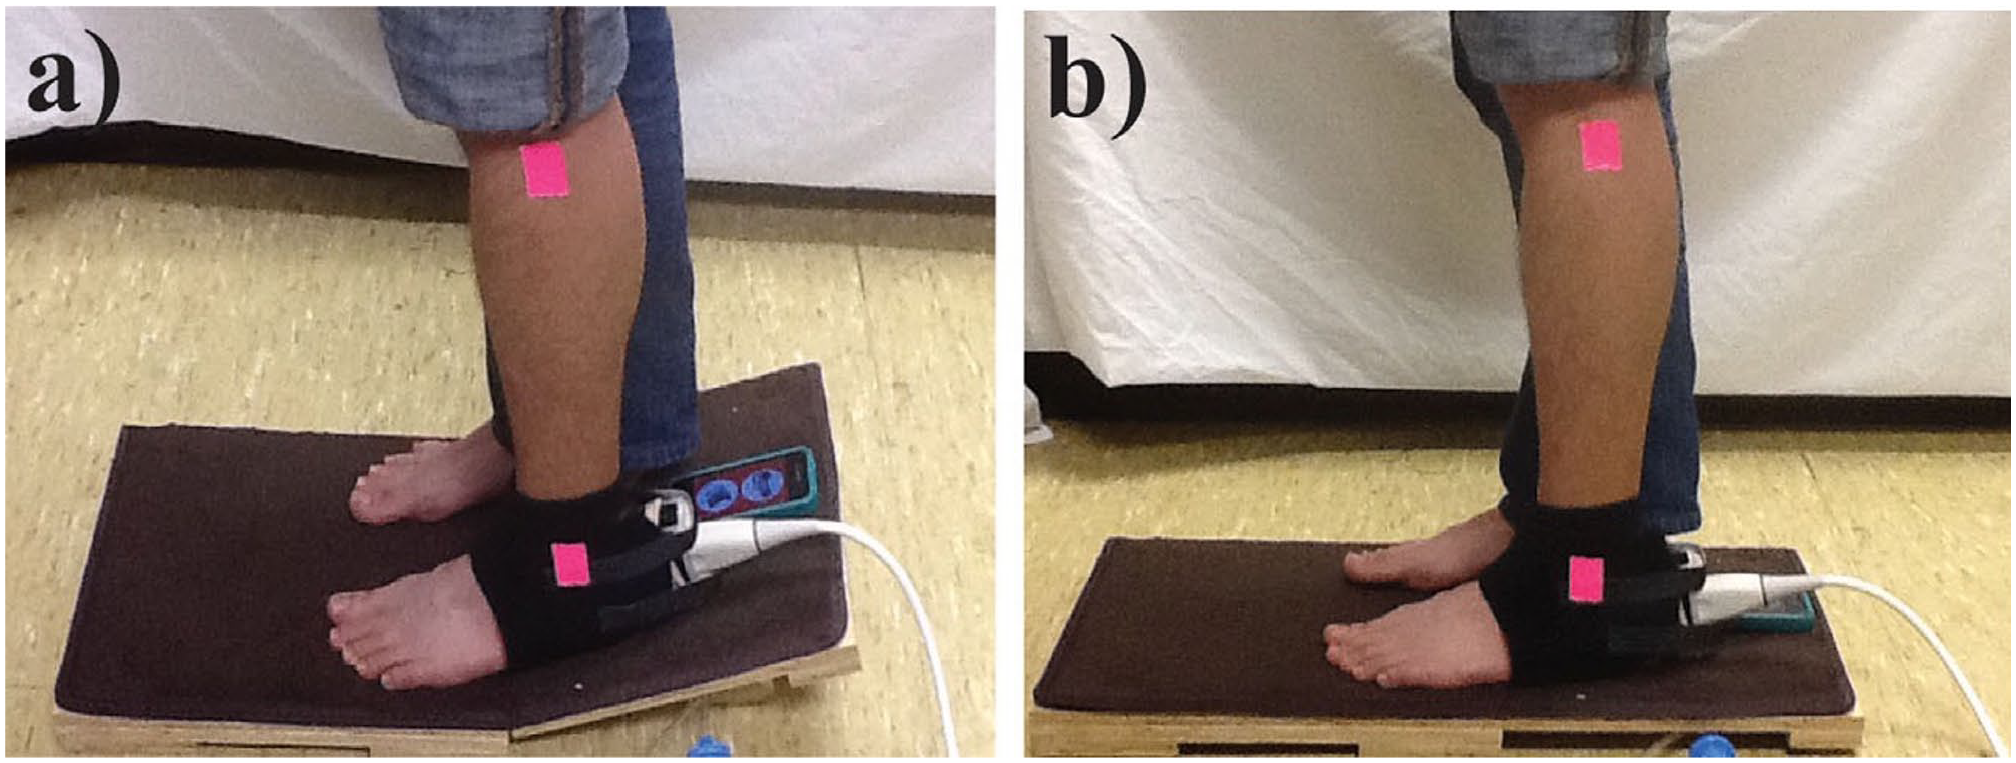
(A and B) The passive heel-lowering tasks used to identify the start of impingement. (A) Platform is raised to 17-degree inclination to place the participant in plantarflexion to ensure participants were not impinged. Pink reflective tape marks the position of the lateral malleolus and fibular head. (Adapted from Chimenti et al. 6 )
The ankle angle in the sagittal plane was tracked using an iPad video recording of each participant performing the exercise. Reflective tape was placed over the fibular head and the lateral malleolus as reference points for the shank in image analysis (Figure 2). Using a user-guided ankle angle software, 2 intersecting lines were drawn, one connecting the 2 reference markers for the shank and the other along the intersection of the participant’s sole and the platform. The angle between these 2 lines was measured to provide time-dependent ankle flexion angle measurements over the whole task. According to our coordinate system, neutral ankle position is 0 degrees, with positive angles indicating plantarflexion and negative angles indicating dorsiflexion.
An Ultrasonix Sonix RP (BK Medical, Peabody, MA) L9-4/38 was secured to the back of the subject’s heel in order to obtain simultaneous radiofrequency (RF) and B-mode ultrasonographic image sequences of the Achilles tendon insertion during the heel-lowering task. The transducer was secured using a custom 3D-printed plastic shell around the transducer body and head. To improve image quality and accommodate the heel shape, an Aquaflex Ultrasound Gel Pad (Parker Laboratories, Fairfield, NJ) was inserted between the heel and the transducer. Ultrasonographic images were collected using a 10-MHz center frequency, 40-MHz sampling frequency, and a frame rate of 128 Hz at a 3-cm depth. As previously described, by syncing the time of the video recording and the ultrasonographic image sequence, the specific ankle angle of each image frame was determined.4,6
Ultrasonographic image sequences were obtained of the symptomatic tendon of the IAT participants and the left Achilles tendon of healthy participants. The anterior-posterior diameter (thickness) of the tested Achilles tendon was measured based on the first frame of the ultrasonographic image sequence using a user-guided thickness measurement code. This code requires the user to first identify the most proximal visible portion of the calcaneus (Figure 3B). A vertical (anterior-posterior) line is then automatically drawn 5 mm distal to this reference point, and the user indicates the anterior and posterior borders of the tendon along this line. Tendon thickness is then calculated as the distance between these borders. This procedure was repeated 5 times with an average measure used to represent tendon thickness per image.
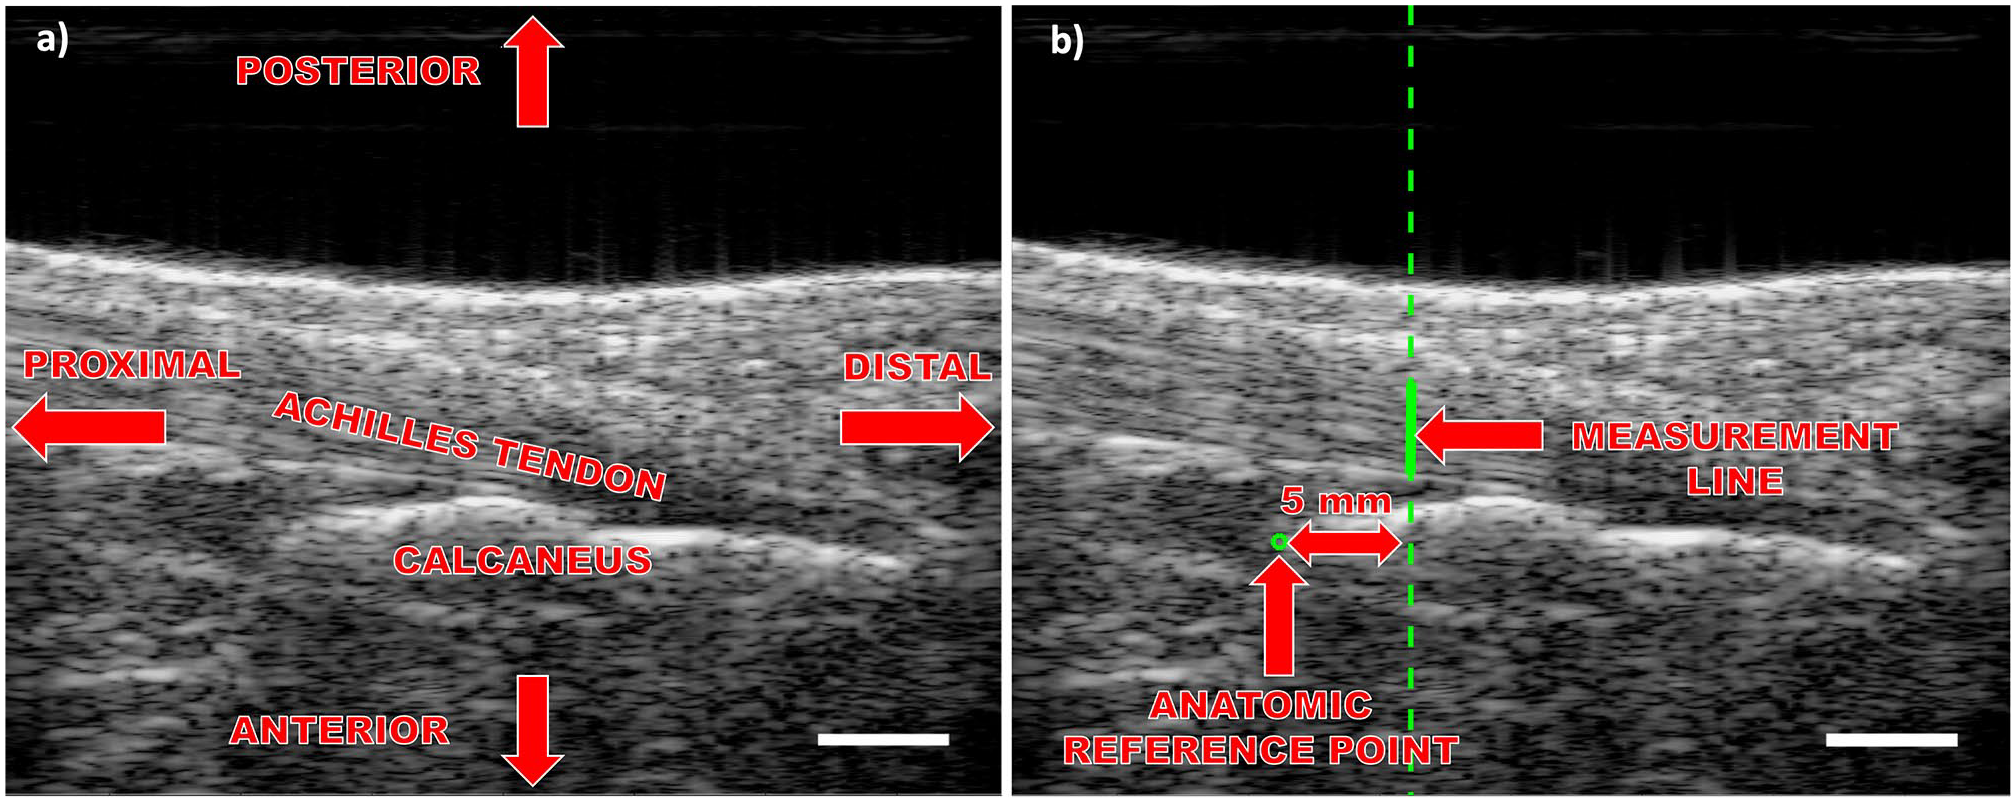
Representative B-mode images of the Achilles insertion. (A) Achilles tendon insertion B-mode image of ankle anatomy and standard anatomic position. (B) A-P thickness measured 5 mm distal to the most superior edge of the visible calcaneus. Scale bars are 5 mm in length. A-P, anterior-posterior.
Two methods were used for identifying the impingement onset angle: (1) an anonymized observer identified the ultrasonographic image frame at which impingement first appeared to occur (visual inspection method); and (2) a custom computational approach identified impingement based on image deformation measurements (curvature method). For the first method, the impingement onset angle was determined by 2 anonymized observers instructed to proceed frame by frame through the ultrasonographic video and identify the frame where the most posterior point on the posterior-superior aspect of the calcaneus contacted the Achilles tendon (Figure 4). Calcaneal contact was identified through slight tendon displacement, highlighted by tendon fiber bunching and increased signal intensity owing to more ultrasound scattering by the now denser region above the most posterior point on the posterior-superior aspect of the calcaneus. As previously described, the identified frame was then matched with an angle measurement based on the iPad video frame corresponding to the time the ultrasonographic frame was obtained.4,6
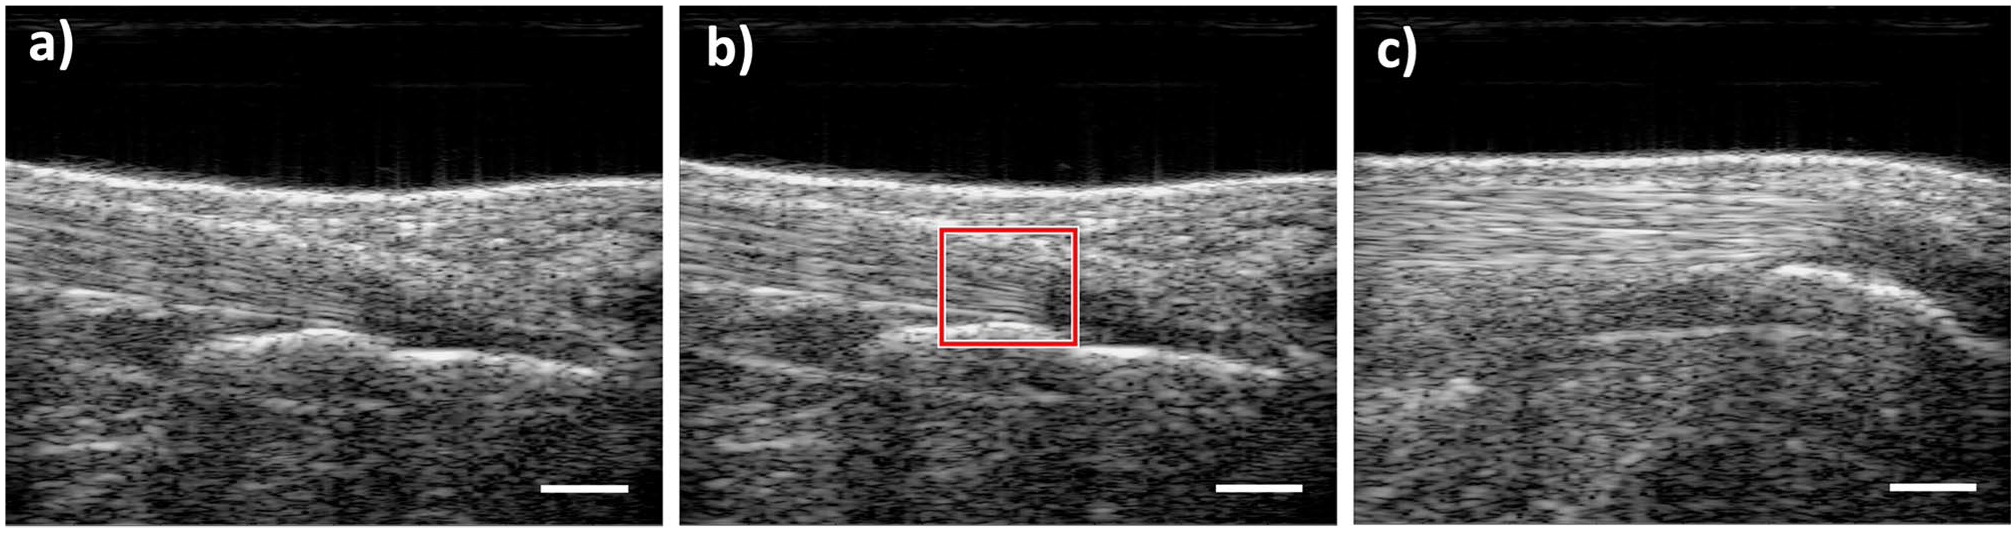
Tendon insertion representative ultrasonographic B-mode images acquired during the heel-lowering task. (A) Participant’s heel at 17-degree inclination where the Achilles tendon was not impinged. (B) Frame where the most posterior aspect of the visible calcaneus made contact with and slightly displaced the Achilles, highlighted by a red box. (c) Extent of calcaneal impingement on the Achilles tendon. Scale bars are 5 mm in length.
The second method for identifying impingement onset angle utilized ultrasound elastography to track the tendon and identify tissue displacement caused by the start of impingement. To track tendon displacement during the heel-lowering task based on the acquired ultrasonographic image sequences, a previously described nonrigid image registration-based algorithm was used.4,6,17 Displacement of the tendon was measured in a region of interest (ROI) that spanned from 12 mm proximal to 3 mm distal to the most posterior point on the posterior-superior aspect of the calcaneus, with the anterior and posterior borders of the ROI corresponding to the tendon boundaries (Figure 5B). A set of measurement points were placed within the ROI. The most anterior set of measurement points, which are placed along the tendon border that makes contact with the calcaneus during impingement, were utilized to fit a second-degree polynomial to the tendon border. When the calcaneus impinges on the Achilles, it displaces the tendon border causing it to curve around the calcaneus. By tracking the curvature of the tendon border and specifying an impingement threshold for the curvature of the second-degree polynomial, the impingement onset angle was identified through the displacement-initiated curvature of the tendon border (Figure 5). Impingement onset angle was defined as the ankle angle in the first frame where the curvature of the fitted curve was greater than 0.001 mm–1. The curvature of the fitted second-order polynomial was defined as coefficient of the second-order term. The threshold value of 0.001 mm–1 was defined from pilot testing and allowed for a balance of sensitivity to curvature change without sensitivity to noise.
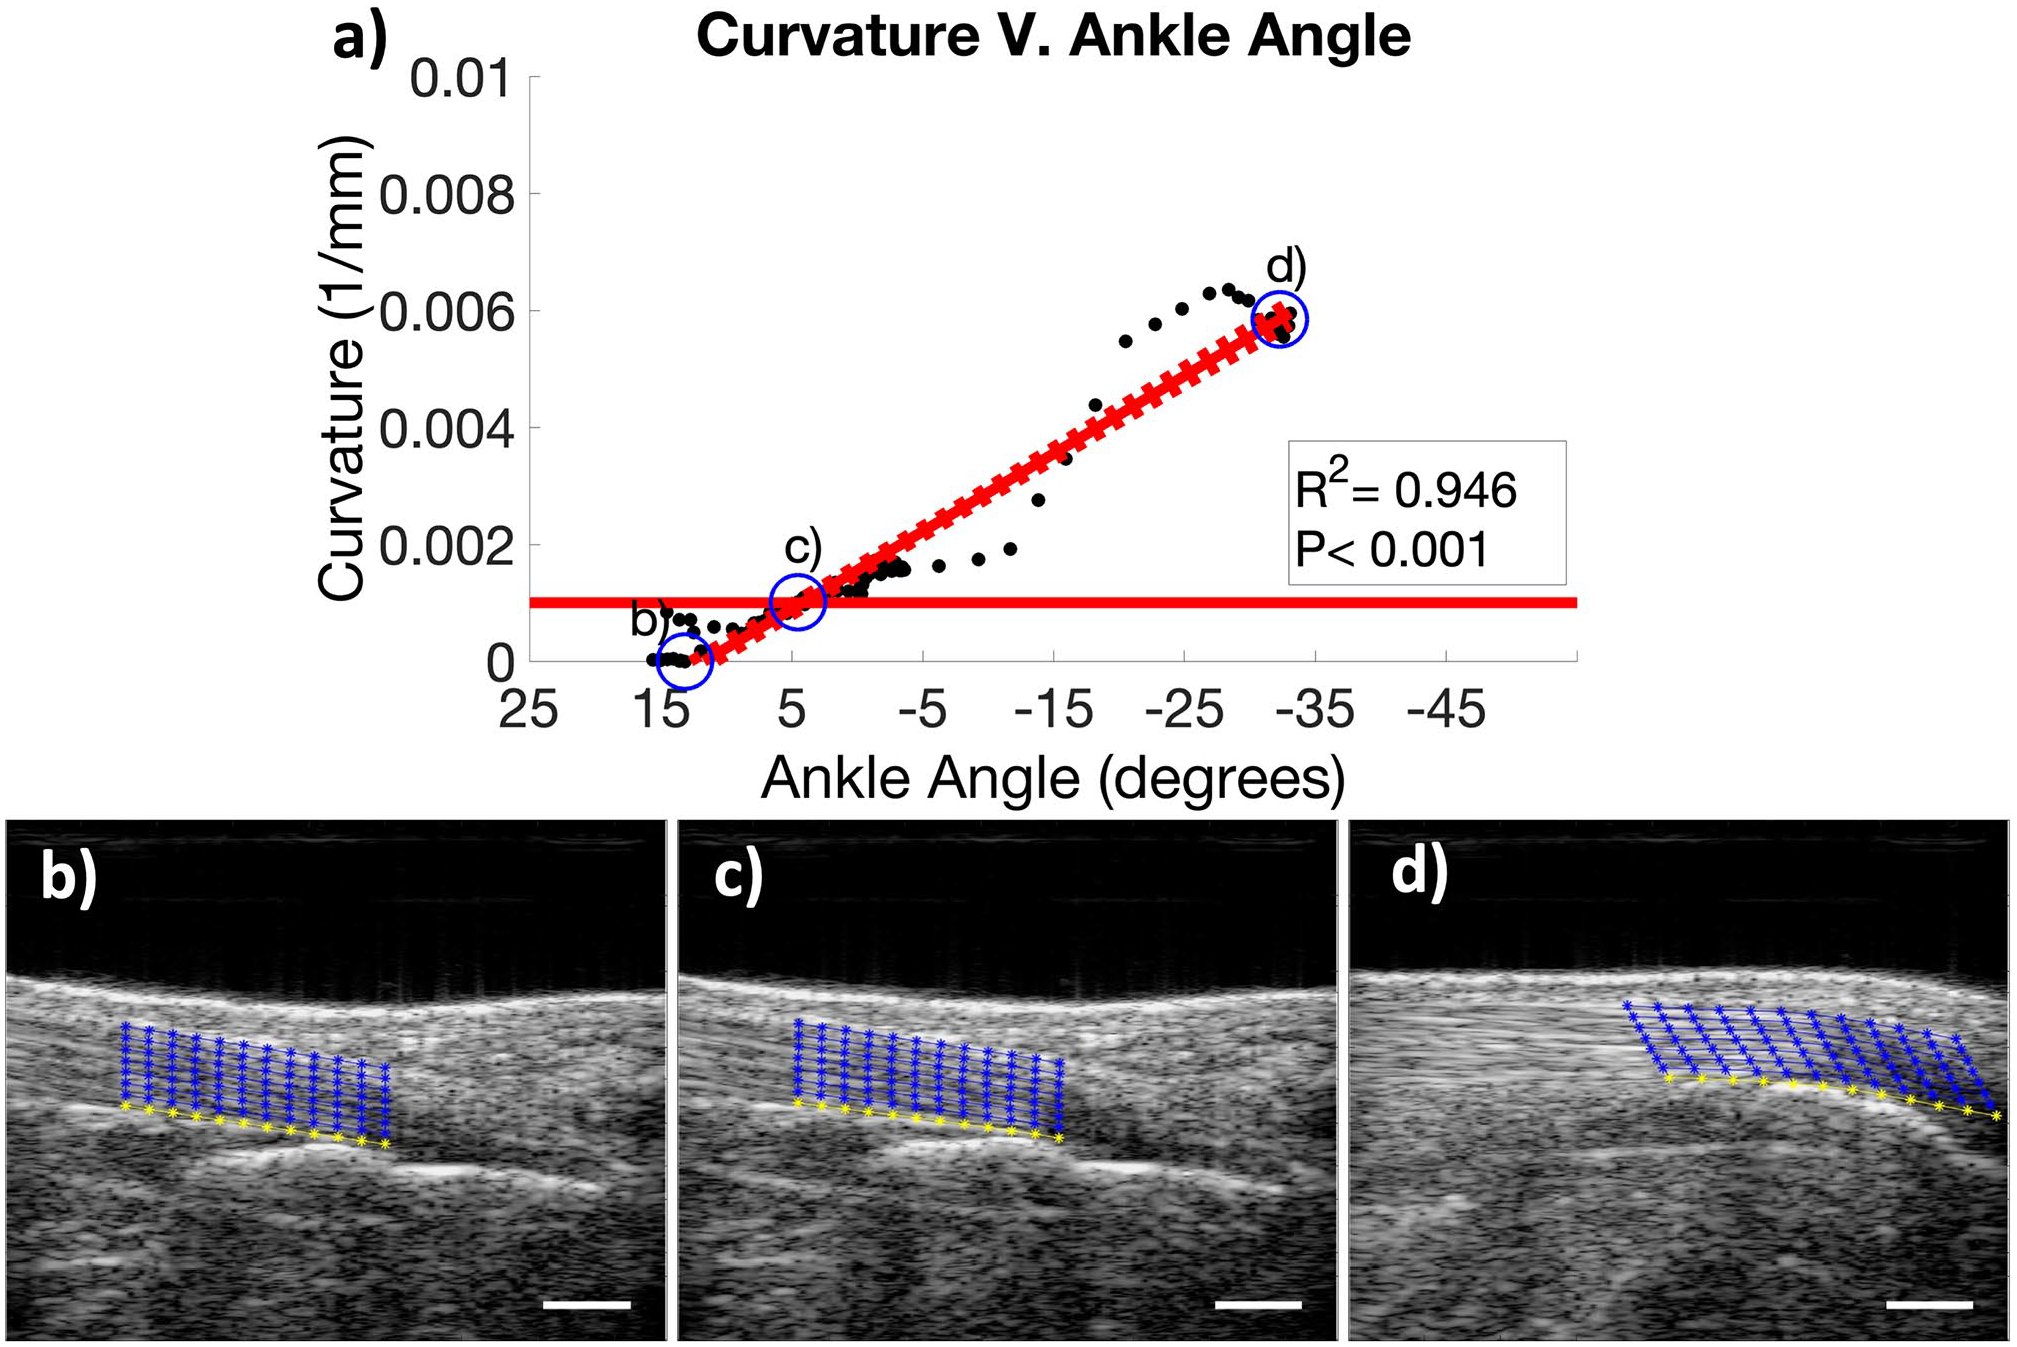
The curvature method of detecting Achilles tendon impingement. (A) Curvature of the Achilles tendon vs ankle angle during the heel-lowering task. Point b is the start of the task (prior to impingement), c is the curvature method identified impingement (curvature > 0.001 mm–1, threshold indicated by solid red line), and d is the end of the task (maximum impingement). (B-D) Representative ultrasonographic images the heel-lowering task (corresponding to points b-d in panel A). The blue grid outlines the image registration region of interest. The yellow curve is the anterior boundary of the tendon used to detect impingement. Scale bars are 5 mm in length.
Statistical Analysis
The 2 methods for identifying impingement onset angle were compared using a linear regression to determine their correlation. The impingement onset angle and tendon thickness were compared between healthy and IAT symptomatic participants using an unpaired t test with α = .05. Relationships between impingement onset angle, tendon thickness, BMI, and VISA-A score for all participants were assessed through linear regressions.
Results
Although the visual inspection method and the curvature method identified different impingement onset angles, the 2 methods were strongly and significantly correlated (R2 = 0.751, P < .05) (Figure 6). The visual inspection method appeared more sensitive, as it identified larger (earlier) impingement onset angles in both experimental groups (Figure 7).
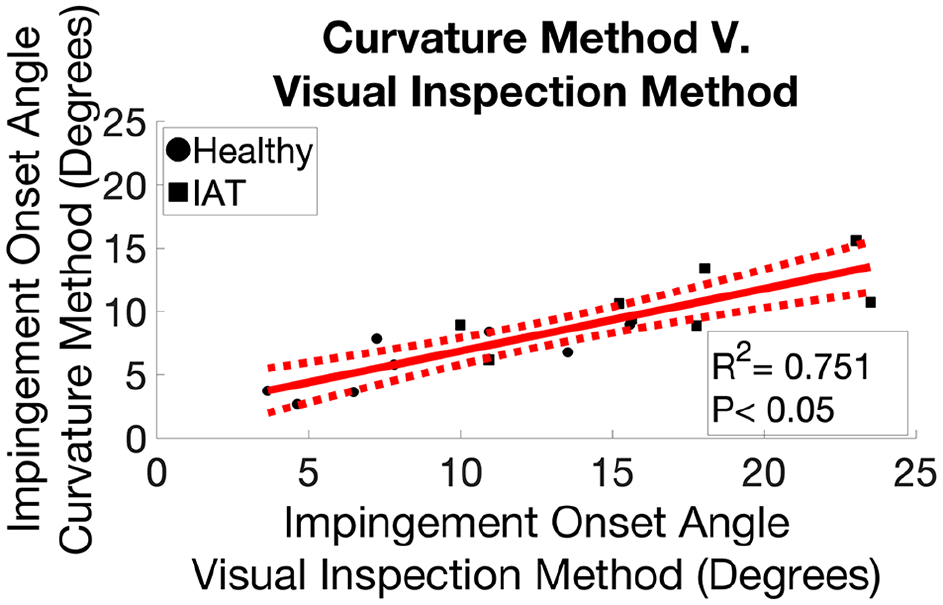
Comparison of the 2 methods used to identify the impingement onset angle. Correlation of impingement onset angles identified using the 2 different methods (the visual inspection method and the curvature method). The dotted lines indicate the 95% CI of the linear regression.
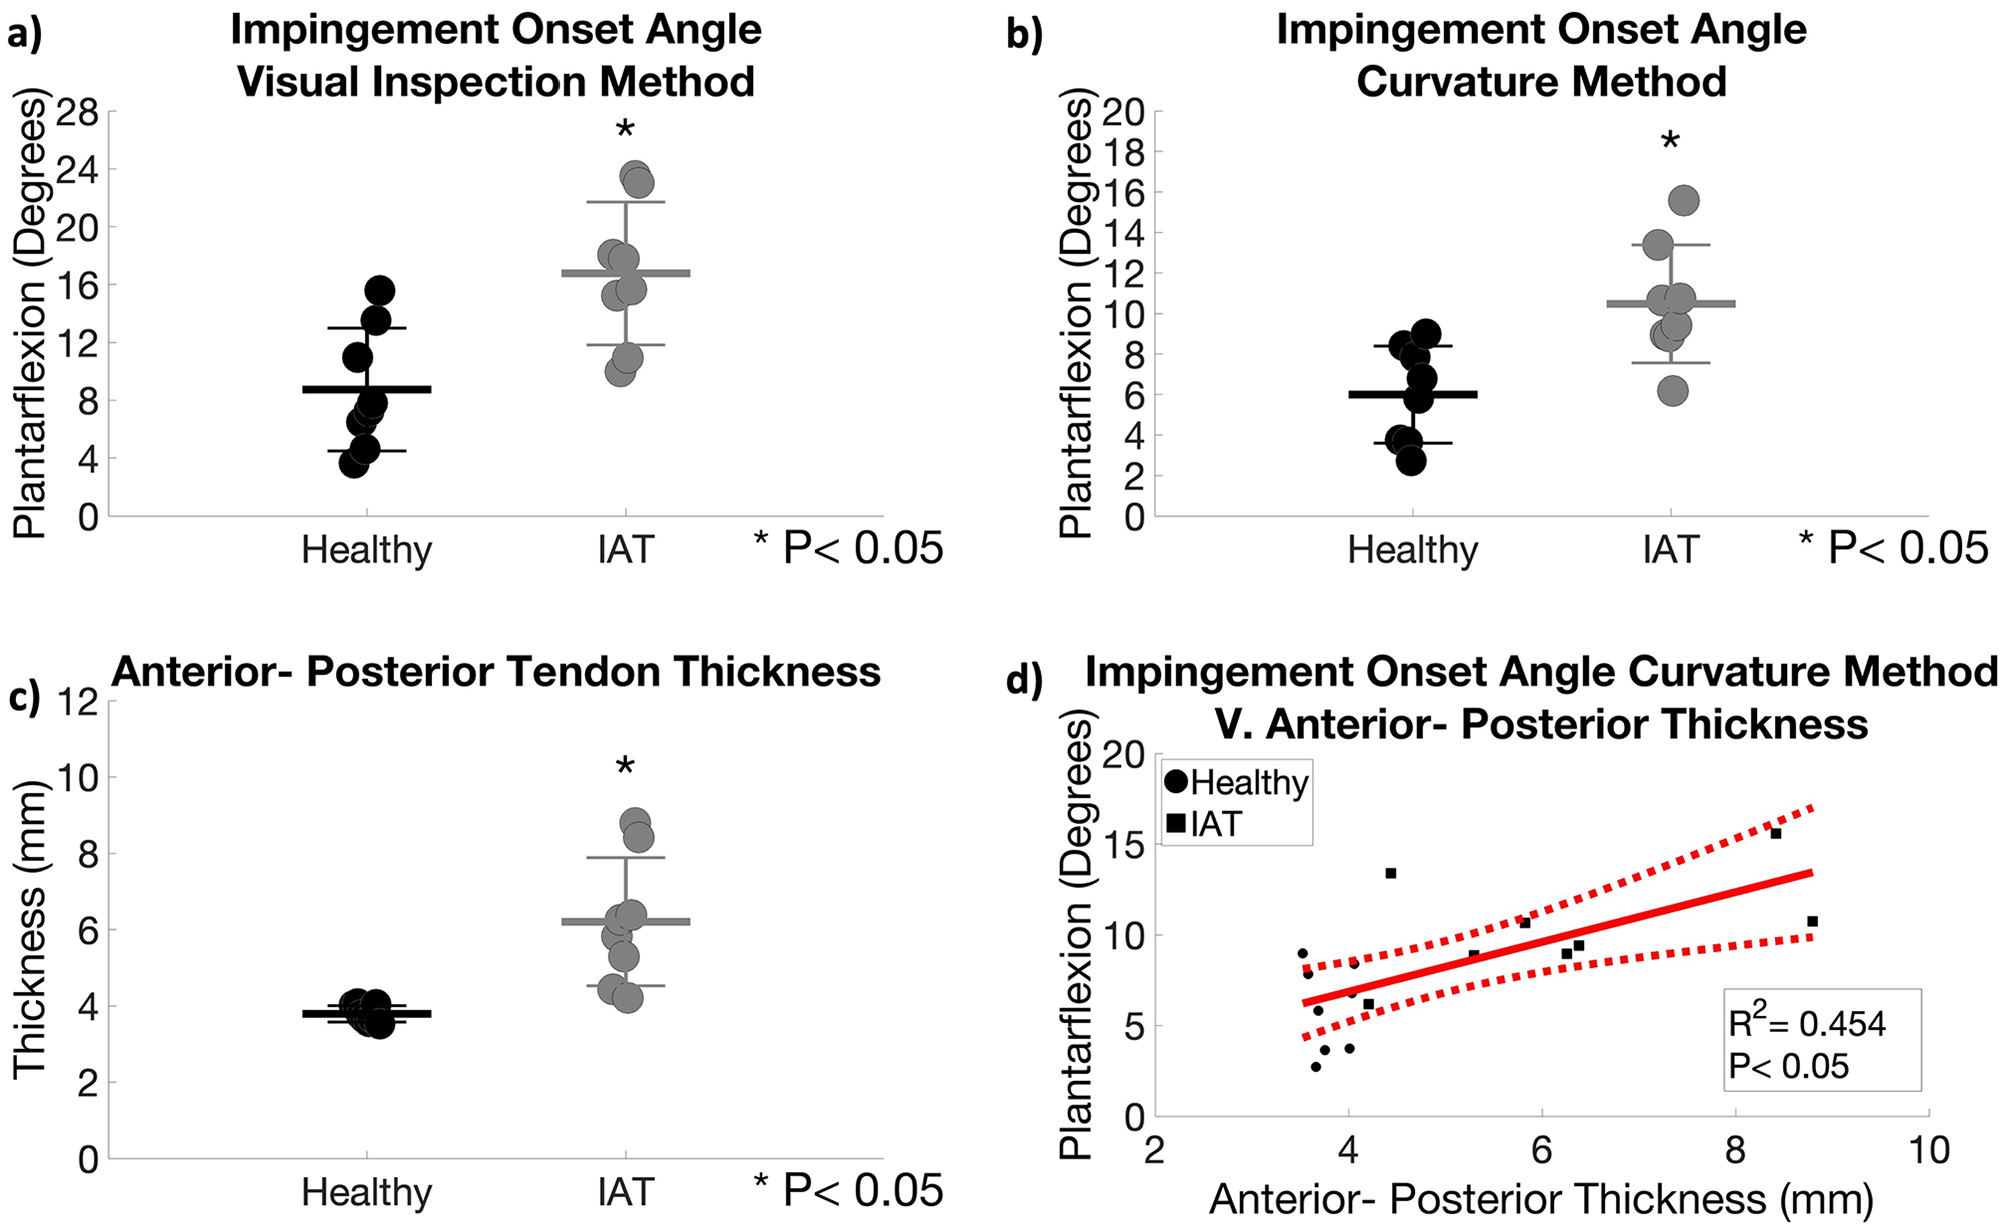
Comparison of the impingement onset angle and A-P thickness of the Achilles tendon for healthy and IAT subjects. (A) Impingement onset angle identified using inspection method. (B) Impingement onset angle identified using the curvature method. (C) Comparison of A-P thickness. Data are presented as points with lines for mean + SD. (D) Correlation of impingement onset angle (identified with the curvature method) with A-P thickness. The dotted lines indicate the 95% confidence interval of the linear regression. A-P, anterior-posterior; IAT, insertional Achilles tendinopathy.
According to both methods, tendons affected by IAT were impinged on the calcaneus earlier in the heel-lowering task (ie, at significantly larger angles of ankle plantarflexion) (Figure 7). IAT tendons were identified by the curvature method to impinge at an average of 10.47 ± 2.91 degrees of plantarflexion compared to impingement at an average of 5.99 ± 2.39 degrees of plantarflexion in healthy tendons (Figure 7B).
Neutral stance was determined for both groups and was found to be statistically similar between the groups (P = .44). Clinically diagnosed IAT participants had a neutral stance ankle angle of 2.74 ± 3.03 degrees of plantarflexion, whereas healthy participants had a neutral stance ankle angle of 1.43 ± 3.54 degrees of plantarflexion. Impingement identified by the curvature method occurred 7.73± 3.71 degrees before neutral stance in IAT tendons compared with 4.65 ± 3.71 degrees before neutral stance in healthy tendons. Although the angle from neutral stance to the impingement onset angle is statistically similar between groups (P = .12), the larger angle from neutral stance to the impingement onset angle in IAT tendons suggests that IAT tendons are more impinged at neutral stance.
The anterior-posterior thickness of the Achilles tendon insertion was also significantly greater in subjects with clinically diagnosed symptomatic IAT (P = .0047). The anterior-posterior thickness of the Achilles tendon insertion in IAT tendons was greater, with an average of 6.2 ± 1.68 mm, compared to the average of 3.79 ± 0.21 mm of healthy tendons (Figure 7C). Interestingly, impingement onset angle (measured using the curvature method) was moderately and significantly correlated with anterior-posterior thickness (R2 = 0.454, P < .05) (Figure 7D). The correlation was also significant when impingement onset angle was assessed using the visual inspection method (Supplemental Figure S1).
Angle of impingement identified by both methods was not significantly correlated with BMI or VISA-A score in IAT symptomatic participants (Figure 8A and B, Supplemental Figure S2). In contrast anterior-posterior thickness of the Achilles tendons was moderately and significantly correlated with BMI (R2 = 0.413, P < .05) (Figure 8C). However, the correlation between tendon thickness and VISA-A score was not significant (Figure 8D). There was also no correlation of key study measures (impingement onset angle or anterior-posterior thickness) with age (Supplemental Figure S3), indicating that age is not a contributing factor to impingement onset angle.
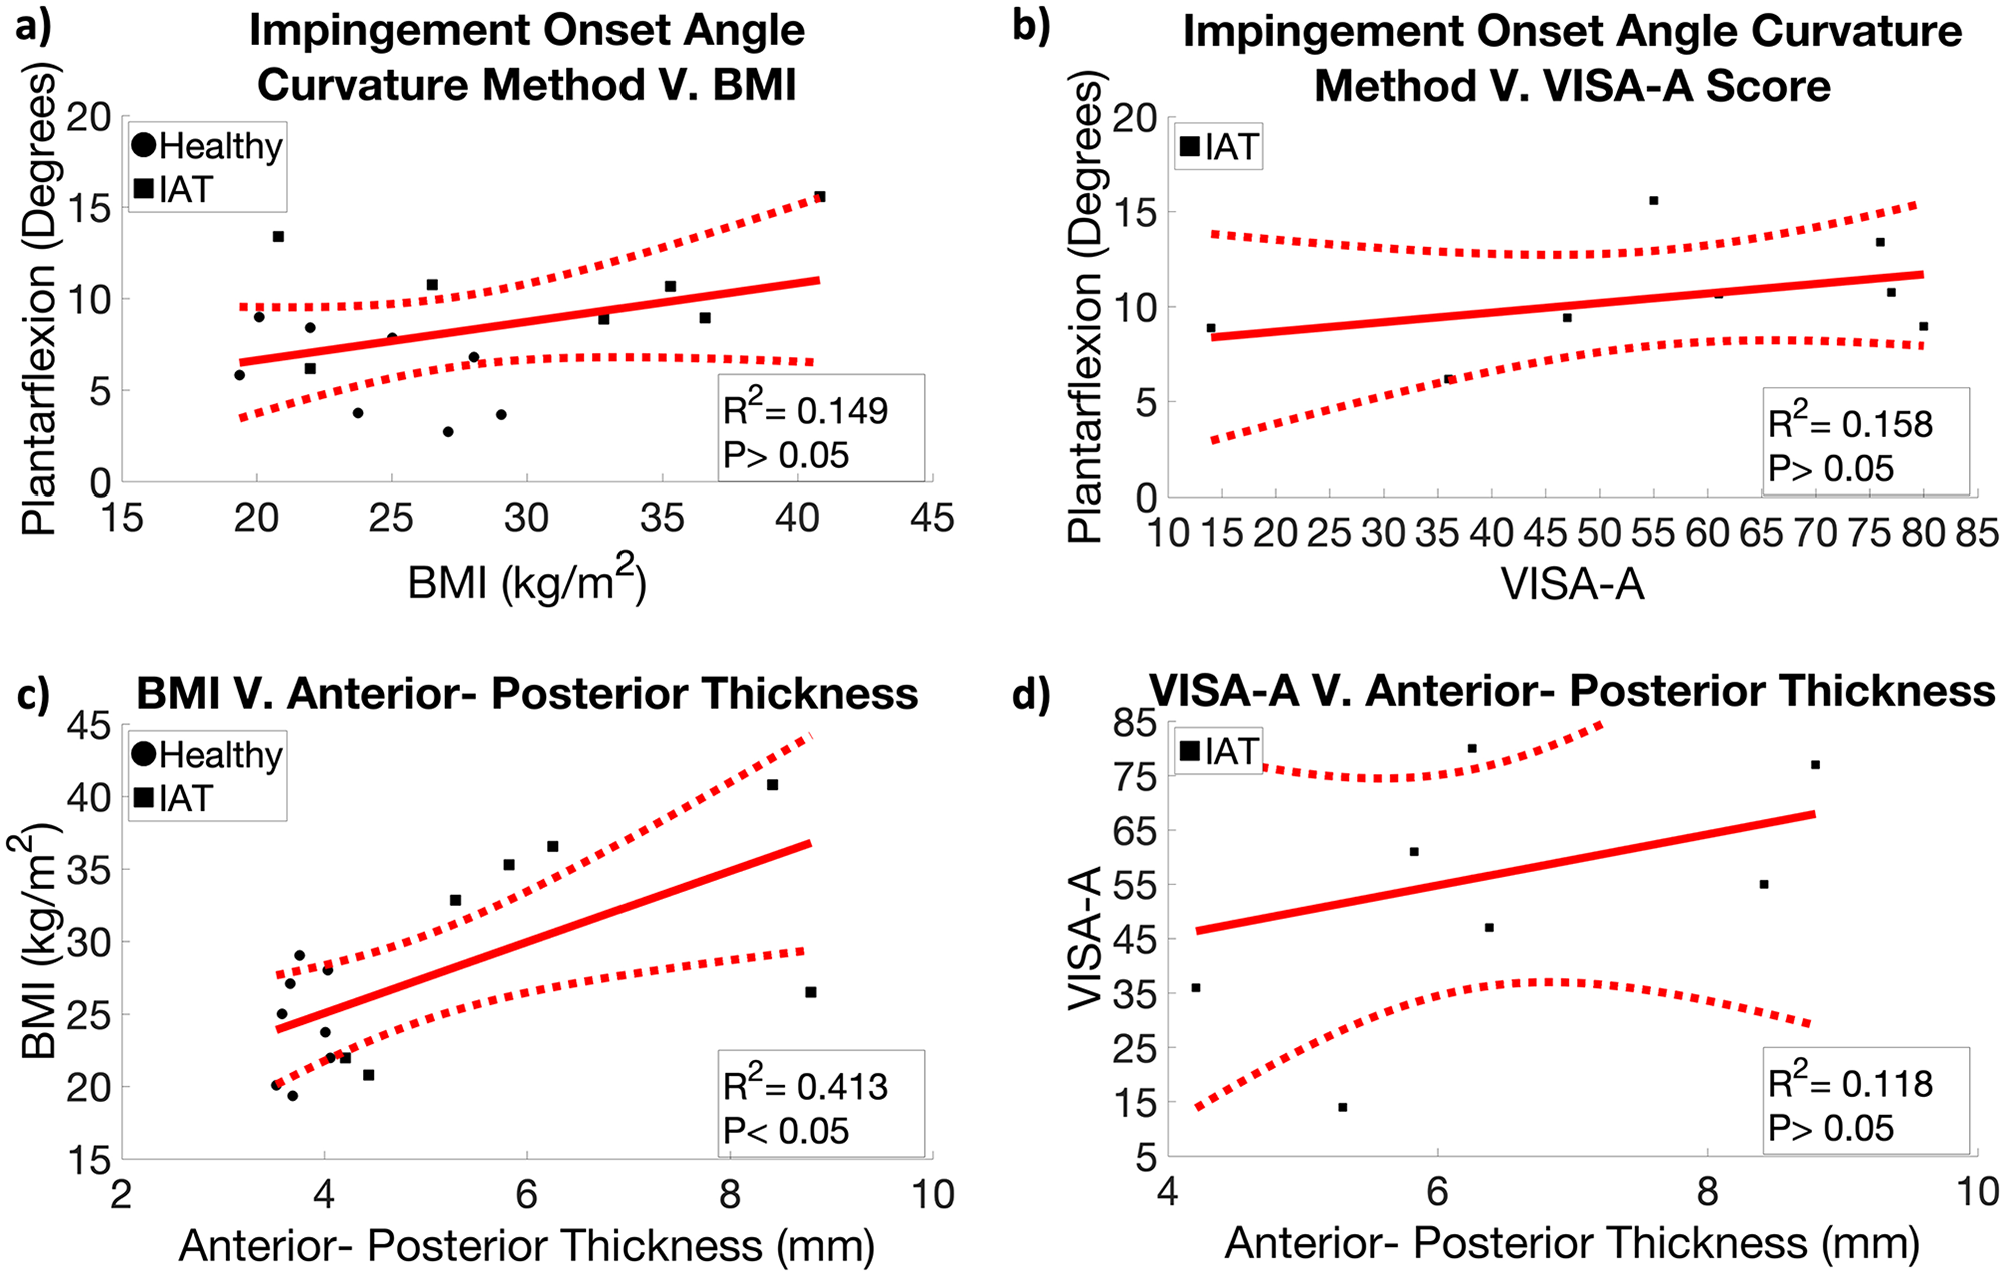
Relationship between curvature method identified impingement onset angle, A-P thickness, BMI, and VISA-A score. (A) Correlation of impingement onset angle with BMI for healthy and IAT subjects. (B) Correlation of impingement onset angle with VISA-A score for IAT subjects. (C) Correlation of A-P thickness with BMI from both groups. (D) Correlation of A-P thickness with VISA-A score for IAT subjects. The dotted lines indicate the 95% CIs of the linear regression. A-P, anterior-posterior; BMI, body mass index; IAT, insertional Achilles tendinopathy; VISA-A, Victorian Institute of Sport Assessment–Achilles Questionnaire.
Discussion
To our knowledge, this is the first study to establish methods to detect calcaneal impingement of the Achilles tendon and compare the impingement onset ankle angle between healthy individuals and individuals with clinically diagnosed IAT. We tested 2 methods of measuring the impingement onset angle (ie, the angle of ankle plantarflexion where impingement first occurs): a visual inspection method and a computation approach. The 2 methods were strongly significantly correlated, supporting their validity and reliability. Moreover, both methods demonstrated that calcaneal impingement of the Achilles tendon occurs earlier in a heel-lowering task (ie, at a larger angle of ankle plantarflexion) in patients with IAT compared to controls, supporting our hypothesis. Interestingly, the impingement onset angle was significantly correlated with the anterior-posterior thickness of the Achilles tendon insertion but not with BMI or age.
The finding that IAT subjects have larger impingement onset angles (as a consequence of having thicker tendons) is consistent with the concept that impingement plays a role in IAT.1,8,9 Since the Achilles tendon insertion is impinged at all ankle angles below the impingement onset angle, our results imply that IAT individuals experience impingement throughout a greater range of ankle angles. In fact, a limitation of this study was that 4 patients with IAT were excluded because we could not reach a comfortable ankle angle where the tendon was not impinged, suggesting impingement over their whole range of motion. The functional implication of these findings is that daily activities commonly repeated throughout the day, such as standing and walking, impose impingement against the tendon. Hence, enhanced impingement may help perpetuate IAT because of its downstream, mechanical, and biological effects.
Surprisingly, we have previously reported that transverse compressive strain in individuals with IAT is lower in multiple tasks (including heel lowering). 4 Taken together with the results of the current study, these findings imply that despite becoming impinged earlier in a heel-lowering task, IAT tendons are compressed less than healthy tendons. This apparent contradiction may be explained by the increased material stiffness (Young modulus) of IAT tendons. 2
According to our data, the cause of increased susceptibility to calcaneal impingement in IAT individuals appears to be tendon thickening. Consistent with previous studies, we found that IAT was associated with an increase in anterior-posterior tendon thickness. 7 Importantly, tendon thickness was significantly correlated with impingement onset angle such that subjects with greater tendon thickness experienced impingement earlier in the heel-lowering task (and therefore were impinged over a greater range of ankle motion). This finding may be explained by reduced tendon-calcaneus spacing in thicker tendons. In a healthy individual, the tendon is separated from the calcaneus by the retrocalcaneal bursa and the Kager fat pad. As the ankle dorsiflexes, the calcaneus approaches the tendon, compressing the bursa and pushing the fat pad proximally until the onset of impingement. However, if the tendon thickens (eg, due to IAT), the distance between the tendon and the calcaneus at a given ankle angle is reduced, making the tendon more vulnerable to impingement.
The correlation between the 2 impingement detection methods developed in this study (the visual inspection method and the curvature method) was strong and significant, demonstrating their reliability. However, the visual inspection method measured consistently larger (earlier) impingement onset angles (Figure 7). This discrepancy between the 2 methods is likely because in the visual inspection method, the anonymized user identifies the first frame where the calcaneus makes visual contact with the tendon. In contrast, the curvature method uses displacement tracking to identify when the curvature of the tendon reaches a critical value (0.001 mm−1). Because visual contact of the calcaneus and tendon generally precedes substantial alterations in tendon curvature, the curvature method is less sensitive than the visual inspection method. However, because the curvature method is fully automated, it is faster and less susceptible to human bias or human error. Nevertheless, it is important to note that both methods were able to detect significant changes in impingement onset angle between human and IAT subjects, supporting their utility.
This study is not without limitations. In particular, the sample size (n = 8 per group) was relatively small, and future work can examine generalizability about the typical range of ankle motion associated with Achilles impingement. The study began with a larger sample size (n = 12 per group), which was reduced due to limitations of some IAT participants. Ideally, all participants could have been placed into the same starting position of plantarflexion without contact between the calcaneus and the portion of the Achilles tendon that becomes impinged. However, it was difficult to ensure IAT participants could maintain the starting position and were not impinged at that position. Although this study was not able to find the angle of impingement for participants severely affected by IAT, angle of impingement was successfully identified in all healthy participants and IAT patients who could achieve a degree of plantarflexion in which they were not impinged. Importantly, the reduced sample size was still sufficiently large to test the central hypotheses of the study: that impingement onset angle was increased in IAT individuals and that impingement onset angle was significantly correlated with tendon thickness. That is, significant changes in impingement onset angle were successfully detected across groups, and a significant correlation between impingement onset angle and tendon thickness was identified. However, we may have been underpowered to detect correlations between impingement onset angle and clinical measures (eg, VISA-A score and BMI). Because of these concerns, we ran a power analysis to determine participant numbers needed to make statistically sound conclusions in future studies. It was found that to achieve a power of 0.8 with an alpha of 0.05, future studies would need at least 7 participants per group to determine differences in impingement onset angle and anterior-posterior thickness. It was also determined that 15 participants would be needed to effectively assess VISA-A and BMI. Although not definitive, the power analysis does suggest our study had a sufficiently large sample size to avoid type II error in our impingement onset angle and anterior-posterior thickness conclusions. In addition, the study groups were not age- or BMI-matched, which suggests that differences in impingement onset angle between groups may have been a result of these factors. Nevertheless, we observed no apparent relationship between impingement onset angle and age or BMI in our study cohort (Supplemental Figures S2 and S3), suggesting that the differences between healthy and IAT individuals were not driven by differences in age or BMI.
The findings of this study have important clinical implications. In particular, the increased vulnerability of IAT tendons to impingement suggests that conservative care for IAT should target attenuation of calcaneal impingement, possibly through reduction of tendon thickness or using a heel lift to reduce impingement during activities. Hence, the methods developed in this study to detect the onset angle of calcaneal impingement may be useful for monitoring clinical interventions for IAT patients. Tracking impingement would indicate if conservative care is working for the patient, providing a better metric for determining the need for surgical treatment to address impingement by either resecting posterior calcaneal prominence or decreasing tendon thickness. Future studies will track the correlation between changes in this metric and clinical outcomes for IAT individuals, using the necessary sample sizes for impingement onset angle, anterior-posterior thickness, and clinical metrics determined from the power analysis in the current study.
Supplemental Material
sj-jpg-1-fai-10.1177_10711007211069570 – Supplemental material for Impingement in Insertional Achilles Tendinopathy Occurs Across a Larger Range of Ankle Angles and Is Associated With Increased Tendon Thickness
Supplemental material, sj-jpg-1-fai-10.1177_10711007211069570 for Impingement in Insertional Achilles Tendinopathy Occurs Across a Larger Range of Ankle Angles and Is Associated With Increased Tendon Thickness by Anthony N. Aggouras, Ruth L. Chimenti, A. Samuel Flemister, John Ketz, Laura C. Slane, Mark R. Buckley and Michael S. Richards in Foot & Ankle International
Supplemental Material
sj-jpg-2-fai-10.1177_10711007211069570 – Supplemental material for Impingement in Insertional Achilles Tendinopathy Occurs Across a Larger Range of Ankle Angles and Is Associated With Increased Tendon Thickness
Supplemental material, sj-jpg-2-fai-10.1177_10711007211069570 for Impingement in Insertional Achilles Tendinopathy Occurs Across a Larger Range of Ankle Angles and Is Associated With Increased Tendon Thickness by Anthony N. Aggouras, Ruth L. Chimenti, A. Samuel Flemister, John Ketz, Laura C. Slane, Mark R. Buckley and Michael S. Richards in Foot & Ankle International
Supplemental Material
sj-jpg-3-fai-10.1177_10711007211069570 – Supplemental material for Impingement in Insertional Achilles Tendinopathy Occurs Across a Larger Range of Ankle Angles and Is Associated With Increased Tendon Thickness
Supplemental material, sj-jpg-3-fai-10.1177_10711007211069570 for Impingement in Insertional Achilles Tendinopathy Occurs Across a Larger Range of Ankle Angles and Is Associated With Increased Tendon Thickness by Anthony N. Aggouras, Ruth L. Chimenti, A. Samuel Flemister, John Ketz, Laura C. Slane, Mark R. Buckley and Michael S. Richards in Foot & Ankle International
Supplemental Material
sj-pdf-1-fai-10.1177_10711007211069570 – Supplemental material for Impingement in Insertional Achilles Tendinopathy Occurs Across a Larger Range of Ankle Angles and Is Associated With Increased Tendon Thickness
Supplemental material, sj-pdf-1-fai-10.1177_10711007211069570 for Impingement in Insertional Achilles Tendinopathy Occurs Across a Larger Range of Ankle Angles and Is Associated With Increased Tendon Thickness by Anthony N. Aggouras, Ruth L. Chimenti, A. Samuel Flemister, John Ketz, Laura C. Slane, Mark R. Buckley and Michael S. Richards in Foot & Ankle International
Footnotes
Declaration of Conflicting Interests
The author(s) declared the following potential conflicts of interest with respect to the research, authorship, and/or publication of this article. ICMJE forms for all authors are available online.
Funding
The author(s) disclosed receipt of the following financial support for the research, authorship, and/or publication of this article: Ruth L. Chimenti, DPT, PhD, and Mark R. Buckley, PhD, report grant R01 AR070765 from the National Institutes of Health, US Department of Health and Human Services.
Supplemental Material
Supplementary material is available online with this article.
References
Supplementary Material
Please find the following supplemental material available below.
For Open Access articles published under a Creative Commons License, all supplemental material carries the same license as the article it is associated with.
For non-Open Access articles published, all supplemental material carries a non-exclusive license, and permission requests for re-use of supplemental material or any part of supplemental material shall be sent directly to the copyright owner as specified in the copyright notice associated with the article.