
Abstract
Background:
Stress-view radiographs are frequently obtained to evaluate supination-external rotation (SER) variant ankle fractures. Measurement of the ankle medial clear space (MCS) is a surrogate of medial structure integrity as part of overall ankle stability. Measurement of the lateral talus displacement with respect to the incisura may be a sensitive and specific method to assess joint subluxation.
Methods:
Retrospective review of acute SER-variant isolated lateral malleolar fractures with gravity stress views (GSVs) were performed for 103 patients. GSV analysis was performed with standardized measurements of the MCS, superior clear space (SCS), and 2 new novel measurements of lateral talus subluxation (LTS). Decision for surgery was obtained by surgeons who reviewed masked injury radiographs for predictive performance analysis of the LTS vs MCS.
Results:
MCS, SCS, and LTS measurements were performed on 103 patients. Mean MCS, SCS, and LTS within the operative group was increased. MCS ≥5 mm and LTS >4 mm had equal sensitivity (95%), with higher specificity for LTS (75% vs 60%). Receiver operating characteristic analysis demonstrates an area under the curve of 0.786 for MCS ≥5 mm vs 0.918 for LTS >4 mm.
Conclusion:
We found LTS to be superior to MCS for medial ankle structure stability on gravity stress views of SER-variant ankle fractures. We propose this as a useful tool for clinicians to consider when evaluating SER-variant ankle fractures.
Level of Evidence:
Level II, prospective comparative study of radiographs.
Keywords
Background
Ankle fractures are a common injury that are evaluated and treated by orthopaedic surgeons. 17 Millimeter measurements of joint subluxation after healing of the fracture can cause changes to intra-articular ankle contact pressure distribution that may predispose the patient to ankle joint pain, dysfunction, and posttraumatic arthritis. 18 Instability translation of the talus within the ankle mortise may be considered as an indication for surgical stabilization to maximize patient outcome. 1
Supination-external rotation (SER) variants are the most common Lauge-Hansen subtype of ankle fracture.1,21 With isolated fibula fracture, as is common in SER variants, ankle joint stability may be dependent on remaining medial soft tissue structure and syndesmotic integrity to maintain the talus in a reduced position under the tibial plafond. The displacement pattern of the talus is described as lateral translation and valgus tilt, with components of external rotation and posterior translation as well. The medial soft tissue structures, such as the deltoid ligamentous complex, are thought to restrain the talus from this injury pattern.1,7 Many methods have been developed to determine the integrity of the medial ankle restraints for the bimalleolar equivalent SER ankle fracture. Imaging techniques include the gravity stress view (GSV), manual stress view (MSV), weightbearing stress view (WBSV), ultrasonography, magnetic resonance imaging (MRI), and weightbearing CT scan (WBCT).3,10,14,16 The radiographic techniques assess the medial clear space (MCS) to evaluate if there is compromise of the medial restraints allowing gap formation within the medial gutter (Figure 1). The MCS measurement has been shown to have significant variability based on measurement error, interobserver variability, and poor quality of the radiograph acquisition itself. MCS >4-5 mm on a stress radiograph is thought to represent suspected medial structure incompetence.4,5,11 The MCS measurement cutoff value for appropriate sensitivity and specificity is not without controversy given that cadaveric studies have demonstrated that the deep deltoid can be intact in patients with MCS up to 5 mm. 9 Attempts have been made to improve sensitivity by evaluating the MCS as a ratio to the superior clear space (SCS). 13 Most authors agree that any increase in MCS >4-5 mm, or a ratio of MCS:SCS >1.2 is suggestive of medial structure compromise. Gougoulias et al 7 have also identified that there exists SER variants with an elevated MCS on GSVs with anatomical reduction occurring on WBSV. These have been denoted as SER4a as the patient may have enough of the posterior portion of the deep deltoid intact to achieve a functional reduction with casting in a weightbearing position. This is an important finding as these patients can likely be successfully treated nonoperatively. 8
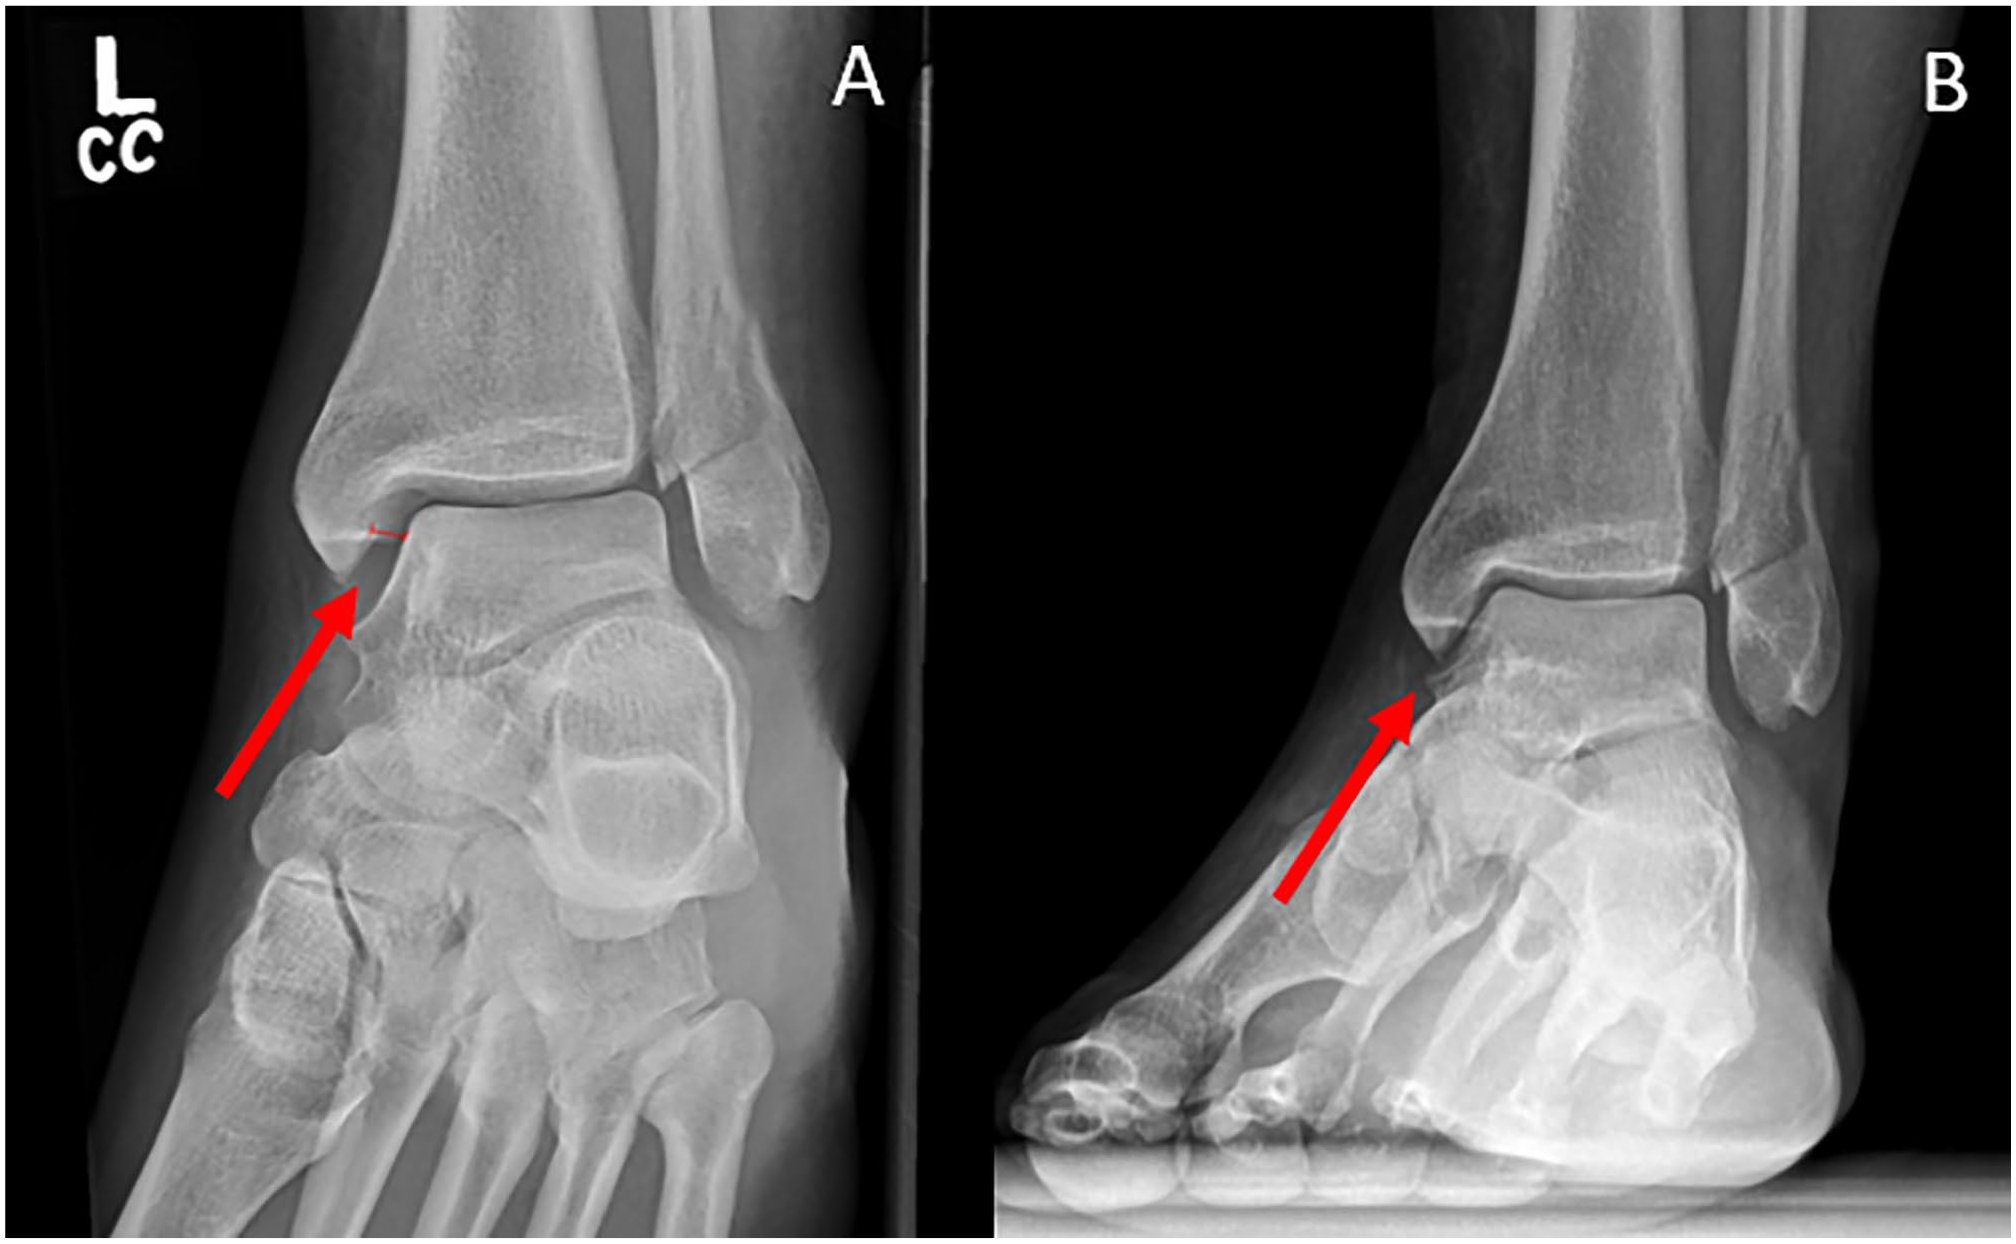
SER4a variant ankle fracture with demonstration of ankle stress views. Panel A is a gravity external rotation stress view, and panel B is the same patient experiencing reduction on a weightbearing stress view.
We hypothesized that the lateral side of the talus, and lateral migration of the talus when viewed on mortise or stress-view images, will be a more sensitive measurement tool for change as the talus in these injuries. The talus is not simply posterolaterally translating but is also undergoing an external rotation deformity. We propose that a more sensitive measurement tool would be to use and compare its position to known landmarks on the tibia as a reference with a new measurement: lateral talar subluxation (LTS).
Methods
This study is an IRB-approved retrospective review of patients identified via a search of radiographic data for all ankle GSVs obtained within our medical system over a consecutive 3-year period from 2018 to 2021. Patients were identified by reviewing an internal database for radiographic ankle series containing a stress view. 13 A priori power analysis demonstrates that we would need 32 subjects to have adequate power to detect 0.1-mm difference from a mean of 3.2 mm (a = 0.05, b = 0.2), according to historical normative data published by Pitakveerakul et al. 13 Images of isolated fibula fractures fitting the SER fibula fracture pattern were included. GSVs are obtained on almost all isolated joint-level fibula fractures presenting acutely in the outpatient clinic or emergency department by midlevel and nonorthopaedic providers. GSVs were selected based on their increased number of studies relative to WBSV. WBSV are not frequently obtained at our treatment center and were excluded. Clinical and demographic data are described in Table 1 regarding the patients within this subset. An internal PACS system (Visage, Rochester, MN) measurement tool was used to perform measurements on these radiographs by foot and ankle fellowship-trained orthopaedic surgeons and musculoskeletal radiologists. The measurements were performed in equal amounts and repeated at separate time points to account for intraobserver and interobserver measurement error. Interobserver consistency was measured by having 2 observers, both measuring a subset of 24 patients, and intraobserver comparison was identified by remeasuring a random order sample of the same 24 patients 12 weeks later. Measurements were obtained of the MCS, SCS, and 2 novel measurements of the LTS in reference to the anterior and medial edge of the syndesmosis on the tibia (Figure 2). Measurement of the MCS, SCS, and LTS was performed in a standardized fashion by all observers following scripted behavior (Figure 2), with a technique matching those of prior studies examining the MCS. 13 Images were zoomed to 300%. The MCS was measured as previously described as a distance measurement between the posterolateral medial malleolus and the posteromedial talus in the medial ankle gutter 4 mm inferior to the tibial plafond. The SCS was measured at the midpoint of the ankle joint as described by Beumer. 2 The LTS measurement was made by identifying 2 landmarks: the vertical line denoting the anterolateral rim of the ankle syndesmosis and the lateral edge of the talar dome. Lines were drawn on each portion. If these 2 lines were continuous, a dichotomous yes/no measurement was identified. When not continuous, thus denoting possible subluxation, the horizontal distance between the edge of the syndesmosis and the lateral wall of the talus was measured. Measurements are reported in millimeters to one-tenth of a millimeter for all continuous variables (Figure 3).
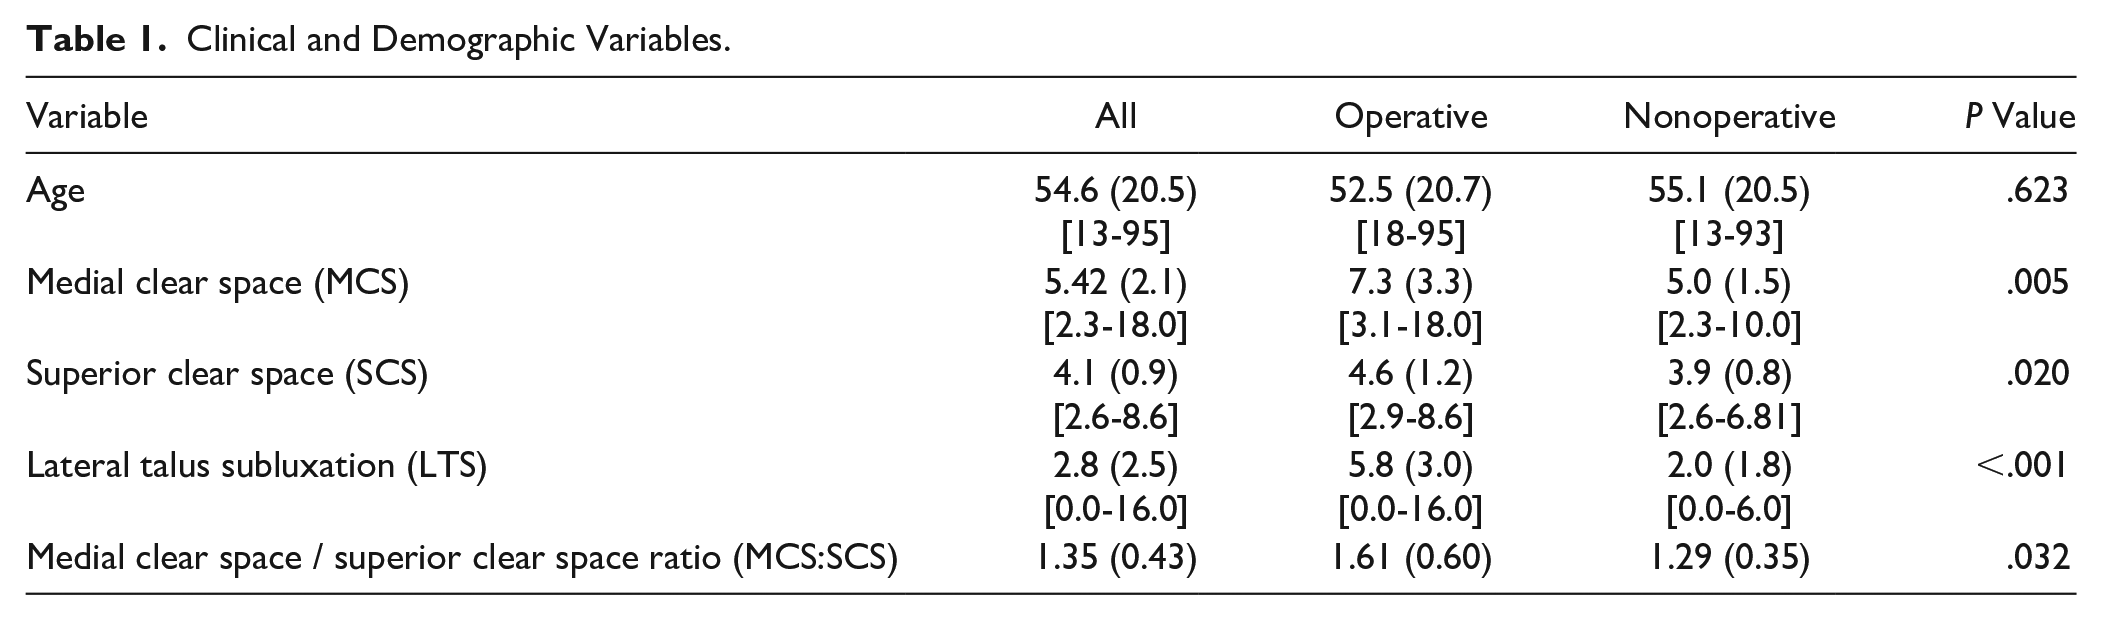
Clinical and Demographic Variables.
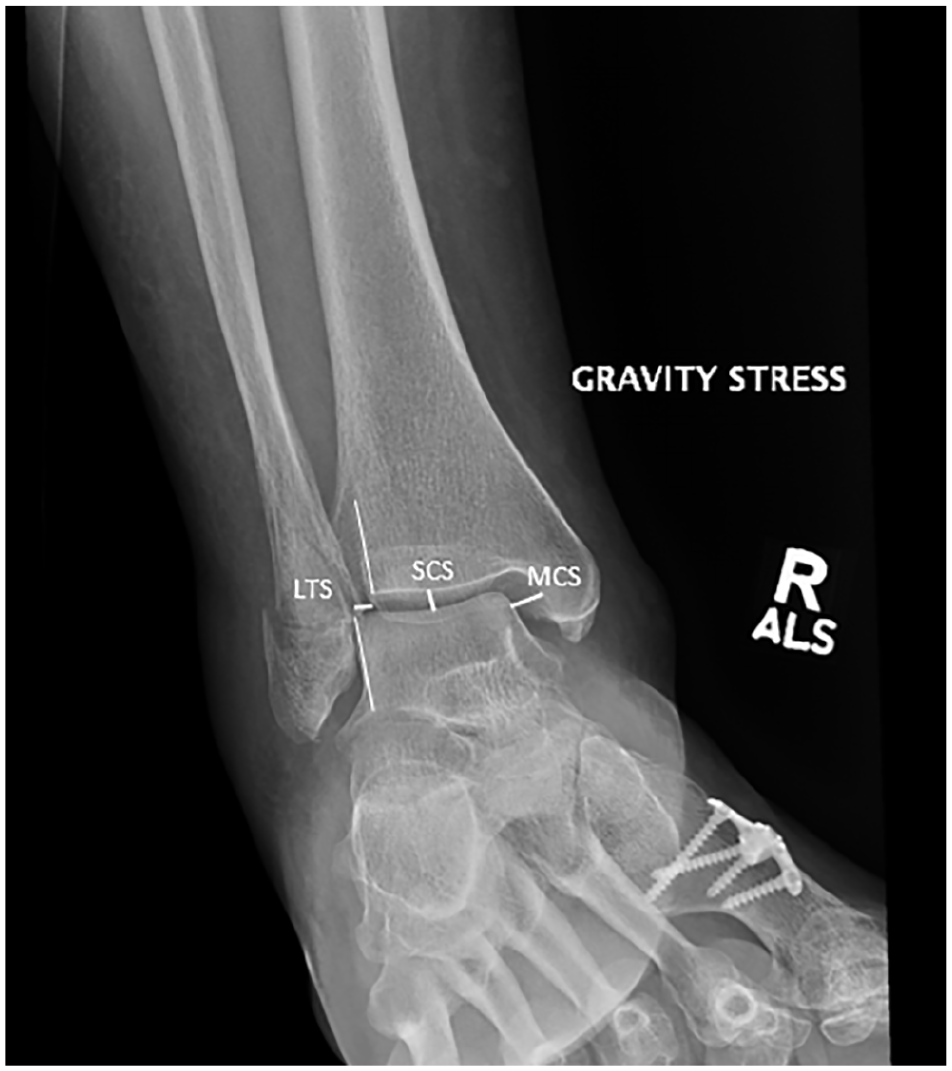
GSV radiograph demonstrating the measurement locations for the MCS, SCS, and LTS measurement. GSV, gravity stress view; LTS, lateral talus subluxation; MCS, medial clear space; SCS, superior clear space.
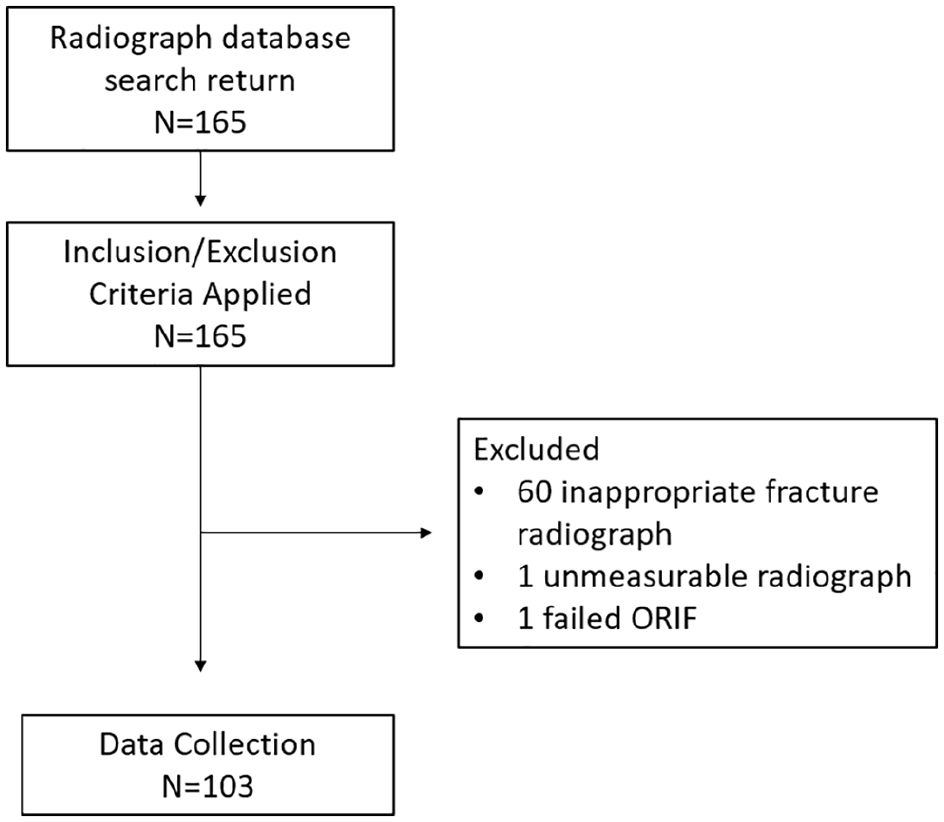
Inclusion and exclusion criteria.
To identify a standard for comparisons of surgical decision making using the MCS, SCS, and LTS measurements, 2 foot-and-ankle fellowship-trained specialist orthopaedic surgeons who were masked to measurement data were separately asked to review the 103 obtained injury radiographs including the stress view. Patients for whom surgery would be indicated based on radiographic data alone were then recorded as a dichotomous yes/no answer. GSVs, but not WBSVs, are routinely acquired throughout the health system in the setting of acute ankle fracture, and thus only GSVs are included in this study. Surgery was indicated for SER4-variant ankle fractures with compromised ankle joint stability as demonstrated by significant joint incongruency from talus subluxation, valgus tilt, and fibular fracture displacement based on the surgeon’s clinical judgment. Only cases where both surgeons achieved consensus were included. Receiver operating characteristic (ROC) analysis was used to determine the sensitivity and specificity of the LTS for surgical decision making. Statistics were analyzed using SPSS, version 5. Correlations between the MCS, MCS:SCS ratio, and LTS measurements are reported as Pearson and Spearman correlation with P values (Table 2). Confusion matrices were to describe sensitivity, specificity, negative and positive predictive value, negative and positive likelihood ratios of the MCS, MCS:SCS ratio, and LTS measurements (Table 3). ROC curves were constructed to analyze decision performance using the MCS, MCS:SCS ratio, and LTS measurements (Figure 4). DeLongs test was used to calculate the P values for ROC analysis. The LTS measure can be zero, but it may also be nonzero in an uninjured ankle because of patient morphology such as a native valgus bend of the distal fibula. Thus, similar to the MCS measurement, we have selected LTS >4 mm as an appropriate cutoff to maximize sensitivity and specificity that represents abnormal lateral subluxation of the talus.
Correlations. a
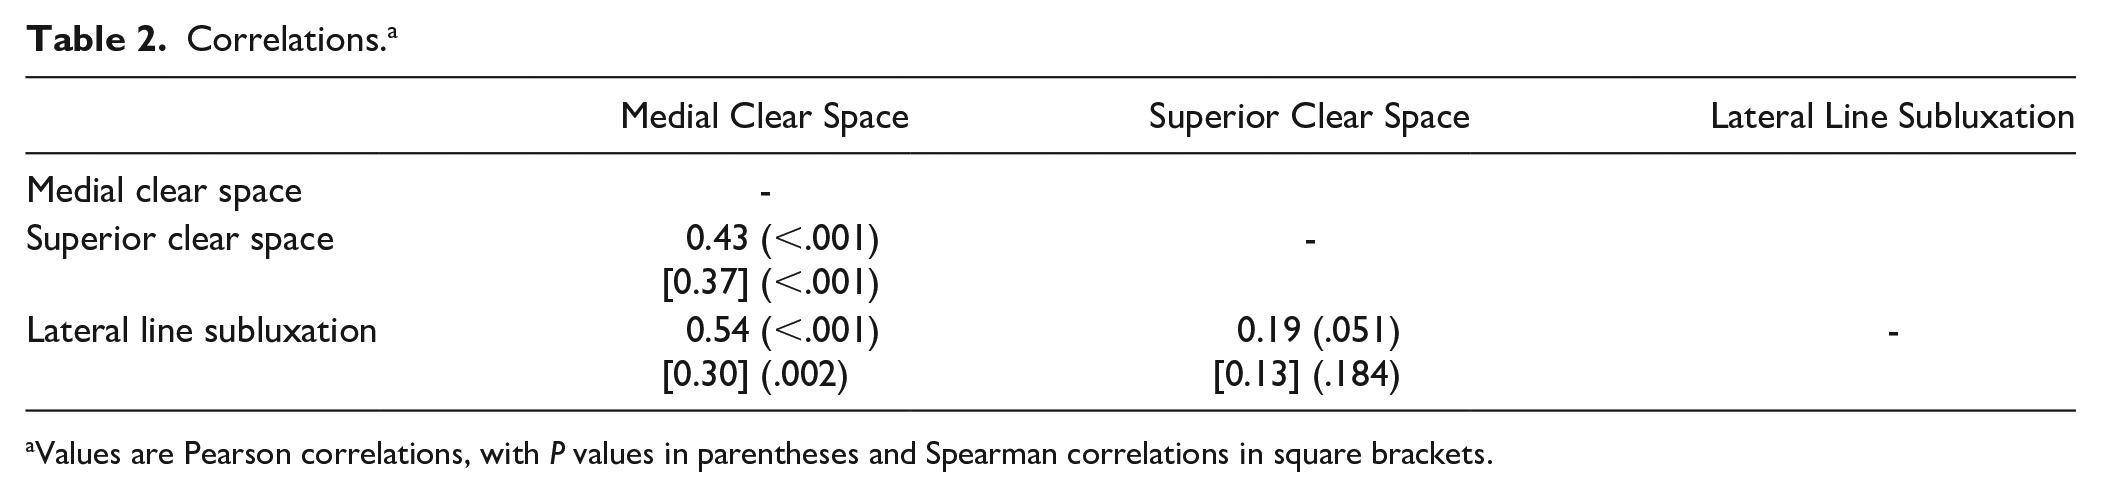
Values are Pearson correlations, with P values in parentheses and Spearman correlations in square brackets.
Confusion Matrices for Medial Clear Space, Superior Clear Space, and Lateral Talar Subluxation.
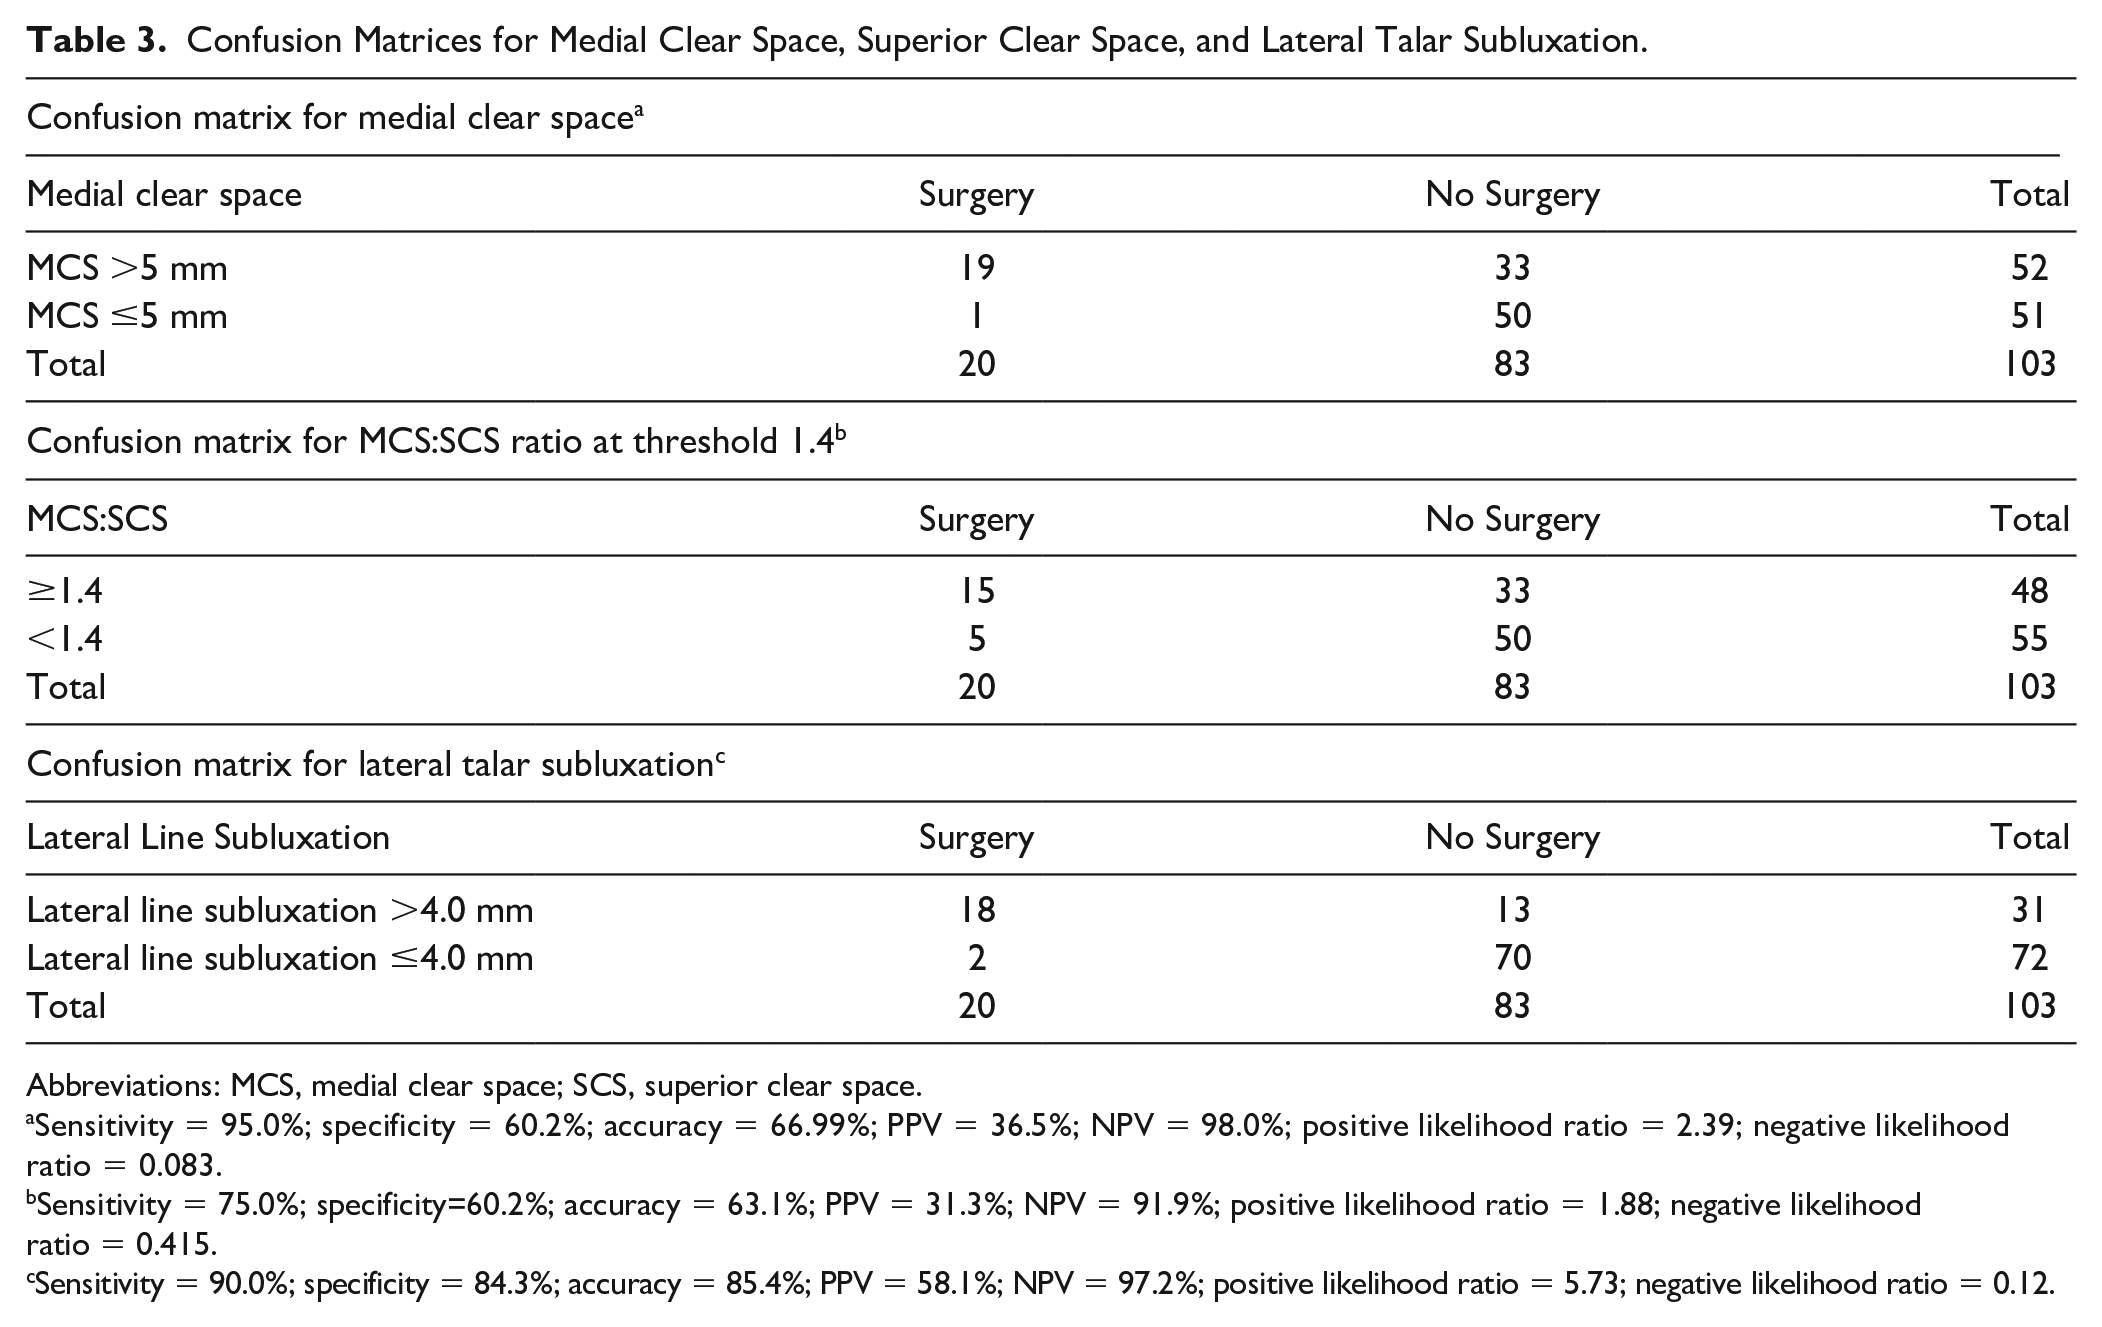
Abbreviations: MCS, medial clear space; SCS, superior clear space.
Sensitivity = 95.0%; specificity = 60.2%; accuracy = 66.99%; PPV = 36.5%; NPV = 98.0%; positive likelihood ratio = 2.39; negative likelihood ratio = 0.083.
Sensitivity = 75.0%; specificity=60.2%; accuracy = 63.1%; PPV = 31.3%; NPV = 91.9%; positive likelihood ratio = 1.88; negative likelihood ratio = 0.415.
Sensitivity = 90.0%; specificity = 84.3%; accuracy = 85.4%; PPV = 58.1%; NPV = 97.2%; positive likelihood ratio = 5.73; negative likelihood ratio = 0.12.
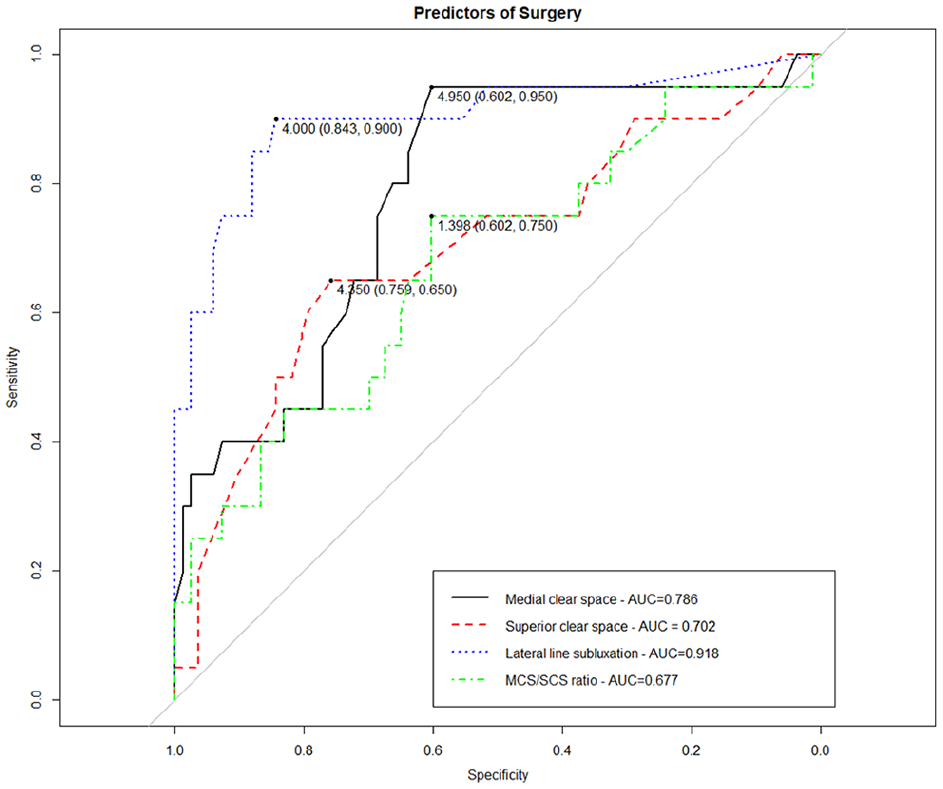
Receiver operating characteristic (ROC) analysis of MCS vs SCS vs LTS, with LTS showing the highest area under the curve (AUC) demonstrating superior predictive performance. LTS, lateral talus subluxation; MCS, medial clear space; SCS, superior clear space.
Results
Demographic and clinical data review demonstrate an overall mean age of 55 years with no significant difference noted in the groups who were determined to be surgical or nonsurgical candidates (Table 1). Sixty-two patients were excluded as they were inappropriately ordered radiographic assessments, leaving 103 ankle GSV radiographs for analysis (Figure 2). The MCS, SCS, and LTS measurements were compared between groups, and there was a statistically significant increase in mean MCS, the MCS:SCS ratio, and LTS within the operative group (MCS 7.3 vs 5, P = .005, MCS:SCS 1.61 vs 1.29, P = .03, LTS 6.1 vs 2.9, P < .001).
Pearson correlation analysis demonstrated positive and statistically significant correlations between MCS and SCS (0.43 and 0.37, respectively, P < .001), and MCS and LTS (0.51, P < .001). The correlation between LTS and SCS was not statistically significant (0.19, P = .094).
Confusion matrices (Table 3) identify the sensitivity and specificity of MCS, MCS:SCS ratio, and LTS measurements in comparison to the patients for whom surgery is indicated. MCS ≥5 mm had a sensitivity of 95% and specificity of 60% in our cohort, with LTS >4 mm demonstrating the same sensitivity (95%) with specificity of 75%. MCS:SCS ratio sensitivity and specificity was 75% and 60%, respectively. ROC analysis for MCS:SCS, MCS, and LTS as predictor for surgery demonstrates an increasing area under the curve (AUC) as 0.68, 0.79, and 0.92 for MCS:SCS, MCS, and LTS, respectively. LTS as a categorical yes/no demonstrated an AUC of 0.656. The confusion matrices were also repeated using only the data from the surgeon (G.S.) unaware of the LTS concept to attempt to address possible confounding. The AUC findings for the MCS:SCS, MCS, and LTS, respectively, were 0.632, 0.72, and 0.811, demonstrating similar findings. LTS elevation as a predictor for surgery had P <.001 in comparison to an MCS >5 elevation of P = .004. Measurement sensitivity for MCS vs LTS using only this data set was 82.1% vs 67.9%. Measures specificity for MCS vs LTS was 77.3% vs 89.3%. Notably, the LTS has increased specificity and decreased sensitivity in this data set compared with the combined data set.
Univariate and multivariate logistic regression demonstrate that MCS and LTS are predictors of surgical treatment with MCS odds ratio of 1.09 (P < .001) and LTS odds ratio 1.12 (P < .001).
Measurement of the LTS and MCS was used for intra- and interobserver consistency. Intraclass correlation coefficient (ICC) for continuous variables was calculated. Intraobserver consistency for LTS and MCS was 0.87 (P < .001, 95% CI 0.73-0.94) and 0.90 (P < .001, 95% CI 0.81-0.97), respectively. Interobserver consistency for LTS and MCS was 0.68 (P < .001, 95% CI 0.39-0.84) and 0.58 (95% CI 0.25-0.8, P < .001), respectively.
Discussion
In this series, we found the LTS measurement to be a better measure than the MCS or MCS:SCS ratio to identify patients who underwent surgical treatment for an SER 2 or 4a ankle fracture. Talus external rotation, lateral and posterior translation, and valgus tilt are all known to occur with the SER-variant ankle fracture. By measuring the LTS line, observations are made at a point directly related to the position of the talus as it pivots, and undergoes translational and angular displacement. Increase in MCS measurement ≥5 mm has been correlated with ankle instability in prior reports as well as within this analysis; however, the MCS measurement is suboptimal by nature of measuring farther away from the point of maximal displacement. The increase in overall accuracy of the LTS in comparison to MCS measurement may be due to the measurement occurring at the point of higher translational and rotational motion.
The focus on MCS measurement could be flawed by its focus on medial ankle restraint integrity and the medial side of the joint. Prior reports have demonstrated that the deep deltoid ligament may remain intact with MCS >4 mm and even to 6-7 mm, and thus the focus on the medial structure integrity as the indicator for surgery may be overestimated.19,20 We argue that the measurement of the clear space that forms within the ankle’s medial gutter is not important, but rather of importance is the lateral subluxation of the talus within the mortise that creates the increased medial clear space. The nuanced decision making exhibited to differentiate SER4 variants from SER2 requires the most sensitive and accurate decision tools available to the clinician. Thus, we present results of the LTS measurement as a potentially superior clinical tool than the MCS.
With specific regard to the LTS measurement, we compared the lateral edge of the talus to the anterolateral corner of the tibial syndesmosis when viewed on GSV radiographs. Twenty-eight of 103 patients had 0 mm of subluxation (ie, a perfect continuous line from the syndesmotic line down the lateral side of the talus; Figure 4). Recent literature has supported the use of measuring from the lateral side of the ankle to identify ankle joint instability. 6 None of these patients were within the surgery group, and we propose this measurement shows that a continuous line along the lateral talus and syndesmotic rim represents an anatomically reduced talus. A normative value of LTS and the difference between the anterolateral rim of the incisura and lateral wall of the talus will need to be established. This relationship may be superior to the MCS. However, there is the possibility of patients with an increased valgus bend of the distal fibula at the lateral ankle gutter or increased talar width, which may confound this measurement by causing a false elevation of the measurement. We accounted for this by setting 4 mm as the cutoff for lateral talar subluxation. The improved sensitivity and specificity of the LTS continuous measurement >4 mm compared to the LTS dichotomous measure confirms the use of a cutoff higher than 0. Further work should be performed to validate the cut-off threshold for sensitivity and specificity of the LTS clinically.
It is unknown how the sagittal plane positioning of the talus during the radiograph could affect this measurement, as a more plantarflexed talus would be relatively more narrow on a mortise image because of the trapezoidal bony architecture of the talus. Prior studies have shown small changes with this phenomenon in regard to the MCS measurement, with statistical significance only occurring in measurements between the 2 most extreme sagittal positions studied (0 and 45 degrees of plantarflexion), with arguable clinical significance of the values.12,15 Given the small changes at the MCS, it could be expected that likely small changes would also occur at the LTS measurement with unknown effect on their significance. However, we doubt that this information invalidates the LTS as it provides more accurate reference points for an externally rotating, translating talus than measurement of the medial clear space. The same sort of inconsistencies would have occurred in this cohort where MCS was also measured. Further, regarding measurement error, the radiographs obtained in our study as well as commonly in clinical practice are not calibrated. The MCS:SCS ratio was evaluated as well as a secondary measure to account for calibration-related errors, and the LTS was found to be more accurate than the MCS:SCS ratio. The LTS measurement may technically be a misnomer as the positional changes are 3-dimensional, not 2-dimensional.
The clinical application of usage of LTS measurement data should be considered in the same manner as MCS data. Readers should note that recent publications have identified that treatment decisions based on GSV radiographs may overestimate the number of patients requiring surgery. We believe this highlights the importance of identifying the most accurate measurement tools available for clinicians. The surgeon’s decision for surgery can be nuanced and individualized. Multiple other factors can be used in addition to the MCS or LTS such as valgus tilt of the talus, fibular shortening, or fibular displacement.
This study encounters limitations inherent to a retrospective study design. Identifying patients via review of the radiographic database identified a large number of radiographs requiring exclusions that were unnecessary and nonindicated stress-view ankle studies. These inappropriate stress view studies highlight the importance of provider education in the emergency department or walk-in clinic setting prior to specialist orthopaedic surgery referral. Furthermore, the utility of WBSV measurements was not considered.
Our study asked foot and ankle fellowship-trained orthopaedic surgeons to decide for whom surgery was indicated based on masked review of radiographic studies obtained at the time of injury where the surgeons were unaware of the study measurements. One author (E.H.) was aware of the LTS concept at the conception of the study that introduces the possibility of confounding. To examine the influence of confounding, we repeated the analysis excluding this author’s measurements and noted that the LTS continued to demonstrate high sensitivity and specificity and improved ROC AUC in comparison to preexisting MCS and MCS:SCS measurements.
This study is an evaluation of a measurement with a tool that can assist the decision for conservative vs surgical treatment. No clinical data were included in the study as the images were reviewed for candidacy of surgery based on the experience of the surgeons in their practice.
Conclusion
Supination external rotation bimalleolar equivalent ankle fractures are a common injury presenting in the orthopaedic surgery practice. The GSV ankle radiograph is frequently obtained to evaluate the ankle joint stability and medial structure restraint integrity with assessment of the MCS and SCS. The measurement of lateral talar subluxation (LTS) was examined as a useful additional tool. Radiographic data within this study demonstrate that the LTS measurement was associated with improved specificity compared with the MCS for patients with SER-variant ankle fractures. This study demonstrates the LTS is a promising radiographic finding that may be used as an adjunct to determine surgical treatment for SER-variant ankle fractures.
Supplemental Material
sj-docx-3-fai-10.1177_10711007221119162 – Supplemental material for Measuring Deltoid Insufficiency After Supination-External Rotation Ankle Fracture With Lateral Talar Subluxation on Gravity Stress View
Supplemental material, sj-docx-3-fai-10.1177_10711007221119162 for Measuring Deltoid Insufficiency After Supination-External Rotation Ankle Fracture With Lateral Talar Subluxation on Gravity Stress View by Edward T. Haupt, Ronnie Sebro, Jose M. Iturregui, Rupert Stanborough, Ali Siddiqui and Glenn G. Shi in Foot & Ankle International
Supplemental Material
sj-jpg-2-fai-10.1177_10711007221119162 – Supplemental material for Measuring Deltoid Insufficiency After Supination-External Rotation Ankle Fracture With Lateral Talar Subluxation on Gravity Stress View
Supplemental material, sj-jpg-2-fai-10.1177_10711007221119162 for Measuring Deltoid Insufficiency After Supination-External Rotation Ankle Fracture With Lateral Talar Subluxation on Gravity Stress View by Edward T. Haupt, Ronnie Sebro, Jose M. Iturregui, Rupert Stanborough, Ali Siddiqui and Glenn G. Shi in Foot & Ankle International
Supplemental Material
sj-pdf-1-fai-10.1177_10711007221119162 – Supplemental material for Measuring Deltoid Insufficiency After Supination-External Rotation Ankle Fracture With Lateral Talar Subluxation on Gravity Stress View
Supplemental material, sj-pdf-1-fai-10.1177_10711007221119162 for Measuring Deltoid Insufficiency After Supination-External Rotation Ankle Fracture With Lateral Talar Subluxation on Gravity Stress View by Edward T. Haupt, Ronnie Sebro, Jose M. Iturregui, Rupert Stanborough, Ali Siddiqui and Glenn G. Shi in Foot & Ankle International
Footnotes
Acknowledgements
Devon Foster and Luis Isaza are recognized for their efforts assisting with data collection for this study.
Declaration of Conflicting Interests
The author(s) declared no potential conflicts of interest with respect to the research, authorship, and/or publication of this article. ICMJE forms for all authors are available online.
Funding
The author(s) received no financial support for the research, authorship, and/or publication of this article.
Supplemental Material
Supplementary material is available online with this article.
References
Supplementary Material
Please find the following supplemental material available below.
For Open Access articles published under a Creative Commons License, all supplemental material carries the same license as the article it is associated with.
For non-Open Access articles published, all supplemental material carries a non-exclusive license, and permission requests for re-use of supplemental material or any part of supplemental material shall be sent directly to the copyright owner as specified in the copyright notice associated with the article.