
Abstract
Background:
Machine learning (ML) is increasingly used to predict the prognosis of numerous diseases. This retrospective analysis aimed to develop a prediction model using ML algorithms and to identify predictors associated with the recurrence of hallux valgus (HV) following surgery.
Methods:
A total of 198 symptomatic feet that underwent chevron osteotomy combined with a distal soft tissue procedure were enrolled and analyzed from 2 independent medical centers. The feet were grouped according to nonrecurrence or recurrence based on 1-year follow-up outcomes. Preoperative weightbearing radiographs and immediate postoperative nonweightbearing radiographs were obtained for each HV foot. Radiographic measurements (eg, HV angle and intermetatarsal angle) were acquired and used for ML model training. A total of 9 commonly used ML models were trained on the data obtained from one institute (108 feet), and tested on the other data set from another independent institute (90 feet) for external validation. Optimal feature sets for each model were identified based on a 2000-resample bootstrap-based internal validation via an exhaustive search. The performance of each model was then tested on the external validation set. The area under the curve (AUC), classification accuracy, sensitivity, and specificity of each model were calculated to evaluate the performance of each model.
Results:
The support vector machine (SVM) model showed the highest predictive accuracy compared to other methods, with an AUC of 0.88 and an accuracy of 75.6%. Preoperative hallux valgus angle, tibial sesamoid position, postoperative intermetatarsal angle, and postoperative tibial sesamoid position were identified as the most selected features by several ML models.
Conclusion:
ML classifiers such as SVM could predict the recurrence of HV (an HVA >20 degrees) at a 1-year follow-up while identifying associated predictors in a multivariate manner. This study holds the potential for foot and ankle surgeons to effectively identify individuals at higher risk of HV recurrence postsurgery.
Introduction
Hallux valgus (HV) recurrence commonly occurs after surgical correction of the HV deformity. 32 The rates of HV recurrence following surgical intervention involving proximal metatarsal osteotomy vary.9,23,27,40,43,45 Prominent risk factors contributing to the recurrence of HV deformity include a significant preoperative hallux valgus angle (HVA), 11 distal metatarsal articular angle, 5 inadequate correction of HVA 43 and intermetatarsal angle (IMA), 28 and degree of dislocation of the sesamoid. 27 Despite that these findings have shown the association between these indicators and recurrence of HV, previous studies on the recurrence of hallux valgus have only examined 1 or 2 risk factors, disregarding the complex interaction between multiple variables. As a result, a comprehensive assessment of these risk factors in a multivariate manner is currently lacking. With the application of machine learning (ML) techniques in medical image analysis, 10 recent studies have found that combining ML algorithms can effectively capture pattern information between different variables, thereby improving the accuracy of predictive models and enabling effective prognosis prediction.17-19 Numerous advantages offered by ML have been emphasized, including proficiently handling large data sets, capturing complex nonlinear relationships, and providing accurate prognostications. 17
Furthermore, most studies investigating hallux valgus recurrence focused on analyzing radiographic parameters using weightbearing radiographs.5,27,28,43 However, Park and Lee 31 conducted immediate postoperative nonweightbearing radiograph to investigate the association between hallux valgus recurrence and measures from the immediate postoperative nonweightbearing radiographs. Their findings have indicated that measurements obtained from the immediate postoperative nonweightbearing radiographs were also linked to the recurrence of hallux valgus after a 1-year follow-up. The study indicated that the characteristic that immediate postoperative radiographs reflected are shared with intraoperative radiograph in a nonweightbearing position, 31 which could provide additional information to predict the occurrence of hallux valgus.
Therefore, in our current study, the primary objective is to validate the commonly used ML models to predict an HVA superior to 20 degrees at 1-year follow-up based on preoperative weightbearing and immediate postoperative nonweightbearing radiographic measurements. The rationale for using postoperative nonweightbearing radiographs lies in the standard practice of prohibiting weightbearing until the postoperative healing phase has reached a point where it is safe for the patient to do so without compromising the surgical intervention. Our secondary objective is to explore, through feature selection methods, the risk factors most relevant to this change.
Materials and Methods
Design and Patient Population
The present study involves a retrospective analysis of 2 distinct data sets obtained from 2 independent institutions. Each data set in our current study is distinct and institution-specific. Data set 1 comprises patients exclusively from institution A, whereas data set 2 includes patients solely from institution B. There is no overlap of patients between data sets. These data sets collectively included 406 patients with hallux valgus (HV), and a total of 521 symptomatic feet that underwent proximal chevron osteotomy. In our current study, 24 (11 in data set 1 and 13 in data set 2) patients were excluded because of the lack of follow-up data, 3 patients (2 in data set 1, 1 in data set 2) were excluded because of the infection following surgery. After excluding these patients, data set 1 includes 143 patients and 212 HV feet, whereas data set 2 consists of 169 patients and 211 HV feet. Ethical approval was acquired from the relevant ethics boards of both institutions, and the study was carried out in adherence to ethical guidelines. The institutional review board (IRB) approval number for our study is IRB2023-WZ-168.
To mitigate the impact of imbalanced samples on ML model training, we adjusted the data set by removing some nonrecurrent feet. Specifically, the process involves selecting nonrecurrent feet matched for gender and age with the recurrent feet as the control group. This was done to achieve a balanced sample size between the recurrence and nonrecurrence groups. Consequently, in our present study, there are 108 feet (eg, 54 vs 54) in data set 1 and 90 feet in data set 2 (eg, 45 vs 45).
Inclusion Criteria and Surgical Approach
To ensure a homogenous patient population that could accurately represent the conditions in our current study, the inclusion and exclusion criteria were as follows. The inclusion criteria include (1) symptomatic hallux valgus with a moderate to severe degree (hallux valgus angle [HVA] equal to or exceeding ≥20 degrees, or intermetatarsal angle [IMA] reaching ≥12 degrees),4,26,27,29 (2) undergoing proximal chevron osteotomy on the first metatarsal, (3) primary surgery performed for hallux valgus correction, (4) an age of ≥18 years, and (5) a minimum follow-up duration of 1 year. The exclusion criteria involve (1) previous unsuccessful hallux valgus surgical intervention, (2) absence of the medial sesamoid, (3) presence of inflammatory arthropathy or diabetes-associated Charcot arthropathy, (4) hallux rigidus condition, and (5) incidence of infection.
The surgical procedures for all included patients were as follows: the apex of the osteotomy was positioned 20 mm distal to the proximal metatarsocuneiform joint surface and at the center of the metatarsal shaft. Using a microsagittal saw, a proximal-based chevron osteotomy at a 90-degree angle was performed. After confirming the complete bony release of the first metatarsal, the distal fragment was laterally translated by 3 mm and angulated by 10 degrees for simulating deformity correction. The simulated deformity correction was temporarily fixed with a Kirschner wire from the dorsal part of the distal fragment to the plantar part of the proximal metatarsal base. The overhanging prominent part of the proximal fragment was trimmed to be level with the distal fragment. A locking plate was used for osteotomy fixation and secured with a bicortical nonlocking screw. Bicortical locking screws were inserted into all 3 proximal screw holes of the T-plate and 1 distal screw hole, resulting in rigid fixed-angle osteosynthesis. After completing the plate fixation, the K-wire was removed. It should be noted that 2 senior foot and ankle surgeons (all had an average of 10 years of experience postresidency) performed the above-mentioned surgical procedures for both data sets respectively. The representative preoperative, immediate postoperative, and final radiographs are illustrated in Supplementary Figure 1.
Radiograph Measurements
Bilateral weightbearing radiographs were acquired preoperatively and postoperatively at 1-year follow-up for all participants following a standardized procedure (tube to film distance 100 cm, angled 15 degrees from vertical, anteroposterior). Furthermore, immediate postoperative nonweightbearing radiographs were acquired obtained within 2 days following surgery following the same standardized procedure as weightbearing radiographs. The wound dressing was removed during imaging and replaced after the imaging procedure. All radiographic evaluations were conducted using the ImageJ toolbox (V 1.8.0). Various measurements were assessed, including the following:
1. HVA: The HVA is formed by the longitudinal axis of the first proximal phalanx and the longitudinal axis of the first metatarsal. 37,44
2. IMA: The IMA, or metatarsus primus adductus angle, is the angle between the first and second metatarsals. 14
3. Distal metatarsal articular angle: The distal metatarsal articular angle is the angle between the line perpendicular to the effective articular surface of the first metatarsal head and the longitudinal axis of the first metatarsal bone. 35
4. Metatarsus adductus angle: The metatarsus adductus angle is measured between the second metatarsal axis and a an axis perpendicular to the tarsal transverse axis, using the outermost lateral and distal points of the cuboid joints with the fifth metatarsal as a reference point. 12
5. Metatarsal protrusion distance (MPD): This measurement is taken from the furthest distal point of the second metatarsal bone, perpendicular to its longitudinal axis. This line represents the furthest distal protrusion of the second metatarsal. Subsequently, a line parallel to this is drawn through the furthest distal point of the first metatarsal. The difference between these 2 parallel lines yields the MPD. 30
6. Sesamoid position: The sesamoid position is categorized as grades I to VII based on the alignment of the tibial sesamoid relative to the first metatarsal’s functional longitudinal axis. 15
Baseline Data
In our current study, the recurrence of hallux valgus was determined by the presence of an HVA equal to or exceeding ≥20 degrees at the 1-year follow-up.4,26,27,29 Feet were classified into 2 groups based on the presence or absence of recurrence. This categorical variable (eg, postoperative HVA at 1-year follow-up) was used as the label for training ML classifiers.
Data Analyses
The Transparent Reporting of Multivariable Prediction Models for Individual Prognosis or Diagnosis (TRIPOD) checklist 8 and guidelines for ML predictive models were followed in our analysis. 22
In the current study, the measurements of preoperative weightbearing radiographs and immediate postoperative nonweightbearing radiographs were used as features to train the commonly used ML models, including logistic regression, 39 generalized linear model, 6 linear discrimination analysis, 16 and partial least squares discrimination analysis, 20 support vector machine (SVM) 42 with a radial basis function kernel, K-nearest neighbors, 1 random forest, 3 decision tree, 2 and extreme gradient boost. 38 All analysis was undertaken using R, version 3.5.3 (The R Foundation, Vienna, Austria), and RStudio, version 1.1.463 (RStudio, Boston, MA). All models were trained using the default parameters provided by the software package.
The samples from data set 1 were used to train the above-mentioned ML models, and the models were tested on the data set 2 to validate the model’s generalization and repeatability, which were crucial for ML analyses. To assess the performance of the model, various discrimination metrics were used. These metrics encompassed the area under the receiver operating characteristic (ROC) curve (AUC), accuracy, sensitivity, and specificity. Platt scaling was applied for converting the output scores of the model into probabilities. To further investigate the importance of each radiograph measure for predicting the recurrence of hallux valgus, an exhaustive search method was performed to identify a set of measures with the best predictive power for each ML model. This involved generating all possible combinations of feature subsets to test the predictive utility of each feature subset and identify the feature subset with the largest AUC. The detailed procedures were as follows: (1) for each ML algorithm, all possible combinations of feature subsets were generated; (2) for each generated feature subset, the model was trained and tested using the training data set (data set 1) through 2000-resample bootstrap-based internal validation; (3) the feature subset with the largest average AUC was determined as the optimal feature subset. Subsequently, all models were trained on the training set (data set 1) using their respective optimal feature subsets. These models were then tested on the external validation set (data set 2). The procedure for 2000-resample bootstrap-based internal validation involved the following steps: (1) randomly select samples with replacement to form a bootstrap sample (eg, n = 108, allowing duplicates); (2) train models using the bootstrap sample and evaluate them on the samples that were not included in the bootstrap selection; (3) repeat steps 1 and 2 for a total of 2000 iterations. The averaged classification accuracies and AUC values were obtained from the 2000-bootstrap procedures.
Results
Baseline Patient Data
Table 1 presents the clinical characteristics of the data set 1 and data set 2 used for model training and testing. No significant differences in terms of age, sex, body mass index, and duration of symptoms were observed between recurrence and nonrecurrence group in both data sets respectively.
Baseline Clinical Characteristics and Outcomes of the 379-Patient Cohort. a
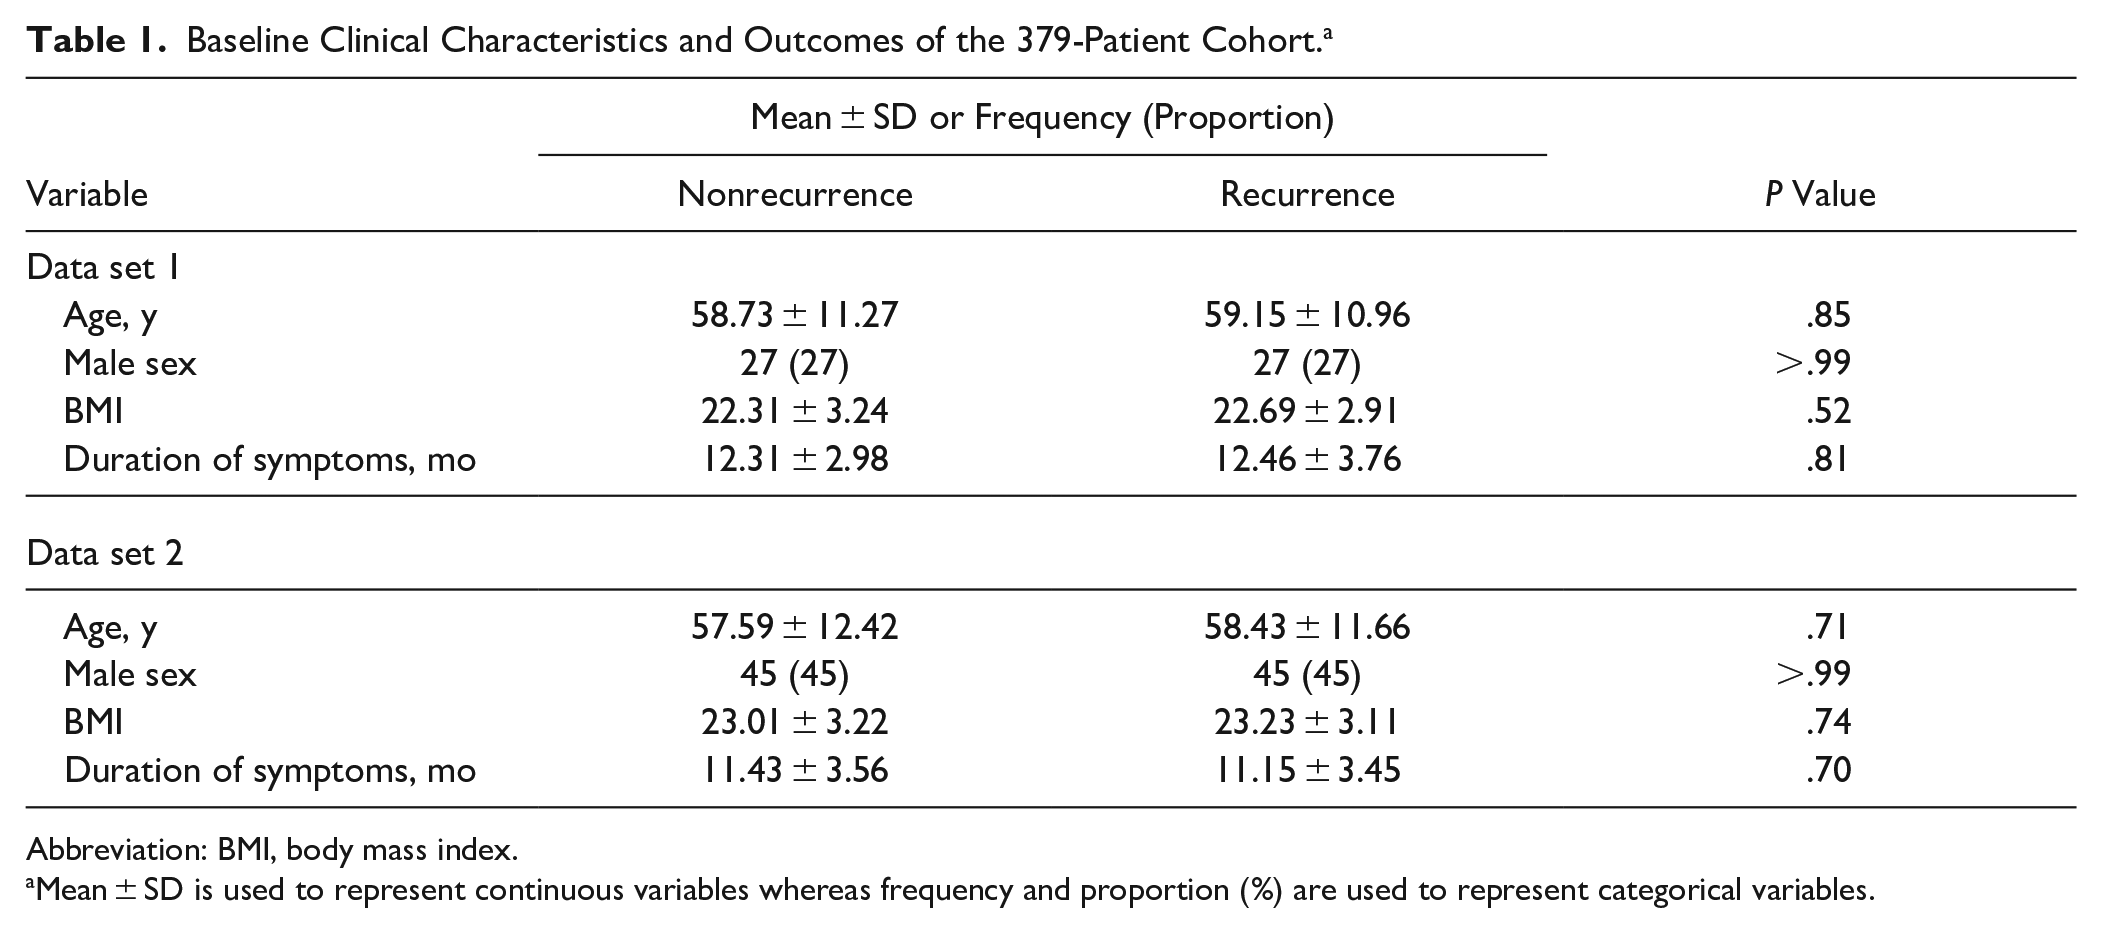
Abbreviation: BMI, body mass index.
Mean ± SD is used to represent continuous variables whereas frequency and proportion (%) are used to represent categorical variables.
Baseline Prediction Performance
Among all ML models, the SVM exhibited a classification accuracy of 75.6% with a sensitivity of 76.2% and a specificity of 75.3%, corresponding to an AUC of 0.88 (ie, highest among all models). Secondary to SVM, logistic regression and generalized linear model with elastic net regularization also showed a relatively good prediction performance. For logistic regression, the accuracy is 75.9% with a sensitivity of 80.7% and a specificity of 73.1%, corresponding to an AUC of 0.87. For generalized linear model with elastic net regularization, the accuracy is 78.5% with a sensitivity of 79.7% and a specificity of 76.7%, corresponding to an AUC of 0.87. Among all ML models, the prediction performance for decision tree was the poorest. The accuracy of decision tree models is 70.0% with a sensitivity of 75.3% and a specificity of 62.6% corresponding to an AUC of 0.74 (Table 2 and Figure 1).
Comparison of the AUCs, Accuracies, Sensitivities, and Specificities of Baseline Prediction Performance for Machine Learning Models.
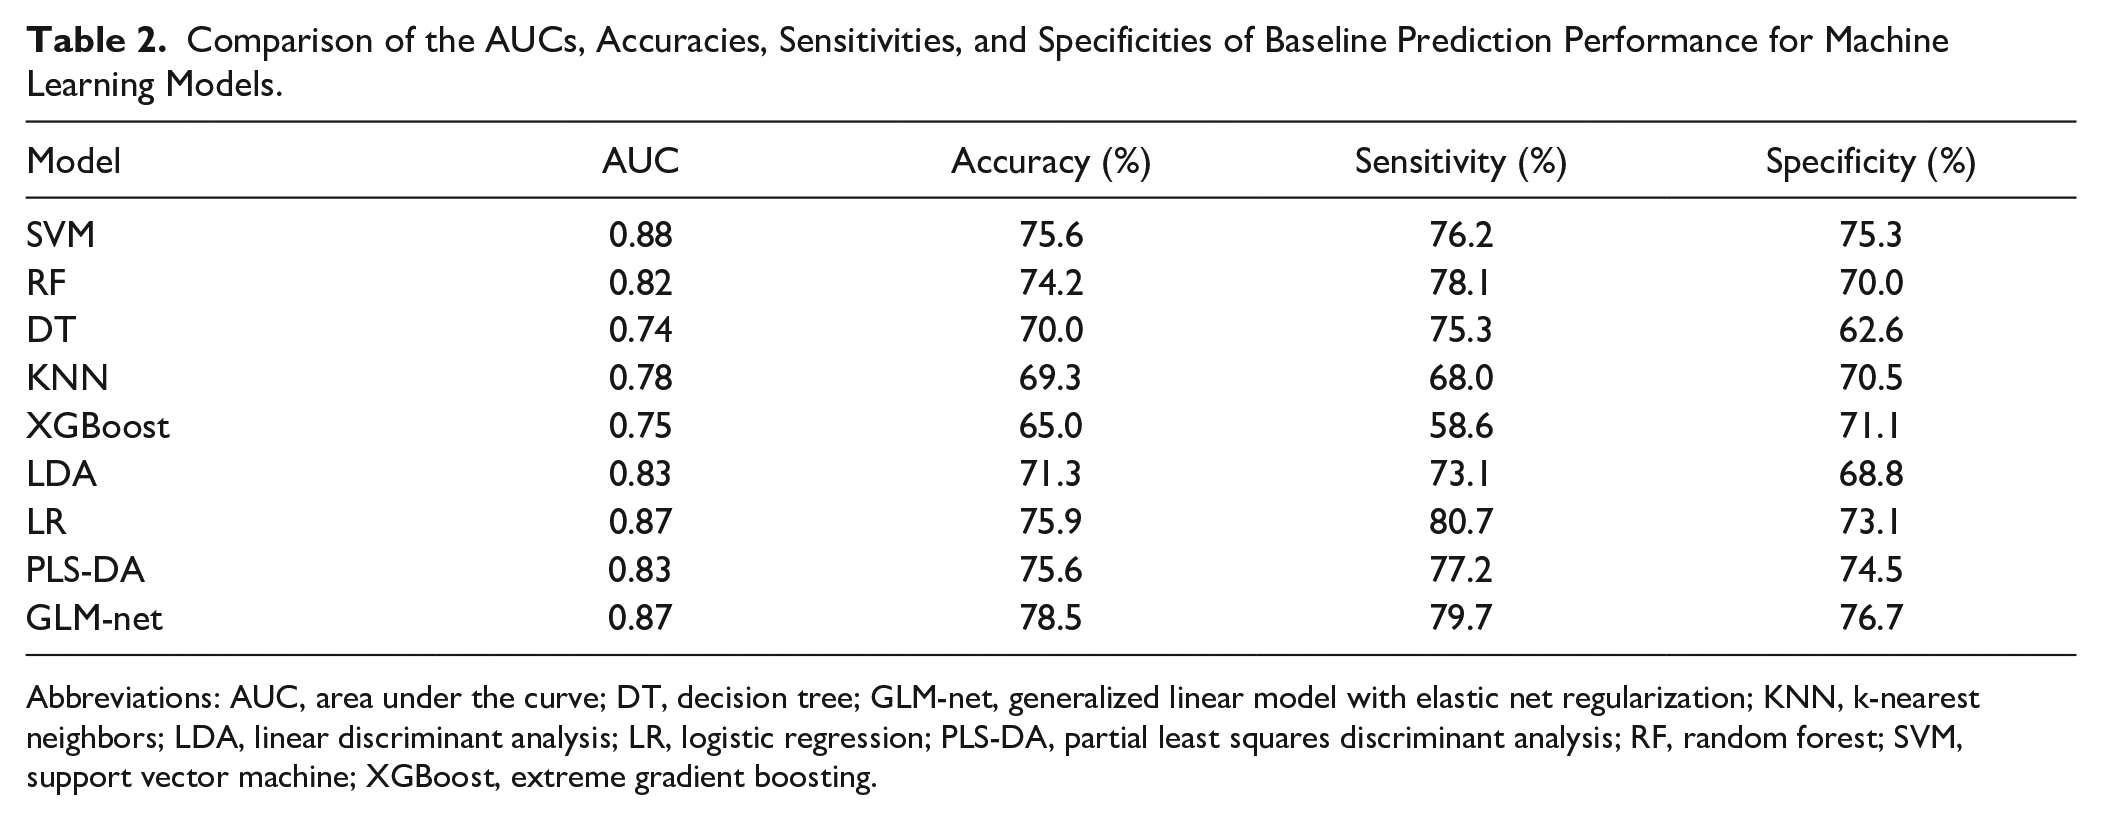
Abbreviations: AUC, area under the curve; DT, decision tree; GLM-net, generalized linear model with elastic net regularization; KNN, k-nearest neighbors; LDA, linear discriminant analysis; LR, logistic regression; PLS-DA, partial least squares discriminant analysis; RF, random forest; SVM, support vector machine; XGBoost, extreme gradient boosting.
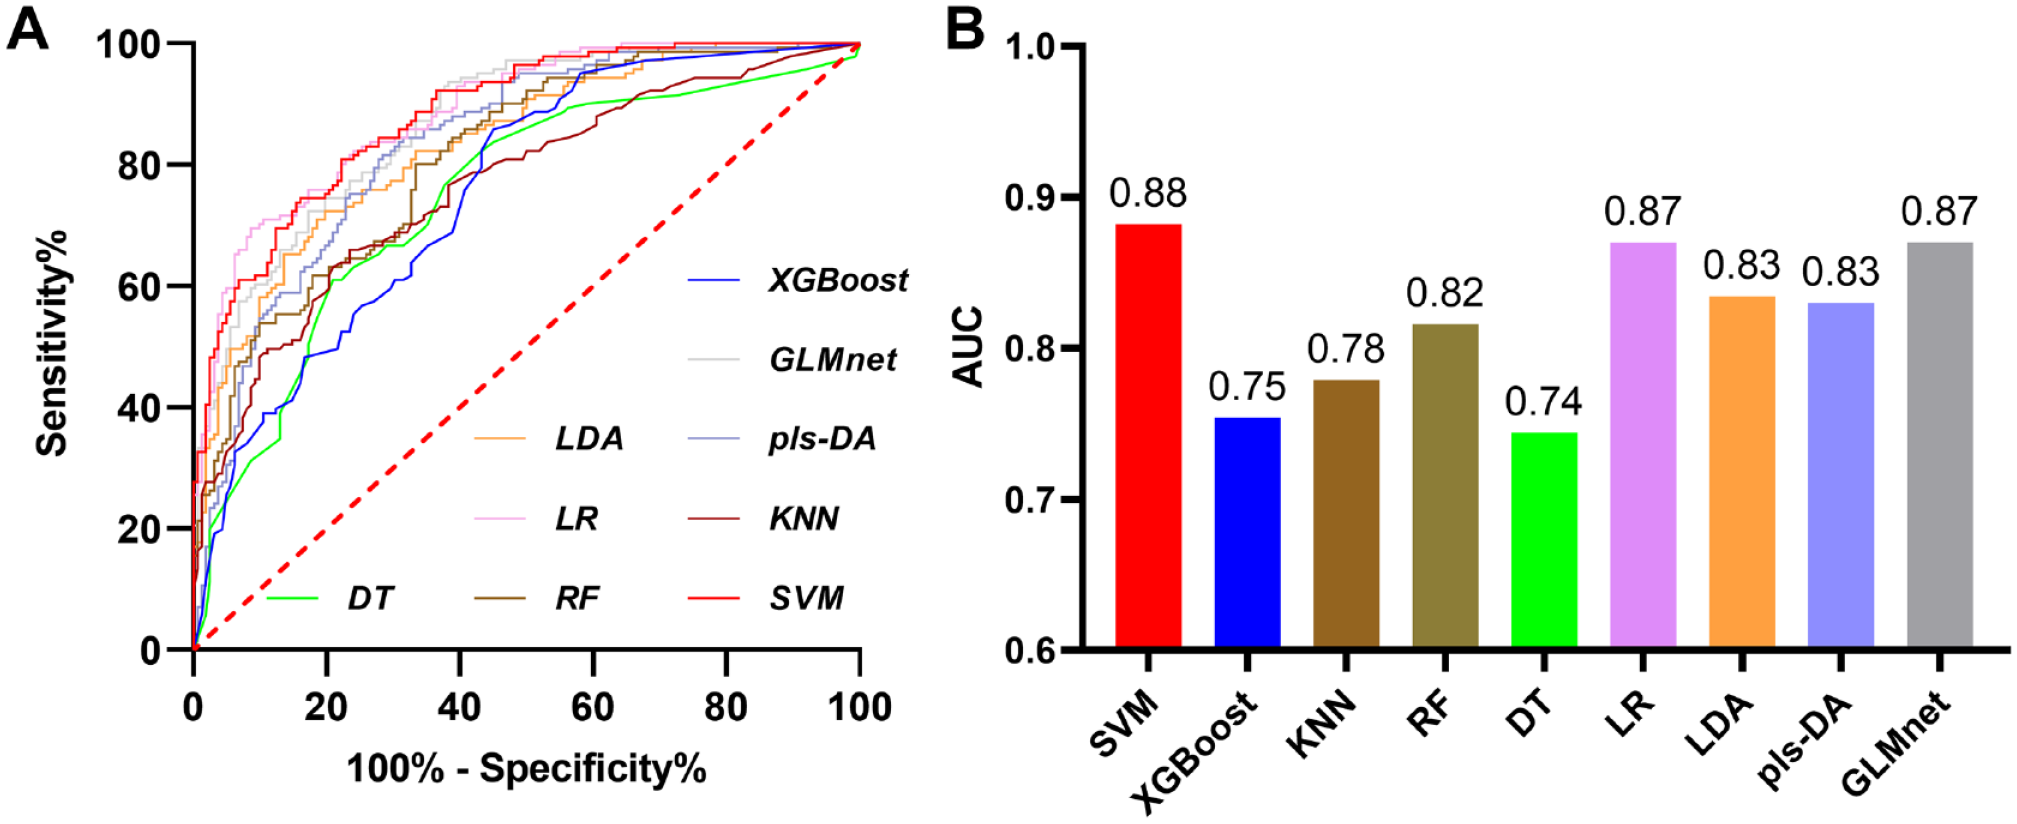
The baseline predictive performance for machine learning (ML) approaches. (A) The receiver operating characteristic (ROC) curves for ML models. (B) The area under the curve (AUC) for ML models. DT, decision tree; GLM-net, generalized linear model with elastic net regularization; KNN, k-nearest neighbors; LDA, linear discriminant analysis; LR, logistic regression; PLS-DA, partial least squares discriminant analysis; RF, random forest; SVM, support vector machine; XGBoost, extreme gradient boosting.
Optimal Feature Subset
Figure 2 depicts the optimal feature subset selected by the ML models through a 2000-resample bootstrap-based internal validation process. Notably, the preoperative sesamoid position and the immediate postoperative IMA were consistently chosen for the optimal feature subset by all ML models, each receiving 9 votes. Furthermore, attributes such as a higher preoperative HVA, IMA, immediate postoperative sesamoid position, and MPD were frequently selected as part of the optimal feature subset by all ML models, garnering votes of 6 or more.
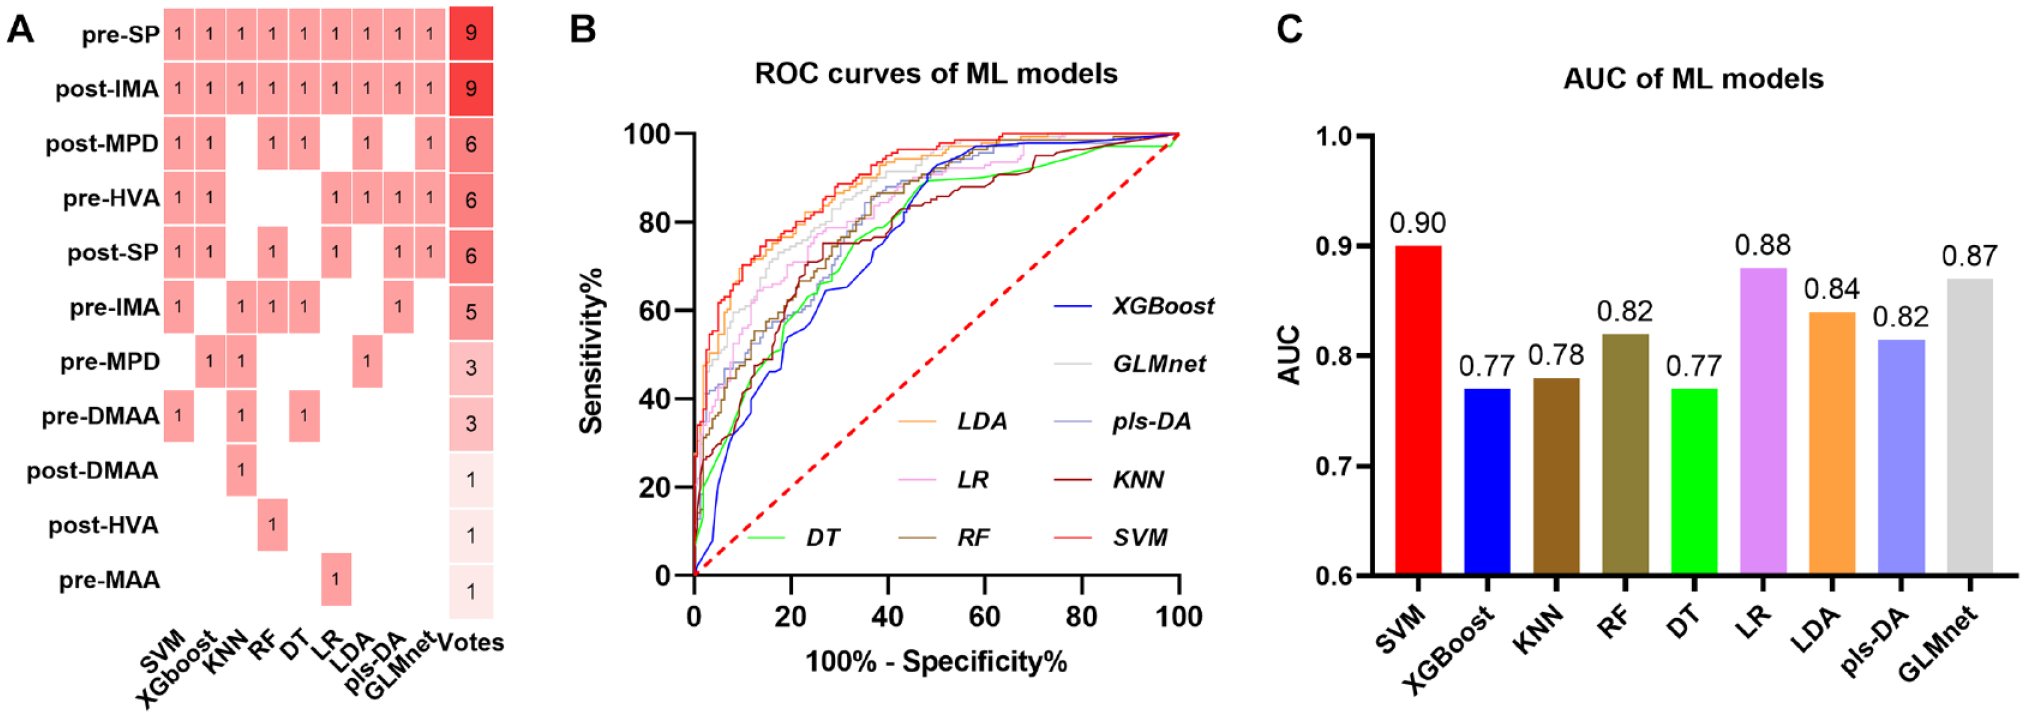
(A) The heat map for voting fusion of machine learning models for identifying optimal feature subset. The most discriminatory feature subset was selected by the features of votes greater than or equal to 6. (B) The receiver operating characteristic (ROC) curves for ML models using their optimal feature subset respectively. (C) The area under the curve (AUC) for ML models using their optimal feature subset respectively. DT, decision tree; GLM-net, generalized linear model with elastic net regularization; KNN, k-nearest neighbors; LDA, linear discriminant analysis; LR, logistic regression; PLS-DA, partial least squares discriminant analysis; RF, random forest; SVM, support vector machine; XGBoost, extreme gradient boosting.
Subsequently, we employed all ML models to undergo training using the optimal feature subset with the training data, followed by testing on the external validation set. As depicted in Figure 2, the SVM model once again demonstrated the highest performance when compared to other models. It achieved an AUC of 0.90, an accuracy of 79.6%, a sensitivity of 82.0%, and a specificity of 76.5% (Figure 2). Similarly, in line with the baseline predictions, the logistic regression model displayed a satisfactory performance as the runner-up to the SVM model. It attained an AUC of 0.88, an accuracy of 77.9%, a sensitivity of 81.5%, and a specificity of 74.7% (Figure 2). The results of other ML models can be found in Table 3.
Comparison of the AUCs, Accuracies, Sensitivities, and Specificities With the Most Discriminatory Feature Subset Performance for Machine Learning Models.
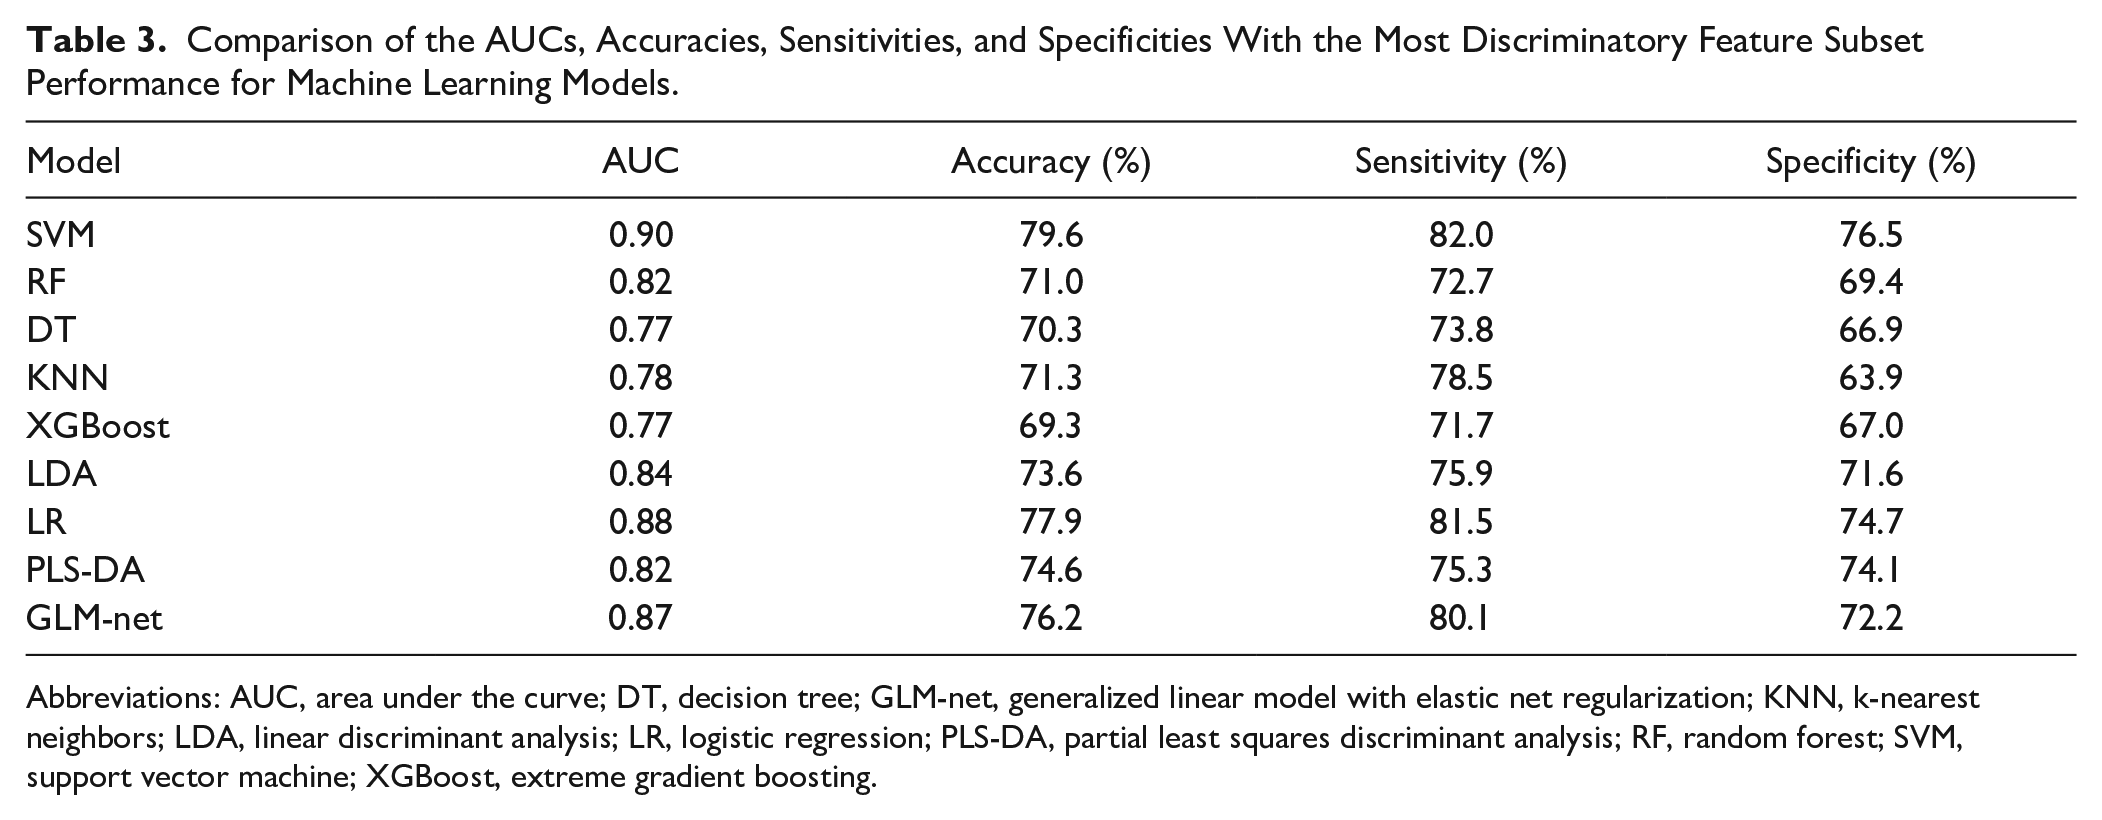
Abbreviations: AUC, area under the curve; DT, decision tree; GLM-net, generalized linear model with elastic net regularization; KNN, k-nearest neighbors; LDA, linear discriminant analysis; LR, logistic regression; PLS-DA, partial least squares discriminant analysis; RF, random forest; SVM, support vector machine; XGBoost, extreme gradient boosting.
Discussion
In our current study, 2 primary findings were observed: (1) the commonly used ML models could predict the postoperative HVA greater than 20 degrees at 1 year follow-up; (2) the most relevant risk factors related to the occurrence of HVA greater than 20 degrees at 1 year follow-up included preoperative sesamoid position (ie, degree of tibial sesamoid dislocation) and immediate postoperative IMA.
Over the past decades, researchers have been dedicated to identify risk factors associated with HV recurrence, striving to predict the outcomes of corrective surgery. Risk factors for recurrence include higher preoperative HVA and distal metatarsal articular angle,5,11 insufficient correction of the HVA 43 and IMA, 28 degree of tibial sesamoid dislocation, as well as pronounced metatarsus adductus. 33 However, such prediction based on single radiographic measurement was unable to accurately predict recurrence in HV patients. Foot and ankle surgeons aspire to obtain an accurate predictive model for precise prediction of surgical outcomes.29,31 The development of a precise prediction model holds the potential for surgeons to effectively identify individuals at a heightened risk of HV recurrence postsurgery, which could assist health care professionals in formulating personalized surgical strategies tailored to each patient’s unique risk profile. Additionally, a reliable prediction algorithm would empower surgeons to engage in informed discussions with patients about their prognosis and potential health concerns. Nevertheless, there is inherent variability and potential uniqueness for each HV data set that the performance of pretrained models, including SVMs, may not directly transfer without adjustment. Future studies could train their classifiers using their own data and begin SVMs as a starting point based on the promising results reported in our manuscript. It is also important for tuning and validating the model using a subset of the HV data set to ensure its effectiveness and reliability.
It is important to note that the multivariate analyses incorporated various radiographic assessments, focusing not only on individual variable magnitudes but also on their combined patterns. Thus, our results imply that hallux valgus recurrence is influenced by multiple factors and should be viewed holistically.24,34,36 The capabilities of ML models enable us to manage complex, nonlinear connections between different features. These results highlight how multiple factors play a role in the recurrence of HV. By applying this method, a comprehensive characterization of HV deformity can be captured, leading to an accurate prediction of the risk of increased HVA at 1 year postoperation. In our current study, by employing an exhaustive search for the optimal feature subset and a voting strategy to identify risk factors for hallux valgus recurrence, we found that the preoperative sesamoid position (ie, degree of tibial sesamoid dislocation) and immediate postoperative IMA were selected into the optimal feature subset by all ML models (eg, receiving 9 votes). Furthermore, a higher preoperative HVA, IMA, immediate postoperative sesamoid position, and MPD were consistently selected as optimal features by ML models (with votes equal to or exceeding 5). Such findings were consistent with previous studies. The existing body of research on HV currently considers its multiplanar structure and the rotational deformity of the first ray,7,25,41 and it has been suggested that the ability to attain a satisfactory correction may be influenced by “derotating” the first metatarsal bone. 25 Therefore, a larger preoperative sesamoid dislocation degree and poor immediate postoperative sesamoid reduction observed in our current study may suggest inadequate rotational correction in these patients, which explained their relationship with recurrence. Further, Park and Lee 31 employed immediate postoperative nonweightbearing radiograph assessment and discovered that insufficient correction of the HVA and sesamoid alignment postsurgery, combined with severe preoperative metatarsus adductus and significant preoperative hallux valgus deformity, are contributing factors to recurrence at 1 year follow-up. Additionally, their study revealed that an immediate postoperative HVA equal to or exceeding 8 degrees exhibited the strongest correlation with recurrence. Furthermore, previous studies have also shown that IMA is a crucial factor contributing to the recurrence of HV. A recent meta-analysis has shown that preoperative IMA showed a moderate positive relationship with recurrence. 13 Despite that the underlying mechanism for such association remains unknown, IMA was a crucial risk factor for recurrence of HV. Furthermore, our current findings also suggest that MPD is also a crucial factor contributing to the recurrence of HV, which is in line with a previous study that has shown that the excessive length of first ray is a risk factor for hallux valgus recurrence. 21
Our results also indicated that these ML models have learned risk factors associated with postoperative recurrence through imaging measurements, and these factors align with prior investigations. It should be noted we used immediate postoperative nonweightbearing radiographs 2 days following surgery rather than partial weightbearing radiographs or weightbearing radiographs months following surgery. Being limited by the constraints of retrospective research, we were unable to obtain intraoperative imaging data. This design means that certain clinical assessments that might wield influence on HV patients’ postsurgery were not included in our analysis. This limitation underscores the potential for future research to incorporate a wider range of clinical variables to provide a more comprehensive understanding of HV recurrence and its associated factors. However, this study has an advantage as it includes 2 separate data sets, allowing one to serve as an external validation set to independently verify the ML model, thereby ensuring the reliability of our results to a certain extent.
Nonetheless, considering the shared characteristics between intraoperative and immediate postoperative nonweightbearing radiographs, if such nonweightbearing imaging data can successfully predict postoperative recurrence, then future intraoperative imaging measurements could provide real-time guidance, aiding in immediate adjustments during surgery. Having said this, compared with weightbearing radiographs, nonweightbearing radiographs are susceptible to deviations due to rotation, projection distortion, weight, or nonweight conditions, which may introduce bias to the results of this study. This should also be considered in future studies.
The outcomes of our study provide foundational evidence for future endeavors centered around AI-assisted medical practices. Leveraging deep learning image recognition techniques, automated identification of key points has the potential to extract measurements from intraoperative radiographic images. This paves the way for the integration of ML predictive models, enabling real-time forecasting of postoperative recurrence risk. Consequently, this timely feedback aids ankle and foot surgeons in executing intraoperative interventions to avert HV recurrence. This approach involves a comprehensive amalgamation of surgical planning, guided by the insights provided by the predictive model. However, the application of the model necessitates ongoing refinement, robust validation, integration into clinical workflows, and adherence to ethical and regulatory guidelines. There is still a long way to go from theory to practical application. In addition, considering that the effectiveness of the model may be influenced by variations in surgical techniques, patient demographics, and data set characteristics associated with different surgical procedures, careful consideration is required when applying it to other HV surgeries. However, it should be also noted that MLs enable us to obtain risk factors associated with the recurrence of HV. The sample size of our study is relatively small, encompassing patients from only 2 medical centers and belonging to a single specific ethnic group (the Han nationality). To validate the broader applicability of our findings, future investigations with larger sample sizes encompassing diverse populations are needed.
Conclusion
Machine learning classifiers such as SVM could predict the HVA greater than 20 degrees at a 1-year follow-up while identifying associated predictors in a multivariate manner. This study holds potential for foot and ankle surgeons to effectively identify individuals at higher risk of HV recurrence postsurgery.
Supplemental Material
sj-docx-2-fai-10.1177_10711007241256648 – Supplemental material for Developing Machine Learning–Based Predictive Models for Hallux Valgus Recurrence Based on Measurements From Radiographs
Supplemental material, sj-docx-2-fai-10.1177_10711007241256648 for Developing Machine Learning–Based Predictive Models for Hallux Valgus Recurrence Based on Measurements From Radiographs by Rui Zhao, Guobin Wang, Fengtan Li, Jinchan Wang, Yuan Zhang, Dong Li, Shen Liu, Jie Li, Jiajun Song, Fangyuan Wei and Chenguang Wang in Foot & Ankle International
Supplemental Material
sj-pdf-1-fai-10.1177_10711007241256648 – Supplemental material for Developing Machine Learning–Based Predictive Models for Hallux Valgus Recurrence Based on Measurements From Radiographs
Supplemental material, sj-pdf-1-fai-10.1177_10711007241256648 for Developing Machine Learning–Based Predictive Models for Hallux Valgus Recurrence Based on Measurements From Radiographs by Rui Zhao, Guobin Wang, Fengtan Li, Jinchan Wang, Yuan Zhang, Dong Li, Shen Liu, Jie Li, Jiajun Song, Fangyuan Wei and Chenguang Wang in Foot & Ankle International
Footnotes
Ethical Approval
The study was approved by the Institutional Review Board of Tianjin Medical University General Hospital (NO. IRB2023-WZ-168 and September 2023).
Declaration of Conflicting Interests
The author(s) declared no potential conflicts of interest with respect to the research, authorship, and/or publication of this article. Disclosure forms for all authors are available online.
Funding
The author(s) received no financial support for the research, authorship, and/or publication of this article.
Supplemental Material
Supplementary material is available online with this article.
References
Supplementary Material
Please find the following supplemental material available below.
For Open Access articles published under a Creative Commons License, all supplemental material carries the same license as the article it is associated with.
For non-Open Access articles published, all supplemental material carries a non-exclusive license, and permission requests for re-use of supplemental material or any part of supplemental material shall be sent directly to the copyright owner as specified in the copyright notice associated with the article.