
Abstract
Background:
Plantar displacement during chevron osteotomy may improve load distribution in hallux valgus, but biomechanical evidence is limited. This study evaluates how lateral and plantar displacement affect contact properties in the first metatarsophalangeal (MTP-1) and the first tarsometatarsal (TMT-1) joints under standing load.
Methods:
Twelve cadaveric feet with hallux valgus and 4 normal specimens were tested under simulated standing load. Biplane osteotomy was performed with lateral displacement (2, 4, 6 mm) and plantar displacement (0, 2, 4 mm). Joint contact metrics were measured using Tekscan sensors.
Results:
Lateral displacement significantly affected contact force and peak pressure at both joints (P < .01). Interaction effects between lateral and plantar displacement were also significant (P < .01). A combination of 4-mm lateral and 2-4-mm plantar displacement most closely approximated contact pressures seen in the normal group.
Conclusion:
Lateral displacement of 4 mm with 2-4 mm plantar shift optimizes contact pressure restoration in cadaveric hallux valgus feet. These findings offer biomechanical guidance but require clinical validation.
Clinical Relevance:
Understanding how lateral and plantar displacement affect joint biomechanics provides a foundational framework for refining surgical planning in biplane chevron osteotomy. By identifying displacement combinations that approximate normal joint pressures, this study offers biomechanical guidance to help reduce postoperative complications such as transfer metatarsalgia. However, clinical studies are needed to determine whether these biomechanical findings translate into improved outcomes in patients with hallux valgus.
This is a visual representation of the abstract.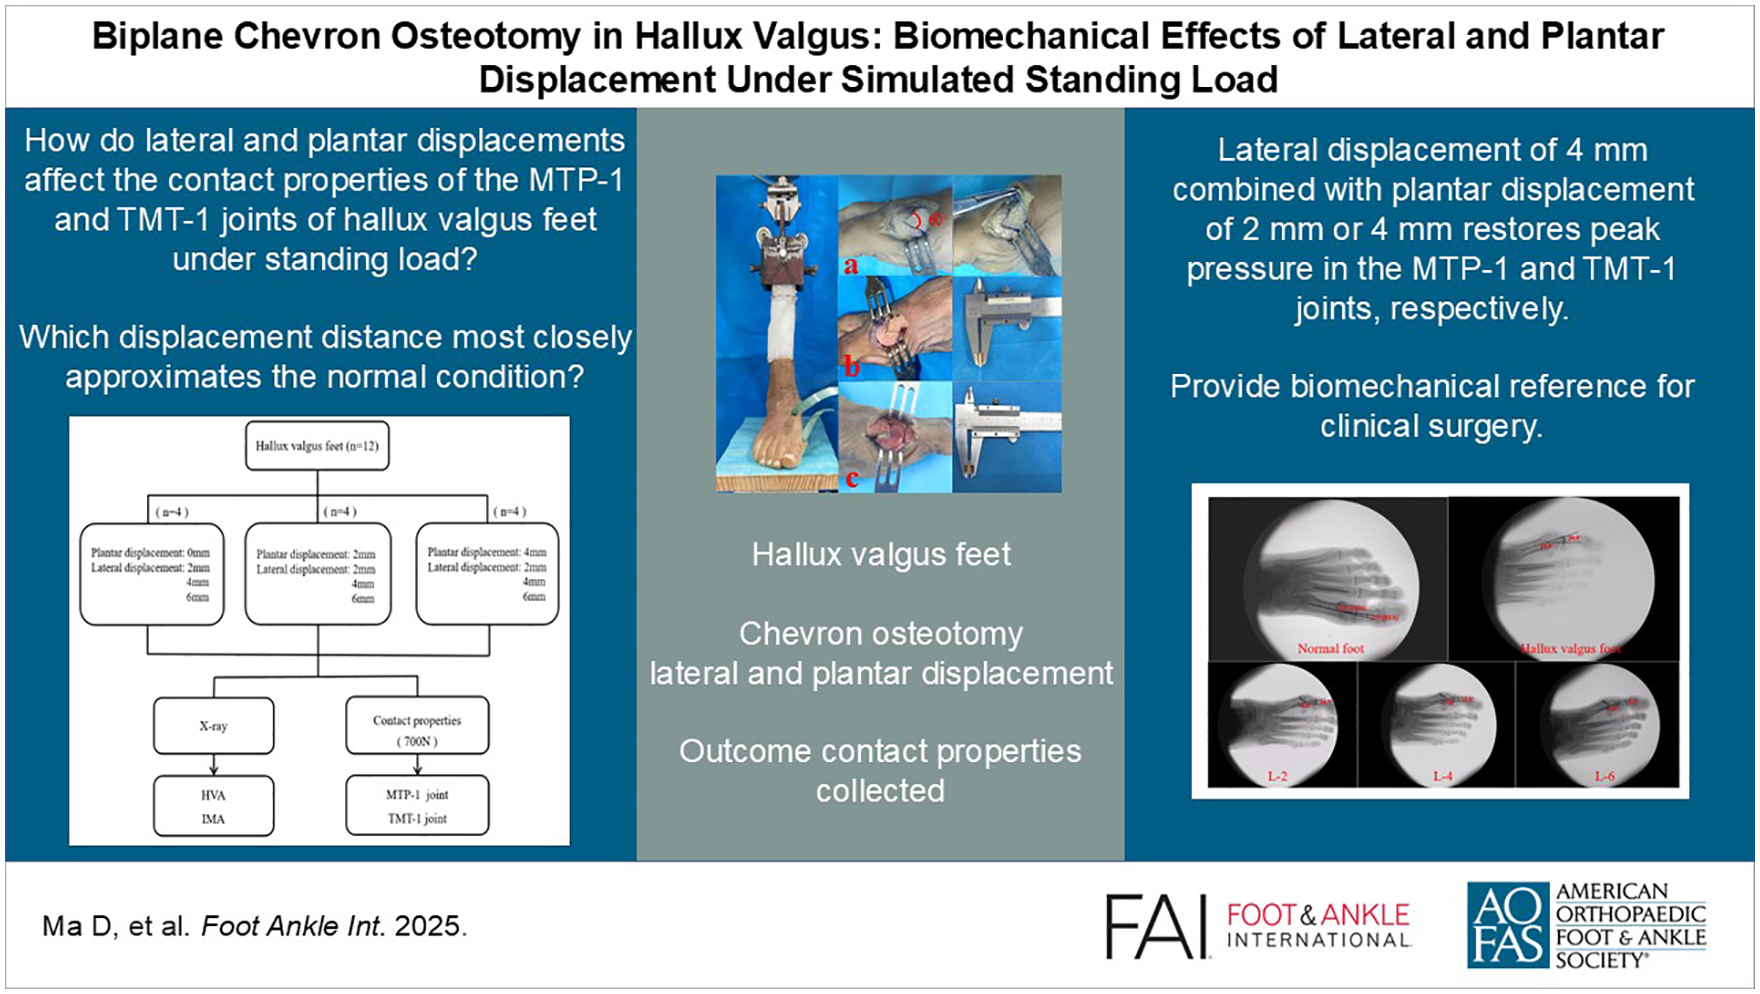
Hallux valgus (HV), a common forefoot deformity,5,28 is predominantly observed in women and is characterized by lateral deviation of the big toe (hallux) and medial deviation of the first metatarsal. Chevron osteotomy, first introduced by Austin and colleagues in 1981, 1 is a widely practiced surgical technique for correcting this deformity. The procedure involves making an inverted V–shaped cut at the distal end of the first metatarsal, allowing for realignment of the big toe and effective correction of the hallux valgus deformity. 22
However, traditional chevron osteotomy, primarily designed as a single-plane procedure to correct the hallux valgus angle (HVA) and the first-second intermetatarsal angle (IMA), often results in first metatarsal shortening, with reported averages ranging from 2.5 mm (0-8 mm) 13 or 6 mm (0-11 mm). 16 Excessive shortening, particularly when the relative metatarsal length—defined as the length difference between the first and second metatarsals—exceeds −3 mm, has been associated with an increased risk of transfer metatarsalgia. 24 To address these limitations, biplanar chevron osteotomy was introduced as an alternative approach for treating complex hallux valgus deformities.4,8,10 Additionally, some studies have suggested that maintaining or lengthening the first metatarsal during biplanar osteotomy may enhance mechanical stability and potentially reduce the risk of transfer metatarsalgia and leading to better surgical outcomes.4,11
Currently, the extent of displacement at the distal end of the first metatarsal during osteotomy is primarily determined by the clinician’s experience. However, there is a notable lack of research quantifying the displacement distances in both the horizontal and coronal planes during chevron osteotomy, despite its critical impact on surgical outcomes. The degree of displacement directly influences the corrective effectiveness and stability of the procedure. For instance, Badwey et al 2 reported that lateral displacement of the distal fragment up to 6.0 mm in males and 5.0 mm in females is feasible without exceeding 50% of the metatarsal diameter, based on cadaveric measurements. Additionally, Matsumoto et al 23 demonstrated that an average lateral displacement of 6.5 mm (range: 4.3-8.4 mm) resulted in satisfactory radiographic improvement at a 3-month follow-up. Similarly, Zhang et al 29 proposed that a 4 mm distal displacement during chevron osteotomy minimizes metatarsal stress and ensures postoperative stability.
Limited studies have suggested that hallux valgus deformity can lead to alterations in the biomechanics of the first metatarsophalangeal (MTP-1) and the first tarsometatarsal (TMT-1) joints.15,18 In advanced stages, these changes are often accompanied by evident arthrosis in both joints. However, to our knowledge, no published studies have specifically examined the changes in contact properties of the MTP-1 and TMT-1 joints following biplanar chevron osteotomy. Biplanar chevron osteotomy involves simultaneously displacing the distal fragment of the first metatarsal laterally and plantarly by a certain distance, aiming to achieve correction of hallux valgus deformity in both the sagittal and coronal planes. We hypothesized that varying displacement distances during biplanar chevron osteotomy would significantly affect the contact properties of the MTP-1 and TMT-1 joints. To test this hypothesis, we investigated the biomechanical effects of varying displacement distances during biplanar chevron osteotomy by collecting fresh cadaveric specimens. Lateral displacements of 2, 4, and 6 mm and plantar displacements of 0, 2, and 4 mm were applied. Key parameters, including joint peak pressure, contact force, and contact area, were measured. These findings provide a biomechanical foundation and reference for the clinical application of chevron osteotomy in treating hallux valgus deformities.
Materials and Methods
Sixteen fresh frozen below-knee cadaveric specimens were used. Before experimentation, all specimens underwent radiographic examination by the same clinical physician to exclude those with trauma, malignancy, or fractures, as such conditions could affect the study’s outcomes and the radiographic images were captured using the BG9000-1 high-frequency source mobile C-arm X-ray machine.
The specimens were divided into 2 groups. Group A consisted of 4 normal specimens with an average age of 55.03 years (range: 51-62 years), comprising 1 left foot and 3 right feet. Group B included 12 specimens diagnosed with hallux valgus, with an average age of 57.30 years (range: 55-68 years), comprising 6 left feet and 6 right feet.
Hallux valgus specimens were confirmed as having deformities based on radiographic findings, characterized by a HVA greater than 15 degrees and a first-second intermetatarsal angle (IMA) exceeding 9 degrees.9,20,21 Group B specimens were further randomized into 3 subgroups (B1, B2, and B3) according to varying degrees of plantar displacement: 0, 2, and 4 mm.
Biomechanical Testing
The contact pressure, peak pressure, and contact area of normal, preoperative, and postoperative hallux valgus specimens were assessed using the ElectroForce R3510 testing machine (Bose Corp, Framingham, MA) and the Tekscan pressure system (Tekscan Inc, Boston, MA) (Figure 1). To stabilize the specimens, the proximal tibia and fibula were fixed with polymethyl methacrylate. The skin, muscle, and fascia tissue were removed from the posterior and lateral aspects of the calf, preserving and exposing the posterior and lateral muscle tendons, including the Achilles tendon, posterior tibial tendon, flexor digitorum longus tendon, flexor hallucis longus tendon, and peroneal tendons (Figure 2A). These tendons were then secured using X-512 tendon sutures.
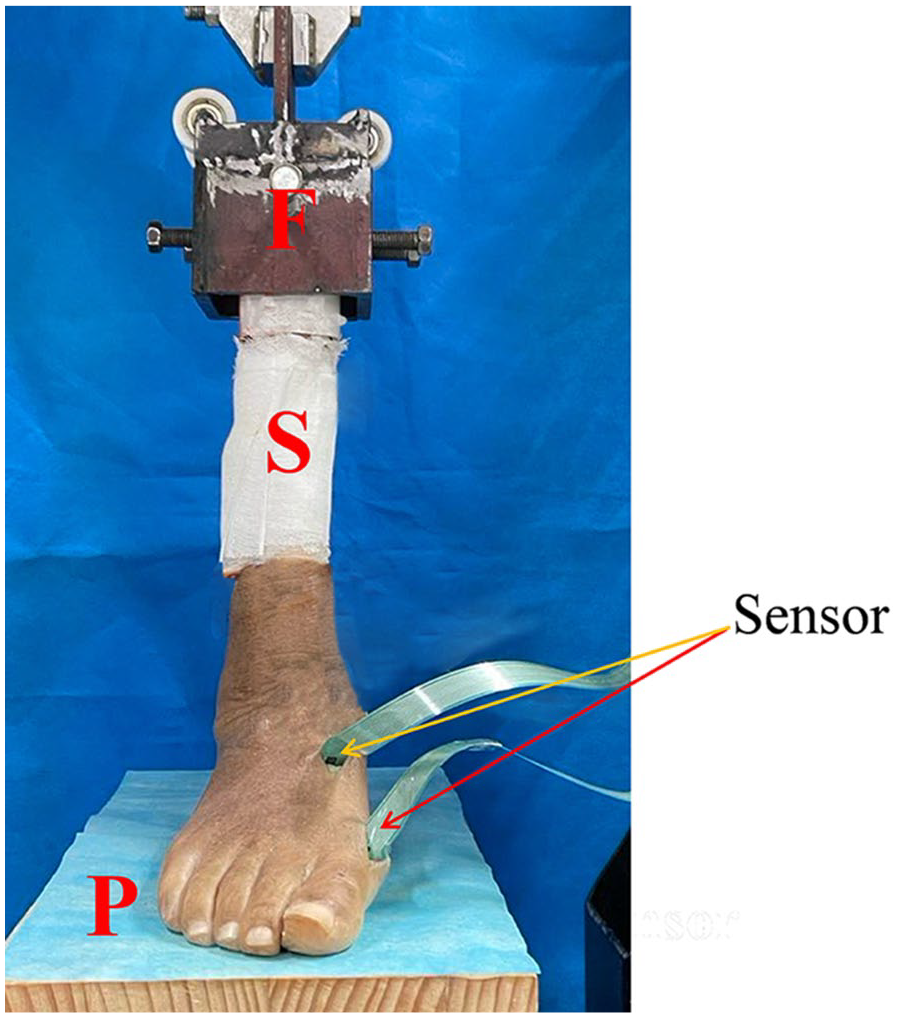
Experimental setup for MTP-1 and TMT-1 joints pressure data acquisition in the neutral anatomical position. The specimen (S) was fixed using a custom-mades fixture (F) and positioned on the loading platform (P) in alignment with its natural anatomical posture. Red arrows indicate the MTP-1 joint, whereas yellow arrows indicate the TMT-1 joint, where pressure sensors were placed. MTP-1, first metatarsophalangeal; TMT-1, first tarsometatarsal. [See online article for color figure.]
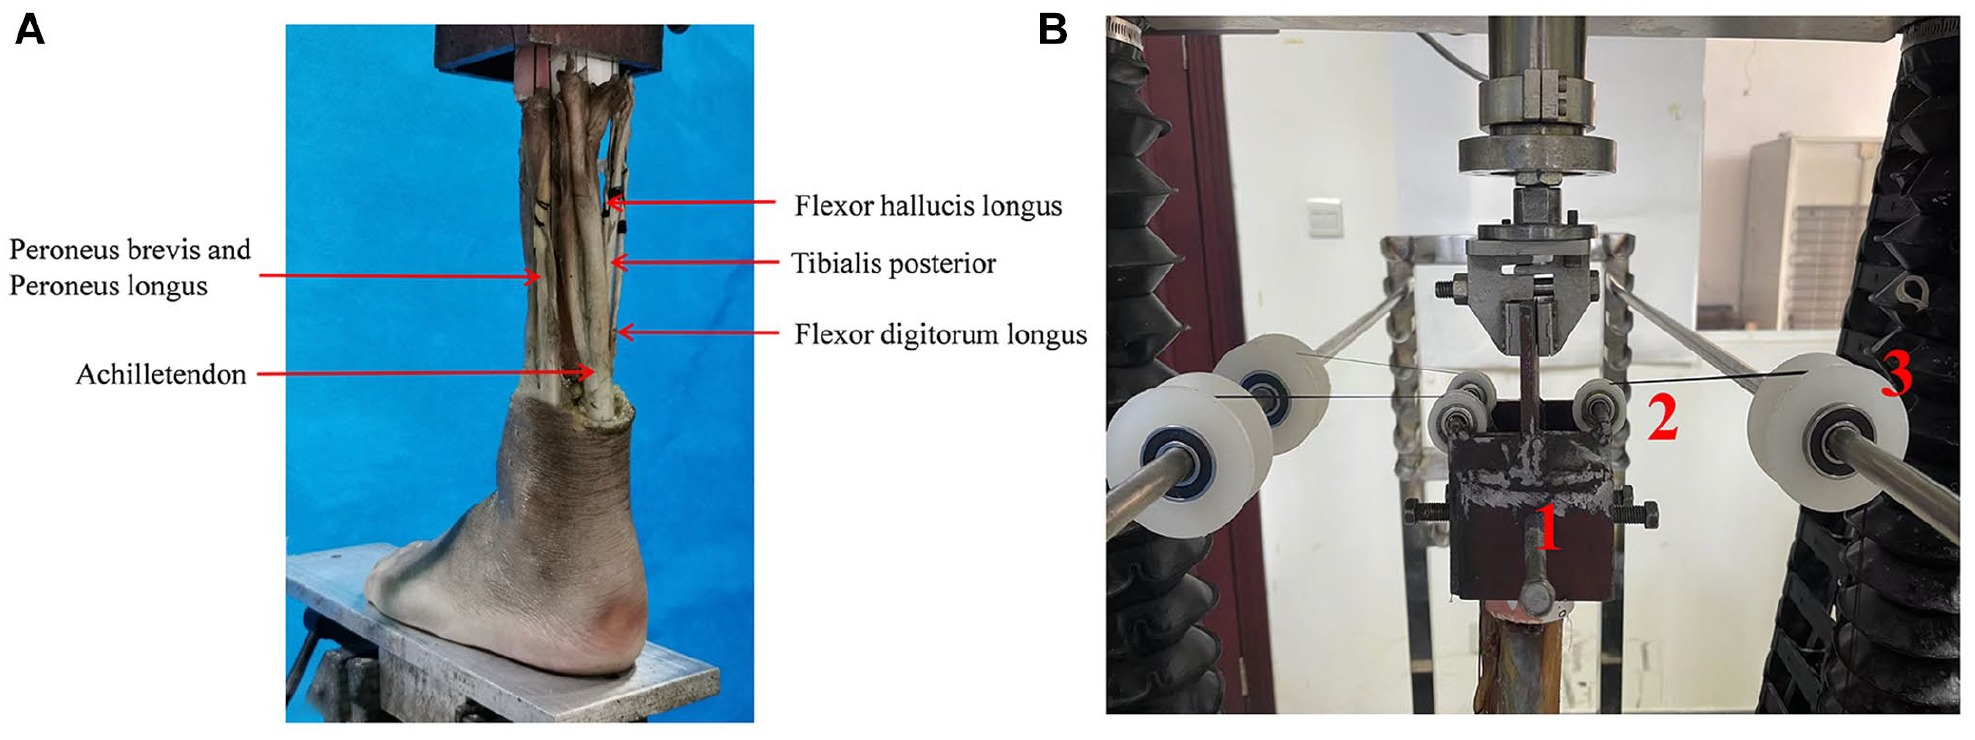
(A) Schematic diagram of tendon loading in the experiment. (B) Diagram of the muscle loading device. Fixture 1 was firmly mounted on the material testing machine and served as the anchoring point for the free ends of several tendons, including the Achilles tendon, posterior tibial tendon, flexor hallucis longus tendon, flexor digitorum longus tendon, as well as the peroneus longus and brevis tendons. From this fixed point, the tendons were guided over pulley 2, located above fixture 1, and subsequently passed through pulley 3 on the loading frame. To simulate muscle loading, custom-designed weights were attached to the distal ends of the tendon sutures, simulating muscle loading for each tendon.
A straight skin incision was made on the medial surface of the MTP-1 joint to access the medial capsule for sensor placement. For the TMT-1 joint, superficial soft tissues were exposed to visualize the joint area, followed by a dorsal-medial capsulotomy to facilitate the insertion of the pressure sensor under manual joint distraction. Model 6900 sensors (matrix dimensions: 14.0 mm × 14.0 mm; density: 62 sensor elements per cm2) were selected to comprehensively cover the articular surfaces of the MTP-1 and TMT-1 joints. To ensure consistent placement, the sensors were inserted into the joint spaces at the same angle and following a standardized procedure until resistance was encountered, confirming firm contact between the sensor and the joint surface. To ensure the accuracy of pressure measurements, the Tekscan 6900 pressure sensor was calibrated using an ElectroForce R3510 material testing machine. The sensor was connected to the Tekscan interface box and linked to a computer running the I-Scan software to confirm proper signal acquisition. The sensor was then placed flat on the loading platform, and the platform was adjusted to make light contact without applying initial pressure. During calibration, a series of known loads (eg, 0, 50, 100, and 150 N) was applied vertically using the testing machine. Simultaneously, force-time data from the testing machine and output signals from the I-Scan system were recorded. These data were used to establish a calibration curve correlating the Tekscan output with actual force values. The resulting calibration file was saved. Individual sensors were assigned to each specimen to mitigate potential sensitivity decreases during biomechanical testing, thereby maintaining data accuracy and validity. To secure the sensors, a single figure-of-8 capsular stitch was applied in all specimens. This standardized placement protocol was consistently implemented across the normal, preoperative, and postoperative states, minimizing variability in sensor positioning and ensuring the reliability and comparability of pressure measurements.
Loading tests were performed at a rate of 30 N/s until reaching a maximum load of 700 N.14,17 Customized weights were used to apply tension to the tendons, simulating muscle loading. The applied loads were 200 N for the Achilles tendon, 40 N for the posterior tibial tendon, and 22 N each for the flexor digitorum longus and flexor hallucis longus tendons. A combined load of 35 N was applied to the peroneus longus and peroneus brevis tendons. 27 Data were collected after 3 loading cycles to minimize creep effects. The loading device is shown in Figure 2B. Fixture 1 was firmly mounted on the material testing machine and served as the anchoring point for the free ends of several tendons, including the Achilles tendon, posterior tibial tendon, flexor hallucis longus tendon, flexor digitorum longus tendon, as well as the peroneus longus and brevis tendons. From this fixed point, the tendons were guided over pulley 2, located above fixture 1, and subsequently passed through pulley 3 on the loading frame. To simulate muscle loading, custom-designed weights were attached to the distal ends of the tendon sutures, simulating muscle loading for each tendon.
Operative Technique
For each operative specimen, a 2-cm vertical incision was made on the dorsum between the first and second metatarsal heads. This was followed by adductor tenotomy, extensor hallucis brevis resection,6,26 transverse intermetatarsal ligament release, and lateral capsule release. After the lateral capsule release, a longitudinal incision was extended medially beyond the bunion.
The osteotomy apex was positioned on the metatarsal head, 1 to 1.5 cm proximal to the MTP-1 joint, with a chevron angle of 60 degrees. 4 An “inverted V” osteotomy was then performed using a saw blade.3,7 In group B1, the distal first metatarsal segment was not moved plantarly (0 mm) but was laterally displaced by 2, 4, and 6 mm (Figure 3A). In group B2, a 2-mm plantar displacement was followed by the same lateral displacements (Figure 3B). Similarly, in group B3, the distal segment was moved plantarly by 4 mm before undergoing identical lateral displacements (Figure 3C). The gap created by the plantar displacement was filled with an allogeneic bone graft. And the lateral and plantar displacements of the distal osteotomy segment were precisely measured and evaluated using a digital caliper. Lateral displacement (L) was measured as the perpendicular distance between 2 parallel lines drawn along the proximal and distal segments of the first metatarsal (Figure 4A). Plantar displacement (P) was measured as the distance the distal segment moved along the inclined plane of the osteotomy (Figure 4B). After lateral displacement, screws were inserted dorsomedially and plantolaterally. Pre- and postoperative radiographs were taken to confirm deformity correction and implant placement (Figure 5).
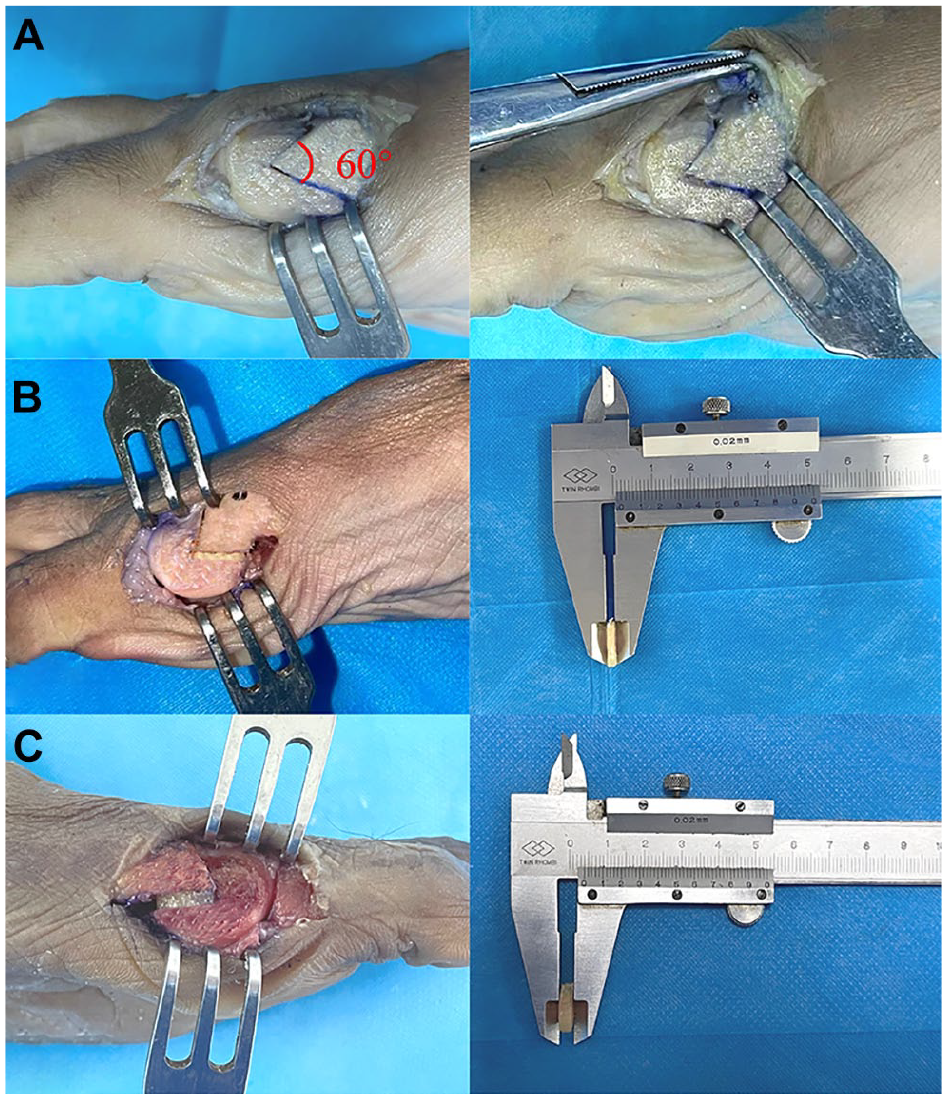
Experimental groups demonstrating varying degrees of plantar displacement in Chevron osteotomy. (A) Group B1: no plantar displacement (0 mm), representing a traditional chevron osteotomy. (B) Group B2: 2-mm plantar displacement, achieved by filling the osteotomy gap with a 2-mm allogeneic bone graft. (C) Group B3: 4-mm plantar displacement, achieved by filling the osteotomy gap with a 4-mm allogeneic bone graft.
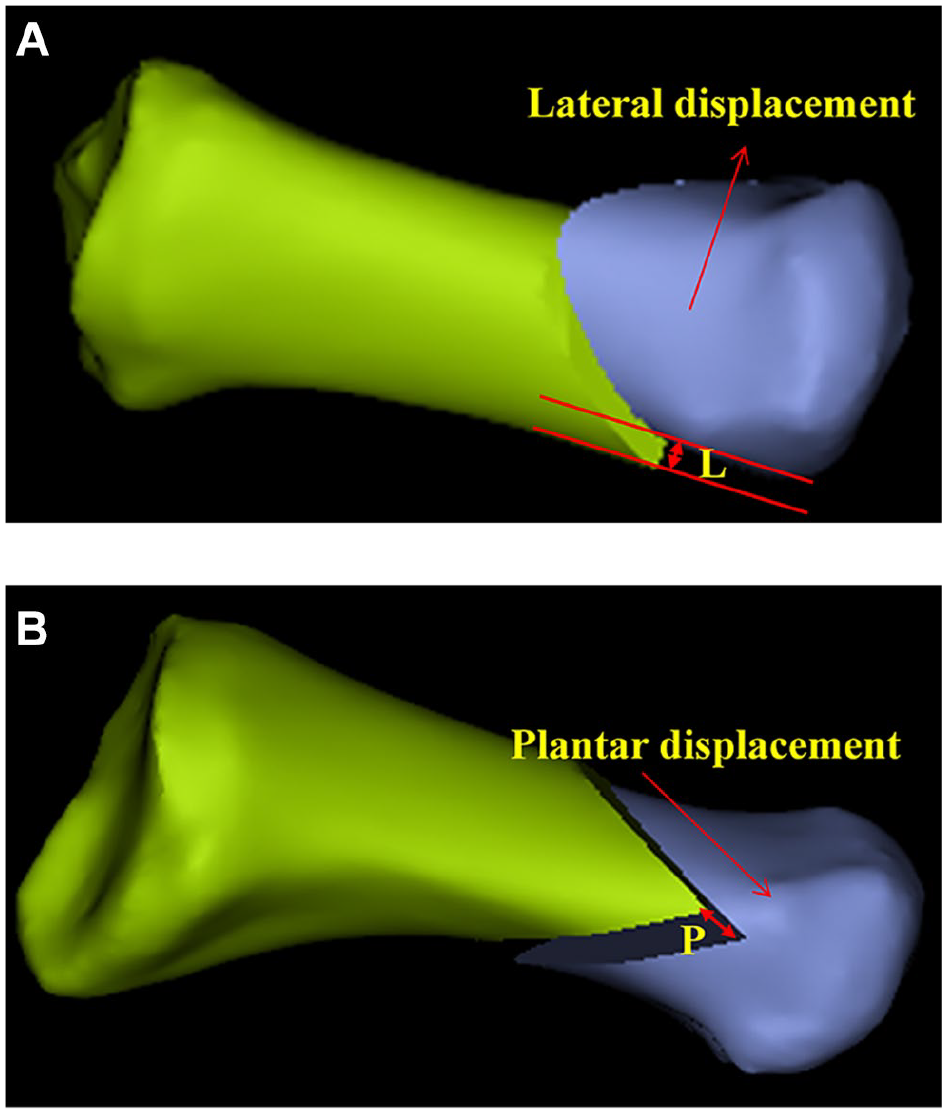
Schematic illustration of the evaluation of lateral and plantar displacements. (A) Superior view of the first metatarsal. Lateral displacement (L) is defined as the perpendicular distance between 2 parallel lines drawn along the proximal and distal segments of the first metatarsal. (B) Medial view of the first metatarsal. Plantar displacement (P) refers to the distance the distal segment is shifted along the oblique osteotomy plane.
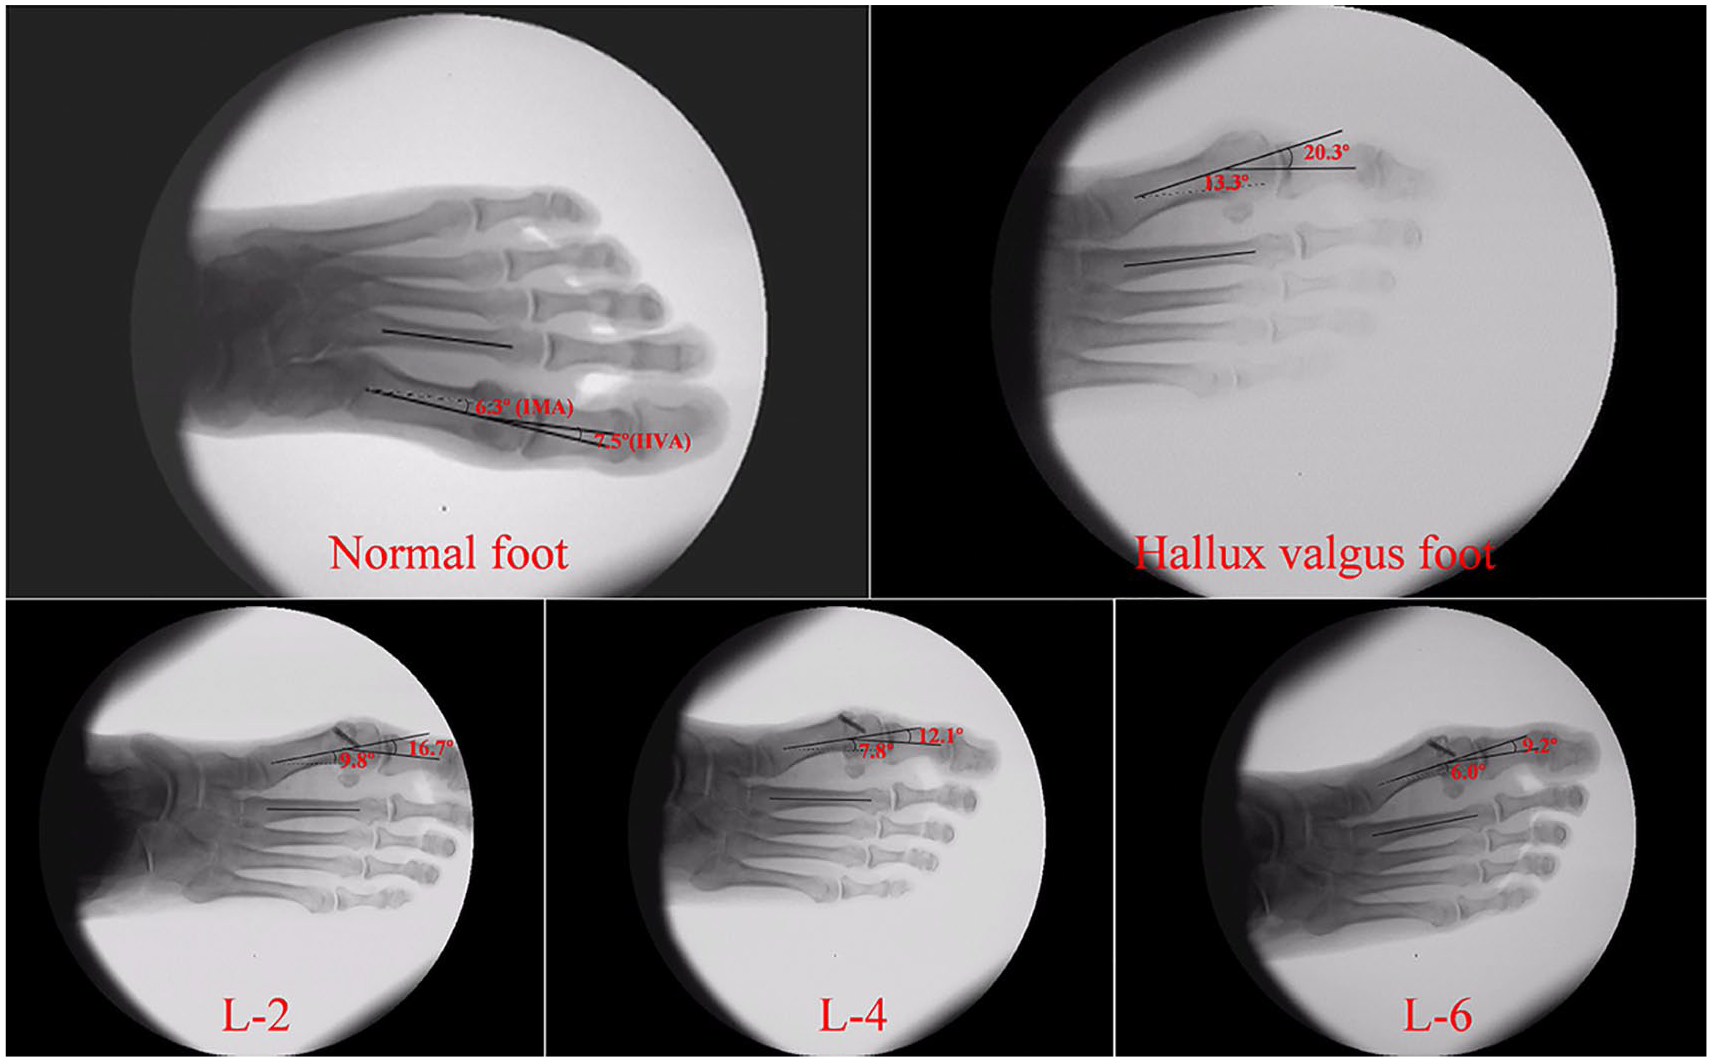
Representative radiographic images of normal foot, as well as preoperative and postoperative hallux valgus foot. The hallux valgus angle (HVA) is defined as the angle between the longitudinal axes of the first metatarsal and the proximal phalanx. The intermetatarsal angle (IMA) is defined as the angle between the longitudinal axes of the first and second metatarsals.
Statistical Analysis
Statistical analyses were performed using the SPSS 20.0 software package (SPSS Inc., USA). Results were expressed as mean ± SD. Before comparisons, normality tests and tests for homogeneity of variance were conducted for data from both normal and hallux valgus feet. An independent sample t test was then used to compare the contact force, peak pressure, and contact area of the MTP-1 and TMT-1 joints, as well as HVA and IMA, between the 2 groups. Additionally, repeated measures analysis of variance was employed to evaluate the effects of plantar and lateral displacements of the distal first metatarsal on the contact force, peak pressure, and contact area of the MTP-1 and TMT-1 joints, as well as HVA and IMA.
Results
Preoperative imaging data showed that the HVA (P < .01) and IMA (P < .01) of hallux valgus feet were significantly greater than those of normal feet (Figure 6). Postoperative radiographic measurements of the HVA and IMA indicated that distal lateral displacement during osteotomy had a significant effect on both HVA (P < .01) and IMA (P < .01). In contrast, plantar displacement had no significant effect on either HVA or IMA, and no interaction was observed between distal plantar displacement and lateral displacement with respect to their effects on HVA and IMA (Table 1). Additionally, when the distal metatarsal segment was laterally displaced by 4 or 6 mm, the HVA and IMA of hallux valgus feet were corrected to within the normal range (Table 2, Figure 7).
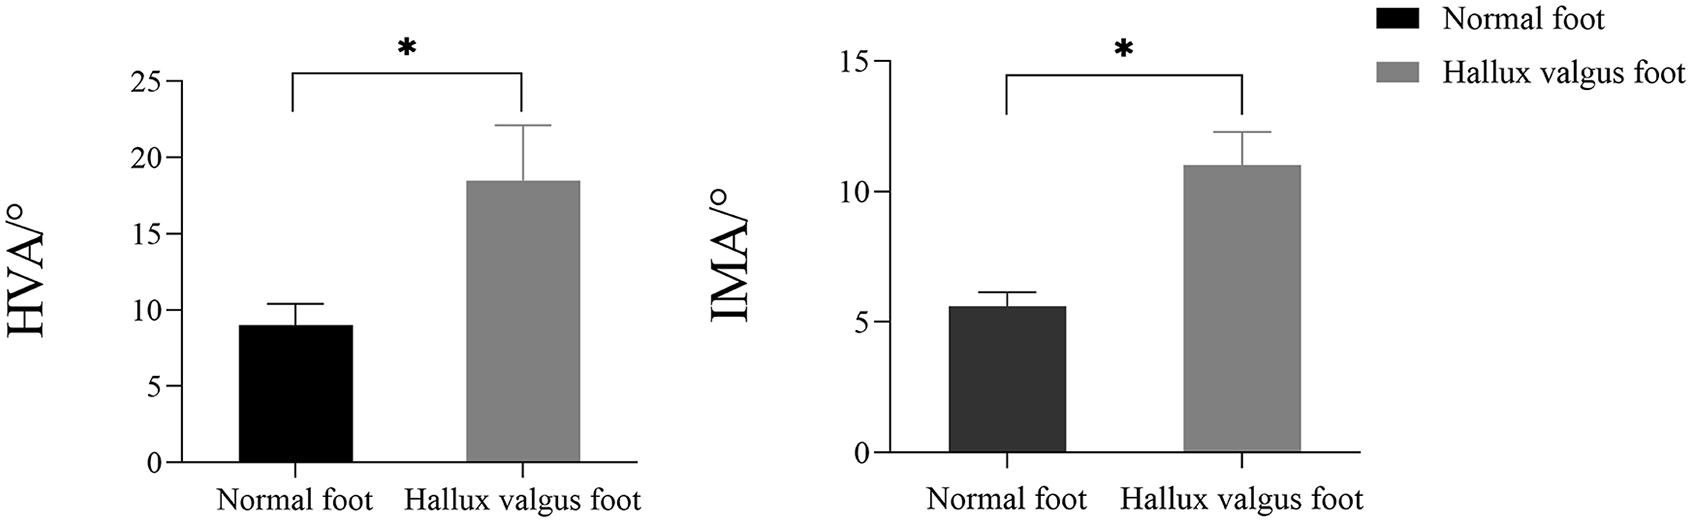
Comparison of hallux valgus (HVA) and intermetatarsal angles (IMA) between normal feet and hallux valgus feet. *P < .05.
Effects of Plantar and Lateral Displacement Distances on HVA and IMA in Hallux Valgus Specimens (n = 12).
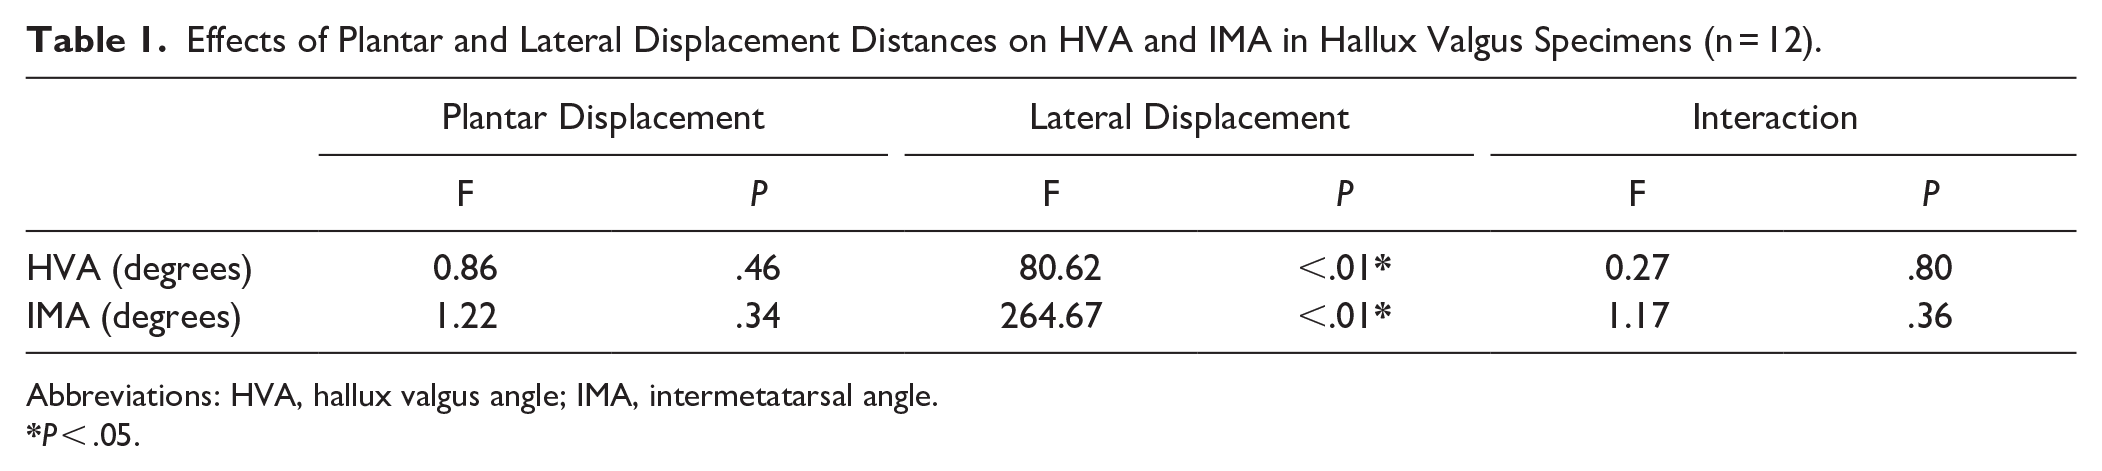
Abbreviations: HVA, hallux valgus angle; IMA, intermetatarsal angle.
HVA and IMA After Different Plantar and Lateral Displacements in Hallux Valgus Feet (n = 12). a
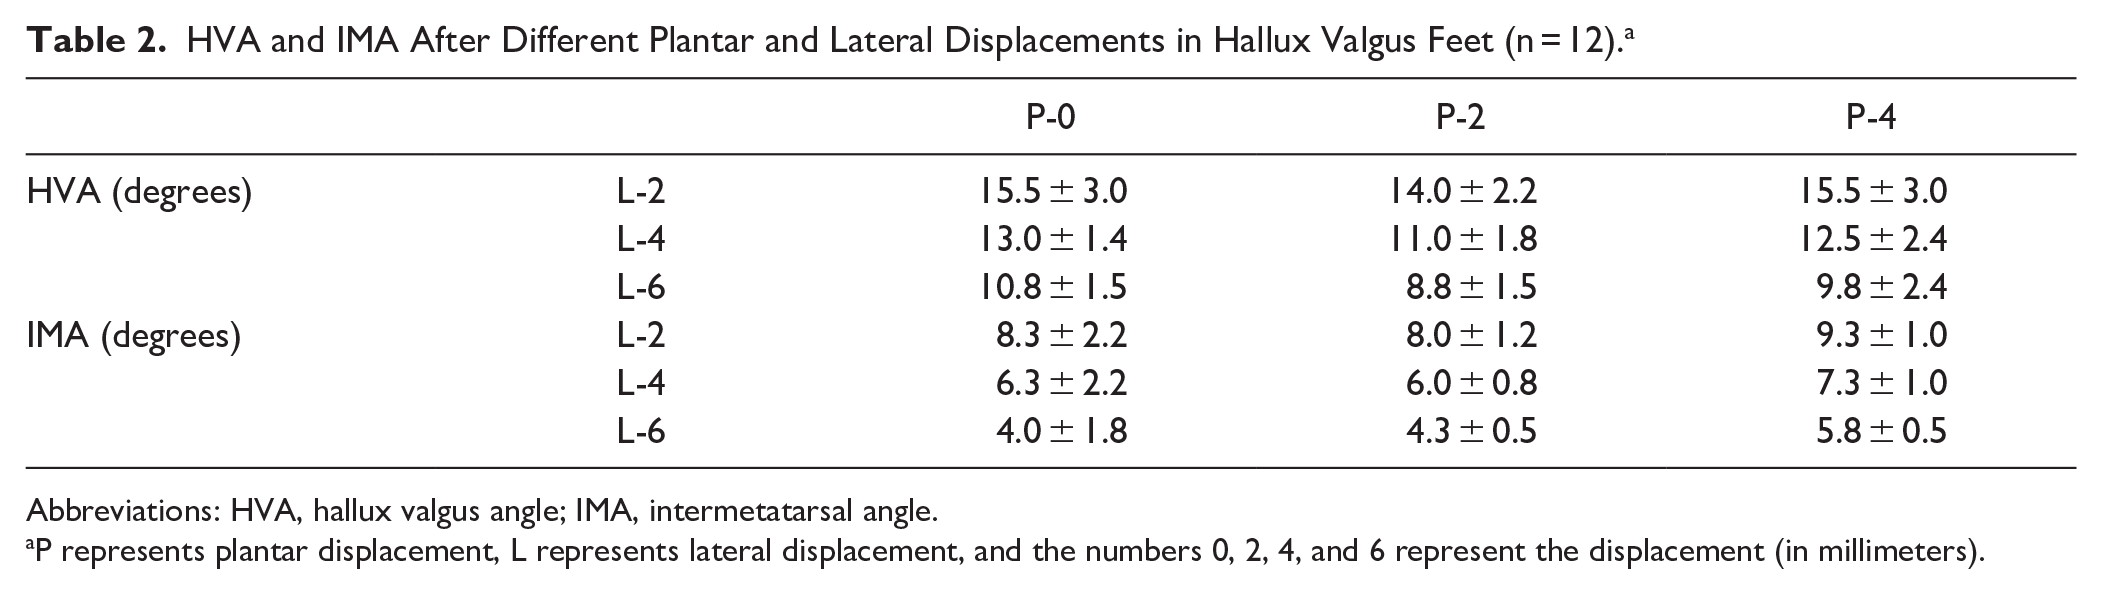
Abbreviations: HVA, hallux valgus angle; IMA, intermetatarsal angle.
P represents plantar displacement, L represents lateral displacement, and the numbers 0, 2, 4, and 6 represent the displacement (in millimeters).
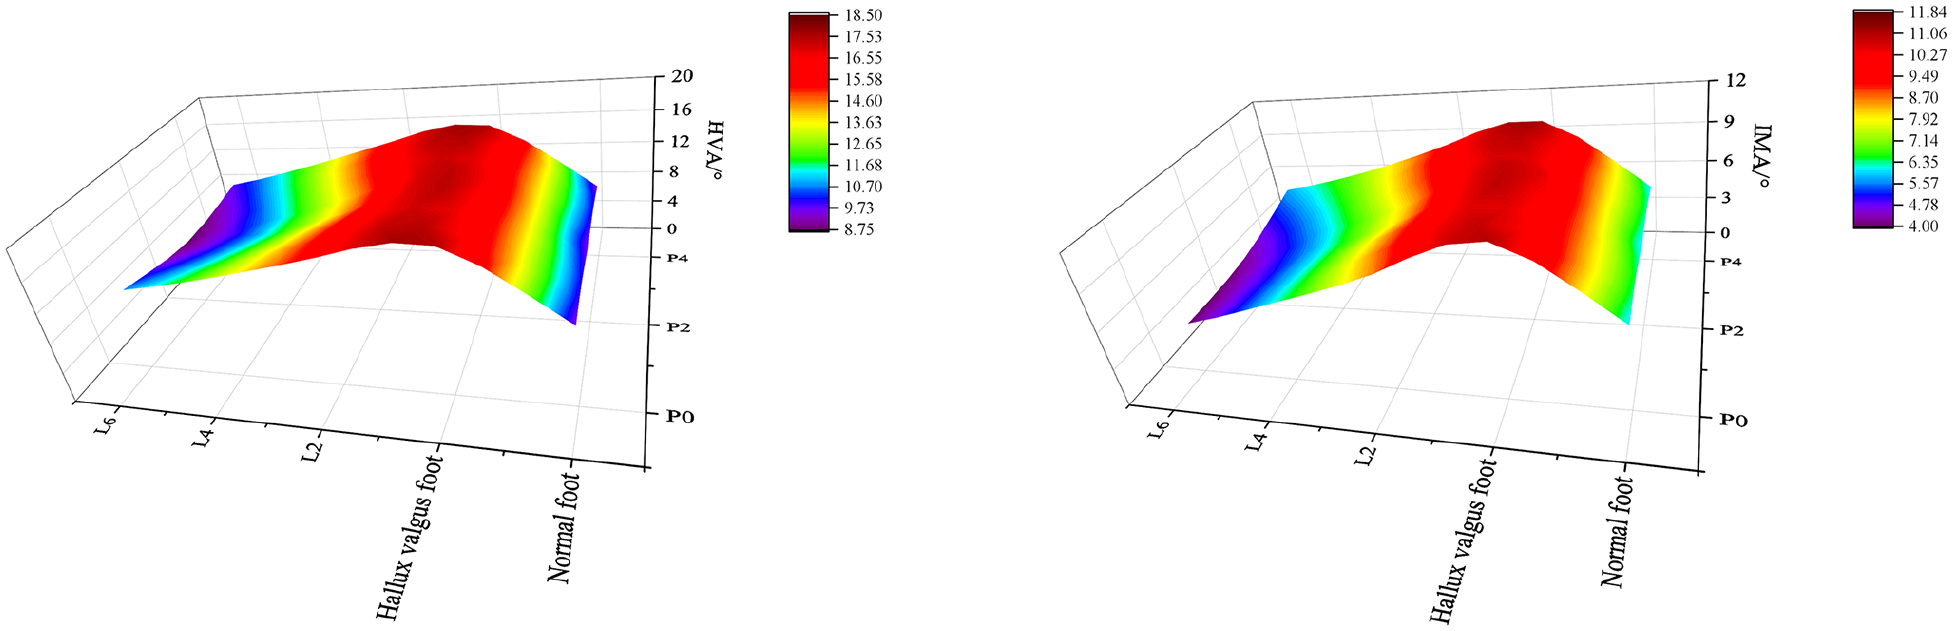
Heatmap illustrating the variations in HVA and IMA with changes in lateral and plantar displacement distances. The heatmap displays the distribution of HVA and IMA values under varying displacement conditions. HVA, hallux valgus angle; IMA, intermetatarsal angle.
The contact force at the TMT-1 joint in hallux valgus feet was significantly higher than in normal feet (P < .01), as was the peak pressure at the MTP-1 joint (P = .01). However, no significant differences were observed in the contact area of the MTP-1 and TMT-1 joints between the 2 groups (Table 3, Figure 8).
Comparison of Contact Force, Peak Pressure, and Contact Area of the MTP-1 and TMT-1 Joints Between Normal and Hallux Valgus Feet (n = 16).
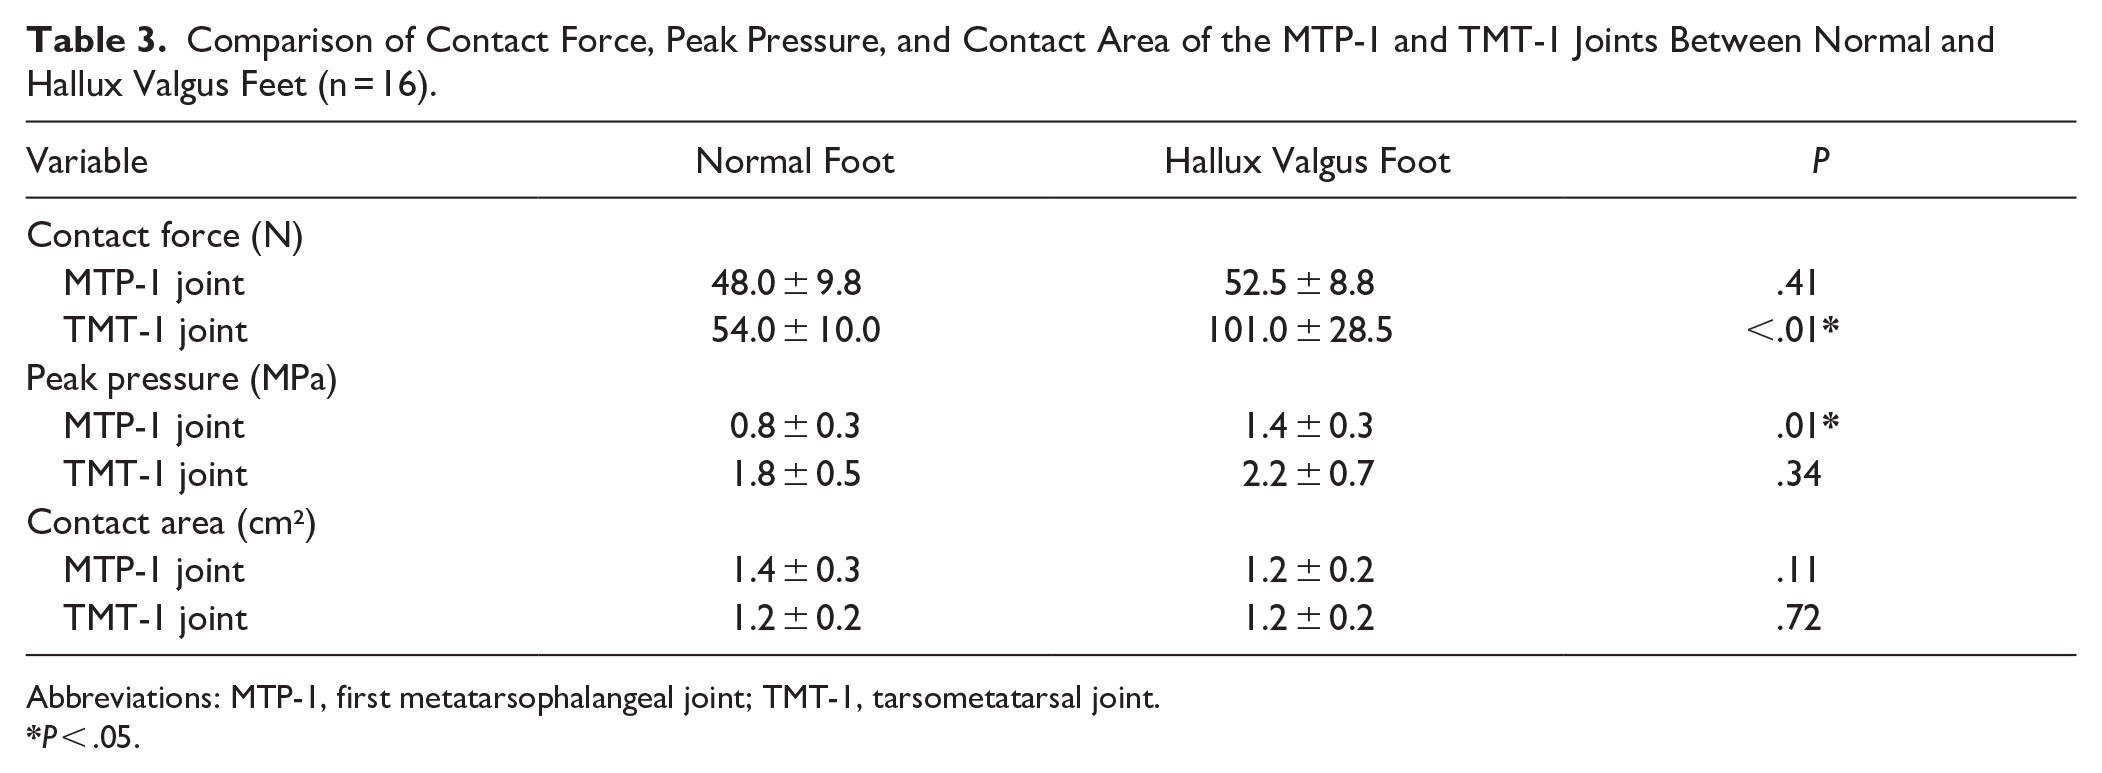
Abbreviations: MTP-1, first metatarsophalangeal joint; TMT-1, tarsometatarsal joint.
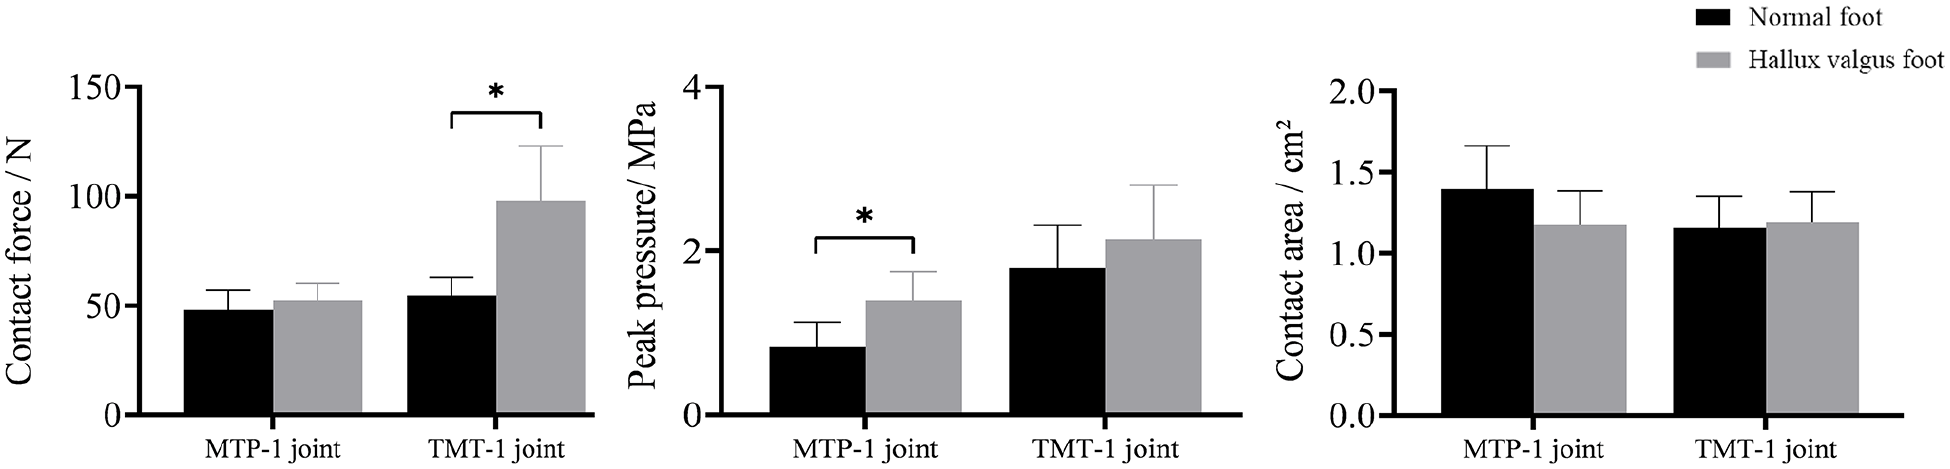
Comparison of joint contact force, peak pressure, and contact area between normal feet and hallux valgus feet at the MTP-1 joint and TMT-1 joint. MTP-1, first metatarsophalangeal joint; TMT-1, tarsometatarsal joint. *P < .05.
The results of the 2-way analysis of variance indicated that distal lateral displacement during osteotomy had a significant effect on the contact force (P < .01), peak pressure (P < .01), and contact area (P < .01) of the MTP-1 joint. Additionally, a significant interaction was observed between distal plantar displacement and lateral displacement on the contact force, peak pressure, and contact area of the MTP-1 joint (P < .01 for all) (Table 4). From a numerical perspective, irrespective of the extent of plantar displacement, an overall decreasing trend was noted in the contact force, peak pressure, and contact area of the MTP-1 joint as the distal lateral displacement increased (Table 5, Figure 9).
Effects of Plantar and Lateral Displacement Distances on Contact Force, Peak Pressure, and Contact Area of the MTP-1 and TMT-1 Joints in Hallux Valgus Specimens (n = 12).
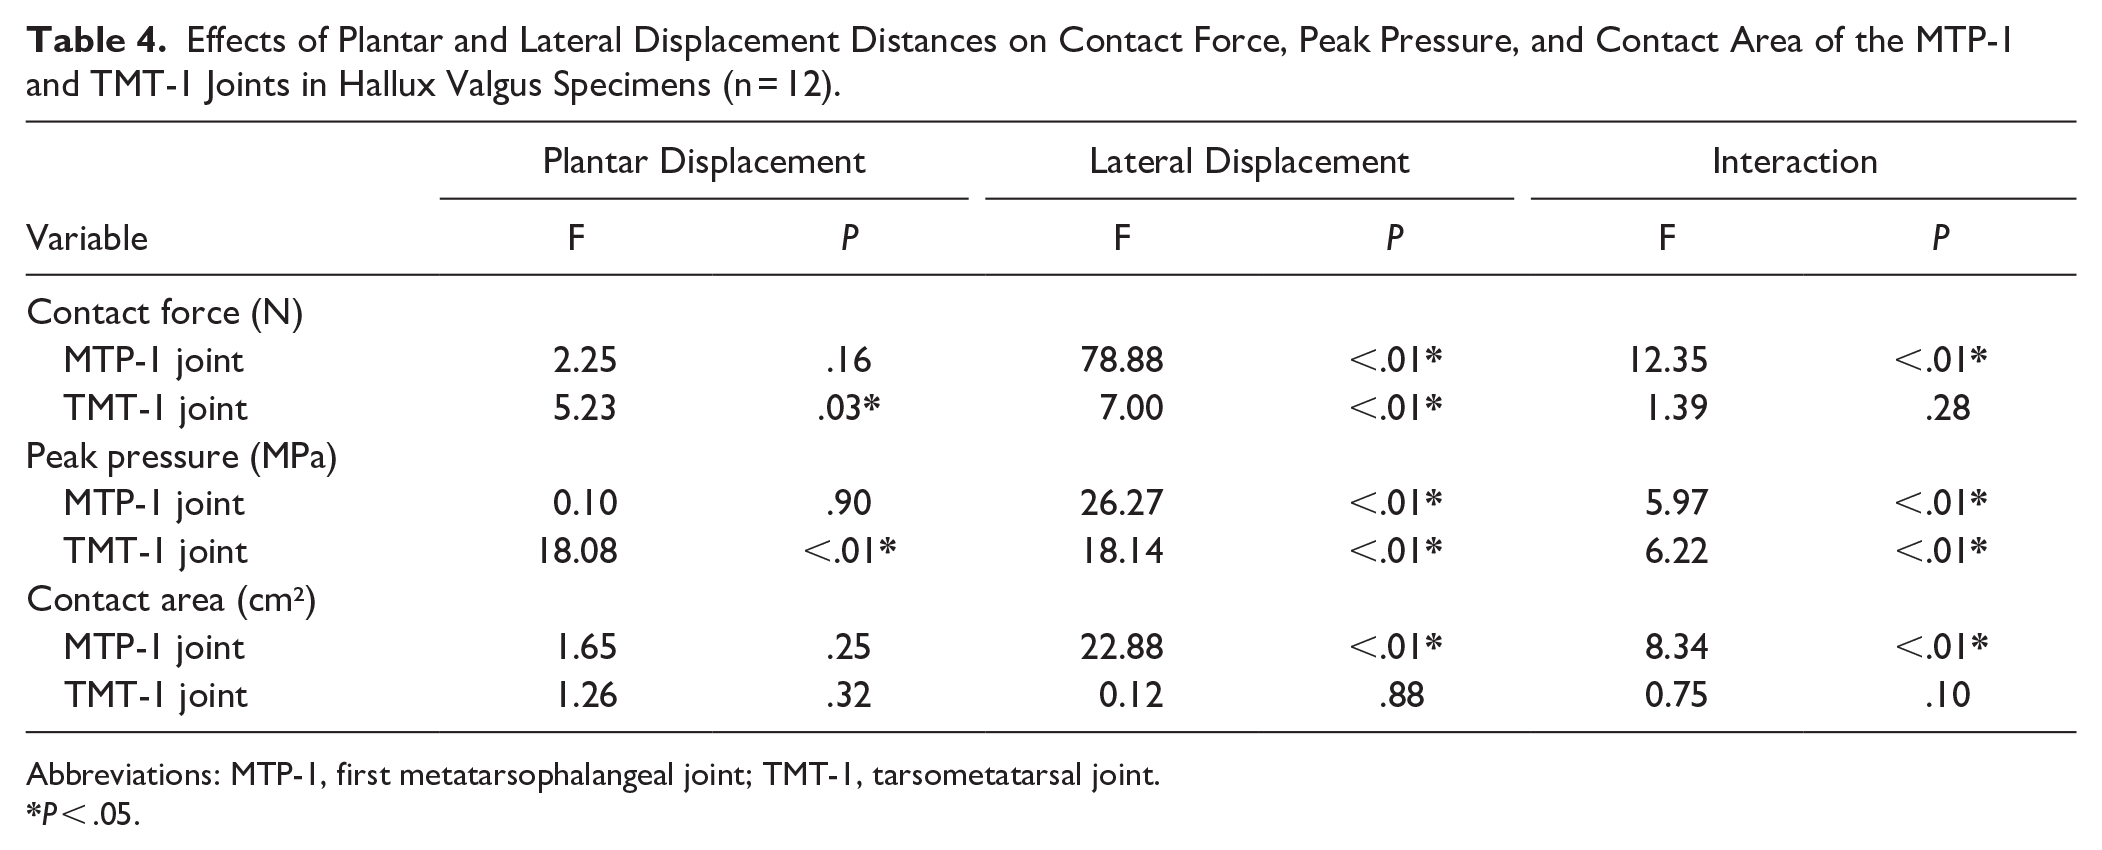
Abbreviations: MTP-1, first metatarsophalangeal joint; TMT-1, tarsometatarsal joint.
Contact Force, Peak Pressure, and Contact Area of the MTP-1 and TMT-1 Joints, After Different Plantar and Lateral Displacements in Hallux Valgus Feet (n = 12).
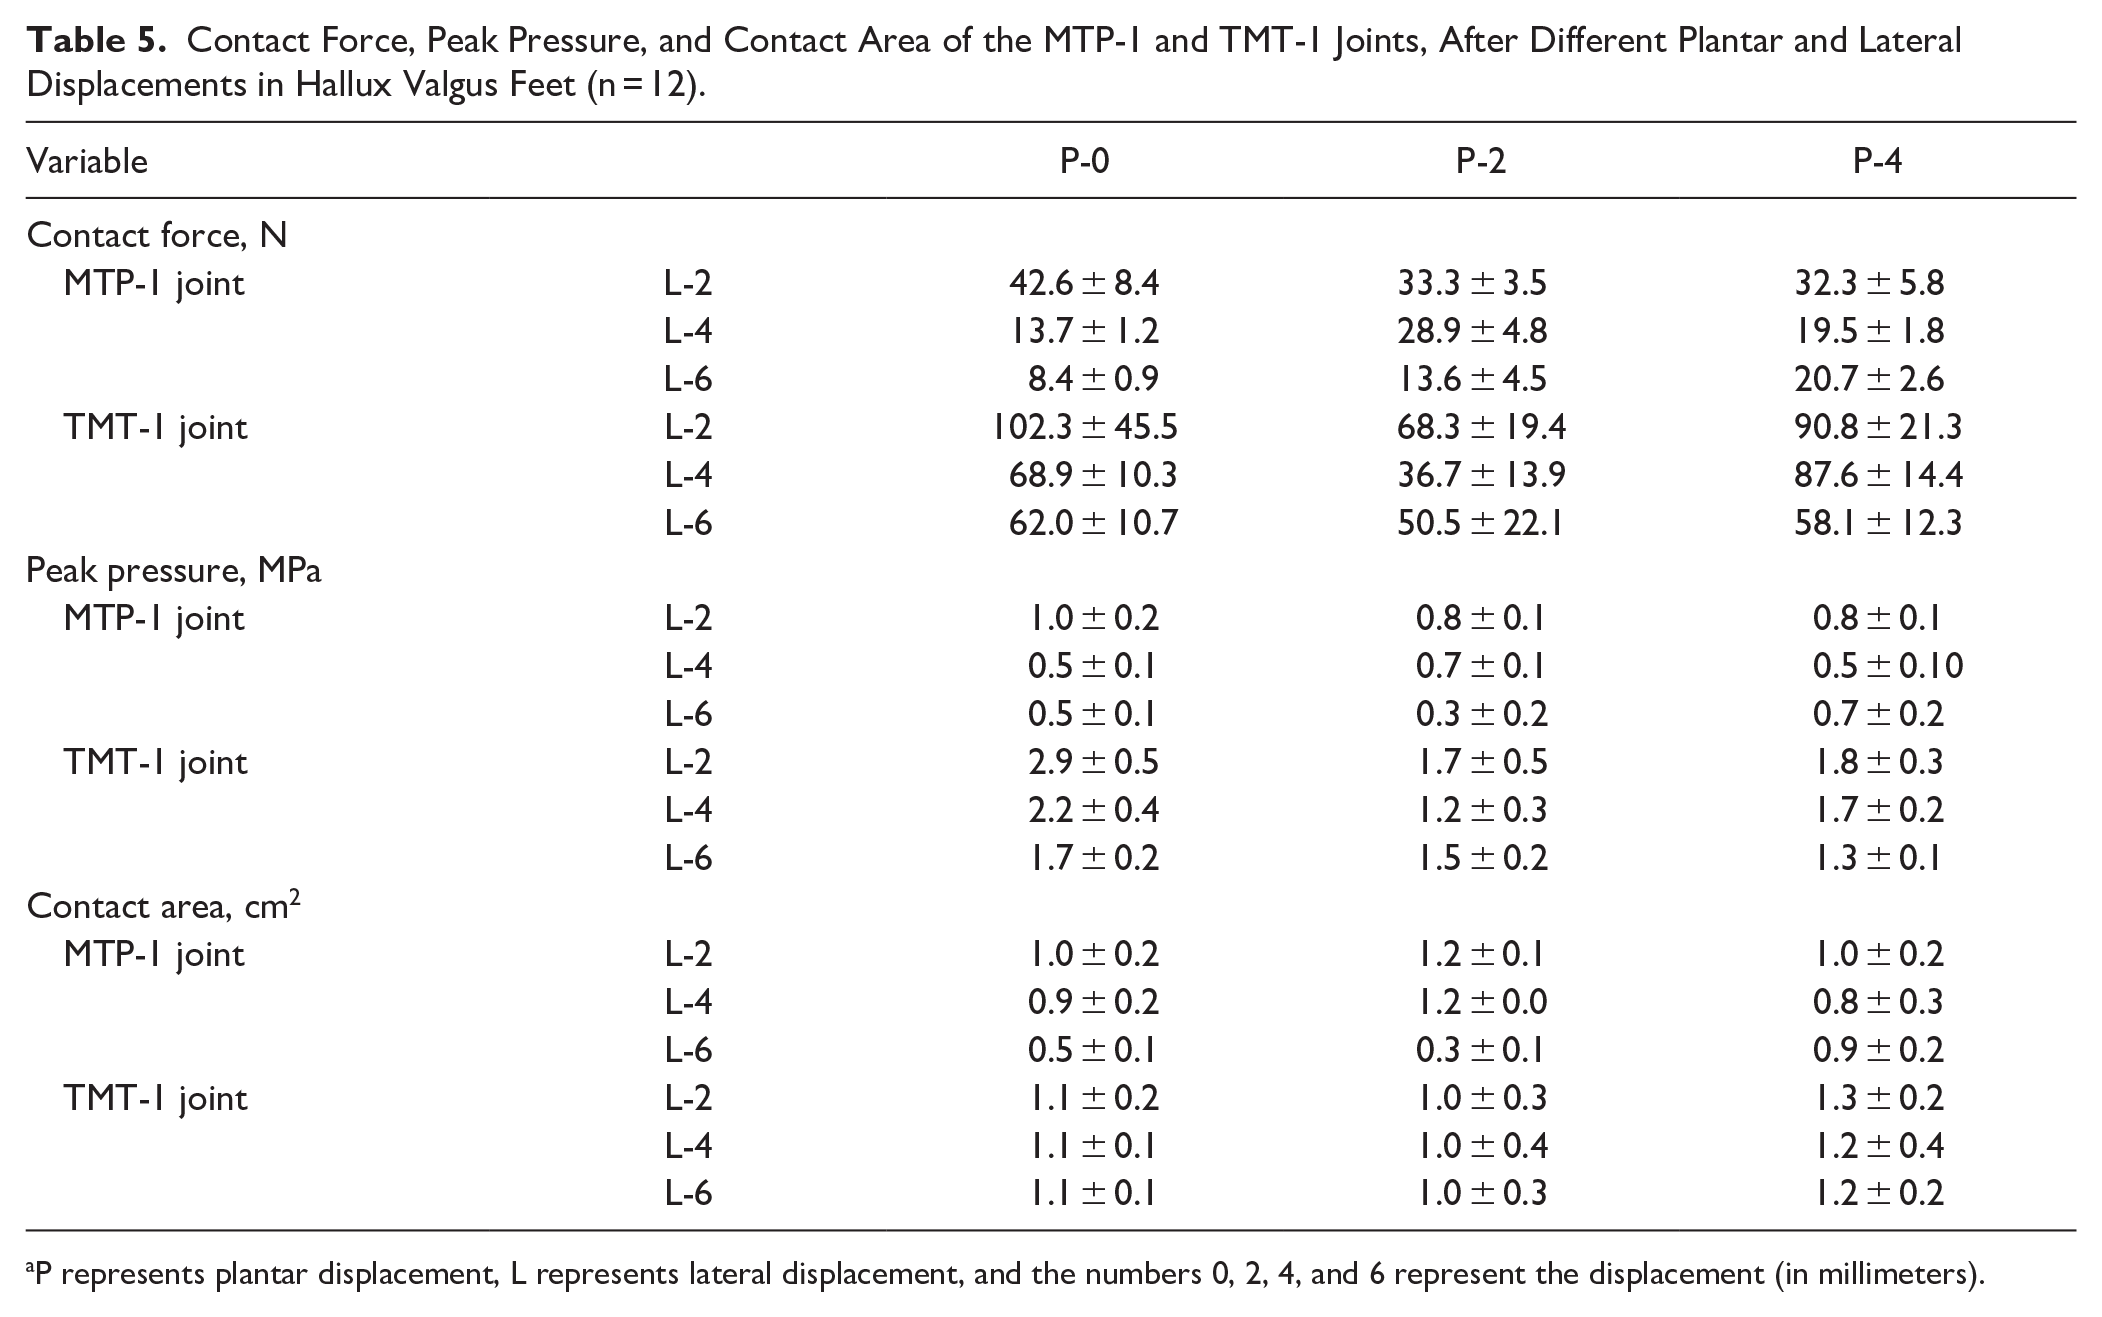
P represents plantar displacement, L represents lateral displacement, and the numbers 0, 2, 4, and 6 represent the displacement (in millimeters).
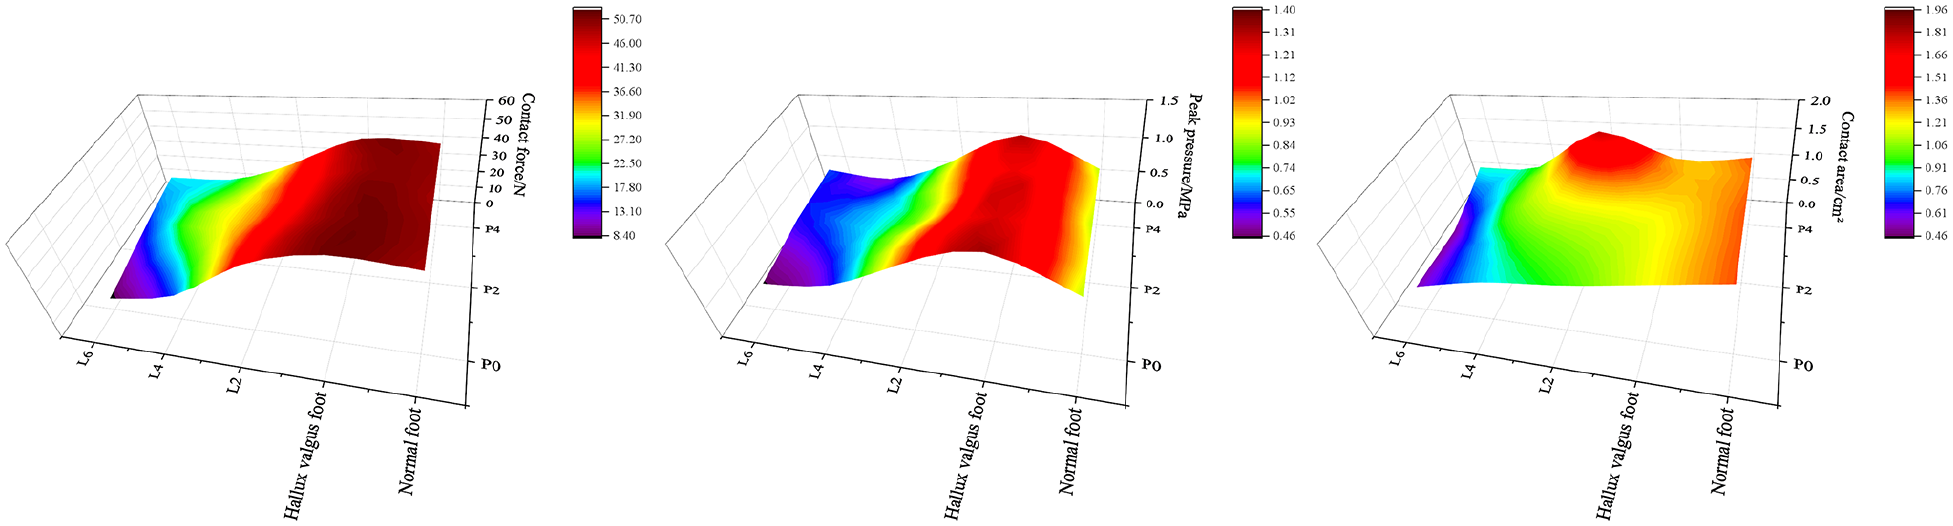
Heatmaps illustrating the variation in joint contact force, peak pressure, and contact area of the MTP-1 joint with changes in lateral and plantar displacement. MTP-1, first metatarsophalangeal.
Distal lateral displacement during osteotomy had a significant effect on the contact force (P < .01) and peak pressure (P < .01) of the TMT-1 joint. In contrast, distal plantar displacement significantly influenced the peak pressure (P < .01) of the joint (Table 4). From a numerical perspective, irrespective of plantar displacement, an overall decreasing trend in the contact force and peak pressure of the TMT-1 joint was observed as the distal lateral displacement increased. Conversely, irrespective of lateral displacement, the peak pressure of the TMT-1 joint initially decreased and subsequently increased with greater distal plantar displacement (Table 5, Figure 10).
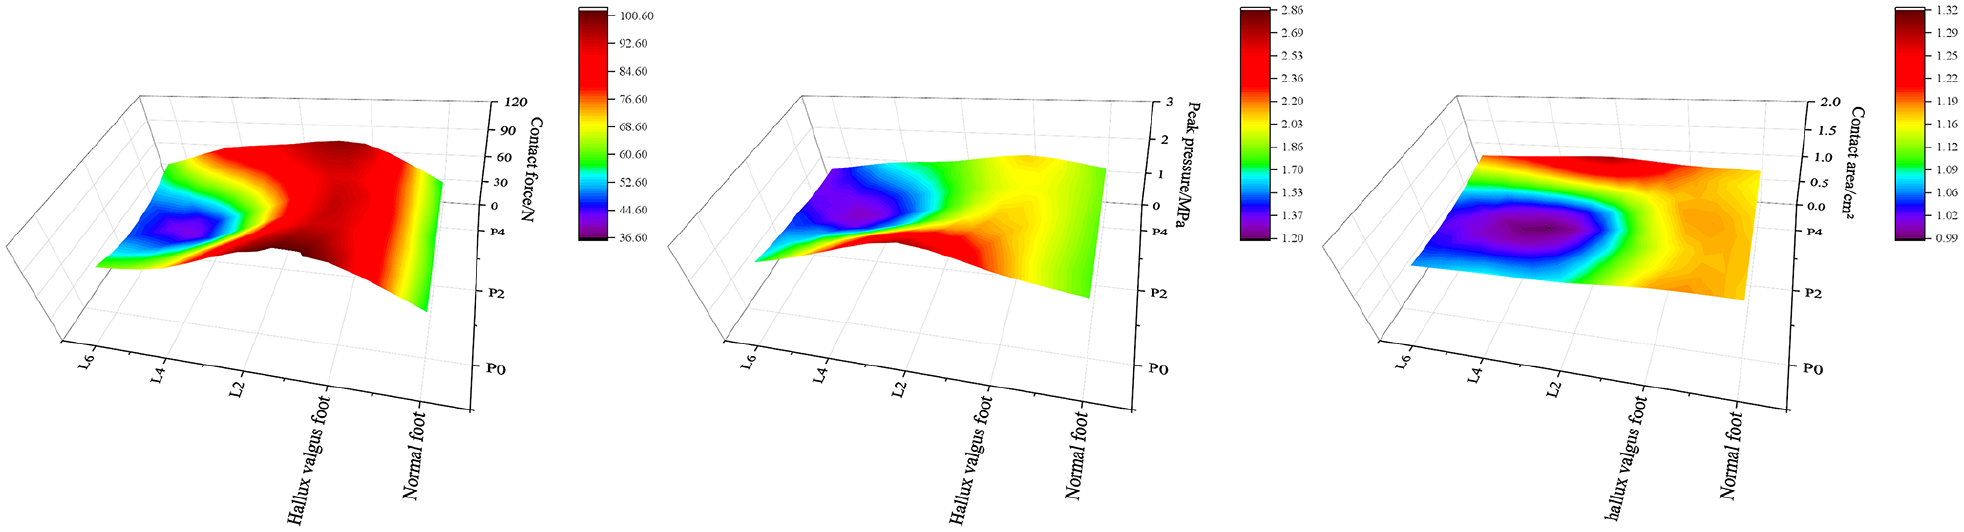
Heatmaps illustrating the variation in joint contact force, peak pressure, and contact area of the TMT-1 joint with changes in lateral and plantar displacement. TMT-1, first tarsometatarsal.
Discussion
This cadaveric study provides quantitative evidence that both lateral and plantar displacement during biplane chevron osteotomy significantly influence joint contact forces and pressures. Our findings demonstrate that lateral displacement in combination with plantar shift produces pressure profiles that resemble those of normal feet in cadaveric testing. These findings address a gap in current surgical planning guidance and support tailored displacement strategies.
Our findings indicated that for every 1 mm of lateral displacement of the distal fragment, the HVA was corrected by approximately 1.30 degrees and the IMA was corrected by approximately 0.97 degrees. This result is largely consistent with the findings of Harper and Matsumoto. Harper, through trigonometric analysis, reported that each 1 mm of lateral displacement of the distal fragment could achieve approximately 1 degree of IMA correction. 12 Similarly, Matsumoto’s study demonstrated that an average lateral displacement of 6.5 mm resulted in a 7.3-degree correction of the IMA. 23 These results collectively support the feasibility of improving IMA correction by increasing lateral displacement in cases of hallux valgus.
After confirming the effectiveness of lateral displacement in correcting the IMA, we further investigated how this displacement affects joint contact characteristics in hallux valgus feet. This study revealed that compared with normal feet, the contact force in the MTP-1 joint of hallux valgus feet increased, whereas the contact area decreased. Consequently, the peak pressure at the MTP-1 joint in hallux valgus feet (1.4 ± 0.34 MPa) was 1.69 times higher than that in normal feet (0.83 ± 0.31 MPa). This finding differs from Kia et al’s 15 study, which reported higher peak pressures in the MTP joints of normal feet. The discrepancy is likely due to methodologic differences; our study applied a 700-N load at the tibiofibular area to simulate single-leg standing, whereas Kia et al’s study used a 50-N dorsiflexion load on the first metatarsal.
As the distal lateral displacement of the osteotomy increased, the contact force, peak pressure, and contact area of the MTP-1 joint all exhibited a gradual decrease. Additionally, there was a significant interaction between distal lateral and plantar displacement, highlighting the importance of considering plantar displacement in surgical planning. For hallux valgus, where a lateral displacement of at least 4 mm is required to correct the HVA and IMA to normal ranges, our results suggest that a combination of 4-mm lateral displacement and 2-mm plantar displacement yields optimal outcomes. Under these conditions, the peak pressure at the MTP-1 joint (0.71 ± 0.13 MPa) closely approximates the normal condition (0.83 ± 0.31 MPa). In contrast, other displacement combinations resulted in peak pressures below 0.71 ± 0.13 MPa, potentially creating a prolonged low-load environment that could impair joint function over time. These findings align with Zhang et al’s 29 finite element analysis, which demonstrated reduced cartilage stress in the MTP-1 joint with a 4-mm lateral displacement compared with untreated hallux valgus feet. However, our study further emphasizes that neither lateral nor plantar displacement should be maximized indiscriminately, as excessive displacement may compromise joint stability or fail to restore physiological load distribution.
Previous biomechanical studies have demonstrated that in normal feet, the second and third tarsometatarsal (TMT) joints are the primary load-bearing joints in the midfoot, with the TMT-1 joint bearing approximately 8% of the axial load. 19 This aligns with our findings, which showed that the TMT-1 joint in normal feet bears 7.71% of the axial load. Similarly, Kraus et al 18 reported that the TMT-1 joint in cadaveric specimens with hallux valgus bore slightly more force, about 10% of the applied load. However, this value is lower than the 14.43% observed in our study, likely because of differences in deformity severity. Our study focused on mild and moderate hallux valgus cases, whereas Kraus et al examined severe cases. In our analysis, increasing distal plantar displacement during osteotomy in hallux valgus feet led to an initial decrease followed by an increase in the contact force and peak pressure in the TMT-1 joint. Conversely, both parameters gradually decreased with increasing lateral displacement. Notably, the contact area exhibited no significant changes. When distal plantar displacement was set to 0 mm, the peak pressure in the TMT-1 joint was relatively high (2.86 ± 0.52 MPa). Although this value is lower than the 4.7-MPa threshold associated with cartilage cracking and fissures, as reported by Sadeghi et al, 25 it exceeds the normal peak pressure (1.79 ± 0.52 MPa). Prolonged exposure to elevated pressure levels could increase the risk of cartilage damage and early-onset arthritis. Given that a lateral displacement of at least 4 mm is necessary to correct the HVA and IMA to normal ranges in our hallux valgus cases, we propose that a combination of 4-mm lateral displacement and 4-mm plantar displacement most effectively restores peak pressure at the TMT-1 joint to normal levels. This approach balances deformity correction with the preservation of joint health, minimizing the risk of mechanical overload and associated complications.
Limitations
This study has several important limitations. First, as a cadaveric investigation, our findings may not fully reflect the biological and functional responses observed in living patients, including healing, remodeling, and pain. Second, we applied fixed lateral and plantar displacement values (2, 4, and 6 mm) across all specimens, regardless of differences in first metatarsal size or morphology. This uniform displacement approach, although standardized for comparison, may limit the direct clinical applicability of our findings to patients with smaller or larger anatomy, affecting generalizability. Third, although we used Tekscan sensors for real-time joint pressure mapping, sensor degradation over time and variable contact conformity may introduce measurement variability—mitigated in part by using new sensors for each specimen and performing calibration. Lastly, while standing load conditions were simulated using axial loading and soft tissue tensioning, dynamic gait forces and neuromuscular influences were not replicated, which limits extrapolation to in vivo performance.
Conclusion
Our cadaveric findings suggest that a lateral displacement of 4 mm, paired with 2 to 4 mm of plantar shift, most effectively aligns MTP-1 and TMT-1 joint pressures with those observed in normal feet. These findings may serve as a biomechanical reference point to inform surgical planning, but clinical studies are needed to validate whether these pressure patterns translate into improved patient outcomes.
Supplemental Material
sj-pdf-1-fai-10.1177_10711007251344255 – Supplemental material for Biplane Chevron Osteotomy in Hallux Valgus
Supplemental material, sj-pdf-1-fai-10.1177_10711007251344255 for Biplane Chevron Osteotomy in Hallux Valgus by Dong Ma, Yining Wang, Chujiang Xu, Jingxing Dai, Zhengkuan Feng, Wanqi Yu, Guangwei Xu, Jin Xiao, Shizhen Zhong, Jun Ouyang and Lei Qian in Foot & Ankle International
Footnotes
Ethical Approval
The experimental design was approved by the Medical Ethics Committee of the Hospital of Integrated Traditional Chinese and Western Medicine, Southern Medical University, prior to the commencement of the study.
Declaration of Conflicting Interests
The author(s) declared the following potential conflicts of interest with respect to the research, authorship, and/or publication of this article: Lei Qian, MD, reports disclosures related to manuscript from the Basic and Applied Basic Research Project in Guangzhou (2023A04J1968). Disclosure forms for all authors are available online.
Funding
The author(s) disclosed receipt of the following financial support for the research, authorship, and/or publication of this article: the Basic and Applied Basic Research Project in Guangzhou 2023A04J1968.
References
Supplementary Material
Please find the following supplemental material available below.
For Open Access articles published under a Creative Commons License, all supplemental material carries the same license as the article it is associated with.
For non-Open Access articles published, all supplemental material carries a non-exclusive license, and permission requests for re-use of supplemental material or any part of supplemental material shall be sent directly to the copyright owner as specified in the copyright notice associated with the article.