






Abstract
Background:
The Progressive Collapsing Foot Deformity (PCFD) classification categorizes deformity patterns into 5 classes (A, hindfoot valgus; B, midfoot/forefoot abduction; C, medial column collapse; D, peritalar subluxation; E, ankle valgus). Currently, the classifying process relies on surgeons' experience and interpretation of clinical and radiographic measurements. The goal of the present study was to establish cut-off threshold values for commonly used PCFD measurements assessing class A to D, using 2 large cohorts of PCFD patients and controls.
Methods:
This prospective comparative diagnostic study included 154 neutrally aligned or asymptomatic flatfoot volunteers (103 females, mean age 41.7 years, body mass index [BMI] 28.9) and 321 PCFD patients (136 females, mean age 50.7 years, BMI 29.8). Participants underwent weight-bearing computed tomography (WBCT). Measurements were obtained after blinded segmentation and included hindfoot moment arm (HMA, class A), talonavicular coverage angle (TNCA) and talus-first metatarsal angle axial (TFMA-A, class B), talus-first metatarsal angle sagittal (TFMA-S) and forefoot arch angle (FAA, class C), and coverage maps (middle facet [MF], posterior facet [PF], sinus tarsi [ST], class D). Receiver operating characteristic curves, Youden indexes, and areas under the curves (AUCs) identified optimal cut-offs. A partition prediction model refined those values, and a multivariate analysis identified independent predictors of symptomatic PCFD.
Results:
Optimal cut-off values (all P < .0001) included the following: HMA ≥ 13.9 mm (AUC 85.3%, class A); TNCA ≥ 38.7° (AUC 84.4%) and TFMA-A ≥ 20.3° (AUC 82.1%, class B); FAA ≤ 8.7° (AUC 83.9%) and TFMA-S ≥ 18.7° (AUC 82.9%, class C); MF coverage ≤ 73.5% (AUC 73.4%), PF coverage ≤ 84.5% (AUC 82.7%), and ST coverage ≥ 25.7% (AUC 84.4%, class D). HMA, TNCA, MF, and ST coverages were identified as independent predictors of PCFD.
Conclusion:
This study established robust cut-off values for PCFD measurements across classes A-D using large comparative cohorts, significantly enhancing diagnostic performance (AUC ≥ 80% for most). These thresholds improve the clinical applicability and reliability of the PCFD classification, supporting clinical and surgical decision making and facilitating future comparative research.
Level of Evidence:
Level II, prospective comparative diagnostic study.
Keywords
Introduction
Flatfoot has historically been approached from various perspectives, producing multiple definitions such as posterior tibial tendon dysfunction and adult acquired flatfoot deformity. 17 Consequently, multiple classification systems designed to stage the deformity has often muddled the distinction between normal flatfoot and pathologic flatfoot.2,8 Recent evidence suggests peritalar subluxation is the primary driver differentiating asymptomatic flatfoot from symptomatic progressive collapsing foot deformity. 4
To address this issue, a 2020 consensus group of experts introduced an updated staging system to differentiate benign flatfoot from a pathologically collapsing foot and coined it the Progressive Collapsing Foot Deformity (PCFD) classification system. The PCFD classification system categorizes the deformities into 5 distinct classes, labeled A through E, each of which can be further identified as either flexible or rigid, corresponding to stages 1 and 2, respectively. 29 Class A deformity is defined by increased hindfoot valgus. Class B is marked by significant forefoot/midfoot abduction. Class C is characterized by a medial column collapse with first-ray instability and forefoot varus. Class D involves peritalar subluxation, which may include sinus tarsi impingement, subtalar joint subluxation, and potentially subfibular impingement in severe cases. Finally, class E covers valgus talar tilt instability of the ankle, with possible deltoid ligament insufficiency.
The aim of the PCFD classification system was to create a comprehensive, descriptive framework for deformity characterization. However, because the system relies heavily on the provider's experience and interpretation of clinical and radiographic assessments, concerns remain regarding its consistency, reliability, and effectiveness.
A recent international survey–based study found that more than 80% of surgeons consider the PCFD classification useful, 5 and studies show strong intraobserver reliability using 2-dimensional (2D) radiographs (85% kappa) 6 and 3-dimensional (3D) cone beam weightbearing CT (WBCT) imaging (98% kappa), demonstrating thereby superiority over conventional radiography, consistent with its inherent protectional flaws that are overcome by the 3D nature of WBCT. 20 However, interobserver reliability for the PCFD staging system has been reported as only moderate (55%-56%), limiting consistency.22,25,26 These findings highlight an opportunity to enhance the system's reliability through clearer definitions and more precise quantitative thresholds for each deformity class. Importantly, these imaging thresholds should serve as adjunctive tools to support clinical judgment, rather than replace comprehensive clinical assessment and decision making.
Therefore, this diagnostic study aimed to establish definitive radiographic cutoff threshold values for commonly used PCFD measurements across classes A through D. We hypothesized that the establishment of highly accurate diagnostic threshold values would be possible for each measurement across the various PCFD classes.
Materials and Methods
Study Design
This dual-center prospective diagnostic study recruited 2 distinct cohorts of volunteer controls from the local community: one with clinically neutral foot alignment and another with asymptomatic flatfoot alignment. These cohorts were prospectively combined to form a single heterogenous control cohort to reflect the spectrum of foot alignment in the general population. This group was compared with a retrospective cohort of symptomatic PCFD patients.
We secured ethical approval from the institutional review board (approval number: 201912144). Additionally, our study adhered to STROBE (Strengthening the Reporting of Observational Studies in Epidemiology) guidelines.
Study Population
Neutrally aligned asymptomatic controls
Adults aged ≥18 years without symptoms, prior foot/ankle surgeries, or clinical flatfoot were recruited and enrolled. Eligibility required being able to insert the tip of the doctor's index finger beneath the medial arch while standing in bilateral natural stance.4,7,12 Participants underwent either unilateral or bilateral WBCT scans of their feet/ankles. A hindfoot moment arm (HMA) with more than 10 mm varus resulted in noninclusion. 31
Asymptomatic flatfoot controls
Adults aged ≥18 years self-identifying as flatfoot but without symptoms were recruited through community outreach. Inclusion required no pain, no prior surgery, and confirmation of flatfoot by a foot and ankle surgeon through evaluation of arch height, gait collapse, and inability to insert tip of the doctor's index finger beneath the medial arch while standing.2,7,12,16 Bilateral WBCT scans of the feet/ankles were performed.
Symptomatic PCFD cohort
A retrospective cohort of prospectively collected symptomatic, flexible stage 1 PCFD patients ≥18 years of age was included. Diagnosis was performed by a senior fellowship-trained foot and ankle orthopaedic surgeon based on initial clinical evaluation noting foot pain attributed to PCFD. Surgery was not required for inclusion. Exclusion criteria included ankle valgus deformity (class E), prior surgery, systemic arthropathy, and severe neuropathy. Class E was excluded because even minimal talar tilt can mask peritalar subluxation. 8 Stage 2 (rigid deformity) cases were excluded as they may exhibit different biomechanical patterns, and therefore measurements, possibly confounding threshold values to define classes as intended.
Investigations and Measurements
Demographics included age, gender, BMI, and laterality. WBCT scans were acquired in natural bilateral stance using a dedicated cone-beam unit (PedCat/HiRise; CurveBeam AI) with the following standardized parameters: voxel size 0.37 mm; field of view diameter 350 mm; field of view height 200 mm; exposure time 9 seconds; total scan time 54 seconds. Semiautomated segmentation of foot and ankle bones was performed using specialized software (Bonelogic; Disior, Paragon28, Zimmer-Biomet) by blinded observers. Segmentation required 1 mouse click per bone for initial identification after Digital Imaging and Communication in Medicine (DICOM) data set upload. The software then automatically completed bone segmentation using deformable shape models, extracted anatomical landmarks and longitudinal axes, and generated triangular surface meshes representing cortical interfaces. All segmented bones were visually reviewed and manually corrected using density thresholding when necessary, before measurement extraction to ensure accuracy, particularly in cases of severe deformity where automated segmentation may be suboptimal.
3D measurements included:
Class A (hindfoot valgus): HMA. 13
Class B (midfoot/forefoot abduction): talonavicular coverage angle (TNCA), talus–first metatarsal angle–axial (TFMA-A).9,32
Class C (arch collapse): talus–first metatarsal angle–sagittal (TFMA-S), forefoot arch angle (FAA).9,14
Class D (peritalar subluxation): middle facet coverage, posterior facet coverage (PFC), and sinus tarsi coverage.6,11
Class D analysis used validated 3D distance mapping (DM) and coverage mapping (CM) of the subtalar facets and sinus tarsi. 11 These assessments were carried out using a previously developed MATLAB (MathWorks, Inc) protocol. 16 Regions with distances exceeding 4 mm were marked gray, indicating potential shadowing from distant proximal bone structures. Blue coloring represented areas where distances ranged from 1 to 4 mm, suggesting typical joint interaction or bone proximity in the sinus tarsi. Distances less than 1 mm were visualized in a gradient from yellow to red, highlighting close bone juxtaposition indicative of joint space narrowing or potential extra-articular impingement. Pink was used to denote joint subluxation, characterized by articular areas lacking opposing subchondral bone or where the distances exceeded 4 mm (Figure 1). 16
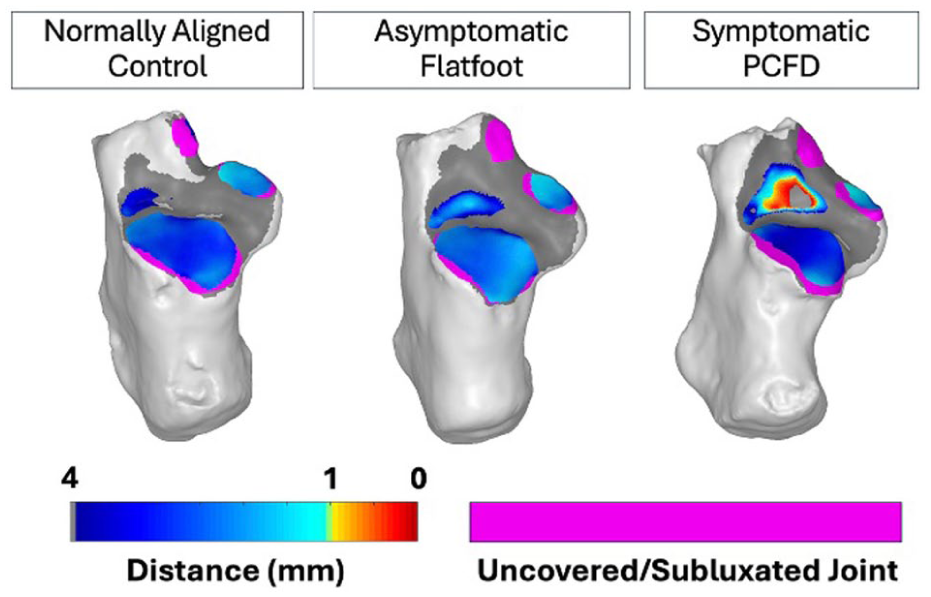
Distance and coverage maps in representative cases. Representative subtalar joint distance and coverage maps in 3 individual subjects. Distance maps: blue (1-4 mm, normal spacing), yellow-to-red (<1 mm, impingement), gray (>4 mm, shadowing). Pink indicates subluxation (uncovered articular surfaces). Controls show predominantly normal coverage (blue), whereas PCFD demonstrates sinus tarsi impingement (yellow-red) and increased subluxation (pink).
Statistical Analysis
Normality was evaluated using the Shapiro-Wilk test. Depending on whether the data followed a normal distribution, comparisons among groups were conducted using either 1-way analysis of variance or the Kruskal-Wallis H test. Paired comparisons were performed using paired Tukey honestly significant difference test or Dunn test. Receiver operating characteristic curves determined optimal diagnostic cut-off thresholds for each measurement in order to distinguish between symptomatic PCFD patients and controls. Youden index was employed to select threshold values for the various measurements examined. The area under the curve (AUC), sensitivity, and specificity were reported for each measurement, as well as 95% CIs. AUC values were used as a measure of effect size. AUC values of 50% were considered nondiscriminants; 50% to 60%, poor discrimination; 60% to 70%, fair discrimination; 70% to 80%, acceptable discrimination; 80% to 90%, excellent discrimination; values >90% were considered outstanding discrimination. 33 For diagnostic purposes, when assessing measurements for classes A-D, subjects were coded using binary classification: All symptomatic PCFD patients were coded as positive cases (1), whereas all controls comprising both neutrally aligned and asymptomatic flatfoot volunteers were combined and coded as negative cases (0).
Multivariate regression analysis was performed to identify independent predictors of symptomatic PCFD. For nominal logistic regression, model fit was assessed using McFadden pseudo-R2 values, where values of 0.2 to 0.4 were considered excellent fit, and values above 0.4 were considered outstanding fit. 27 Also, a partition prediction model was performed using recursive partitioning analysis to identify combinations of measurements most predictive of symptomatic PCFD. 18 Significance was set at P <.05 with Bonferroni correction.
Results
Figure 2 depicts the recruitment, enrollment, and inclusion process for the control patient cohorts. For the final analysis, the study included 475 subjects, representing 561 feet. Specifically, the cohorts consisted of a total of 154 control patients (230 feet) and 321 PCFD patients (331 feet). For the controls, 88 subjects (98 feet) had neutral alignment, and 66 subjects had asymptomatic flatfoot alignment (132 feet).
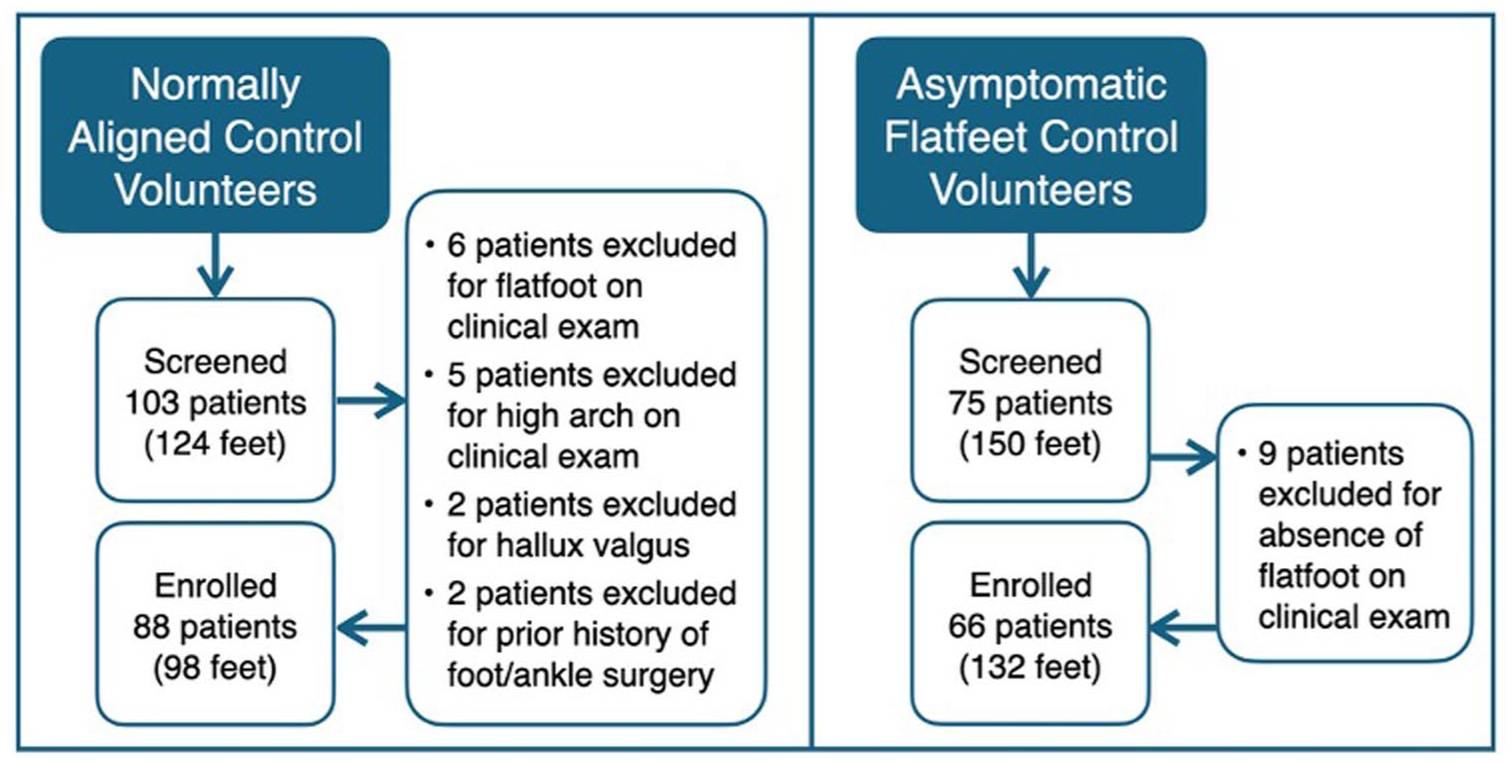
Flowchart illustrating the enrollment of neutrally aligned and asymptomatic flatfeet in the prospective cohort.
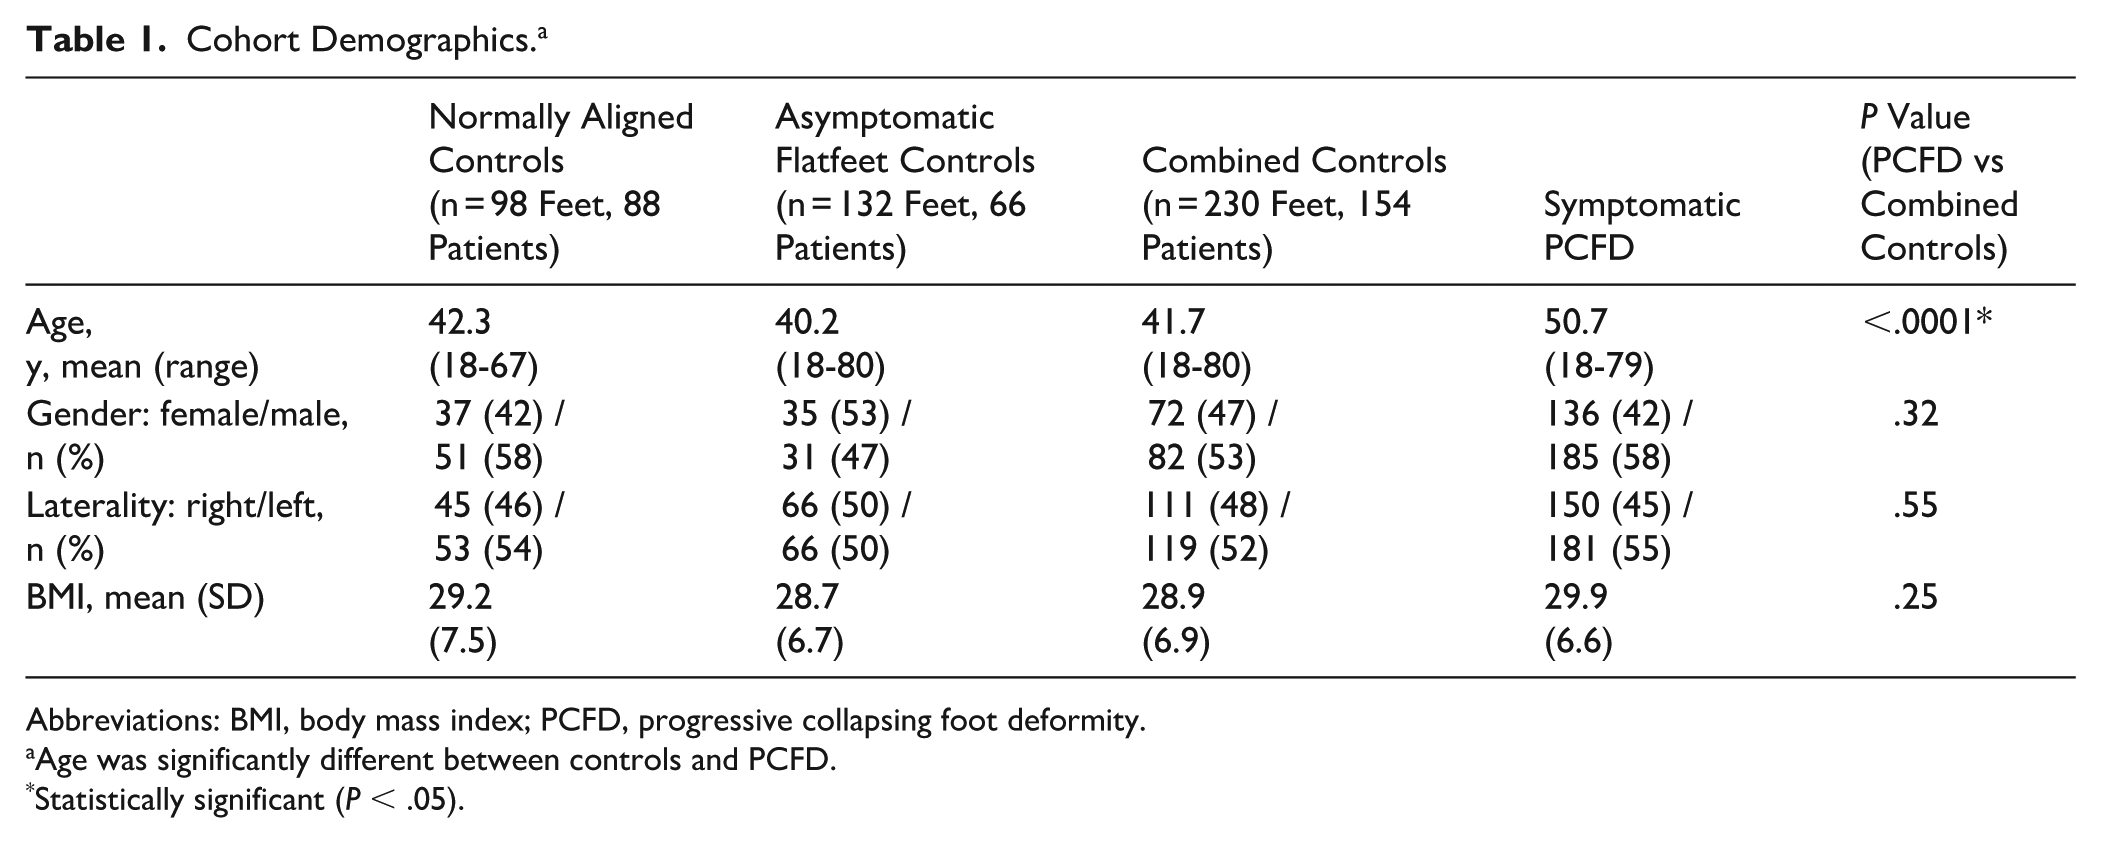
Demographics (Table 1) demonstrated similar gender, age, BMI, and laterality across cohorts. However, patients in the symptomatic PCFD cohort were on average 9 years older than the combined asymptomatic controls (P < .0001).
Cohort Demographics. a
Abbreviations: BMI, body mass index; PCFD, progressive collapsing foot deformity.
Age was significantly different between controls and PCFD.
Statistically significant (P < .05).
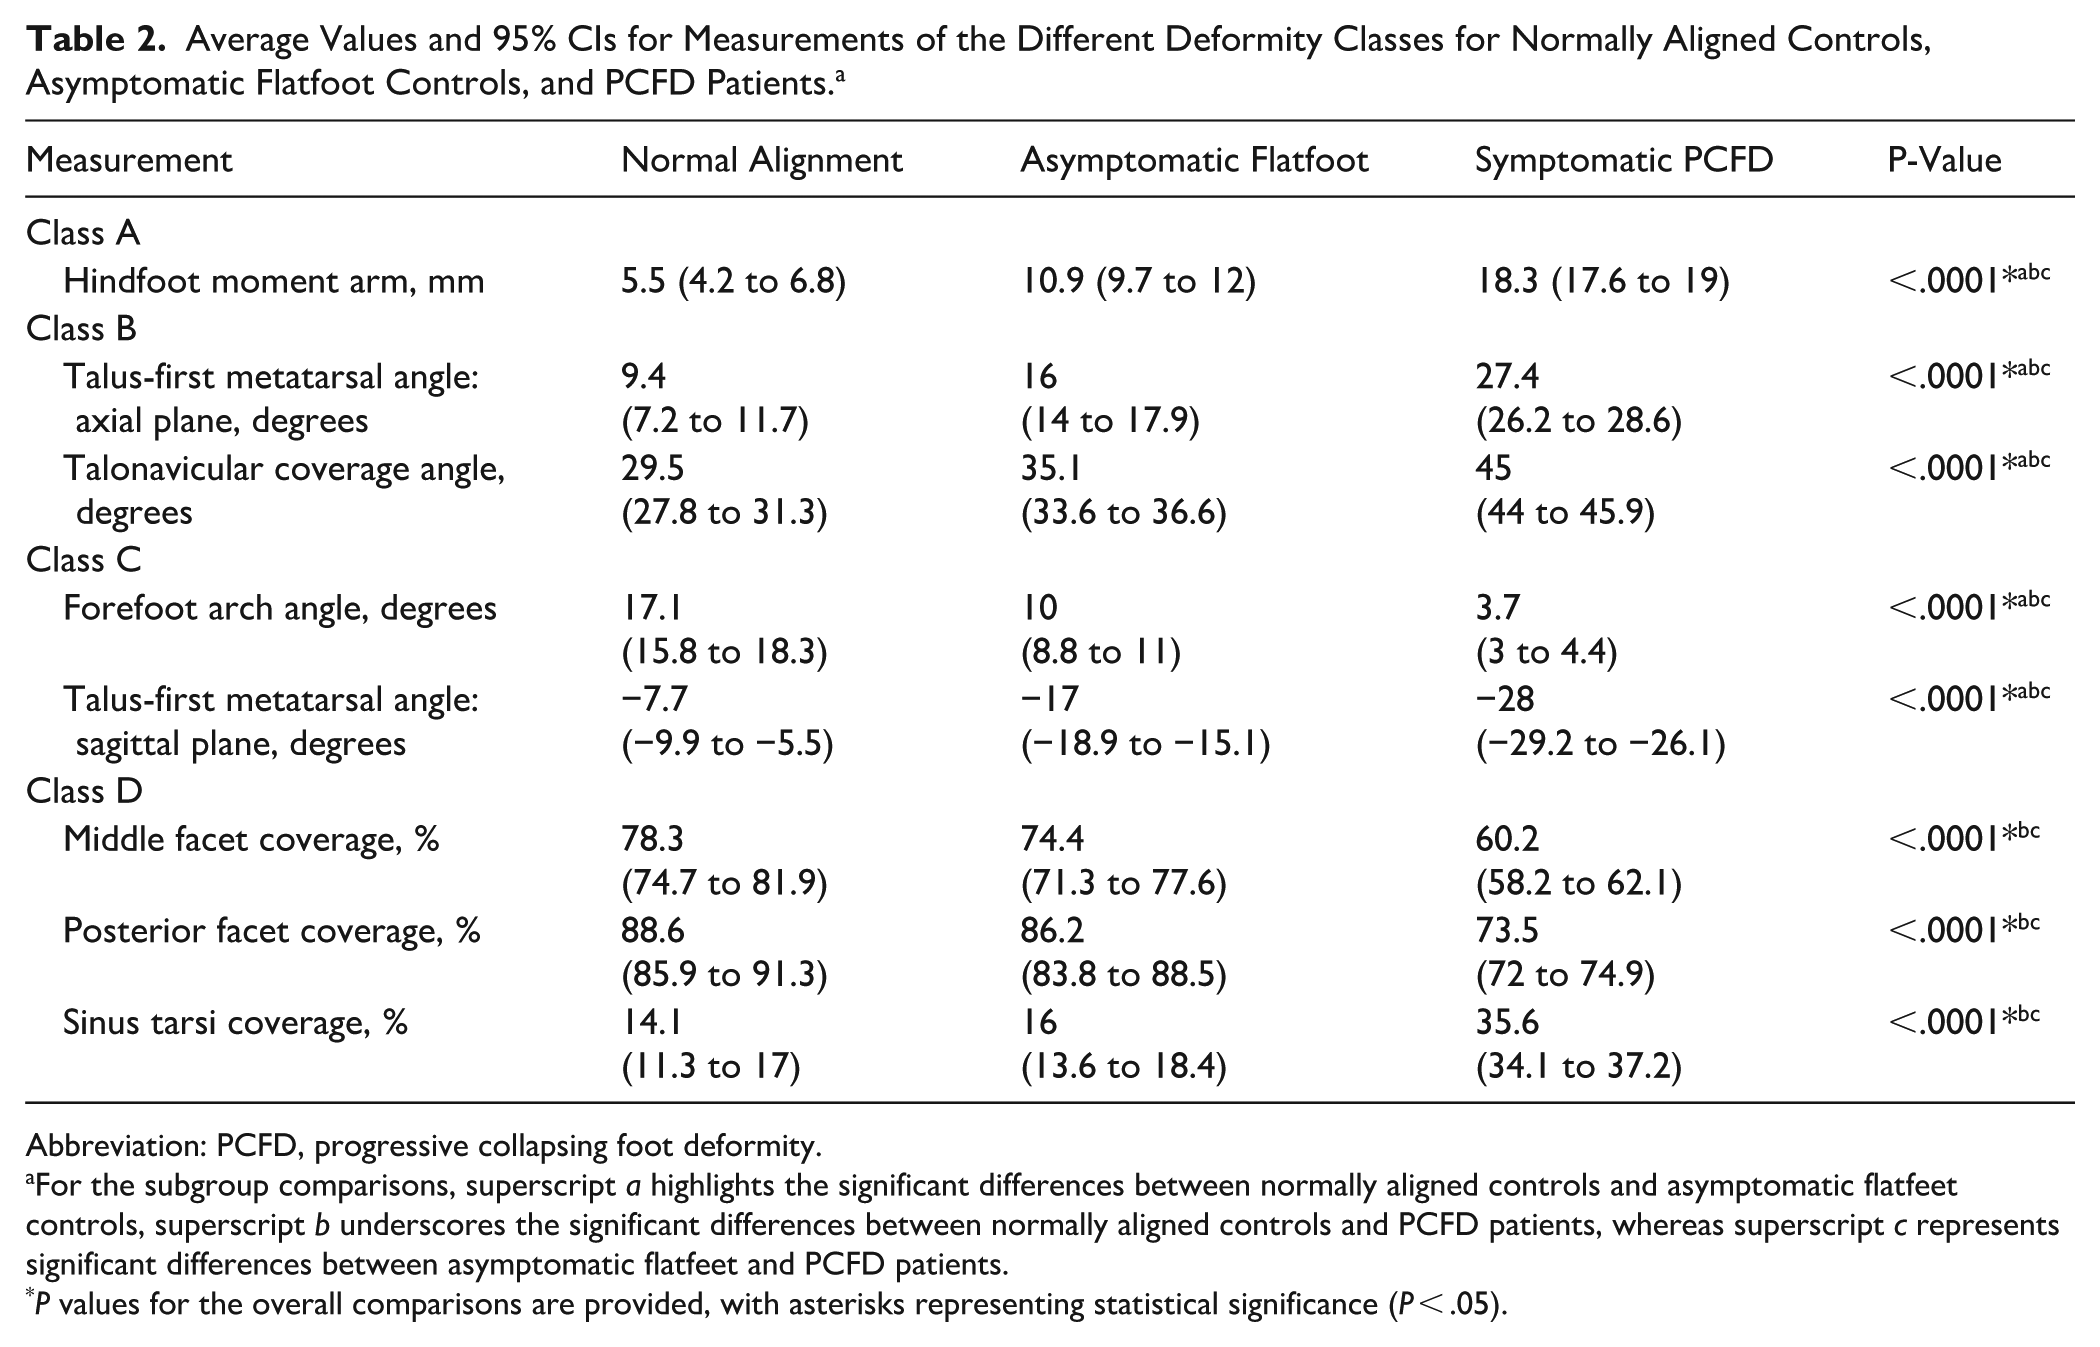
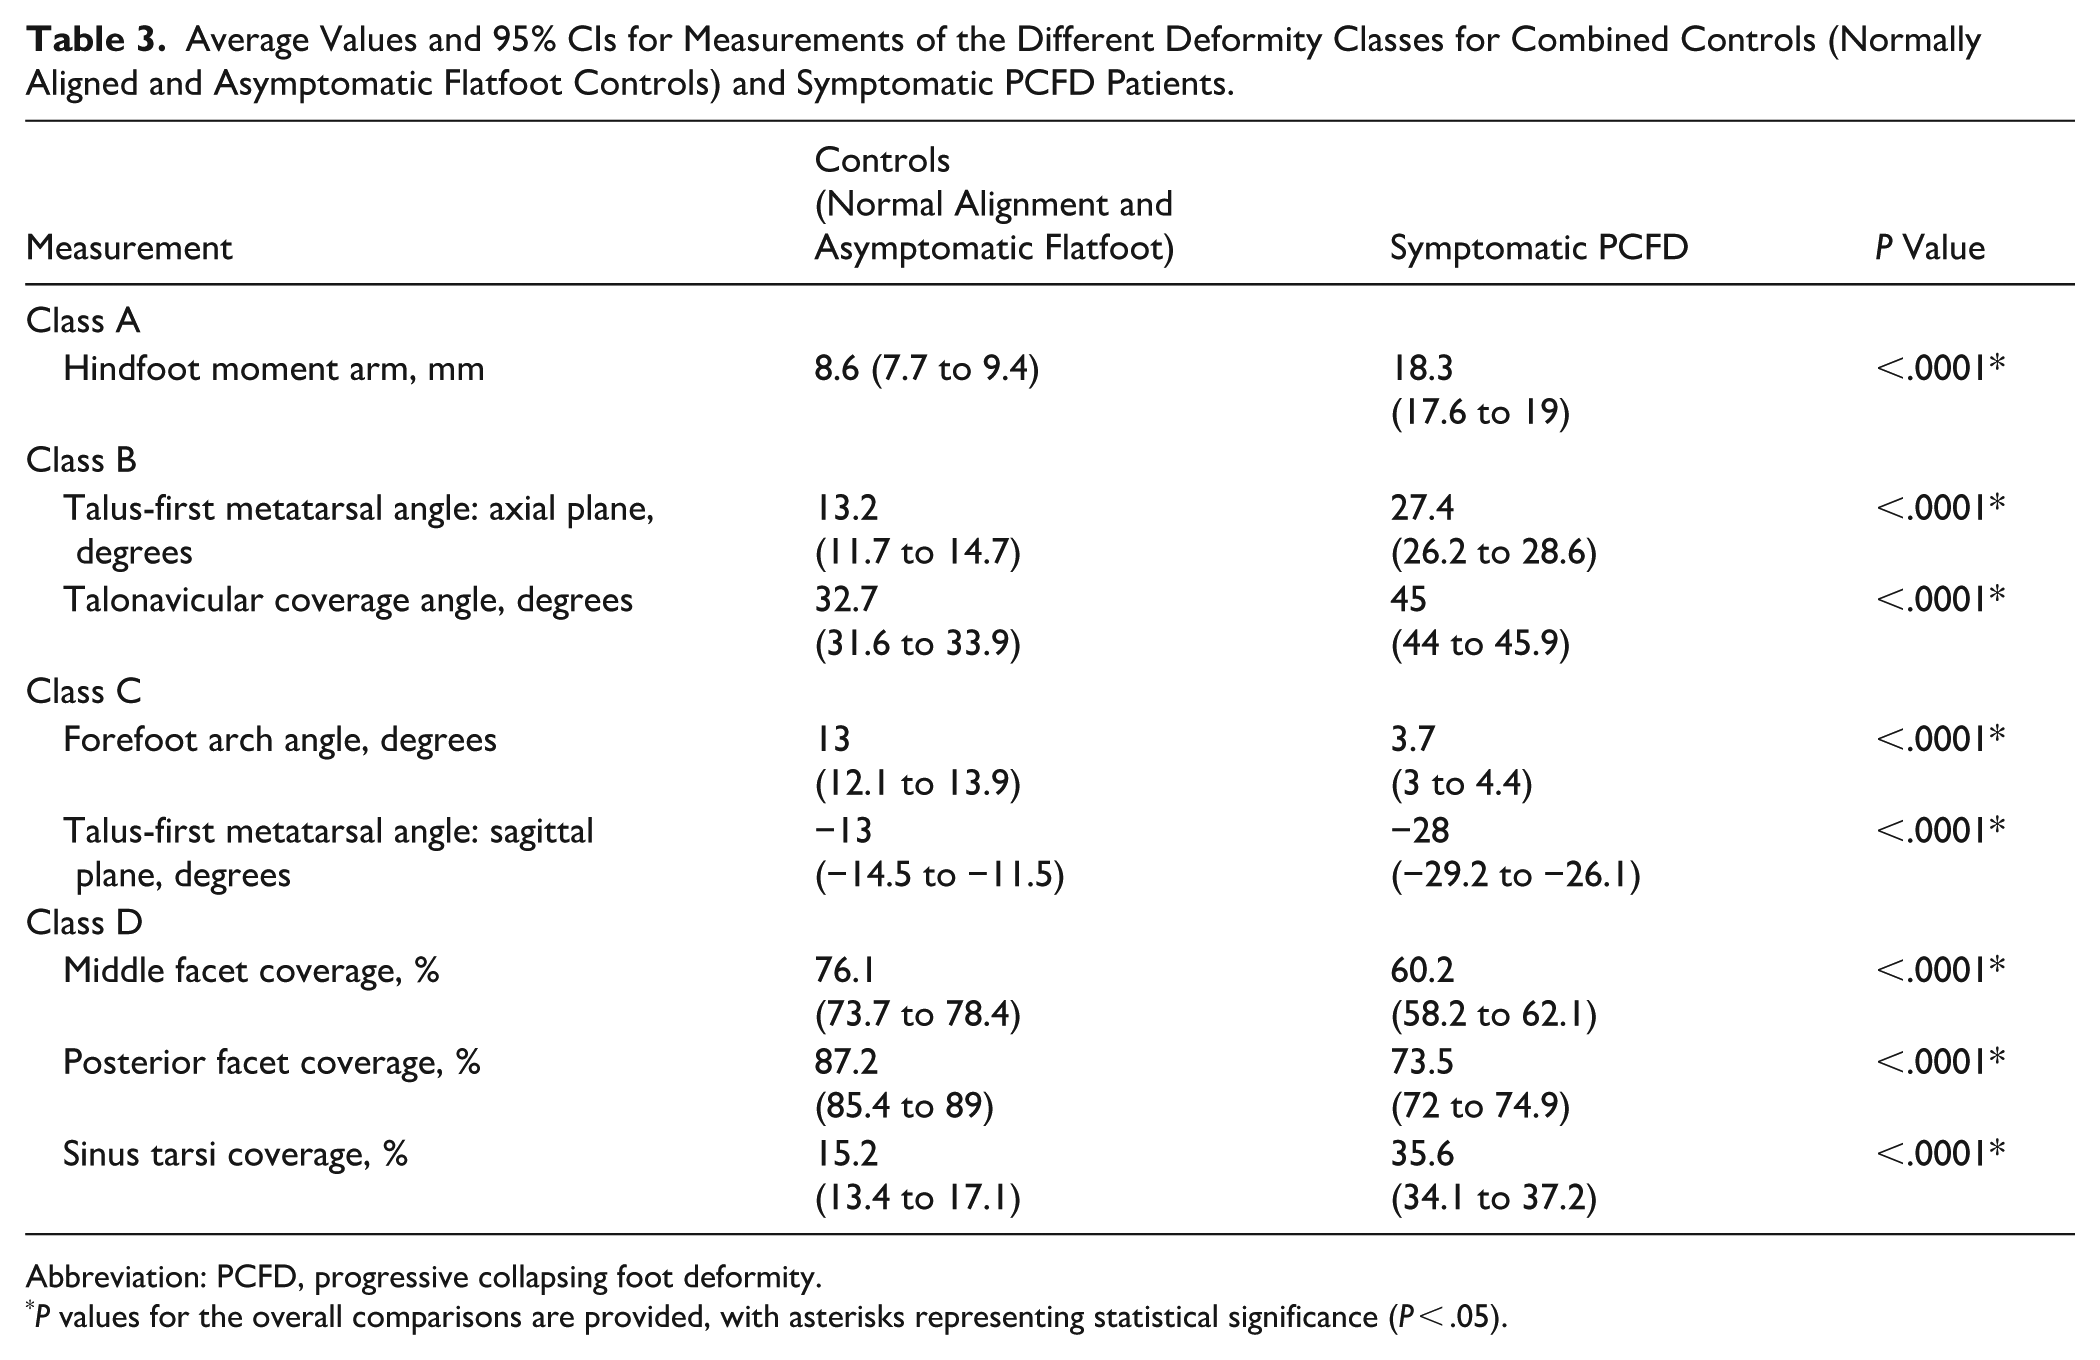
All measurements were significantly increased in PCFD patients when compared to controls (all P values < .0001). A summary of all values and comparisons between PCFD patients and controls is presented in Tables 2 and 3. Table 4 presents the diagnostic performance of each measurement assessed for identifying the different PCFD classes (A to D). All parameters demonstrated statistically significant diagnostic capability (all P values < .0001).
Average Values and 95% CIs for Measurements of the Different Deformity Classes for Normally Aligned Controls, Asymptomatic Flatfoot Controls, and PCFD Patients. a
Abbreviation: PCFD, progressive collapsing foot deformity.
For the subgroup comparisons, superscript a highlights the significant differences between normally aligned controls and asymptomatic flatfeet controls, superscript b underscores the significant differences between normally aligned controls and PCFD patients, whereas superscript c represents significant differences between asymptomatic flatfeet and PCFD patients.
P values for the overall comparisons are provided, with asterisks representing statistical significance (P < .05).
Average Values and 95% CIs for Measurements of the Different Deformity Classes for Combined Controls (Normally Aligned and Asymptomatic Flatfoot Controls) and Symptomatic PCFD Patients.
Abbreviation: PCFD, progressive collapsing foot deformity.
P values for the overall comparisons are provided, with asterisks representing statistical significance (P < .05).
Diagnostic Performance of Class-Specific Measurements Including AUC, 95% CIs, Sensitivity and Specificity, Unit Odds Ratio, and 95% CI. a
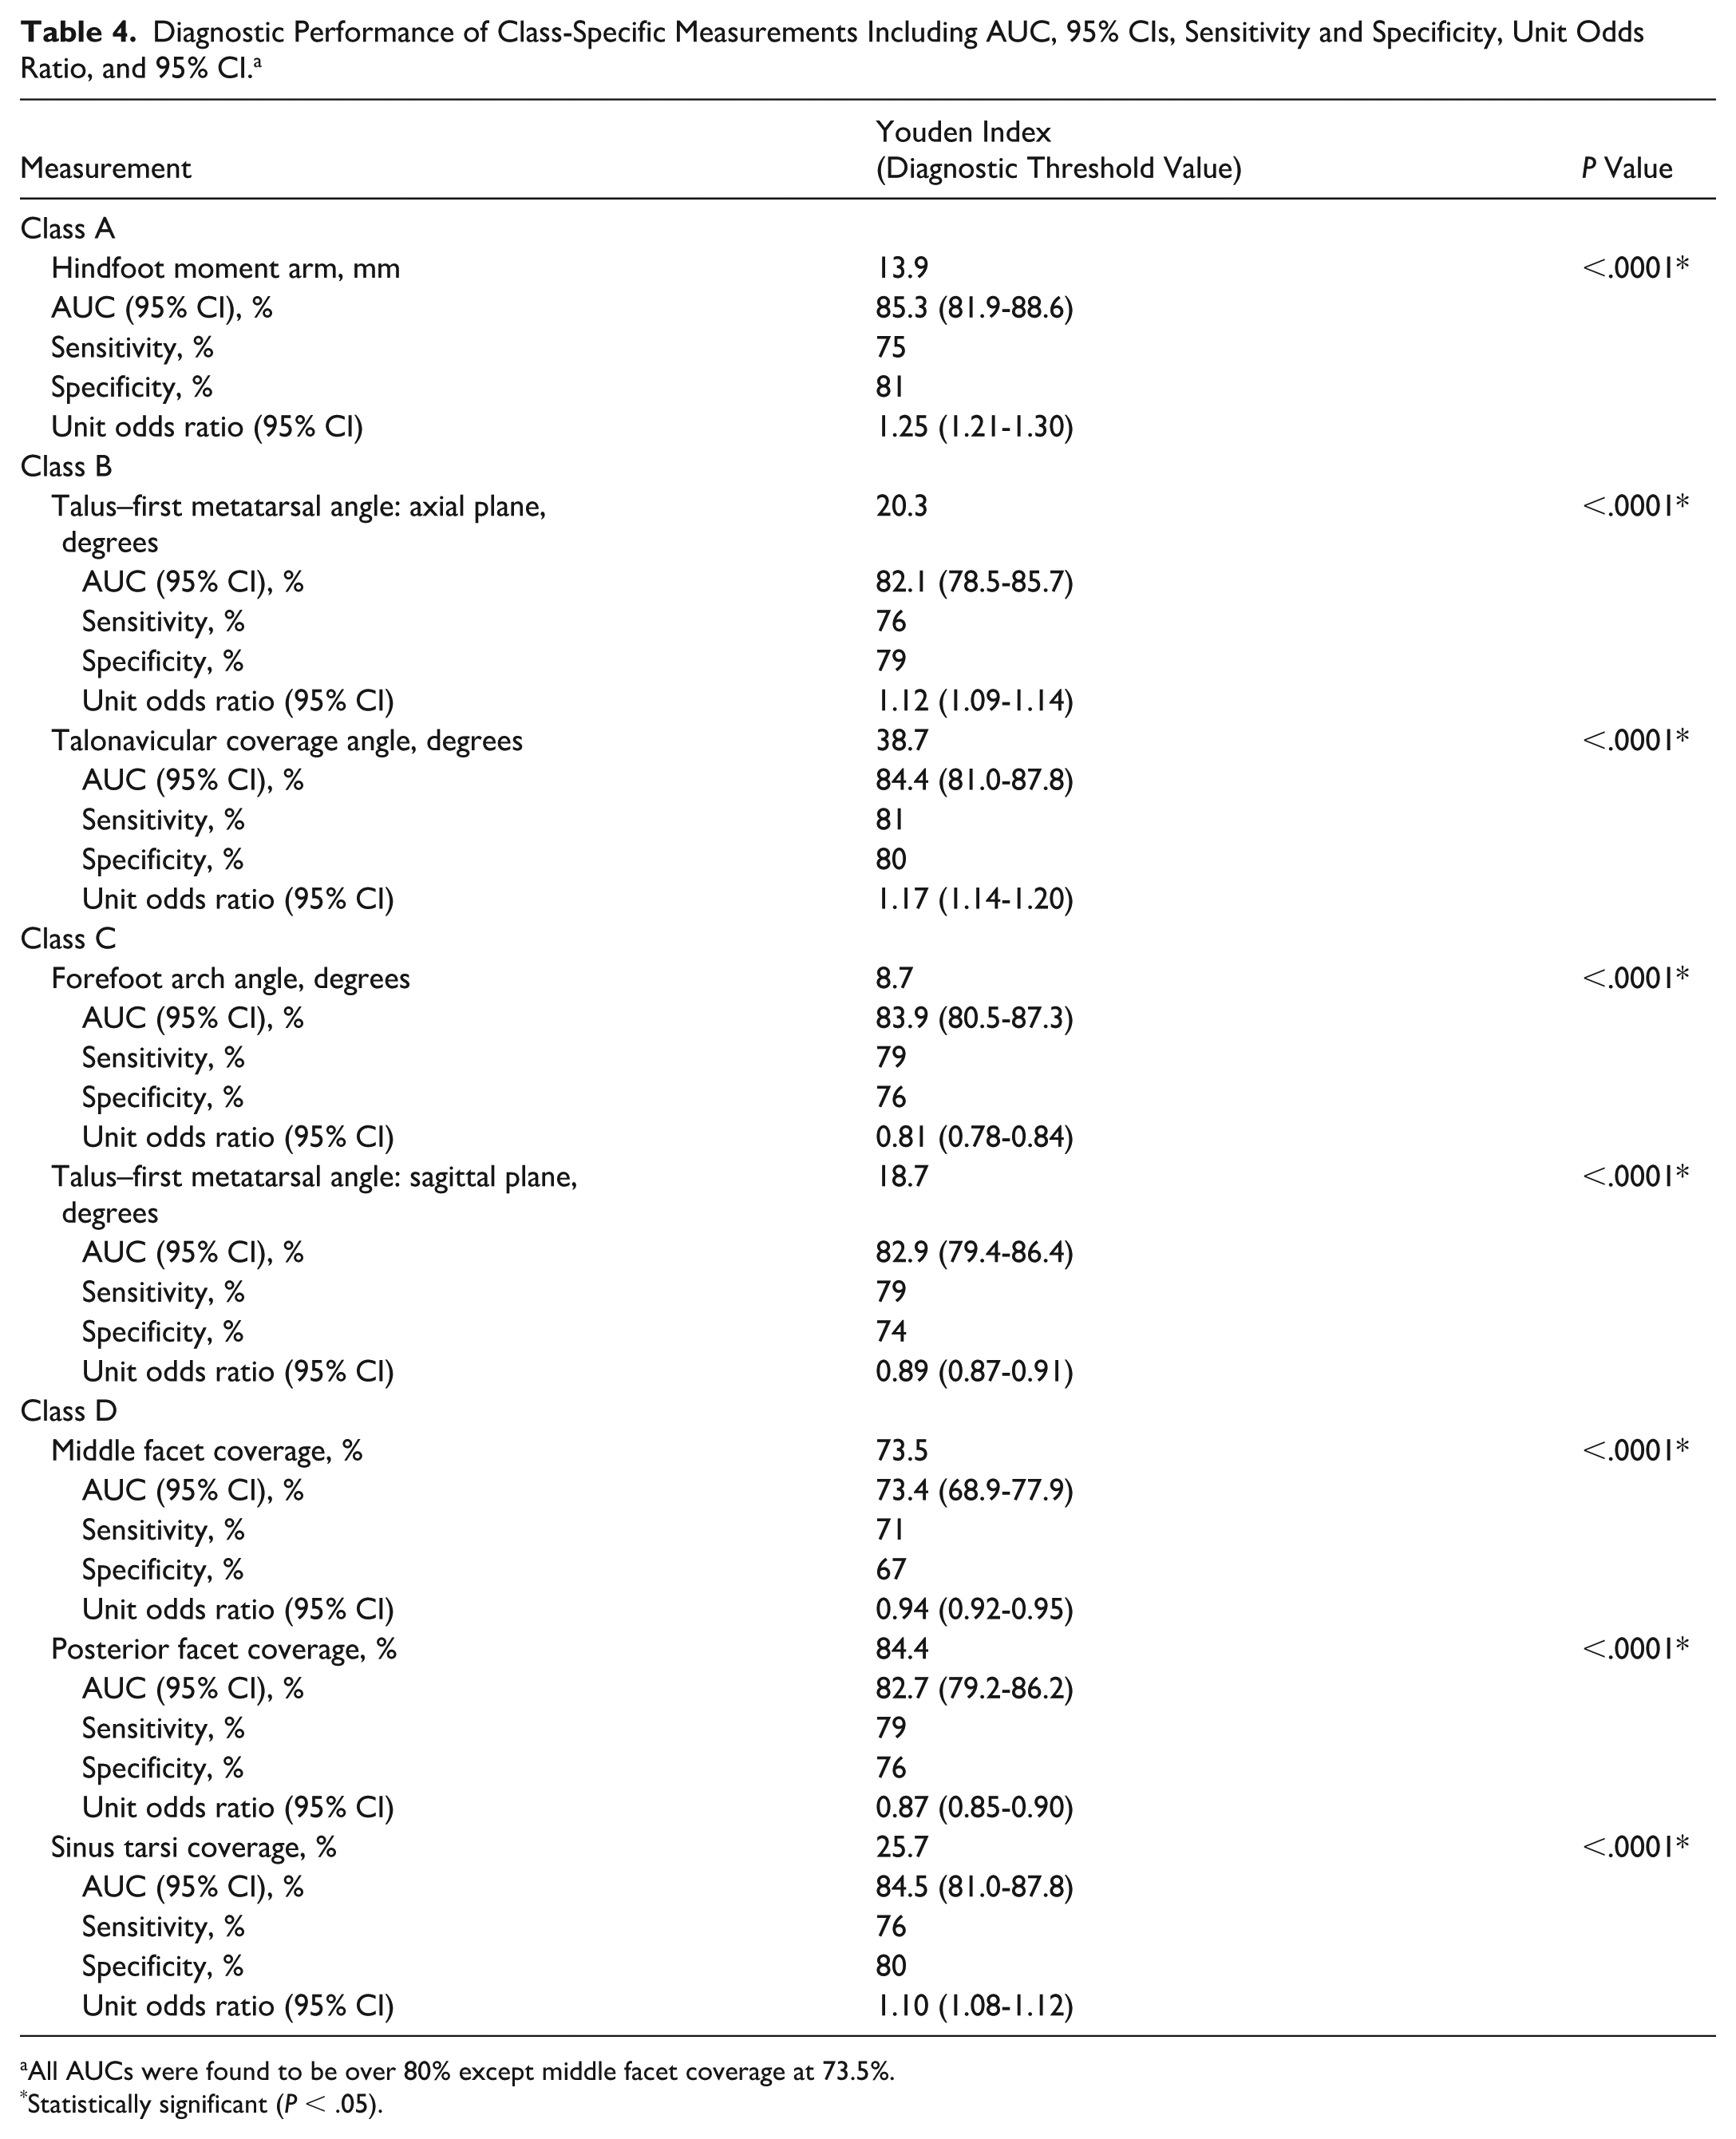
All AUCs were found to be over 80% except middle facet coverage at 73.5%.
Statistically significant (P < .05).
For class A PCFD (hindfoot valgus), the optimal cut-off for HMA was ≥13.9 mm (AUC: 85.3%, 95% CI: 81.9%-88.6%) (Figure 3).
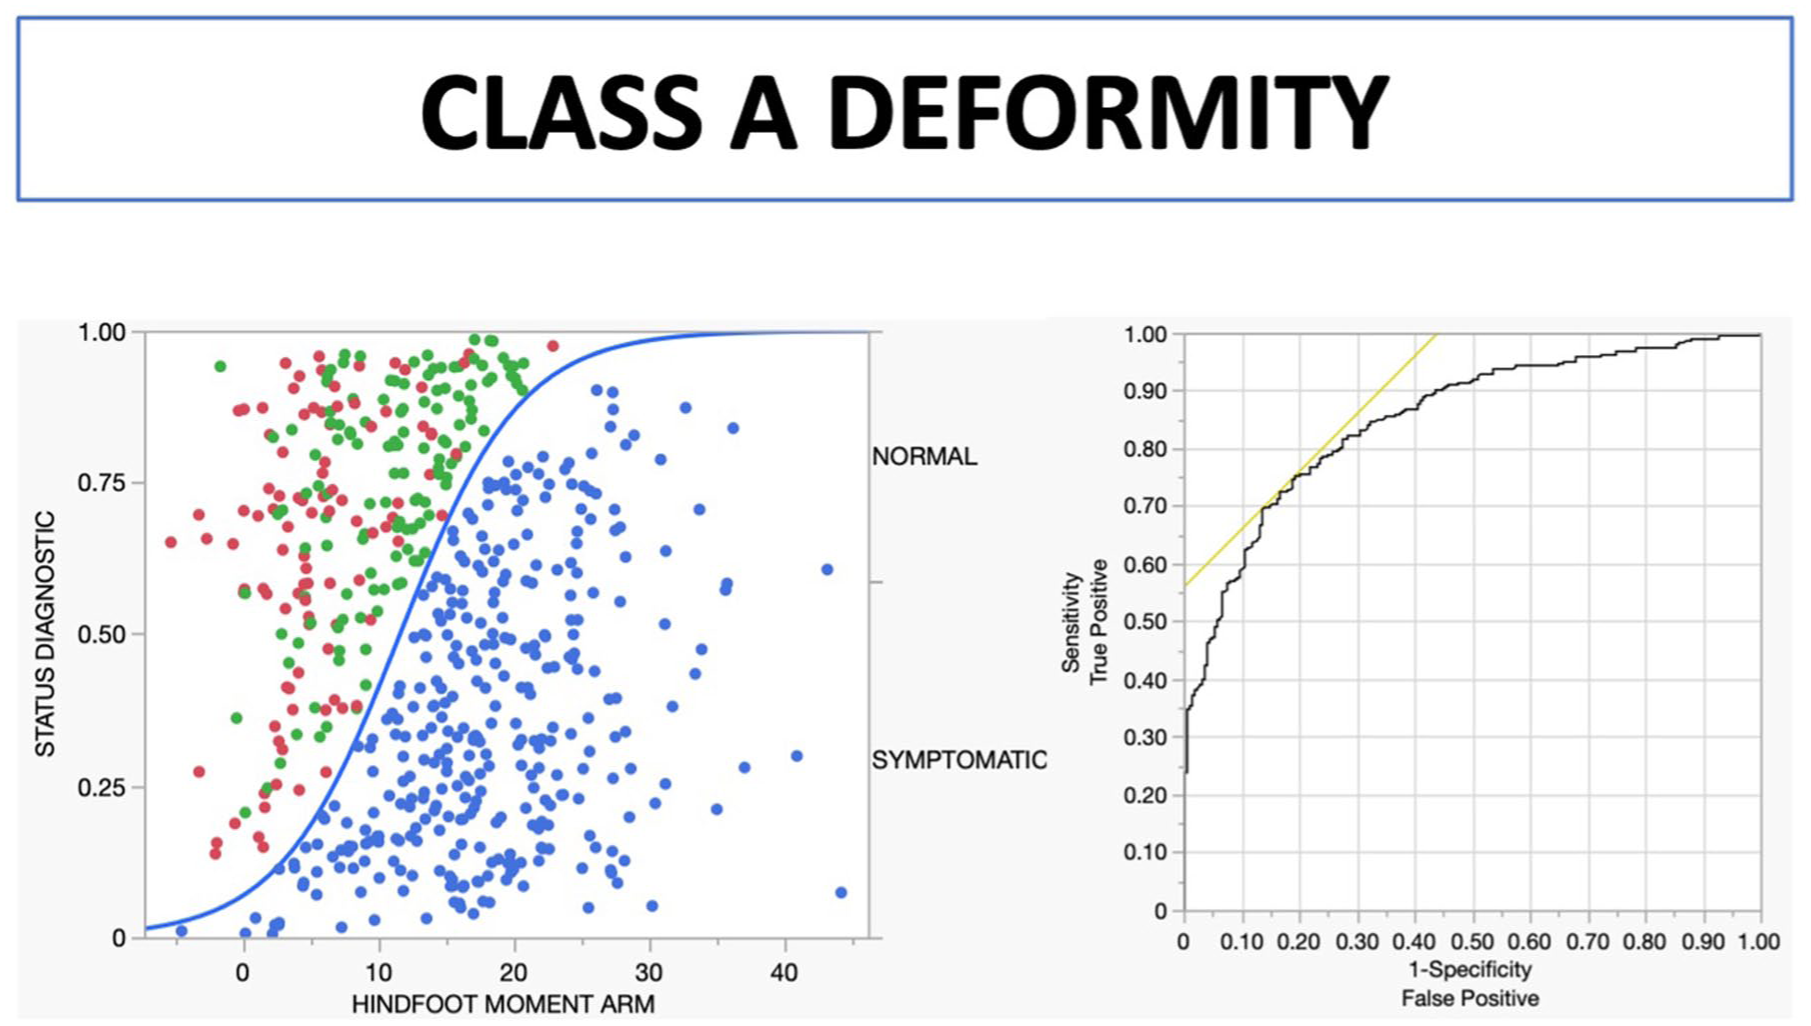
Scatter plot distribution of HMA per diagnostic status and receiver operating characteristic curve for class A deformity. Green: neutrally aligned controls (n = 98), red: asymptomatic flatfoot (n = 132), blue: symptomatic PCFD (n = 331). HMA, hindfoot moment arm; PCFD, progressive collapsing foot deformity.
For class B PCFD (midfoot/forefoot abduction), optimal thresholds were ≥38.7° for TNCA (AUC: 84.4%, 95% CI: 81.0%-87.8%) and ≥20.3° for talus–first metatarsal angle–axial (AUC: 82.1%, 95% CI: 78.5%-85.7%) (Figure 4).
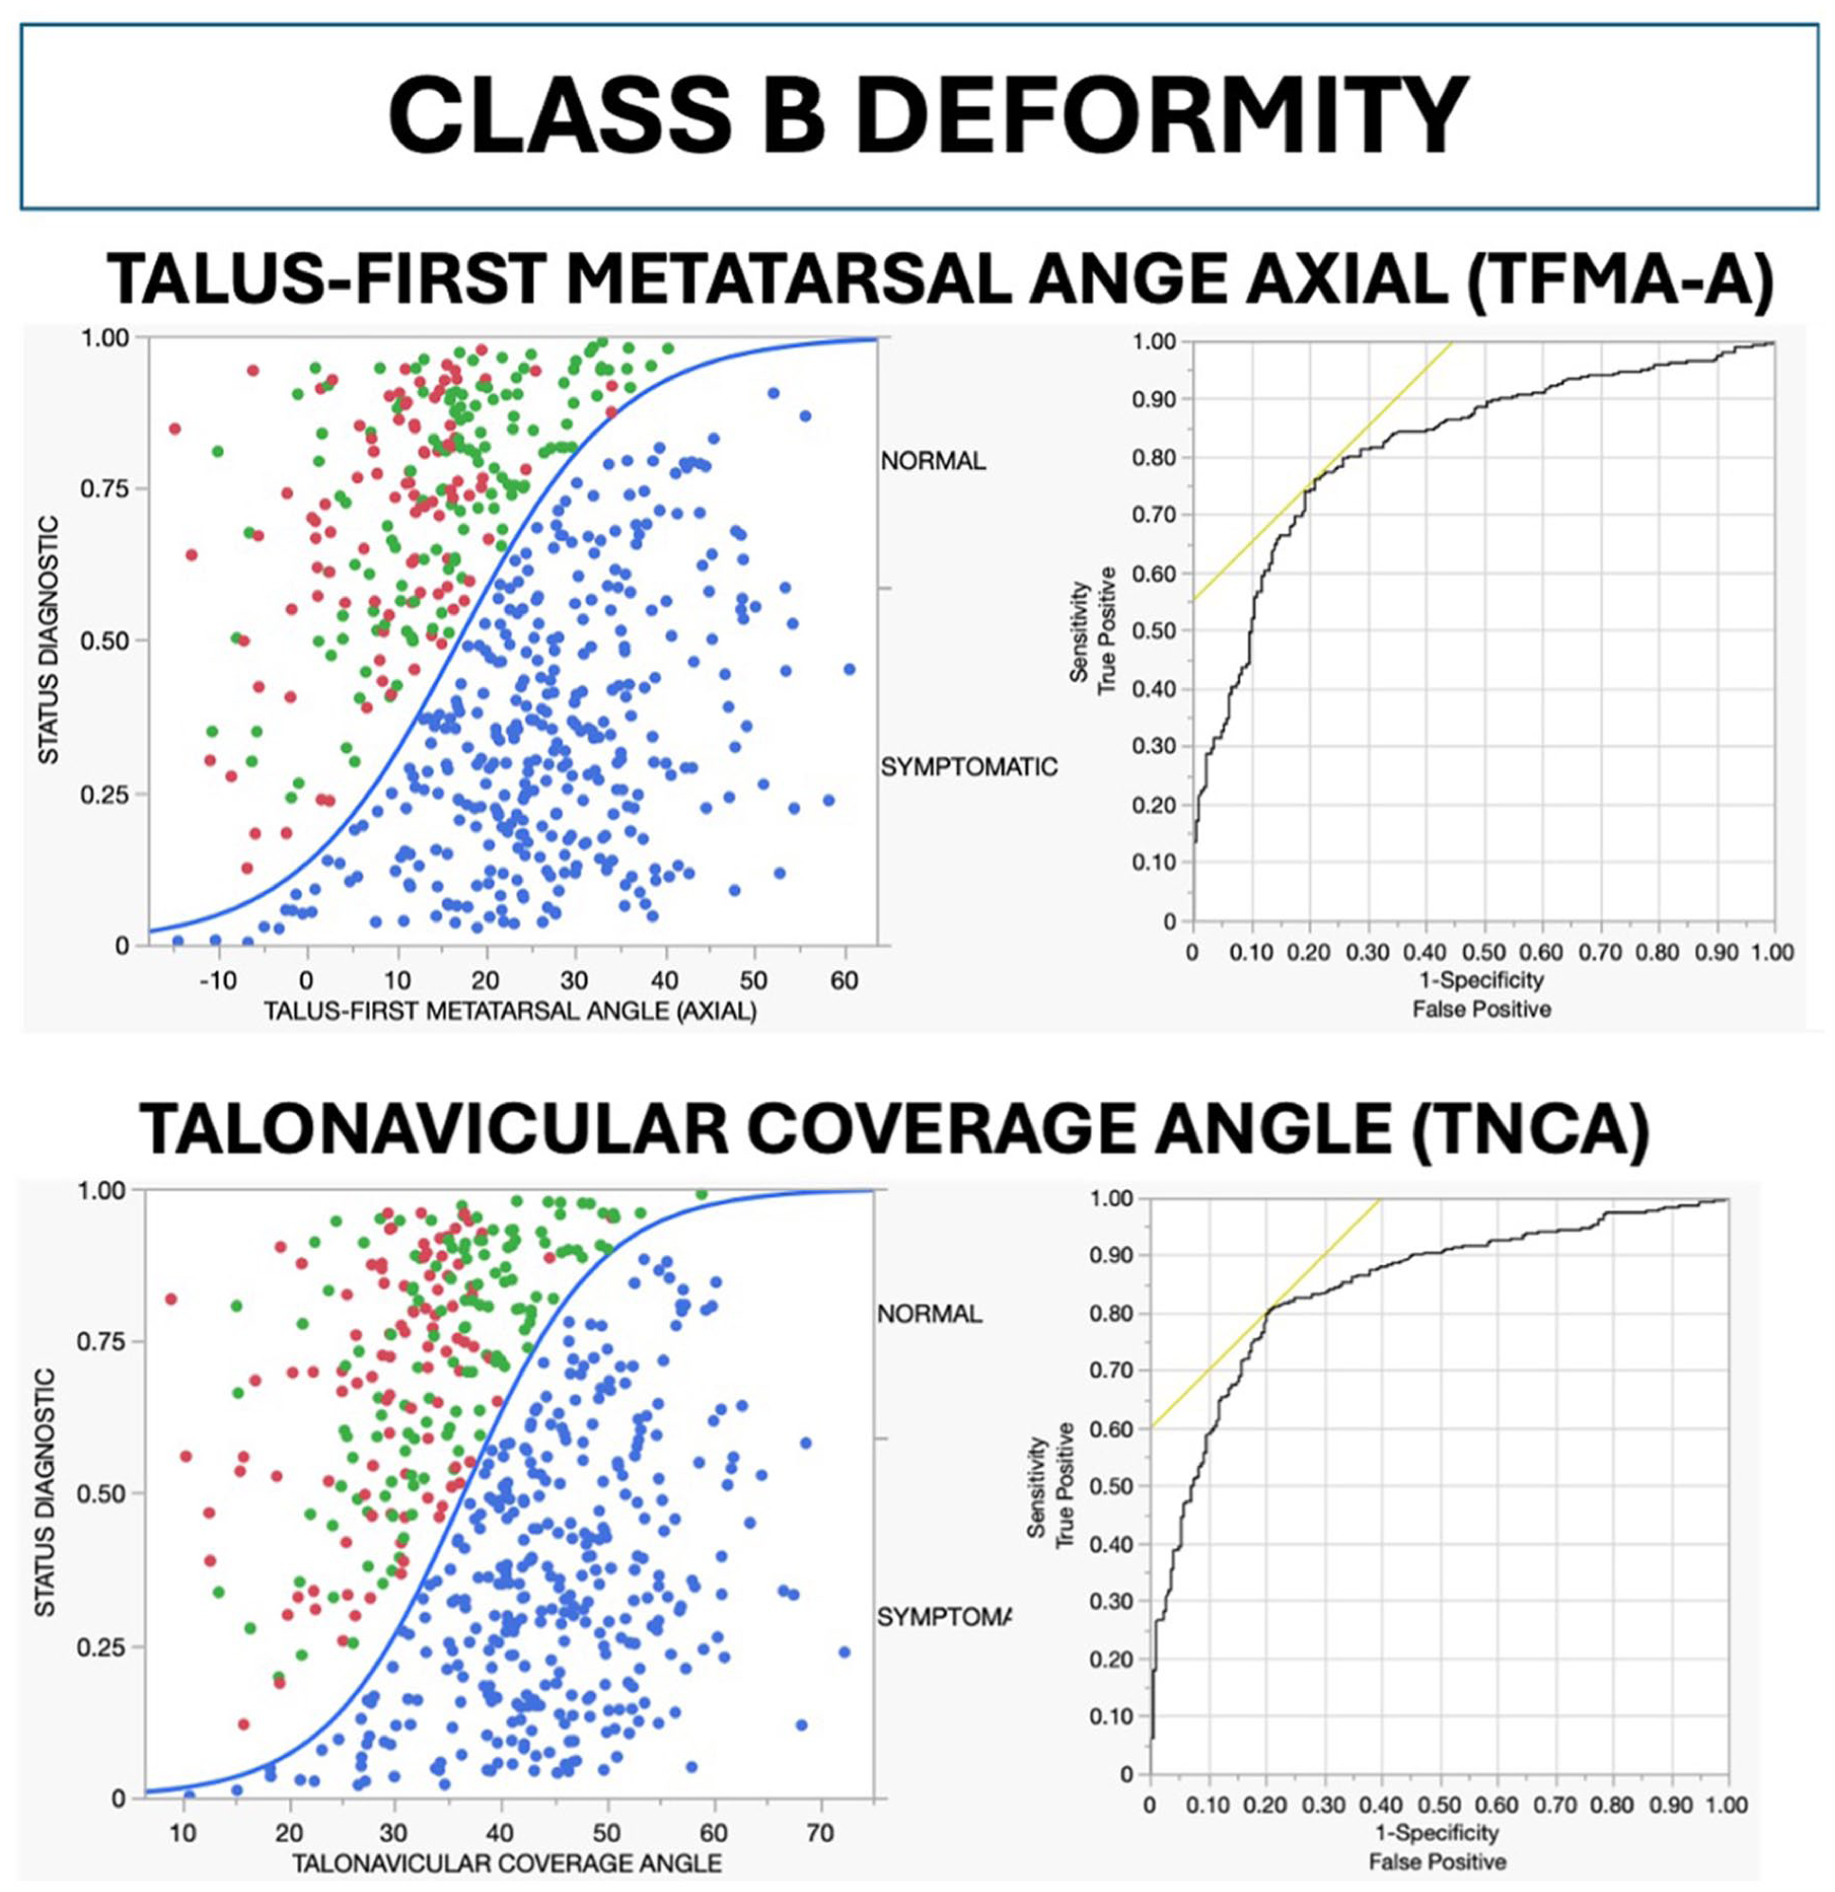
Scatter plot distribution of TFMA-A and TNCA per diagnostic status and receiver operating characteristic curve for class B deformity. Green: neutrally aligned controls (n = 98), red: asymptomatic flatfoot (n = 132), blue: symptomatic PCFD (n = 331). PCFD, progressive collapsing foot deformity; TMFA-A, talus–first metatarsal angle–axial; TNCA, talonavicular coverage angle.
For class C PCFD (arch collapse), thresholds were identified as ≤8.7° for forefoot arch angle (AUC: 83.9%, 95% CI: 80.5%-87.3%) and ≥18.7° for talus–first metatarsal angle–sagittal (AUC: 82.9%, 95% CI: 79.4%-86.4%) (Figure 5).
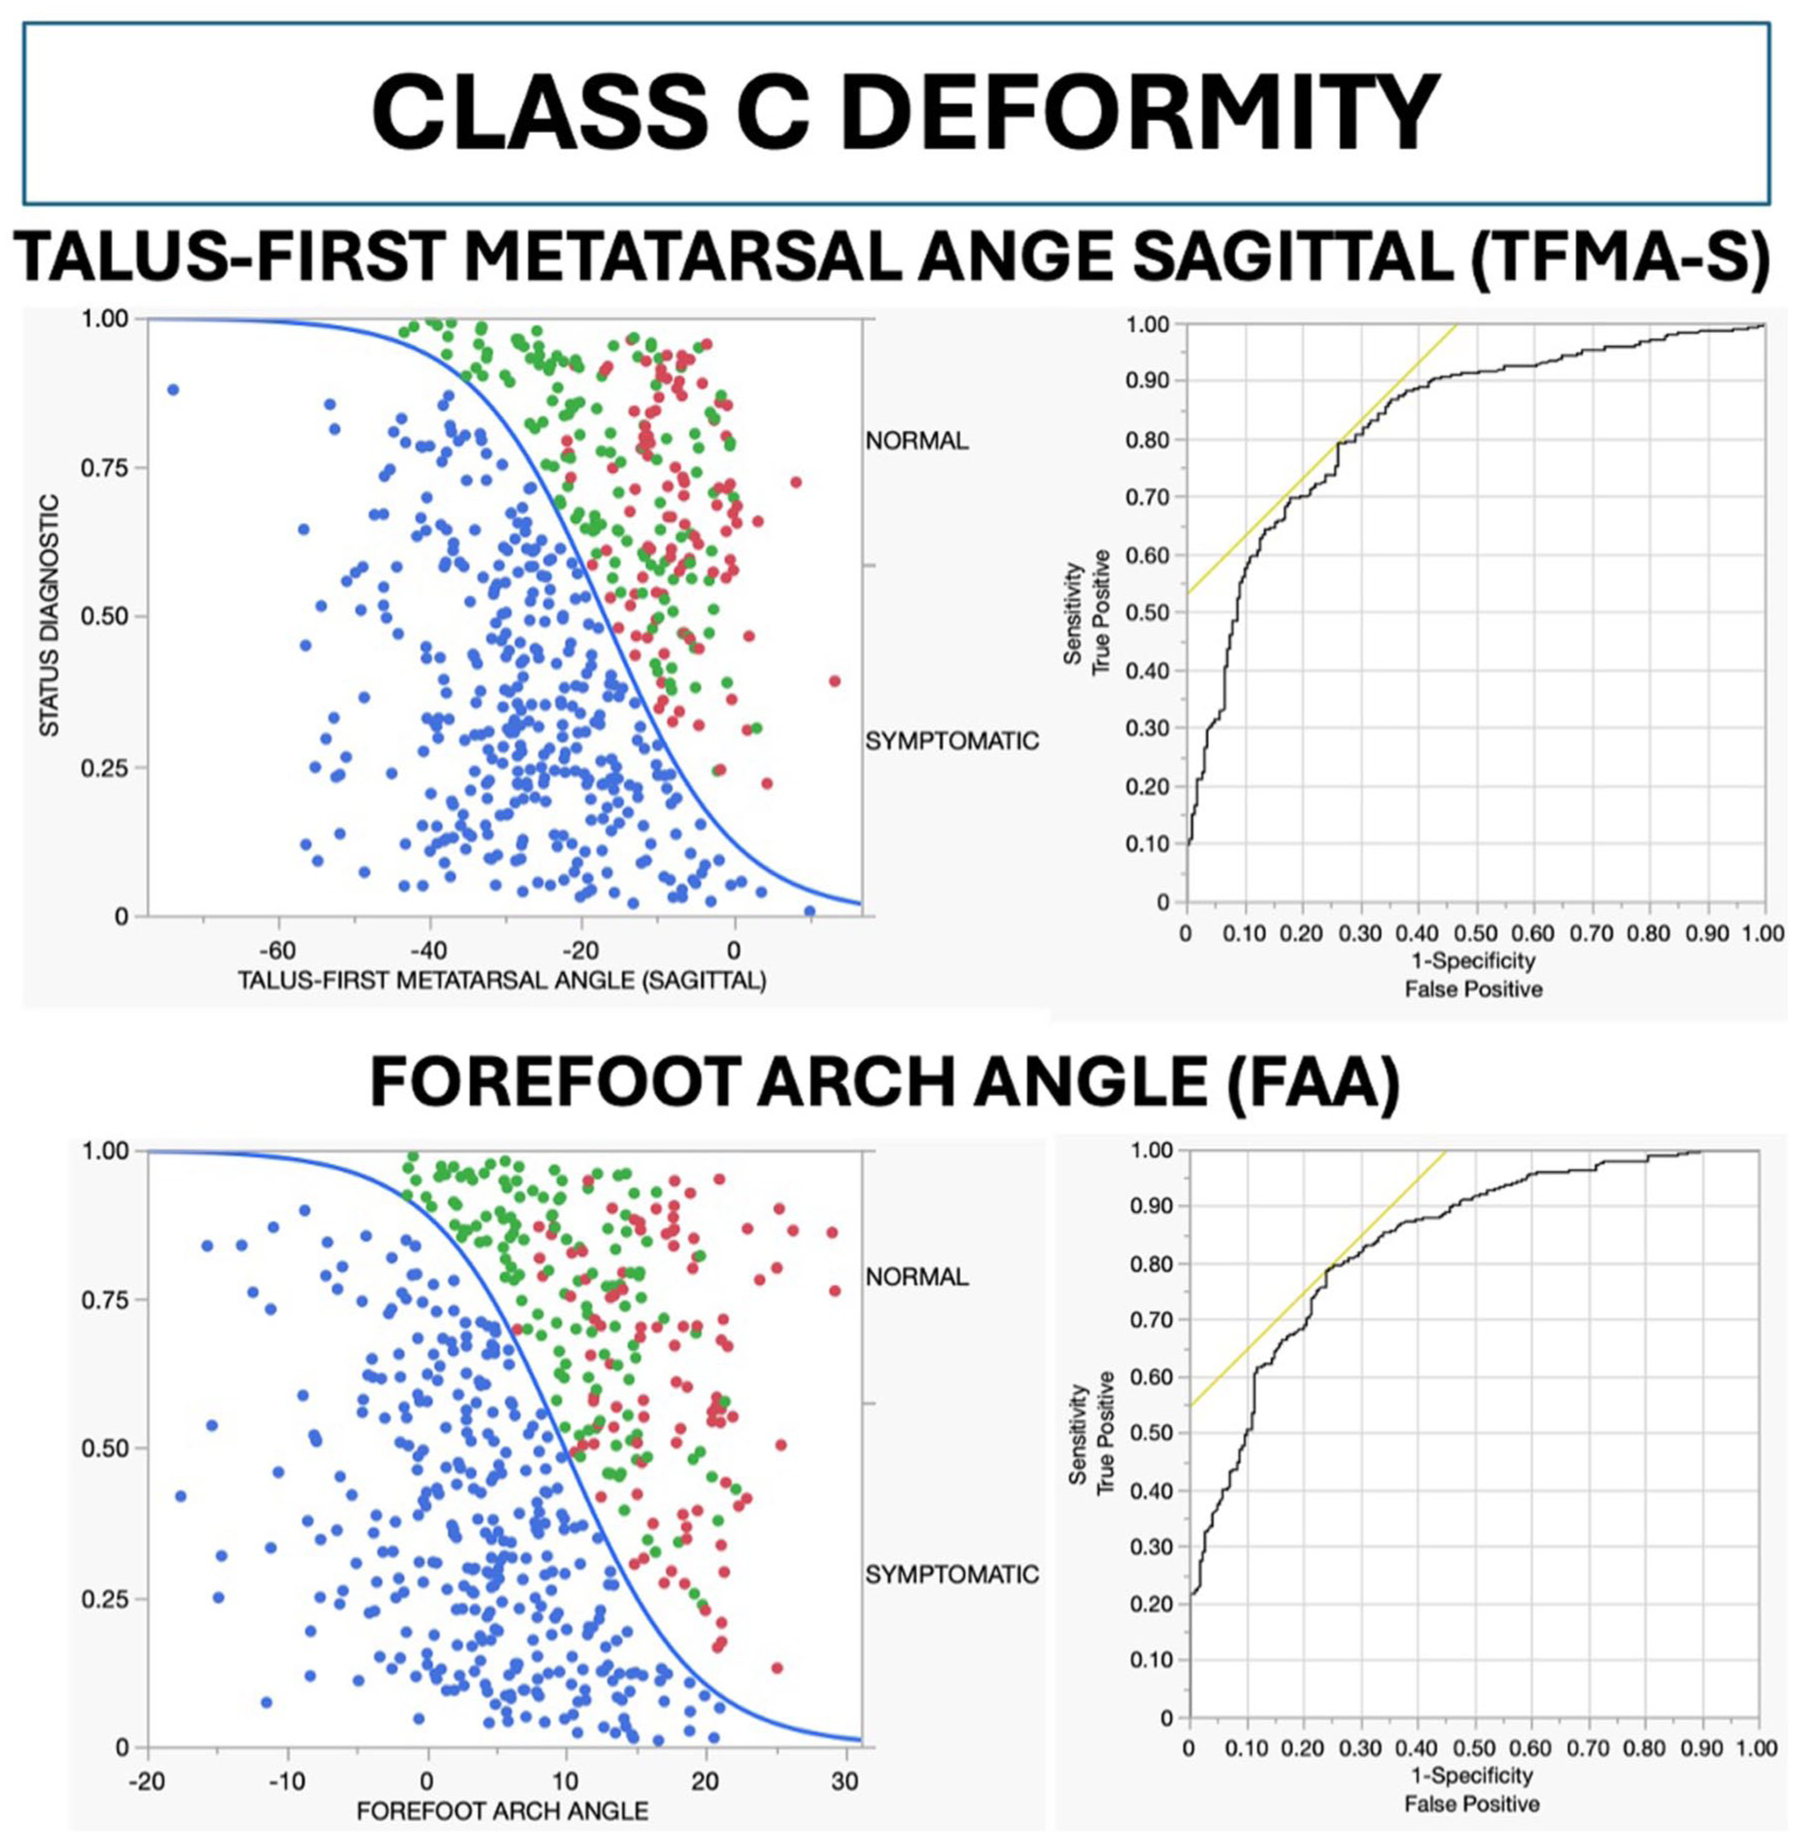
Scatter plot distribution of TFMA-S and FAA per diagnostic status and receiver operating characteristic curve for class C deformity. Green: neutrally aligned controls (n = 98), red: asymptomatic flatfoot (n = 132), blue: symptomatic PCFD (n = 331). FAA, forefoot arch angle; PCFD, progressive collapsing foot deformity; TFMA-S, talus–first metatarsal angle–sagittal.
For class D PCFD (peritalar subluxation), optimal diagnostic thresholds were ≤73.5% for middle facet coverage (AUC: 73.4%, 95% CI: 68.9%-77.9%), ≤84.4% for posterior facet coverage (AUC: 82.7%, 95% CI: 79.2%-86.2%), and ≥25.7% for sinus tarsi coverage (AUC: 84.5%, 95% CI: 81.0%-87.8%) (Figure 6).
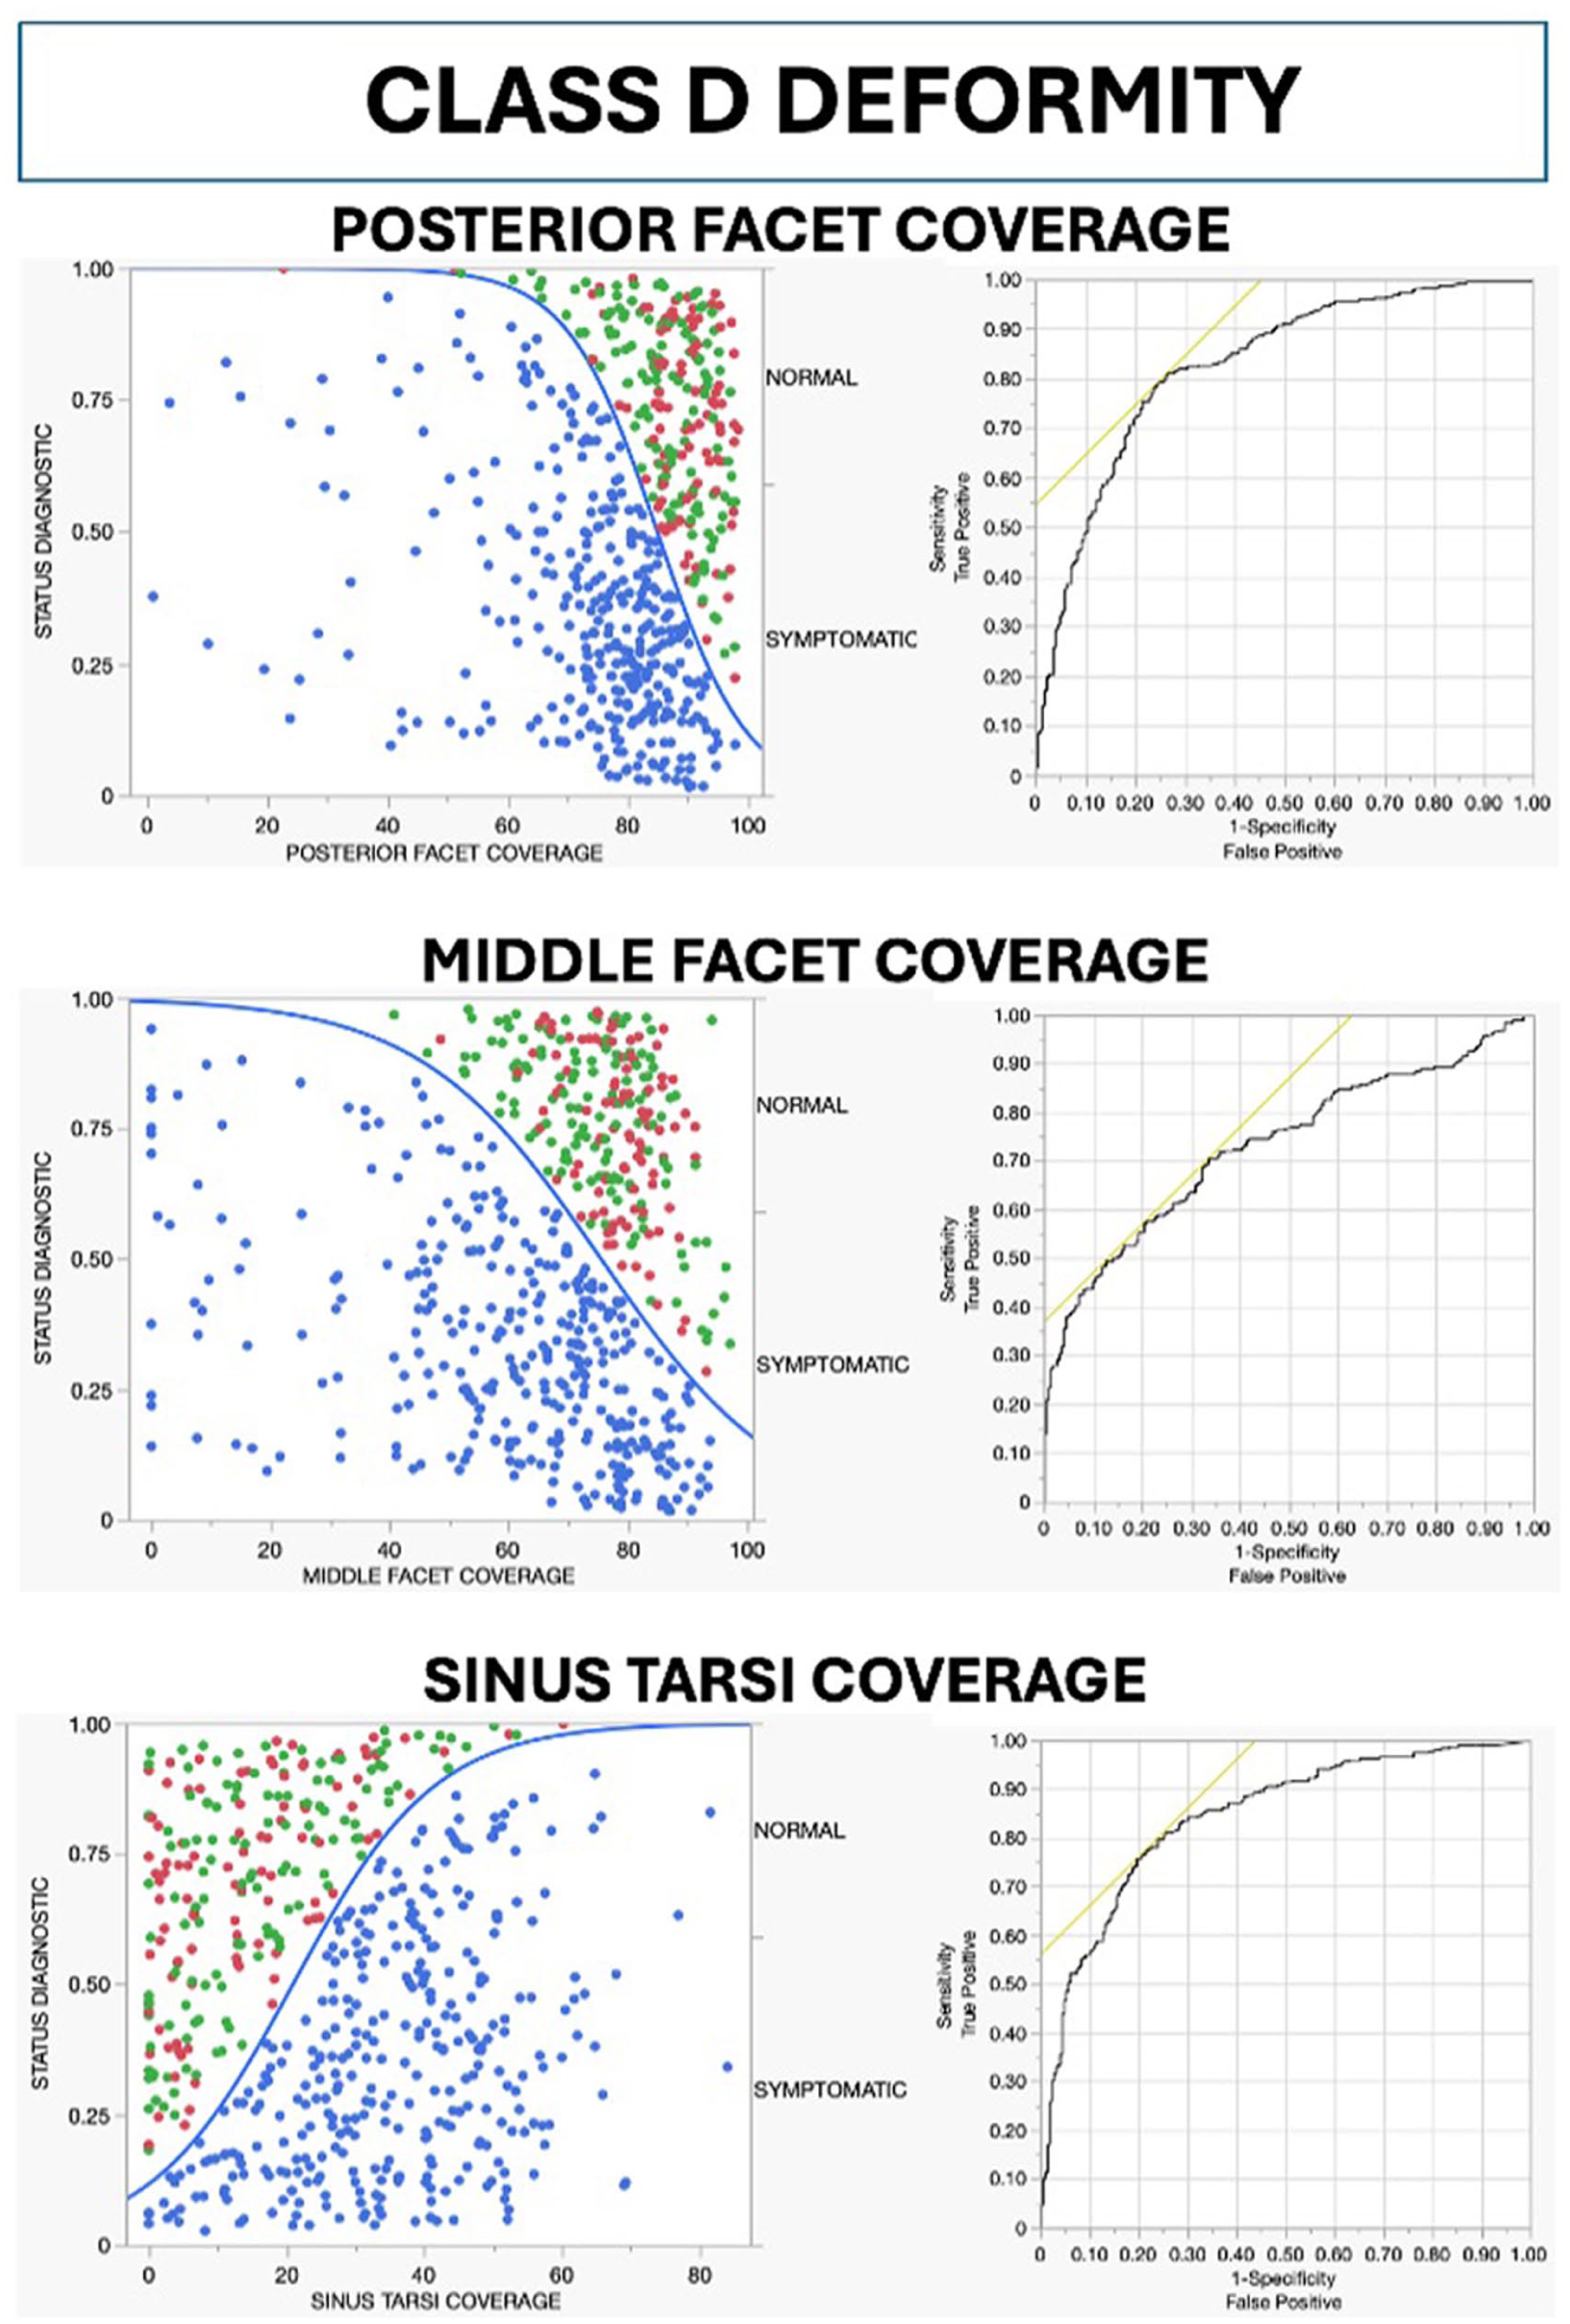
Scatter plot distribution of posterior, middle, and sinus tarsi coverage per diagnostic status and receiver operating characteristic curve for class D deformity. Green: neutrally aligned controls (n = 98), red: asymptomatic flatfoot (n = 132), blue: symptomatic PCFD (n = 331). PCFD, progressive collapsing foot deformity.
The multivariate nominal logistic regression identified the sinus tarsi coverage, TNCA, middle facet coverage, and HMA as significant independent predictors of symptomatic PCFD (χ2 = 334.7, R2 = 0.44, P < .0001). Sinus tarsi coverage had the strongest association (likelihood ratio χ2 = 31.1, P < .0001), followed by middle facet coverage (likelihood ratio χ2 = 19.2, P < .0001), HMA (likelihood ratio χ2 = 18.8, P < .0001) and TNCA (likelihood ratio χ2 = 12.7, P = .0004).
The partition prediction modeling identified TNCA to be the one single measurement to distinguish better PCFD patients from controls, with a value of ≥38.7° predicting 85% chances of PCFD, while if the TNCA is lower than that, a given patient would have only 26% chances of having PCFD. A combination of a TNCA of ≥38.7° with an HMA of ≥20.9 mm would basically be diagnostic for PCFD, with a 99.6% probability.
Discussion
Our study establishes threshold values for measurements commonly used in PCFD staging, with high diagnostic performance (AUC 73%-85%). These thresholds enhance objectivity in PCFD diagnosis and support tailored treatment decisions based on specific deformity patterns. PCFD patients were 9 years older than controls (P < .0001), likely reflecting the natural history of progressive deformity. Age-related changes including posterior tibial tendon attenuation, ligamentous laxity, and cumulative mechanical loading may contribute to both deformity progression and symptom onset.10,17,28 Thus, the older age of symptomatic patients may represent a later stage in the disease continuum.
This is the first study establishing diagnostic thresholds for PCFD measurements across classes A through D using a large cohort of symptomatic patients and combined asymptomatic controls (normally aligned and flatfoot). All measurements demonstrated strong diagnostic performance (P < .0001), with AUC values of 82.7% to 84.5%, except MF coverage (AUC 73.4%). Clinical interpretation of these thresholds should be wary of caveats, as some asymptomatic flatfoot controls exceed proposed cutoffs, representing benign morphologic variation rather than pathology. These thresholds should be interpreted in conjunction with patient symptoms and clinical examination, not as absolute diagnostic criteria. Furthermore, our partition model may help in cases of overlapping or combined abnormalities. Prior studies support our findings. Kim et al 19 found a TNCA cutoff of 41.2° and an HMA cutoff of 38.1 mm with 100% positive predictive value for peritalar impingement on WBCT, aligning with our thresholds (TNCA ≥ 38.7°, HMA ≥ 13.9 mm) and identification of these measurements as strong predictors of symptomatic PCFD. Fayed et al 13 found class D measurements significantly correlated with classes B (ρ = 0.74) and C (ρ = 0.75), suggesting medial arch collapse and forefoot abduction link to peritalar subluxation. However, their study lacked comparative analysis and diagnostic thresholds.
Reliability studies highlight challenges in PCFD staging. Lee et al 22 found high interobserver reliability for classes A (0.87), B (0.83), and E (0.95) but moderate reliability for classes C (0.76) and D (0.68), with overall moderate agreement (0.56) across all classes. Mansur et al 1 built on this by incorporating WBCT images into their evaluation. Their findings revealed low interobserver reliability when assessing the combined deformity PCFD classes in 89 feet, with only a moderate reliability score of 0.55. Lalevée et al 21 also investigated the reliability of the new PCFD staging system in 92 feet. The author compared the performance of the new system with the previously most commonly utilized grading system proposed by Myerson,28,29 subsequently modified by Bluman et al. 2 The study revealed that both classification systems exhibited excellent intraobserver reliability with respective agreement scores of 0.84 and 0.81. However, when it came to interobserver reliability, the PCFD classification system showed only moderate agreement (0.55), whereas the Bluman staging system achieved a good level of agreement(0.67). 21
Li et al 23 explored the diagnostic accuracy of the PCFD classification by conducting a survey-based study. For their 20 PCFD cases circulated among 13 fellowship programs (132 responses), the overall diagnostic accuracy was 71% for combined stages and classes, improving to 81.7% and 78.3% when assessed separately. Misdiagnosis rates varied: class D was most frequently underdiagnosed (22.76%), whereas class B was most overdiagnosed (10.44%). The referenced studies, which evaluated the reliability and diagnostic accuracy of the PCFD staging system, underscore the initial intentions recognized by the PCFD consensus experts: to be inclusive and comprehensive, based on the observer’s experience, enabling different observers to describe the various deformity patterns. 8 Although it was not primarily intended to achieve high reliability and repeatability, the system aims to be descriptive and facilitate easy interpretation. Therefore, establishment of precise threshold values for key measurements used for classes A through D would be beneficial, potentially enhancing the accuracy and consistency. This precision can also support health care providers and surgeons of different expertise in accurately identifying deformity patterns.
The establishment of defined threshold values has important implications for clinical practice. Prior literature has linked specific deformity patterns to surgical decision making: for example, a medializing calcaneal osteotomy is frequently indicated for hindfoot valgus (class A), 3 a lateral column lengthening for midfoot/forefoot abduction (class B), 4 medial column stabilization procedures for arch collapse (class C), 20 and subtalar fusion or ligamentous reconstruction for peritalar subluxation (class D).5,24 By providing quantitative thresholds, our study enhances the objectivity with which surgeons can determine whether these deformities are sufficiently pronounced to warrant operative correction.
Future research should expand beyond radiographic thresholds and explore soft tissue contributions to PCFD progression using magnetic resonance imaging in conjunction with WBCT to clarify stage-specific ligament failure. This would clarify the pathophysiology and help refine surgical indications.
The authors acknowledge the following limitations. First, our mixed design with both prospective and retrospective cohorts could introduce biases inherently associated with retrospective data collection. Second, we chose to include in the control group both neutrally aligned patients and asymptomatic flatfoot patients to obtain a more clinically relevant group represented by both neutrally aligned and asymptomatic flatfoot patients, increasing generalizability. This is supported by a reported prevalence of flatfoot morphotype in the general population of 20%. 12 Had only neutrally aligned controls been used, threshold values would likely be lower, limiting diagnostic accuracy. Third, cohorts were not matched for age, gender, or BMI. Although gender and BMI were similar, PCFD patients were significantly older than controls. Age influences PCFD onset and progression, potentially affecting our results. 26 The age difference may reflect the time required for symptom development, although our cross-sectional design cannot confirm this longitudinally. Fourth, it should be noted that although it has often been used in recent related literature, the Bonelogic software employs proprietary algorithms not publicly available, which may limit reproducibility at centers where another segmentation platform is chosen. Fifth, bilateral feet were included without accounting for within-subject correlation, potentially affecting P-value precision although not threshold values themselves given consistently high AUCs and the often-bilateral presentation of PCFD. Finally, these thresholds are WBCT-based and may not translate directly to conventional radiographs, which remain more widely available. Although WBCT provides superior 3D assessment and eliminates projectional errors, future work should validate comparable thresholds using standard radiography. Sixth, although the Bonelogic workflow relies on a fixed automated algorithm and prior work suggests that automated 3D WBCT measurements reduce operator-dependent variability, we did not formally assess the intra- or interobserver reliability of the Bonelogic-derived PCFD measurements in the present study.15,30
Conclusion
In this prospective diagnostic study involving 321 PCFD patients and 154 controls, we determined cut-off threshold values for key PCFD measurements related to hindfoot valgus (class A), midfoot/forefoot abduction (class B), arch collapse (class C), and peritalar subluxation (class D) deformities. Using a large cohort with WBCT imaging, we achieved high diagnostic performance for most measurements (AUC ≥ 80%) in distinguishing symptomatic PCFD from controls. Our findings provide quantitative thresholds that may enhance objectivity, reproducibility, and standardization of the PCFD classification system. These thresholds offer a framework for more consistent deformity assessment and may inform surgical decision making when integrated with clinical evaluation. Future work integrating WBCT and magnetic resonance imaging will be critical to elucidate stage-specific patterns of ligamentous failure and potentially distinguish flexible from rigid deformities.
Footnotes
ORCID iDs

Ethical Consideration
Ethical approval for this study was obtained from University of Iowa institutional review board (approval no.: 201912144
Funding
The authors disclosed receipt of the following financial support for the research, authorship, and/or publication of this article: This study was partially funded by an internal institutional seed grant.
Declaration of Conflicting Interests
The authors declared the following potential conflicts of interest with respect to the research, authorship, and/or publication of this article: Francois Lintz, MD, PhD, reports disclosures relevant to manuscript of Newclip technics (royalties), Podonov (royalties), CurvebeamAI (stock). Nacime Salomão Barbachan Mansur, MD, PhD, reports general disclosures of Brazilian Orthopedic Foot and Ankle Society: board or committee member; American Orthopaedic Foot & Ankle Society: board or committee member. Grayson Talaski, BS, reports disclosures relevant to manuscript of consulting fees from Restor3d. Scott J Ellis, MD, reports general disclosures of Paragon 28 (now Zimmer-Biomet): paid consultant, product development (with royalties); Stryker/Wright Medical: paid consultant, product development (with royalties); Vilex: paid consultant, product development (with royalties); Medartis/Nextremity: paid consultant, product development (with royalties), now with IBRA (International Bone Research Association); FAI/FAO reviewer: current reviewer for both journals, previous associate editor for FAO (no longer have this position), managerial board of FAI/FAO; Foot Innovate: leadership team, paid consulting; WBCT Society: board member, no direct payment incentive, Curve Beam (indirectly through Stryker and the International WBCT society); editor for Master Techniques in Foot and Ankle Surgery (publisher is Wolters Kluwer); Extremis Robotics: consultant and shareholder; Extremity Medical: leadership board of directors, equity; Elsevier (guest editor, Foot and Ankle Clinics); Wolters Kluwer (Master Techniques in Foot and Ankle Clinics) and fourth edition of Operative Techniques in Orthopaedic Surgery (Springer [PCFD Book]); JEASO DME HSS initiative (Joint Effort Administrative Services Organization); HS2, LLC: stock or stock options; ADN Ambulatory Surgery Center Holding Company, HSS; One Ortho Holdings, LLC. Cesar de Cesar Netto, MD, PhD, reports general disclosures of paid consultancy for: Paragon 28, Ossio, Stryker, Arthrex, Extremity Medical, Zimmer-Biomet, Exactech; royalties from Paragon 28; stock options for CurvebeamAI, Tayco Brace, and T-Soles; AOFAS committee member; president International Weightbearing CT Society; and editor-in-chief of Foot and Ankle Clinics. Disclosure forms for all authors are available online.