
Abstract
The purpose of this study was to determine the pattern and magnitude of navicular bone (NB) movement during walking as well as the relationship between dynamic NB and rearfoot movement. The angle of rearfoot and displacement of the NB was recorded in 106 subjects using the 6D Research electromagnetic tracking system. The relative change in the height of the NB between foot flat and heel-off was 7.9 mm. The NB seems to undergo significant vertical as well as medial displacement during the stance phase of normal walking. This motion is also correlated with rearfoot motion during walking.
INTRODUCTION
In 1982, Brody 1 proposed the use of what he called the navicular height test (NHT) as a “practical method of determining the amount of pronation in a runners foot.” The NHT was defined as the distance from the supporting surface to the navicular bone while standing in a relaxed posture. Brody reported that the normal value for the NHT was 10 mm, and that values > 15 mm were considered abnormal. 1
The use of the NHT as an assessment tool to determine foot pronation is based on the concept of a constrained tarsal foot mechanism. 6 The constrained tarsal foot mechanism consists of the subtalar, talocalcaneonavicular, and calcaneocuboid articulations. 6 In a constrained foot mechanism, kinematic characteristics are present. These characteristics can include the following: (1) the shape of the articular surfaces, (2) insertion pattern and length of adjoining ligaments, (3) the number of articulations in the mechanism, and (4) the position of the joints with respect to one another. 6 A constrained mechanism is well suited to transmit motion. Traditionally, this has been considered a primary function of the subtalar joint. 10 The four bones and adjacent soft tissue structures that form the three articulations of the tarsal mechanism allow the foot to accept transverse rotation of the lower leg during dynamic activities such as walking and running. Although foot pronation comprises more than just movement of the midfoot region, the fact that these three articulations are biomechanically linked together indicates that the NHT can provide a useful index of both midfoot and rearfoot movement.
Several studies have determined both normal values and the reliability of the NHT. 14,15,17 Based on these studies, the average change in the height of the navicular when performing the NHT is 7.3 mm, with an average standard deviation (SD) of 3.6 mm. The original normal value of 10 mm proposed by Brody would seem to be substantiated. These studies have reported good-to-excellent levels of both intrarater and interrater reliability.
No information exists regarding the validity of the NHT with respect to dynamic movement of the navicular bone in activities such as walking. Although the NHT may provide the clinician with a reliable composite measure of foot pronation and supination, the test may not be representative of the actual movement of the navicular bone during dynamic movement and, thus, have no validity.
The purpose of this study was twofold: first, to determine the displacement of the navicular bone during normal walking and relate this magnitude of movement to normative values previously reported for the NHT; and second, to determine the relationship between rearfoot motion and the displacement of the navicular bone during walking. The null hypothesis for this study was that the magnitude of dynamic movement of the navicular bone would not be related to the normal values for the NHT.
MATERIALS AND METHODS
Subjects
This study consisted of 106 subjects (49 men and 57 women) between the ages of 18 and 41 years (mean, 26.2 years). Subjects were chosen from a larger pool of volunteers who had no history of congenital deformity, pain, or traumatic injury to either of their lower extremities at least 6 months before the start of the study. Table 1 shows the demographics for the subjects who participated. This study was approved by the Internal Review Board at Northern Arizona University before the start of data collection, and all subjects provided informed written consent.
Demographic Information
Instrumentation
Rearfoot and navicular bone movements of each subject were measured using the 6D-RESEARCH electromagnetic motion analysis system (Skill Technologies Inc., Phoenix, AZ). This system is based upon the Fastrak tracking device (Polhemus, Colchester, VT) and uses an electromagnetic transmitter with up to four electromagnetic sensors. The transmitter and each sensor consist of three orthogonal coils. Near field, low frequency, magnetic field vectors are generated from the transmitter with each sensor detecting these field vectors. The detected signals are input to a digital signal processor that computes the position of the sensor and orientation relative to the transmitter. The system has an effective accurate range of a 76-cm radius from the transmitter. Although this range is too small for analysis of a full walking stride, it is sufficient for analyzing the stance phase of walking. 11 For the present study, the electromagnetic transmitter was positioned at a height of 960 cm at the midway point of a 6.1-m raised walkway. The walkway was raised to a height of 76 cm to avoid any possible distortion of the electromagnetic fields caused by metal reinforcement in the concrete floor of the laboratory (Fig. 1). Three electromagnetic sensors were used to collect angular position data for the tibia, calcaneus, and navicular bone during walking. These sensors were attached to the skin overlying the tibial tubercle, posterior calcaneus, and navicular of the right lower extremity of each subject (Fig. 2). The sampling rate for the three sensors was 60 Hz. The angle of the rearfoot was calculated using a joint coordinate system between the tibial and calcaneal sensors. 5 The movement of the navicular was recorded as the linear displacement of the sensor attached to the skin overlying the navicular. Figure 2 illustrates the angles and displacements recorded for this study. The resulting angles and displacements were smoothed using a 6-Hz low-pass digital Butterworth filter and stored on a microcomputer for later further analysis.
The experimental setup used to collect kinematic data of the lower leg and foot during walking.
Sensor placement and definition of kinematic data. A, Measurement of navicular displacement. B, Measurement of three-dimensional rearfoot motion.
To record the temporal occurrences of heel strike, foot flat, heel-off, and toe-off, three force-sensing switches (Interlink Electronics, Camarillo, CA) were secured to the plantar surface of the heel, first metatarsal head, and hallux of each subject, using adhesive tape. The signal produced by each switch was also recorded by a microcomputer and synchronized with the previously mentioned kinematic data.
Procedure
After the recording of the height and weight of each subject, three small (2.8 × 2.3 cm) electromagnetic sensors were attached to the right lower extremity using double-sided adhesive tape. A sensor was placed on the anterior tibial tubercle, posterior calcaneus, and navicular tubercle (Fig. 2). These locations were selected because of minimal soft tissue presence and, therefore, the reduced possibility for sensor-skin movement during walking. The sensors were connected to a microcomputer for data collection by means of a 30-foot serial cable. The subject then stood relaxed with the knees extended and feet placed parallel to the plane of motion while the orientation of each sensor, relative to the laboratory reference frame, was zeroed. This position was used as the reference point for all angular and linear distance measurements. After zeroing the sensors, each subject walked along the walkway at their own self-selected speed. A total of five consecutive walking trials were recorded. Orientation data for each of the electromagnetic sensors were stored on the microcomputer for further analysis. Trials that subjectively seemed to be abnormal in any way were repeated.
Data Analysis
Type 2,1 intraclass correlation coefficients (ICC) were used to assess between-trial reliability of stance phase duration (SPD). 18 The consistency of motion patterns obtained by the electromagnetic system was estimated using both SD and standard error of measurement values. 16
The angle of the rearfoot at heel strike, maximum pronation angle and time to maximum pronation were calculated from the resulting rearfoot motion pattern of each subject. With respect to dynamic movement of the navicular bone, the amount of displacement relative to the person's resting standing posture was measured during stance phase of walking from foot flat to heel-off. The maximum displacement of the navicular bone was measured in the vertical (NDZ), mediolateral (NDX), and resultant directions (NDR). In addition, the time at which maximum displacement of the navicular bone in the vertical (TNDZ) and mediolateral (TNDX) direction was determined. The relationship and dynamic rearfoot and navicular bone movement during walking was assessed using a Pearson correlation coefficient. An α level of 0.05 was used for all tests of statistical significance.
RESULTS
With regard to between-trial reliability, the ICC value calculated for SPD was 0.909. The mean SD and standard error of measurement values for the dynamic motion patterns of rearfoot and navicular bone movement of all subjects are presented in Table 2. As can be seen, each of the motion patterns demonstrated good between-subject consistency. Average measurement error was 0.1° or <0.2 mm.
Mean Standard Deviation and Standard Error of Measurement Values*
SD, standard deviation; SEM, standard error of measurement.
Calculated from the mean dynamic motion patterns of rearfoot and navicular bone movement of each subject.
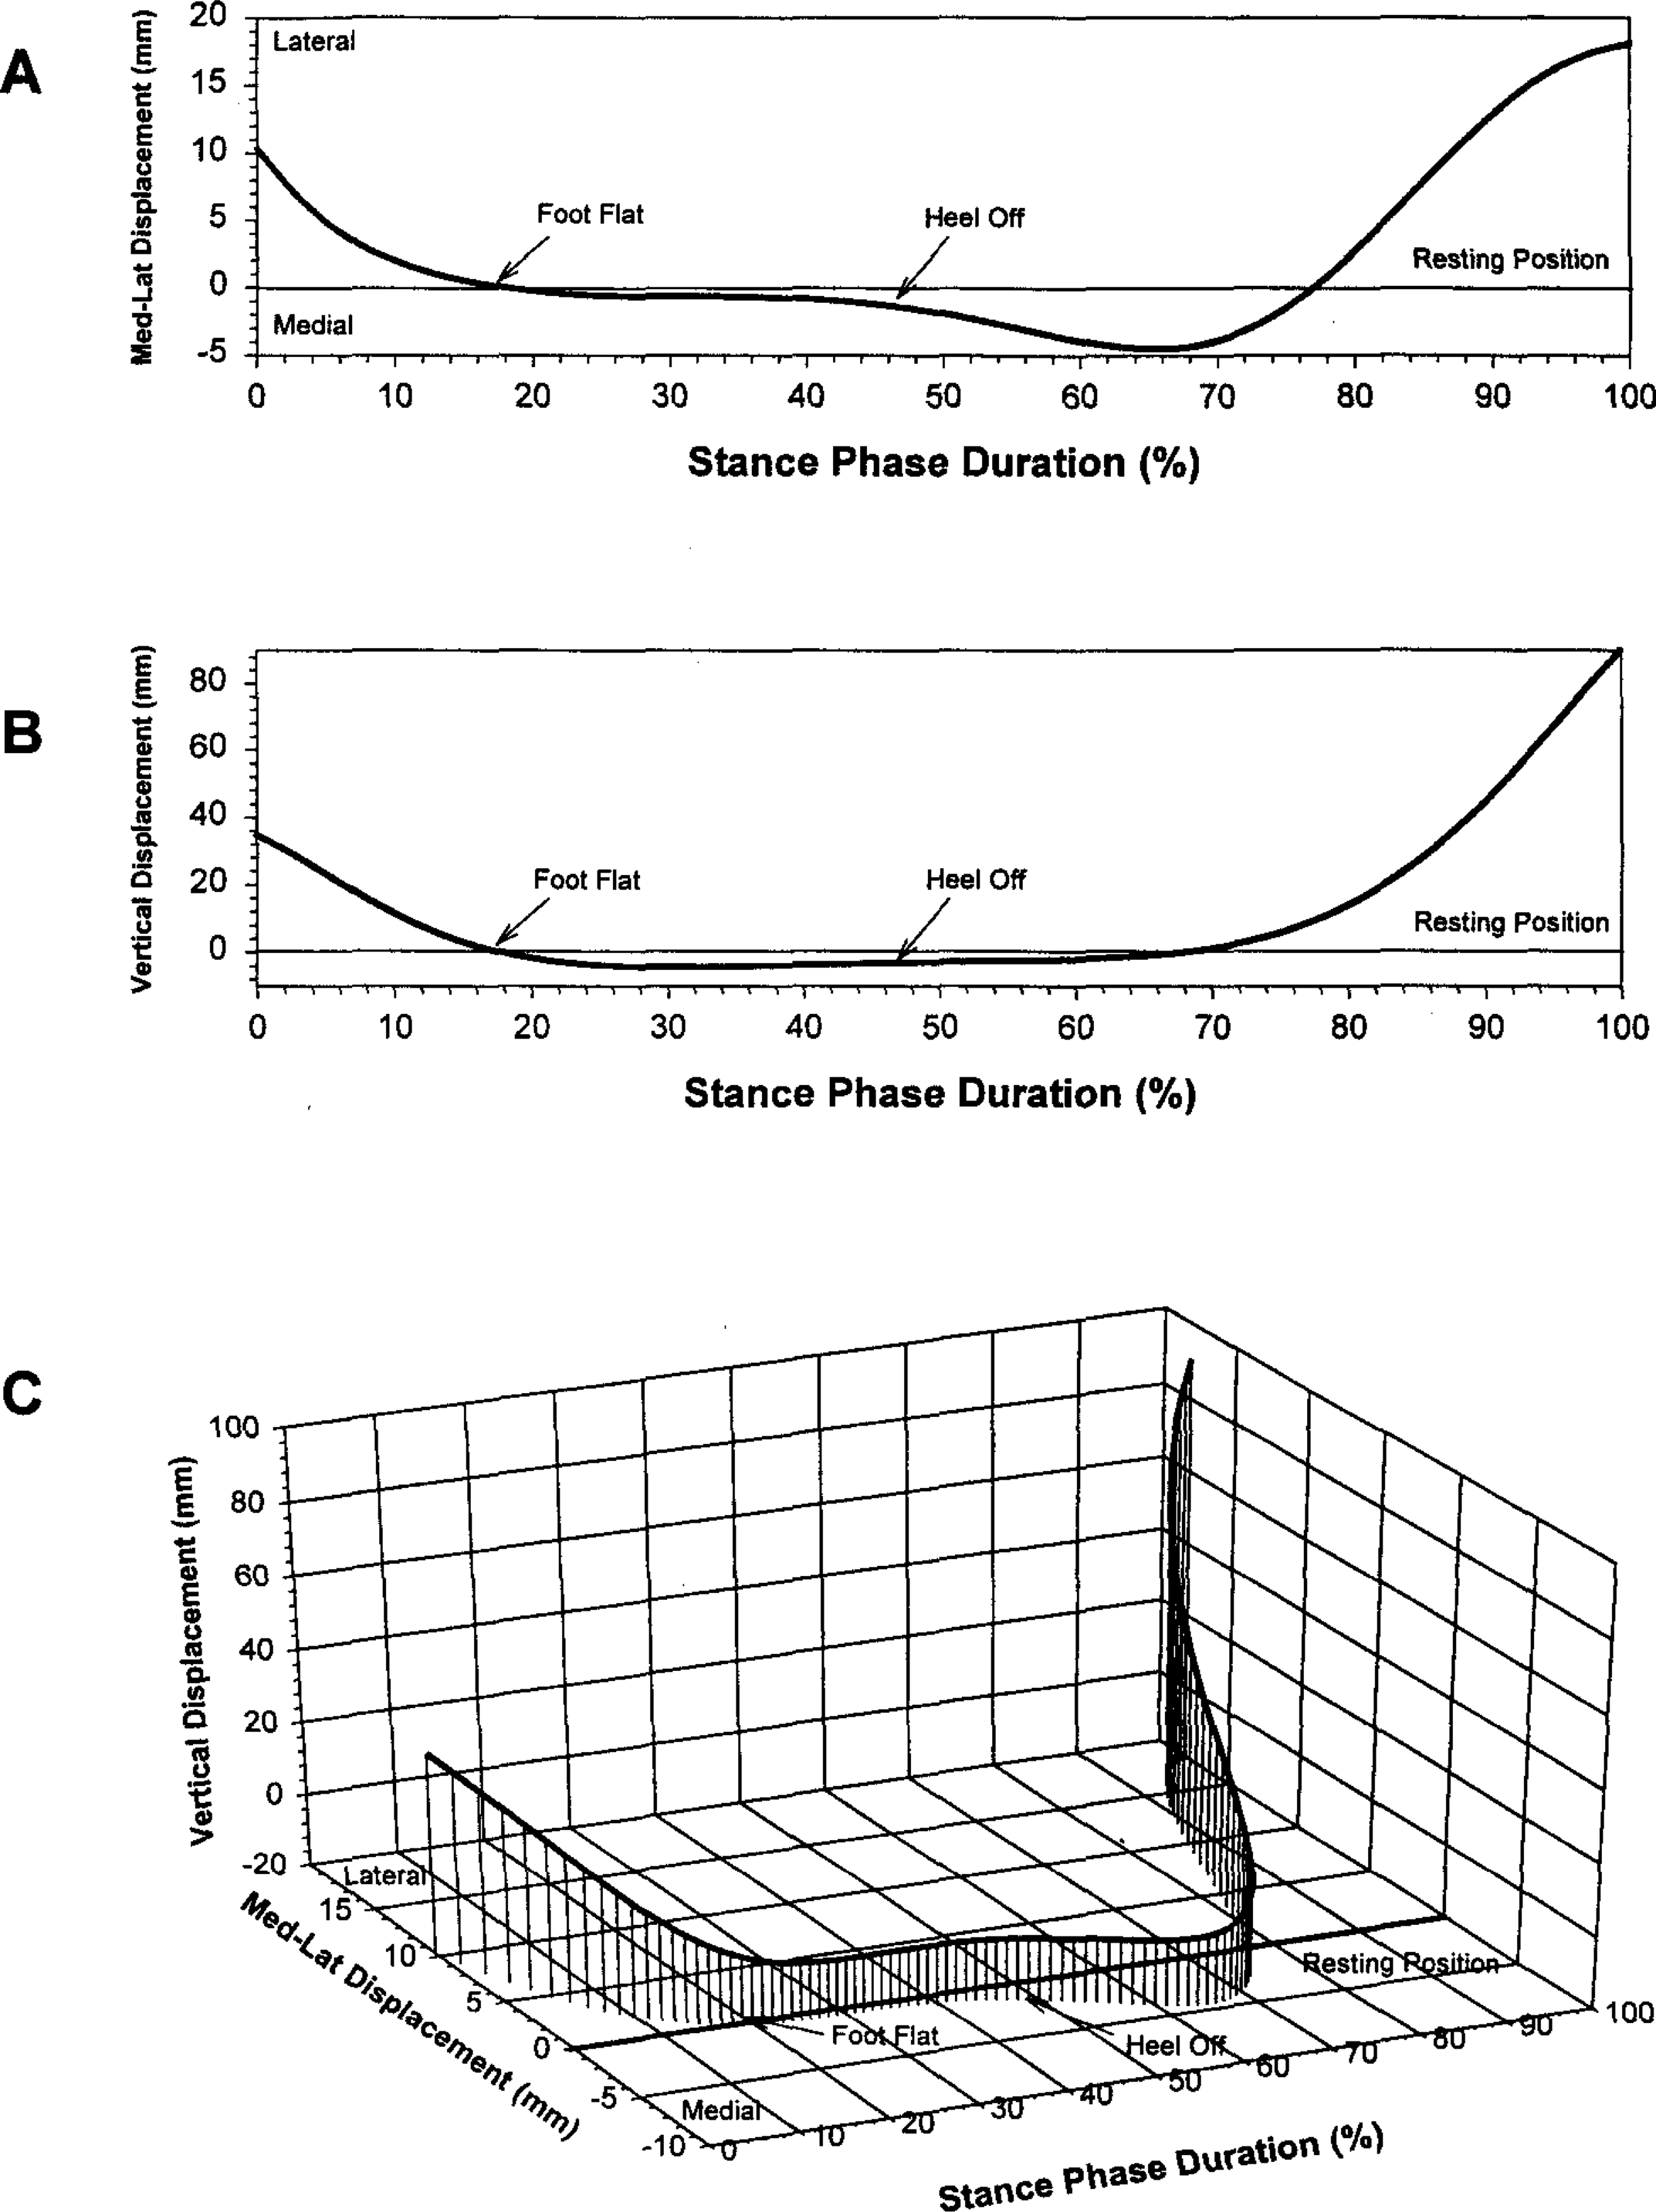
Mediolateral and vertical displacement patterns of the navicular bone during the stance phase of normal walking.
Figure 3 shows the mean three-dimensional motion patterns for the navicular bone during the stance phase of walking. As can be seen, the navicular bone undergoes movement in all three planes, the greatest magnitude of which being vertical displacement. The mean maximum vertical depression was 5.9 mm (±2.8) beyond the resting standing position, whereas the maximum medial displacement was 4.7 mm (±2.0). The maximum total excursion of the navicular bone, calculated as the resultant of both mediolateral and vertical movement, was found to be 7.9 mm (±2.5). The timing of these variables was 47.8 (± 14.6) and 53.1 (± 10.2) % of the SPD, respectively. These values would represent approximately 29% and 32% of the entire gait cycle respectively. These values are very similar to the mean time of heel-off, which was 54.9% (±9.0).
The mean three-dimensional motion pattern of the rearfoot is presented in Figure 4. The mean maximum pronation angle was found to be −3.9° (± 2.4°). The time to this maximum pronation angle was 48.2 (± 14.2) % of the SPD. The correlation between the navicular bone and rearfoot motion pattern was found to be 0.942 (r2 = 0.887).
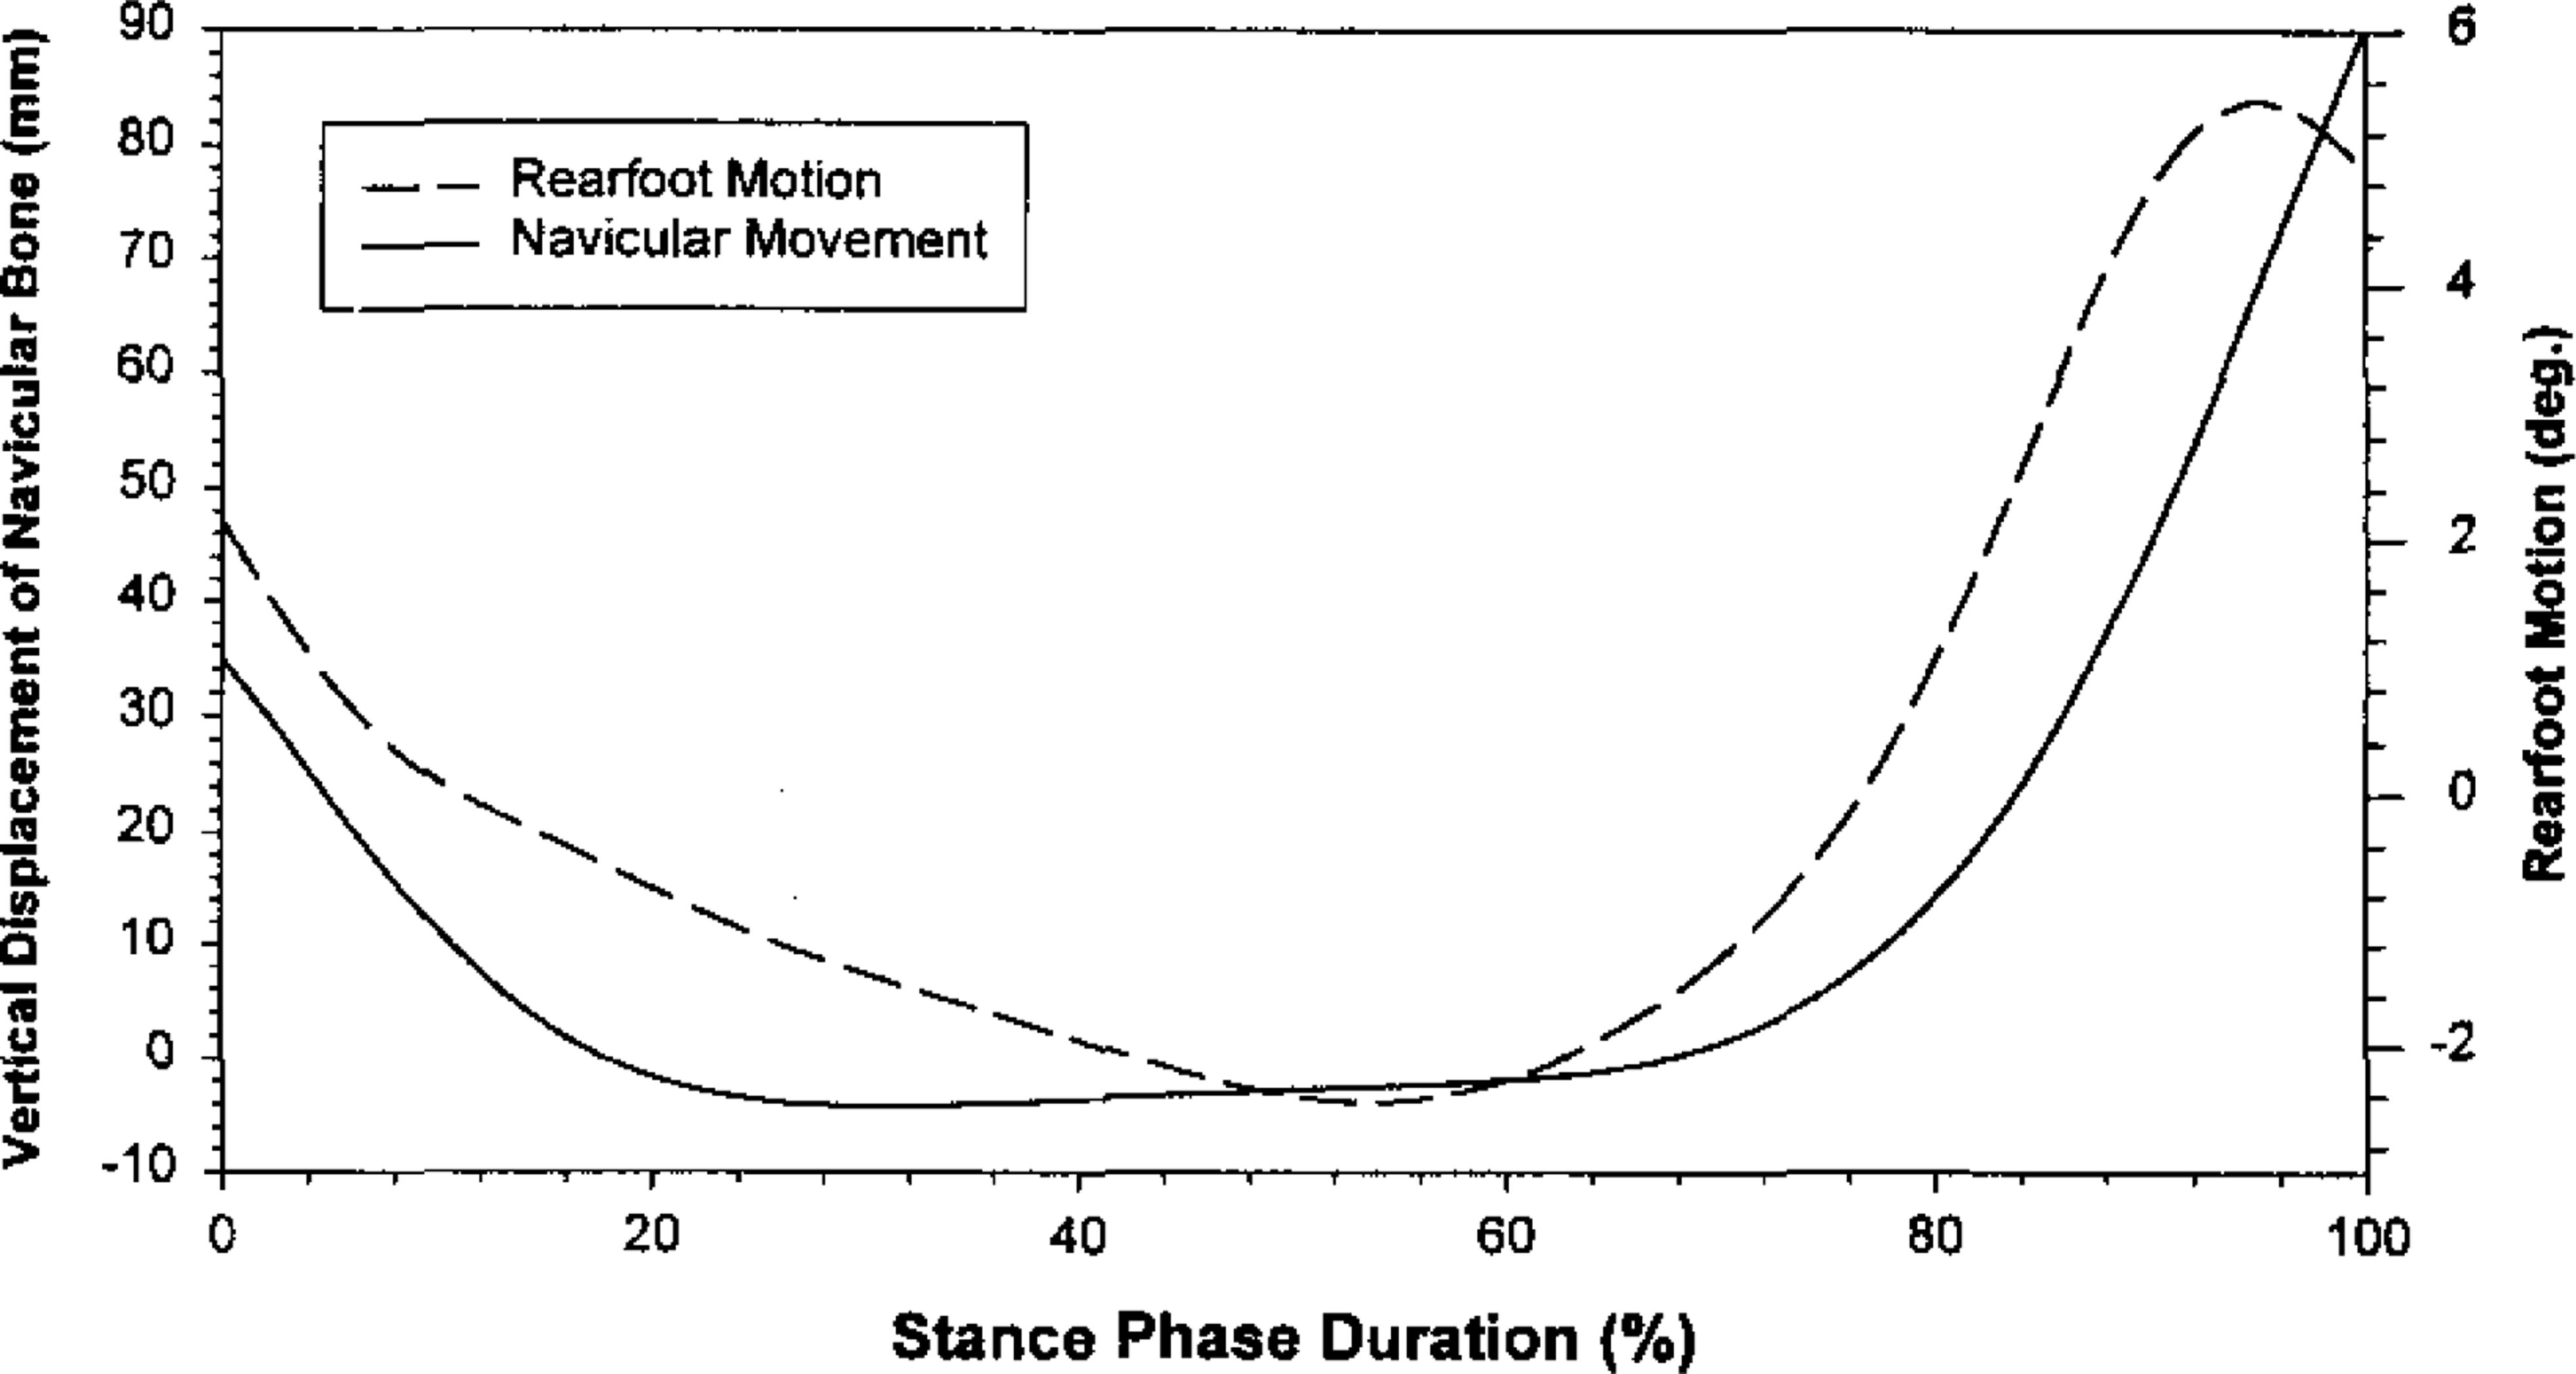
Mean rearfoot and navicular bone displacement motion patterns during the stance phase of normal walking.
DISCUSSION
The first purpose of this study was to determine the displacement of the navicular bone during normal walking and relate this magnitude of movement to normative values previously reported for the NHT. As can be seen in Figure 3, the navicular bone undergoes significant medial and vertical displacement during the stance phase of normal walking. The maximum medial displacement occurs much later in the stance phase compared with the maximum vertical displacement. This corresponds to the propulsive phase and is typically accompanied by resupination of the rearfoot and rapid external rotation of the lower extremity. 2–4,7,13 Vertical displacement of the navicular bone reaches its maximum value much earlier, between the periods of when the foot first becomes flat on the supporting surface and when the heel initially rises off the ground. This timing pattern is similar to that of rearfoot motion during walking. 12,13 The maximum vertical depression and the maximum total excursion of the navicular bone during walking would seem to be closely related. Based on these results, the null hypothesis for this study was rejected.
The second purpose of this study was to determine the relationship between rearfoot motion and the displacement of the navicular bone during walking. Based on the high correlation found between vertical displacement of the navicular and the rearfoot motion during normal walking, it would seem that a significant relationship exists between the two movement patterns. Although not identical, each displacement pattern reflects a significant amount of overlap. As such, it should be possible to measure one of the movements and, thus, extrapolate the other. The subtalar joint and two midtarsal articulations are components of the tarsal mechanism. Because the navicular bone is one of the four bones that compose the constrained tarsal mechanism, measurement of navicular bone movement during walking would be an indicator of both rearfoot and midfoot motion.
The results of this study validate the use of the NHT as an indicator of dynamic navicular bone movement. In addition, because the navicular bone is one of the four bones that form the three articulations of the constrained tarsal mechanism, it would seem that both static and dynamic measurements of the navicular bone serve as a global indicator of rearfoot and midfoot components of foot pronation or supination.
Summary
The present study demonstrates the dynamic structure of the medial longitudinal arch, as reflected by displacement of the navicular bone during walking. Although the magnitude of medial displacement compared with vertical displacement is similar, the timing of the two components is quite different. The high correlation between rearfoot and navicular displacement patterns suggests a great deal of shared representation of motion. Because of its anatomical position, navicular displacement may be a more global measure of foot motion, compared with the rearfoot measurement.