
Abstract
Alzheimer’s disease (AD) affects neurological, cognitive, and behavioral processes. Thus, to accurately assess this disease, researchers and clinicians need to combine and incorporate data across these domains. This presents not only distinct methodological and statistical challenges but also unique opportunities for the development and advancement of psychometric techniques. In this article, we describe relatively recent research using item response theory (IRT) that has been used to make progress in assessing the disease across its various symptomatic and pathological manifestations. We focus on applications of IRT to improve scoring, test development (including cross-validation and adaptation), and linking and calibration. We conclude by describing potential future multidimensional applications of IRT techniques that may improve the precision with which AD is measured.
Alzheimer’s disease (AD) is a common and devastating condition that affects the brain, cognition, and behavior. Presumed to begin with plaques and tangles in the brain, these initial neuropathological changes eventually result in a host of different changes, including neurocognitive, neuropsychiatric, and functional impairments. Because of the varied impacts of the disease, AD presents a complex set of assessment problems, including early and accurate diagnosis, development of sensitive but efficient cognitive measures, and synthesis of information across affected domains of functioning.
Modern psychometric techniques, such as item response theory (IRT), offer statistically robust methods to address the aforementioned challenges. The purpose of this article is to demonstrate how IRT has improved the precision with which we measure AD across its various clinical manifestations, thereby improving our understanding of the disease. Specifically, we will discuss applications to test scoring, test development, cross-validation and adaptation, and linking and calibration. Recent theoretical and data-driven examples from large AD databases are provided to summarize current applications as well as articulate a vision for the future of AD measurement. These examples demonstrate how assessments based on unidimensional and multidimensional IRT (MIRT) models can improve basic understanding and treatment of the disease. We conclude by describing possible future applications of IRT to AD assessment.
Challenges in AD Assessment
The notion that AD is a continuous, dimensional construct has become largely intuitive. Progression of disease manifestations is very apparent, ranging from cellular changes with no observable clinical symptoms to global neuronal loss resulting in profound impairment. However, this intuitive understanding of AD comes only after nearly 30 years of vigorous research and debate to define the nature of the disease (Dubois et al., 2007; Khachaturian, 1985; McKhann et al., 1984; McKhann et al., 2011).
Understanding the dimensional nature of AD is critical, as it informs diagnostic (and consequently, treatment) processes. Until recently, misdiagnosis was common, with estimates ranging from 10% to 30% as defined by neuropathological changes detected at autopsy (McKhann et al., 1984). Though accuracy for various assessment methods has greatly improved (McKhann et al., 2011; Sperling et al., 2011), in vivo diagnosis of AD remains an imperfect science (Dubois et al., 2007). Some of this diagnostic imprecision stemmed from early debates about whether AD reflects a qualitative phenomenon requiring categorical classification, or a quantitative phenomenon requiring ordinal or continuous classification. In recent years investigators have resolved this debate, concluding clearly that the disease is progressive across a continuum and can be represented well within a dimensional framework (Jack et al., 2010; Jack et al., 2013), setting the stage for applications of IRT.
The multifaceted nature of AD can, by its nature, create several measurement challenges. Consider how even simple things, like scoring a cognitive screener could pose a challenge in AD. For example, one would typically scores the results of a multidomain cognitive or multiple activity functional measure as most clinical assessments are scored: add up the correct responses across domains, with all items having equivalent weights. At times there have been efforts to weight certain items or aspects of the disease more than others. For example, some instruments attempt to give greater importance to memory dysfunctions, given its importance to AD than to other types of dysfunctions. This weighting, though, was not created systematically in a way that considers carefully the ability of each item to indicate a particular degree of dementia severity. Furthermore, relatively little was done early in the development of most instruments to test how socieodemographic factors influence performance on measures across groups. Finally, many efforts to revise tests to gain broader coverage or to shorten tests for screening purposes were completed without knowing the ability of each item to indicate the latent continuum of interest. We will not review all of these efforts as they easily could serve the basis of several volumes in a series. Rather, we will describe efforts to introduce a different theory of measurement, IRT, to the field of AD research that specifically addresses these shortcomings.
IRT: Theoretical Overview
IRT is a psychometric paradigm that emerged in the 1960s and sometimes is considered an alternative to classical test theory (CTT), which was the predominant psychometric framework for test development and reliability. CTT is largely based on the idea that an individual’s observed or obtained score on a test is the sum of a true score (error-free score) and error. In comparison, IRT refers to model-based measurement in which trait-level estimates depend on both individuals’ responses and the properties of the items administered (Embretson & Reise, 2000). Early applications of IRT consisted of test development and adaptation to improve measurement precision and maximize efficiency. IRT can also be used, however, for purposes other than test development (Embretson & Reise, 2000) as we will discuss in this article.
In simplest terms, IRT models describe the probability of endorsing an item as a function of a latent trait of interest. By convention, the latent trait is scaled continuously along a dimension called theta. Parametric IRT models identify one or more parameters that describe the relationship between theta and item responses. Two basic item parameters include item discrimination and difficulty. Item discrimination, notated as a, refers to how strongly an item is related to the latent continuum of interest. It is operationalized in many IRT models as the slope of the item curve at b, the item difficulty parameter. Item difficulty, notated as b, refers to the value of theta at which an individual has a 0.50 probability of endorsing an item. This foundational IRT model can be used to quantify and model many phenomena, such as AD, as will be described below.
Literature Review
For this article, we completed a review of relevant studies published to date (February 2017). Studies were identified through searches of PubMed, MEDLINE, and PsychINFO. Search filters included were keyword, title, and abstract information and search terms relating to IRT and dementia were combined. We used the following key terms (“item response theory,” “Alzheimer’s disease,” “dementia,” “measurement,” and “assessment”) to find relevant articles. We also used combinations of the aforementioned key terms (e.g., “item response theory” and “measurement” and “Alzheimer’s disease” or “Alzheimer’s disease” and “dementia” and “assessment”). Bibliographies of included studies were hand-searched and a forward citation search was performed on all included studies to establish all articles which cited them. From this effort, 72 articles considered to be relevant were retrieved and assessed. Unpublished studies, dissertations, theses, journal conference abstracts, and poster presentations were excluded. While sometimes presented as part of the IRT literature, studies featuring Rasch approaches and Mokken scaling also were excluded. In this review, we draw on select studies not only to describe what has been done but more important, what is possible with IRT applications in AD assessment. For a complete listing of all 72 articles, please refer to Supplement 1: Literature Review.
IRT-Based Scoring
When used to quantify or measure a dimensional construct, test scoring can quickly become challenging. Most AD studies include a host of outcome measures targeting various cognitive and adaptive functions. Among these functions, clinicians long recognized the relative importance of impaired memory as an early manifestation of the disease. Consequently, items assessing memory were often weighted more than others (such as language items) to assess the typical presentation of AD. However, the particular processes used to establish the weights were informed more by subjective clinical observation than by psychometric theory. Nonetheless, scientists began to recognize that some items might better index the disease than others and contemplated the extent to which unique items differentially indicated AD severity. If indeed differential effects existed, then empirically informed weights could be developed in relation to each item’s ability to indicate the disease. IRT has been used to begin to explore these questions in the dementia staging literature and extended to improve the precision with which change in clinical trials is measured. This innovation in staging came from focusing on more than simply total scores, but rather the pattern of responses on standard instruments.
Harnessing the Power of Response Patterns
In classic scoring approaches on AD instruments, each item is given the same weight. This method of scoring has limitations because not all items on a measure similarly reflect the disease, thereby resulting in measurement imprecision. IRT can take item characteristics into consideration when scoring the items to gain a more accurate estimate of an individual’s level of AD. IRT-based analyses are used to determine each item’s contribution to AD severity; then, each item is weighted by the parameters that define its ability to indicate AD severity. By considering different response patterns and how the items function, we can get a finer-grained estimate of dementia at each level of dementia severity.
IRT scoring has been used in several subfields of the AD literature, including severity staging and neurocognitive testing. Here we address AD staging, which is frequently operationalized in terms of adaptive function, cognitive performance, and biological indicators. The most common method of staging the disease uses the Clinical Dementia Rating (CDR) scale (Hughes, Berg, Danziger, Coben, & Martin, 1982). For a modern-day CDR assessment, a clinician interviews both the patient and collateral sources to rate the patient on six cognitive and behavioral domains (memory, orientation, judgment and problem solving, community affairs, home and hobbies, and personal care). For each domain, the clinician uses a 5-point ordinal scale to rate the severity of impairment: 0 (no impairment), 0.5 (questionable impairment), 1 (mild impairment), 2 (moderate impairment), and 3 (severe impairment). Severity ratings can differ across domains, such that an individual may have mild impairments in memory (memory box score = 2) along with moderate impairments in orientation (orientation box score = 1), and so on (see also Morris, 1993).
Historically, a CDR-global score was derived by entering ratings from each of the six domains into an algorithm that weights memory more heavily than the other five domains (Morris, 1993). The decision to weight memory more heavily stems from clinical experience and a qualitative synthesis of the literature (Balsis, Miller, Benge, & Doody, 2011). A more recent approach, the Sum of the Boxes (SOB) method, appears to bring more precision to dementia staging by weighting each box (domain) equally (O’Bryant et al., 2008; O’Bryant et al., 2010). To calculate a SOB score, one simply adds the severity rating scores for each domain to determine the total score or sum. Thus, SOB scores range from 0 to 18, with 0 indicating no dementia and 18 indicating severe dementia. Both scoring approaches, the weighted algorithm and the SOB, have potential drawbacks because they either treat all domains equally (SOB) or weight them using clinical experience and synthesized understanding (classic method).
In contrast to these standard scoring methods, IRT can be used to stage the disease with more precision by weighting items (features of dementia) according to the strength of their actual relationship to underlying dementia severity. By weighting each box (“item”) according to its actual ability to index dementia severity, an IRT approach can help an investigator stage dementia in a way that more exactly places individuals along a progressive continuum (CDR 0, 0.5, 1, 2, 3). This method was employed by our lab to statistically determine the contribution of each box (domain) to dementia severity (Balsis et al., 2011). An IRT-based scoring approach was compared with both the original CDR-global algorithm method and the more recently developed SOB scoring system.
Results revealed a key finding: the classic algorithm for computing a CDR global score contained significant imprecision—individuals with the same degree of dementia severity in some cases received different CDR global scores. Specifically, certain individuals identified with a CDR = 0.5 could have 0.6 standard deviations more underlying dementia severity than certain individuals with a CDR of 1.0. Across all CDR scores, the total amount of overlap was 48%, meaning that only 52% of the cases were placed in distinct ordered categories using the classic scoring method. Compared with the classic scoring approach, the SOB approach to staging dementia resulted in fewer instances of measurement imprecision. Using this scoring approach, only 12% of cases had overlapping dementia severity. In addition, results from this study indicated that overlap could be further reduced using the IRT-based staging method. Although additional patient populations with other data patterns across boxes will need to be tested, findings from the Balsis et al. (2011) study indicated that an IRT-informed approach can improve precision of dementia staging. By weighting features of dementia according to their actual relationship to underlying dementia severity, results suggested that patients could be placed neatly into ordered dementia stages, with 0% overlap.
Other studies have demonstrated that an IRT approach to scoring the CDR improves external validity. Miller, Balsis, Lowe, Benge, and Doody (2011), for example, found that fine gradations of measurement within CDR stages quantified using IRT analyses are associated with differences in functional activities of daily living, such as feeding, dressing, bathing, and toileting. Here, we see that the use of IRT-based scoring not only produces finer-grained estimation of disease severity but also that it enhances the prediction of important functional outcomes.
Aside from staging, IRT scoring also has been used to increase precision in neuropsychological testing. Consider, for example, the neuropsychological test, the Alzheimer’s Disease Assessment Scale–Cognitive test (ADAS-Cog; Rosen, Mohs, & Davis, 1984). The ADAS-Cog is a standard assessment tool used to quantify cognitive dysfunction in many of the early clinical trials of AD medications (e.g., Birks, 2006; Rockwood, Fay, Gorman, Carver, & Graham, 2007). It consists of 11 subscales that are designed to assess various cognitive abilities, including those associated with memory and language.
In a study by Benge, Balsis, Geraci, Massman, and Doody (2009), each subscale of the ADAS-Cog (memory, language, praxis, etc.) and the test as a whole were examined to determine how each measured cognitive dysfunction at varying levels of dementia severity. As traditionally scored, there are 71 possible integer score points on the continuum (the number of integers between 0 and 70, inclusive). In contrast, there are 2.16 billion possible combinations of individual score items when the patterns of individual item scores are considered (Balsis, Unger, Benge, Geraci, & Doody, 2012). Having 2.16 billion possible locations along the latent continuum greatly improves the precision with which one can detect change than was afforded previously by traditional scoring of the scale. IRT scoring harnesses this information to inform AD assessment. Such a pattern-focused scoring approach has been used to create composite scores from classic neuropsychological instruments. Using this pattern scoring approach, Gibbons et al. (2012) demonstrated that IRT-based scores were better able to capture change over time, requiring a 40% smaller sample to detect change relative to the classic scoring techniques for these measures. IRT scoring also predicted AD conversion better than the classic approach, and these scores were significantly associated with structural magnetic resonance imaging (MRI) and cerebrospinal fluid biomarkers of the disease. In sum, IRT-informed scoring can, and is beginning to, be used to improve the precision with which we can stage and measure neuropsychological indicators of AD.
The precision afforded by using IRT-based scoring can lead to valuable advances in diagnosis and characterization. A study by Snitz et al. (2012) highlights how IRT scoring methods can detect the disease in its earliest stages. Though debate is ongoing, there is some evidence to suggest that subjective cognitive complaints may precede the development of objectively measured memory loss in AD. When IRT analyses were brought to bear on a measure of subjective cognitive dysfunction, IRT scoring produced values that provided greater sensitivity at early stages of the disease than the typical scoring method. In conjunction with the CDR findings, these findings suggest that that IRT-based scoring approach may result in the development of measures that are more sensitive to subtle variations in the disease across the full spectrum of its severity, thereby facilitating earlier and more accurate diagnosis and characterization.
More Precise Estimates of Standard Error
In addition to improving staging and early detection, IRT scoring can also reduce measurement error, critical for precisely capturing change in clinical trials of AD medications. In this context, researchers again have focused on response patterns. However, in addition, IRT has been used to create more precise estimates of standard error. Consider the fact that each individual’s estimated true score has a different standard error depending on the location of the person’s score along the latent continuum. In CTT, each person’s estimated true score has the same standard error regardless of that score’s placement along the scale in question. IRT can more precisely estimate standard error. Consider Figure 1, which shows two related curves. The solid curve is the test information curve for the ADAS-Cog (Rosen et al., 1984), using data taken from Baylor College of Medicine’s Alzheimer’s Disease and Memory Disorders Clinic. The dashed curve is the dynamic standard error curve. Where information is highest, precision of measurement is highest, and standard error is low. Analyzing this curve reveals that this measure best measures AD-related cognitive dysfunction in the moderate range of disease severity. In contrast, it does not measure cognitive dysfunction as well in the mild or severe ranges of AD severity. Classic approaches do not provide this type of precision, and in turn introduce error variance into studies.
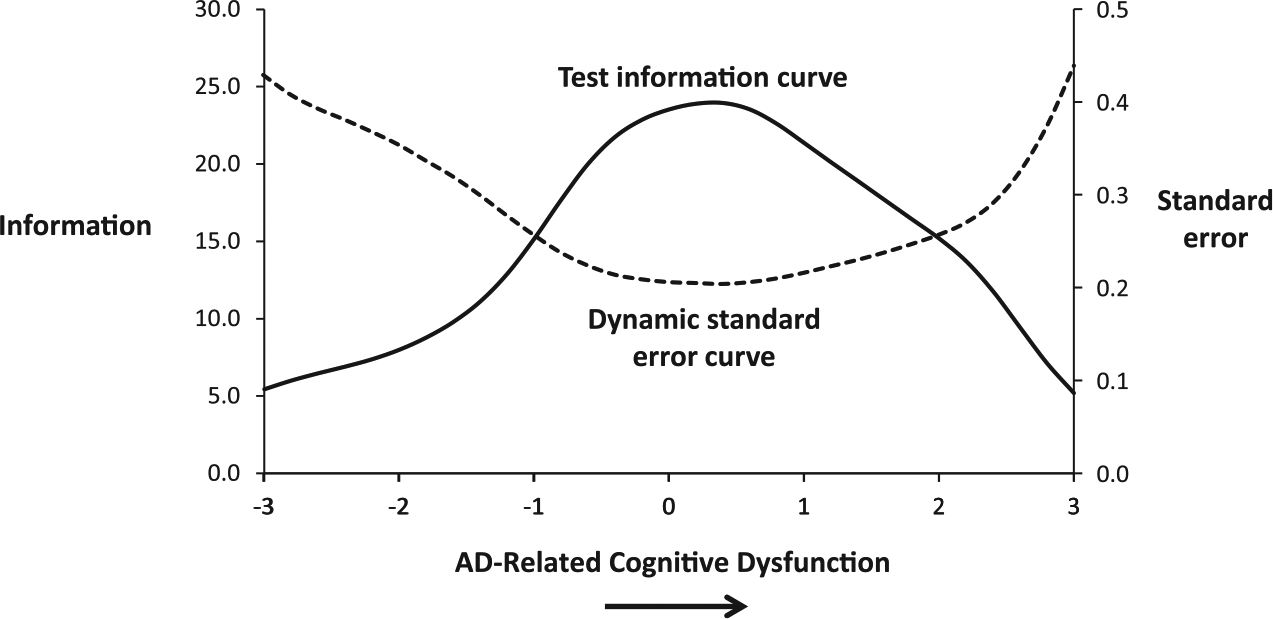
IRT reveals that test sensitivity and reliability varies as a function of a participants standing along the latent continuum.
As has been illustrated, the standard error curve is inversely related to the information curve. In turn, standard error decreases around the range of disease severity where information is highest. This is the stage where changes in scores most accurately capture differences between individuals. Therefore, if two individuals had estimated true scores of −3.0 and −2.0, the differences between those individuals would be less certain than if two individuals had −0.5 and 0.5 estimated true scores because the measure has less precision at the mild range than at the midrange of severity. In the midrange of severity, we have the greatest precision of estimate and can be more certain about the relevant differences between two individuals. This same inverse relationship can be observed when considering intrapersonal data as well. If a person has −2.0 degrees of AD-related cognitive dysfunction, takes medication, and then demonstrates −3.0 degrees of AD-related cognitive dysfunction, then, we are less certain about this improvement in the mild ranges of severity than we would be about improvement occurring in the midrange (e.g., from 0.5 to −0.5). Thus, using IRT to capture standard error of particular scores is critical to being able to precisely assess change. The ripple effects of being able to more precisely assess change could lead to potentially profound differences for recruitment in trials, matching of groups, and the sample sizes necessary to detect meaningful differences.
Several studies have used response patterns and standard error curves to detect change in clinical trials of AD measurement. One recent study (Verma, Beretvas, Pascual, Masdeu, & Markey, 2015) compared typical scoring with IRT scoring for detecting change on the ADAS-Cog (Rosen et al., 1984), a measure designed to assess cognitive dysfunction in AD and commonly used in clinical trials of the disease. Results revealed that the IRT approach produced higher sensitivity than the typical scoring approach in detecting a response to medical treatment (Verma et al., 2015). Another study compared typical scoring with IRT scoring for detecting change in response to AD medications on a functional report measure (Ard, Galasko, & Edland, 2013). Results from this study demonstrated the same pattern of results—IRT scoring resulted in improved sensitivity to change compared with standard scoring.
Test Development
An IRT Approach to Evaluating Tests of AD
In the previous section, we discussed how IRT-based scoring can be used to increase measurement precision when assessing various indicators of AD. Another use of IRT is to develop and evaluate tests that capture a specific range of the disease continuum. In AD, disease manifestations can range from “unnoticeable/preclinical” on cognitive tests to “high levels of impairment.” As such, having tests that can assess the disease at different places on the continuum can help researchers tailor assessments to minimize extraneous/redundant and insensitive items while also allowing for comparisons of subjects with a high degree of precision across the disease spectrum. Figure 1 illustrates an IRT conceptualization of this problem. The information function in this figure illustrates a measure that does a relatively good job of indicating the disease in the moderate range of disease severity but not at the mild range of disease severity. Armed with such knowledge, tests can be developed that optimally measure the disease across the continuity of disease severity. One can determine whether an AD test is effective at measuring the disease across the continuum, and then use this information to improve the measure by adding or adapting items to better assess the disease across key stages.
Our research group has taken this approach to examine the ADAS-Cog (Rosen et al., 1984), described earlier. We found that the measure did a relatively poor job of quantifying cognitive dysfunction across the dementia continuum. In particular, results indicated that the ADAS-Cog subscales measure AD-related cognitive dysfunction best at moderate levels of impairment. Of the three main cognitive domains (memory, language, and praxis), only performance on the memory subscales discriminated adequately at lower levels of cognitive dysfunction. Performance on the word recall test was sensitive to milder levels of impairment, whereas performance on the instructions recall test was not affected until more severe stages of cognitive dysfunction (Benge et al., 2009). Although the finding that memory, a common core feature of AD, is impaired at relatively mild stages of cognitive dysfunction is an intuitive finding, the fact that no other subscales of the ADAS-Cog were similarly sensitive at mild stages of cognitive decline may make it difficult to use this measure for early detection or tracking change in the disease early in its course. One solution is to add more sensitive memory tasks (such as delayed free recall) to the test. An IRT study was designed to test this hypothesis (Lowe, Balsis, Benge, & Doody, 2015) and demonstrated that indeed, simple and time efficient test additions such as delayed free recall improve the sensitivity of the measure and increase the information provided early in the disease course. Exploring the relative sensitivity of different markers across the range of severity may also allow for comparison of other (noncognitive) abilities or other sources of data (neural and physiological) that might change early in the course of AD and improve the psychometric properties of the assessment as a whole.
Making Measures Briefer
Brief measures are important for many reasons. First, individuals with cognitive impairment can have difficulties tolerating long assessment procedures, especially (in our clinical experience) when they are aware of how much difficulty they are having. Second, time truly is money in both clinical and research settings, so abbreviated measures are attractive in terms of cost-savings. Finally, while CTT approaches to test design typically focus on increasing scale length to improve reliability and reduce error, IRT approaches emphasize that using a few items at the correct stage of the disease can give comparable, if not better, reliability and standard error estimates.
To this end, there have been numerous studies that have used IRT analyses to shorten neuropsychological tests. For example, Graves, Bezeau, Fogarty, and Blair (2004) developed two psychometrically equivalent short forms of the Boston Naming Test (BNT; Goodglass, Kaplan, & Weintraub, 1983) by applying IRT to data from 206 elderly outpatients, 69 of whom were diagnosed with mild AD alone or in combination with vascular dementia (VD). Both the full-length 60-item version and 30-item short version identified 44% of AD/VD patients as abnormal, whereas the 15-item short form identified 48% of the AD/VD patients as abnormal. A similar approach was used to develop a short form of Benton’s Judgment of Line Orientation (Calamia, Markon, Denburg, & Tranel, 2011), which cuts the number of items needed to be administered while identifying impairments at the same rate. The effectiveness of this approach was replicated across samples of neurological patients and healthy controls, demonstrating the utility of IRT for adapting existing neuropsychological assessment tools.
Another example of the successful use of IRT to shorten cognitive measures comes from Lindeboom, Schmand, Holman, De Haan, and Vermeulen’s (2004) work with the Cambridge Cognitive Examination. As was cogently argued by the authors, three distinct problems emerge from traditional (i.e., sum the correct items) scoring of neuropsychological measures. First, summing individual item responses to create a score creates interval data, rather than truly continuous responses where the distance between two points can be directly compared. Second, the clinical meaning of a score cannot be judged with precision, as any number of items with varying relationships to the underlying construct is summed together. Third, the practicality of administering a large group of items to individuals who are impaired is questionable. As such, the authors applied IRT to the Cambridge Cognitive Examination scales in 511 community dwelling individuals and 350 individuals with cognitive problems. Their analyses demonstrated that individual items performed differently across the underlying cognitive dysfunction dimension, but subscales of varying complexity and length could be created with equal psychometric performance to the parent scale.
In a similar vein, Mungas and Reed (2000) demonstrated that several commonly used cognitive screening instruments had poor linearity in terms of their underlying scores. However, when combining individual items from these scales, a briefer measure with higher reliability and sensitivity to impairments across the disease spectrum was created. In subsequent work, they (Mungas, Reed, & Kramer, 2003) demonstrated that IRT applications to scoring an abbreviated battery of neuropsychological measures could create domain-level subscales that were sensitive and linear measures across the spectrum of cognitive severity. Thus, they created a scoring mechanism that is both brief and allows for accurate tracking of disease progression over time.
Similarly, IRT methods may help reduce heterogeneity in clinical trials of AD medications. For example, if a trial is being designed to look at the effects of a treatment in early AD, tests can be utilized and developed which select for individuals with only mild impairments. An information curve positioned to the left of the continuum would be best used to identify those with lower levels of disease severity and one positioned to the right would be best used to capture more significant disease severity. Given the high precision of measurement at this end of the scale, heterogeneity in the sample could be reduced.
What is important to note is that there are IRT methods that can be used to identify optimally functioning items for a particular measurement purpose, such as identifying very low levels of disease severity. These methods can be applied to a variety of neurocognitive measures that are used to screen for AD, and they can be applied even when the disease is indexed using measures from separate modalities, so long as indicators from these different modalities reflect a coherent and common disease process.
Computerized Adaptive Testing
In educational contexts, Computerized Adaptive Testing (CAT) has emerged as a very useful way of harnessing IRT’s various properties. CAT takes advantage of large item pools with known difficulty, discrimination, and error properties. An individual is presented with an item of mid-level difficulty, and depending on the accuracy of his or her response, subsequent items are presented that are either easier or more difficult in an iterative fashion with the ultimate goal of presenting as few items as possible to measure the individual’s abilities level fairly, precisely, and efficiently. While CAT techniques are now commonly used in educational testing situations, they have made their way into clinical assessment applications more slowly. Specifically, recent efforts sponsored by the National Institutes of Health (NIH) have begun to bring these techniques into the mainstream of clinical practice and trial work.
One particular advantage of CAT is the ability to administer assessments over the Internet or via an app, oftentimes with direct reporting into the electronic medical record of individuals engaged in studies. Psychometric properties of CAT suggest that many subscales can be measured in the same psychometric precision with 4 to 12 items administered as opposed to lengthier fixed paper-and-pencil scales. While not robustly applied to AD assessment to date, these tools can also be designed to be administered in both self and collateral report formats, which may allow them to be used at later stages of AD, thereby increasing their use across the disease spectrum. This approach has recently been established with other neurodegenerative and dementing illnesses, such as Huntington’s disease (Carlozzi et al., 2014).
In terms of cognitive assessment, the recently developed NIH toolbox (www.nihtoolbox.org) used CAT to create one of the core measures, a measure of picture vocabulary. In an iPad-administered format, the test asks individuals to select the picture that matches an orally presented word from an array of four possible responses. Similar clinician administered tests, such as the Peabody Picture Vocabulary Test (Dunn & Dunn, 2007), can take 20 minutes to complete as a prolonged series of floor and ceiling levels of performance are established. In contrast, the NIH CAT vocabulary task is estimated to take just 4 minutes and has similar psychometric properties to the traditional measures (Gershon et al., 2014). Although this measure has not been explicitly used in AD research as of yet, given that it is brief and contains normative data that extend to ages into the 80s, it will likely be the first foray for clinicians and researchers into CAT-informed cognitive testing in AD.
The above examples highlight how IRT-informed CAT testing may revolutionize clinical assessment of AD. Clearly, more work needs to be undertaken to optimize measures to take advantage of CAT techniques, and not all domains of assessment may lend themselves to these technologies. However, the potential to create tailored assessments that are brief, precise, and comparable across individuals and across the disease spectrum makes pursuit of these goals a worthwhile endeavor.
Cross-Validation and Test Adaptation
As noted above, IRT focuses on items, whereas CTT theories emphasize total scores (Embretson & Reise, 2000; Lord & Novick, 1968). This analysis can be extended to evaluate items for potential bias. Item bias occurs when examinees of one group are less likely to answer an item correctly (or endorse an item) than examinees of another group because of some characteristic of the test item that is unrelated or irrelevant to the test purpose or latent construct. Item bias can partially be accounted for by measuring the differential item functioning (DIF) of an individual item across groups. DIF occurs when examinees from different groups show differing probabilities of success on (or endorsing) the item after matching on the latent construct that the item is intended to measure. DIF is a necessary, but not sufficient, condition for item bias.
Cognitive screening tests and items have been found to perform differently across groups due to factors such as education, ethnicity, and race (Teresi, Kleinman, & Ocepek-Welikson, 2000). Extensive DIF across items of a measure may adversely influence the validity of test results. As cognitive screening instruments and neuropsychological tests are widely used to contribute to or support differential diagnosis of AD, the implications of invalid test results are serious. Rather than reflecting true group differences, differences in group performance may reflect item bias or a related psychometric limitation. Research regarding item bias or DIF within cognitive measures has grown over the past 20 years but is still limited (Crane, van Belle, Larson, 2004; Jahn et al., 2013). As such, further research is needed to continue to refine AD assessment resources in response to demographically diverse patient populations.
Within an IRT framework, DIF can be measured by comparing item characteristic curves (ICCs) for the same item across varying broad demographic groups, controlling for group mean differences. An ICC relates the probability of a response to an item to the individual’s standing on a latent construct (Teresi et al., 1995). Graphically, DIF is represented by a gap between the ICCs; therefore, if the ICCs are equivalent or overlap exactly, DIF is not present for that item across groups (Marshall, Mungas, Weldon, Reed, & Haan, 1997).
Various DIF analyses of cognitive instruments have been generated since the 1990s. For example, one of the most commonly studied measures, the Mini-Mental State Examination (MMSE; Folstein, Folstein, & McHugh, 1975), has been studied extensively with IRT methodology of comparing ICCs. Results from DIF analyses of the MMSE have been mixed, but with the general finding that mild to moderate DIF exists on particular items across racial and ethnic subgroups (Marshall et al., 1997; Teresi et al., 1995), language of administration (Jones, 2006; Marshall et al., 1997), sex (Jones & Gallo, 2002), and education level (Jones & Gallo, 2002; Teresi et al., 1995). Generally, DIF is observed on items such that individuals who are not White, do not speak English as a primary language, have low education, or are female tend to demonstrate lower probabilities of item endorsement. Magnitude and direction of DIF can vary across items and across studies (Edelen, Thissen, Teresi, Kleinman, & Ocepek-Welikson, 2006).
Although these results have been replicated using alternative methods of measuring DIF, such as using logistic regression or the Mantel–Haenszel approach, there are benefits to using IRT statistics in particular. First, IRT parameter estimates are not as confounded by sample characteristics (Embretson, 1996; Embretson & Reise, 2000; Lord & Novick, 1968). Second, item properties can be expressed with greater precision, thereby increasing the accuracy of interpreting DIF between two groups (Camilli & Shepard, 1994). Third, item properties can be easily expressed graphically, facilitating clearer interpretability of results (Camilli & Shepard, 1994). In addition to advantages of using IRT to evaluate DIF, there are limitations. First, very large samples, comprising upward of 250 to 500 individuals (Embretson & Reise, 2000), are needed to fit IRT curves (Crane et al., 2004). Second, continuous predictor variables, such as age and education level, must be categorized for DIF analyses within IRT (Crane et al., 2004), which can result in a loss of power. Despite these limitations, IRT methodologies for evaluating DIF are still statistically robust, precise, and comprehensive.
Aside from examining potential sources of bias, DIF analyses can be applied to facilitate test adaptation across languages (Jahn et al., 2013). As discussed previously, DIF can be observed on items when comparing different language administrations of a measure or groups of different primary-language speakers (Jones, 2006; Marshall et al., 1997). Items that demonstrate significant DIF across languages can be eliminated to reduce language–culture bias (Jahn et al., 2013; Mungas, Reed, Marshall, & González, 2000). This approach has been successfully used to adapt English versions of cognitive screeners such as the MMSE (Folstein et al., 1975) and the Montreal Cognitive Assessment (MoCA; Nasreddine et al., 2005) into Spanish (Mungas et al., 2000) and Japanese (Ideno, Takayama, Hayashi, Takagi, & Sugai, 2012). Beyond neurocognitive screeners, neuropsychological tests of specific cognitive functions, such as expressive language, can be evaluated for DIF, as has been done to develop a Spanish short form of the BNT (Jahn et al., 2013; Kaplan, Goodglass, & Weintraub, 1983). Items demonstrating significant DIF between English and Spanish speakers were eliminated to reduce bias; this also resulted in a secondary benefit of a significantly shorter test (15 items vs. 60; Jahn et al., 2013).
Using data from the 10-study National Institute on Aging Collaborative investigation of special dementia care in institutional settings, Teresi et al. (2000) evaluated items comprising the attention subscale of a well-established dementia-rating system for the presence of DIF. In particular, they found problematic item functioning for four items, including a certain degree of measurement bias for one particular item across education-level groups. In this study, IRT procedures were used to identify a measurement problem in the assessment of a disease construct. Once identified, measurement problems of this and other types can be eliminated from screening neurocognitive instruments.
IRT analyses can also be used to confirm that translated measures are as valid as their English counterparts. In this context, validity includes measurement precision and unidimensionality (Ideno et al., 2012). ICCs can be generated for individual items or aggregates of items into domains to determine if comparable levels of information are measured in the English and translated versions of the same measure, as has been done for Taiwanese adaptations of the MoCA (Tsai et al., 2012) and Japanese adaptations of the MMSE (Ideno et al., 2012). If identical items are found to measure significantly lower levels of information pertinent to the latent construct of interest after translation, the translation may be reevaluated to preserve content validity and reliability.
Linking and Calibrating Measures
A further promising application of IRT analysis is that scores on one test can be compared with scores on another test. Once a latent variable is defined and measurement parameters have been established in a given data set (i.e., using a unidimensional or MIRT analytic framework), those data can be used to “crosswalk” to other data sets through statistical “linking and equating” methods. (Crosswalking refers to the process of equating a raw score on one measure with a raw score on a different measure.) Once a core data set is established, it becomes straightforward to index a person’s position along a single latent dimension or multiple dimensions at the same time, even in the absence of complete data, by cross-referencing items from the calibration data set. This ability to crosswalk makes valid comparisons of findings from different studies possible. A recent related study (Balsis et al., 2015) equated raw scores on different measures of cognitive dysfunction in the context of a unidimensional trait model. Clinicians and researchers who measure cognitive dysfunction to index AD often use one of three different tests, the ADAS-Cog (Rosen et al., 1984), the MMSE (Folstein et al., 1975), or the CDR-SOB (Hughes et al., 1982; Morris, 1993; O’Bryant et al., 2008). However, the use of different measures can make it difficult to compare data across patient samples or studies. Using data for 1,709 participants from the Alzheimer’s Disease Neuroimaging Initiative and IRT-based statistics, Balsis et al. (2015) applied IRT analyses to show how scores on each measure, the ADAS-Cog, the MMSE, and the CDR–SOB, correspond. This information can provide a useful tool for investigators working with these instruments or with data sets using different instruments.
An IRT-based approach provides a statistical vehicle for bridging between different measures, through reference to a common latent-variable continuum, theta. Once the information properties of the tests across the target continuum has been clearly demarcated, raw scores for these different measures can be mapped onto the ranges of theta for which they serve as indicators. While it is easy to combine data and link studies together, many studies continue to quantify constructs using only single indicators. Linking together scores from different scales through a latent variable model enables researchers to compare data for an attribute of interest across studies even though different measures of that attribute were used. The ability to make such comparisons is a particular advantage for AD researchers, who often are conducting studies across the world using different measures.
Alzheimer’s researchers are just beginning to embrace this technique of linking and equating measures. Crane et al. (2008) used IRT to co-calibrate four cognitive tests: the MMSE, the Modified Mini-Mental State (Teng & Chui, 1987), the Cognitive Abilities Screening Instrument (Teng et al., 1994), and the Community Screening Instrument for Dementia (Hall et al., 2000). With the screening measures co-calibrated, they were able to validly compare measurement properties of the measures and analyze the downstream consequences of the measures’ properties on the results of the investigation.
The Future: Modeling Multidimensionality in AD
Because AD affects an individual’s brain, thought processes, and adaptive behavior, AD researchers are challenged to combine data from neural, cognitive–psychological, and behavioral indicators of the disease. In the following section, we articulate how a novel IRT-based strategy might be used to incorporate multidomain information to better measure AD. Multidimensionality can be approached in two ways within an IRT framework. The first approach our group is developing to use IRT to identify a key latent continuum that represents the disease within one domain and model the extent to which indicators from other dimensions indicate the disease. The other approach is to use MIRT to embrace the multidimensionality in its entirety and model it in multidimensional hyperspace. We describe how these two techniques can be used to combine data from multiple domains in future AD assessment.
Using IRT to Model Multiple Dimensions of AD
Recently, there has been a push to identify objective and measurable biomarkers that indicate the presence of AD pathology. The diagnostic utility of biomarkers is mostly defined by sensitivity, specificity, and ease-of-use (Humpel, 2011). Biomarkers that have been associated with AD have been identified through analyses of cerebrospinal fluid, blood, neuroimaging data, and genomic material. Established and well-validated biomarkers of AD include the cerebrospinal proteins beta-amyloid and tau (total and phosphorylated variants), and other biomarkers continue to be evaluated for diagnostic utility (Humpel, 2011).
In an effort to understand how different biomarker variables collectively represent AD pathology, theoretical models of these variables have been proposed. Of these, the amyloid-cascade model described by Jack et al. (2010) and later updated in 2013 is currently the most widely accepted. In this model, the disease progresses in a typical manner: beta-amyloid biomarkers becoming abnormal first, before neurodegenerative biomarkers and cognitive symptoms manifest. Although this model is comprehensive, it is still theoretical in nature. IRT methodologies possibly can be used to statistically verify this model and evaluate measurement precision across different domains.
With this aim in mind, Balsis et al. (2017) analyzed data from the Alzheimer’s Disease Neuroimaging Initiative (N = 1,056), focusing on indicators from the domains of MRI volume, fluorodeoxyglucose positron emission tomography (FDG-PET) metabolic activity, cognitive performance, and adaptive function. IRT was used to quantify the latent continuum of AD-related decline. Then, through a process of statistical scaling and allowing for certain assumptions, indicators from different domains were linked to this latent continuum and compared in terms of their measurement properties. Findings indicated that indices of MRI volume, FDG-PET metabolic activity, and adaptive function added measurement precision above and beyond that provided by cognitive measures. MRI volume and FDG-PET indicators added precision in the relatively mild range of disease severity. A secondary analysis revealed a cascade of decline that dovetailed nicely with the AD model formulated by Jack et al. (2013), showing that MRI volume and FDG-PET metabolic activity become compromised in the very mild spectrum of severity, followed by cognitive performance, and finally adaptive function reflecting the expected progression from clinically normal, to mild cognitive impairment, and finally dementia. These findings provide statistically derived models of the progression of AD, and corroborate evidence from other work indicating that neurophysiological biomarkers index the disease in its mildest form, followed by the more apparent cognitive and functional impairments.
The first step was to identify a core construct of interest and establish a good fitting unidimensional measurement model, using measures (“items”) from one available mode of assessment. Specifically, a unidimensional model was defined using performance scores on tests designed to measure the following cognitive abilities: memory, language, visuospatial, and executive processes. An excellent fit was obtained for this measurement model. Having established this model, the analysis was expanded to include variables from other measurement modalities, including brain function and clinician-rated behavioral impairment (functional report). Variables from these two sources can be viewed as partially related to the core construct, and partly related to separate, nonconstruct attributes. As such, these secondary variables were used to help index the latent construct primarily defined by the four cognitive variables. The relationship among variables from the three assessment modalities as indicators of a common disease-progression dimension is depicted in IRT terms in Figure 2. The curve labeled “cognitive performance” is the test information function for the main four measured cognitive variables. This function indicates that these four variables collectively provide information about the latent construct in the moderate to severe range of the latent continuum, as indicated by the position of the curve near the moderate to severe range of the latent trait (x-axis). Adding MRI measures of regional brain volume (hippocampus, entorhinal cortex, middle temporal gyrus, and fusiform gyrus) expectedly decreased the model fit, as did adding an indicator of brain activity (FDG-PET). Adding variables related to functional report decreased the fit of the model as well.
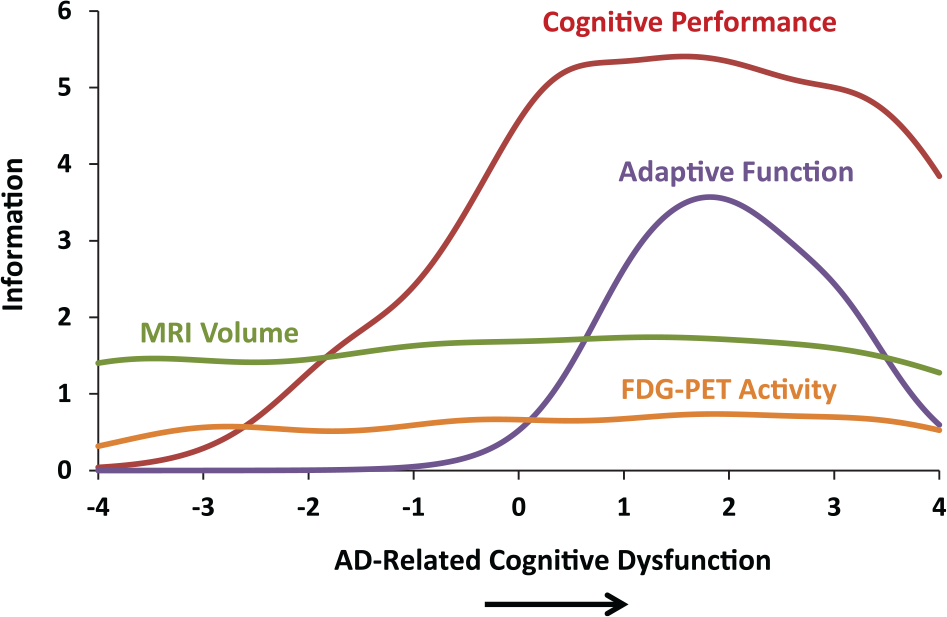
Each measurement domain provides nonredundant information which enables greater prediction for measuring the entirety of the construct.
When the fit of a measurement model is significantly reduced by including additional indicator variables, one can consider two approaches. One is to exclude the additional variables from the analysis altogether. However, the data in Figure 2 show that such items may be able to still be used. In principle, the secondary volumetric variables used in the analysis may in fact be related to the latent construct, and if so, may provide important information for detecting and measuring relatively mild levels of disease severity. In Figure 2, the test information function for the MRI brain volume indicators adds to measurement precision everywhere along the disease continuum, as indicated by the test information function spanning the entire range of the latent construct. As such, these brain volume indicators enhance the ability to understand the construct across disease continuum. In sum, despite the fact that the fit of a unidimensional model for the entire set of variables in this illustration was weaker than it was for the cognitive variables alone, it was nonetheless possible to gain meaningful information from all of the variables using variables across assessment modalities. Of note, the data shown in Figure 2 indicate that decrements in brain volume may reveal the initial signs of AD pathology well before (i.e., 2 standard deviations below) the point at which cognitive tests index disease-related dysfunction; the brain pathology precedes the apparent clinical manifestations of the disease.
Figures 2 illustrates how variables that reduce the fit of a measurement model can be used as additional indicators of a construct defined by other variables. Depending on the question and the assumptions made, researchers may need not relegate slightly misfitting indicator variables to the role of extraneous markers. These variables may be helpful to refine our understanding of the construct at hand. This also can be accomplished within MIRT models or structural equation bifactor models, which we discuss next.
Using MIRT to Model Multiple Dimensions of AD
As a complement to the above described scaling approach, a MIRT modeling approach can be used to delineate a core latent dimension along with secondary dimensions reflecting domain-specific covariance. While there do not appear to be any published studies of MIRT analyses of AD assessment or measurement, the theoretical foundation of MIRT seems fitting for this context. Notably, this approach more precisely defines the latent variable in question because it coalesces systematic variance in common among different groups of theoretically relevant indicators. A model of this kind provides for simultaneous estimation of the degree to which any single variable indexes two latent dimensions: the main dimension of interest, which cuts across domains, and a narrower dimension reflecting the variable’s specific domain of measurement. This type of model can also be represented as a bifactor model (see Figure 3).
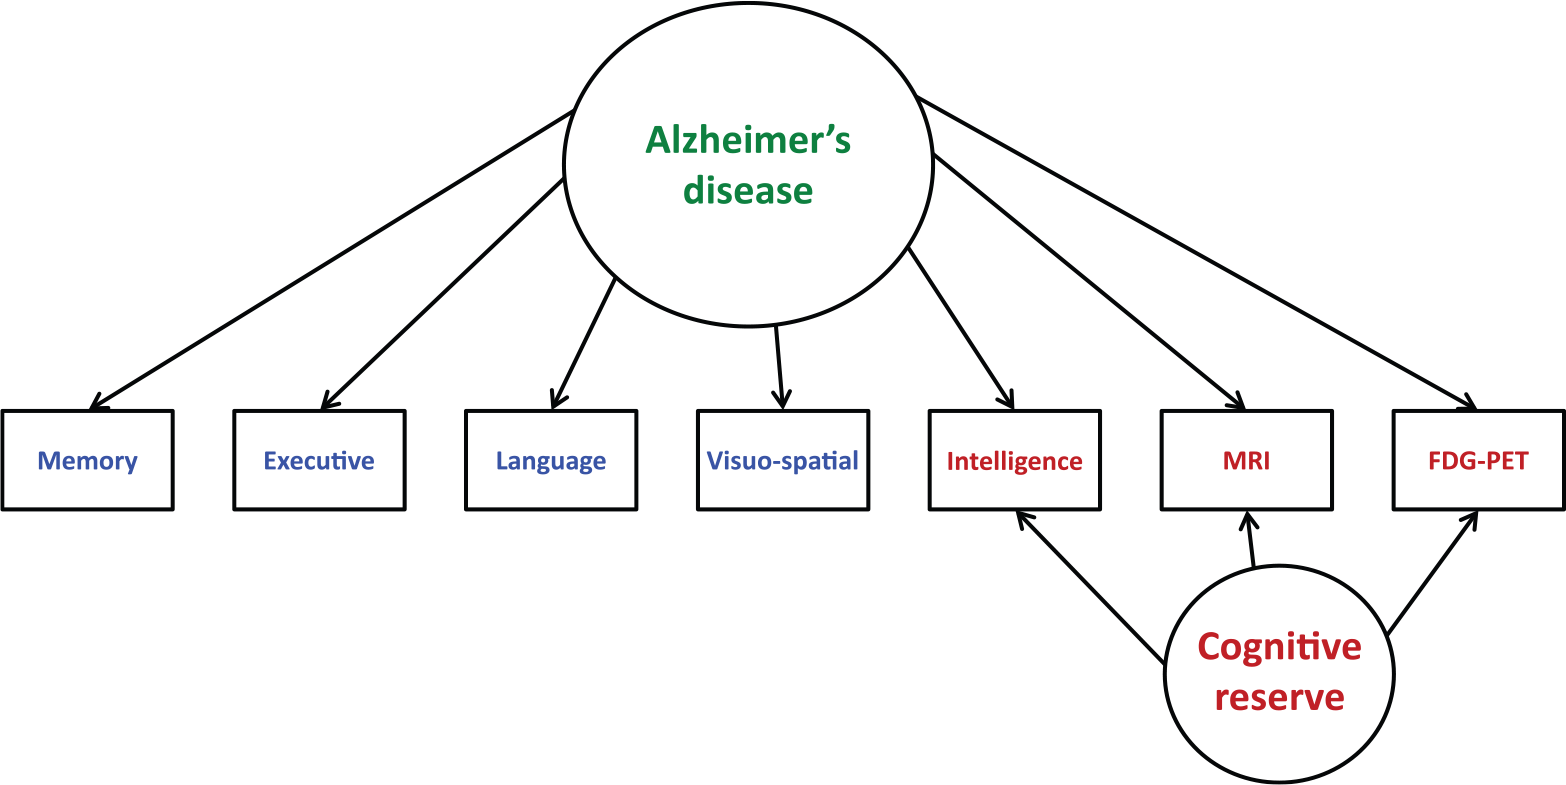
SEM bifactor model of Alzheimer’s disease represented across domains.
The structural equation bifactor model in Figure 3 also can be represented in MIRT terms. MIRT permits psychological constructs to be examined along one dimension while accounting for or controlling for the influence of measurement factors on other dimensions, through specification of test characteristic surfaces (in place of test characteristic curves), and information surfaces (in place of information curves). As a hypothetical example of this, Figure 4 represents in three-dimensional space the model depicted in Figure 3. Within this three-dimensional cubic figure, two of the axes define the latent dimensions of interest and the third defines the probability that a particular item is scored. The figure shows that the probability that a person exhibits dysfunctional behavior is determined by both the presence of the disease and general (premorbid) neural integrity, which might represent cognitive or neural reserve. Cognitive reserve is a key concept in compensatory models of brain function and refers to a person’s resilience to neuropathological damage. The brains of certain people contain enough complexity to optimize performance through the differential recruitment of certain brain networks resulting in adaptive cognitive strategies, despite the presence of a degenerative disease or another disease concept. Consequently, two people can have the same amount of AD, yet show different performance scores on cognitive tests because one has more cognitive or neural reserve than the other. In Figure 4, one can see hypothetically that cognitive reserve allows functioning to be maintained up to a point where the disease process is so severe that these compensatory mechanisms break down and function is impaired. In this way, MIRT may help clarify the theoretical nature of a measured phenomenon—in this case, dysfunction associated with AD, which is shown to involve both the presence of the disease (theta 1) and variations in general cognitive reserve (theta 2).
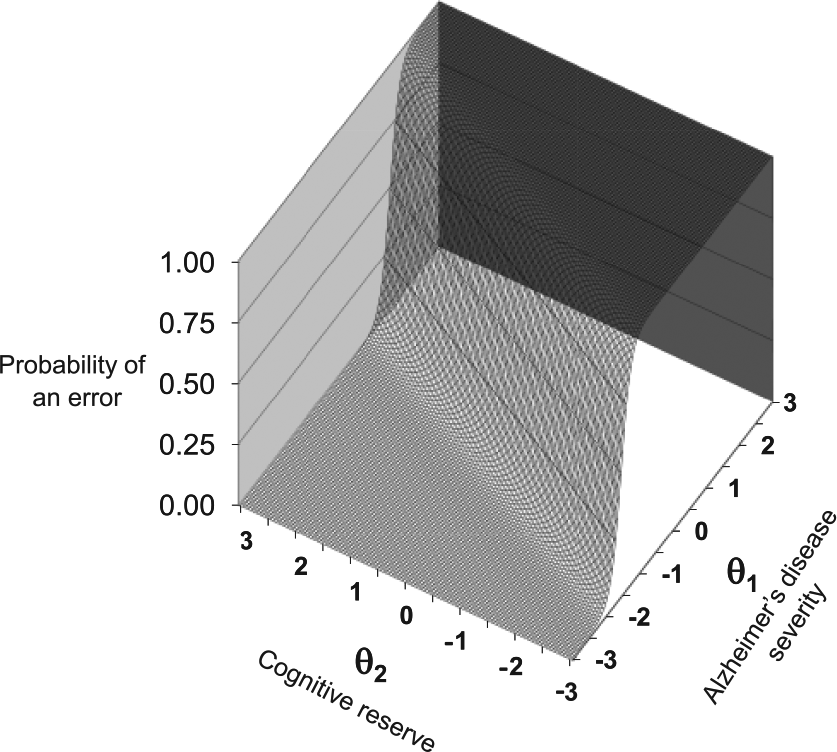
Cognitive reserve masks the impact of Alzheimer’s disease, hypothetical model.
Conclusion
AD is a common and severe condition that affects the brain, cognition, and behavior. It is defined by plaques and tangles that have a cascade of effects: neuropathological, neurochemical, neurocognitive, neuropsychiatric, and functional. Because of the many effects of the disease, it presents a complex set of assessment problems. We described how IRT approaches can and have been used to address important assessment issues, such as reducing measurement error and increasing information yield. We also described how IRT and MIRT can be used in the future to more comprehensively and cohesively assess the multidimensional nature of the disease.
The clinical implications of using IRT principles to adapt existing instruments, as well as to develop new methods for measuring AD are numerous. For example, IRT can be used to create streamlined, efficient assessments without sacrificing reliability or validity. Also, IRT can be used to adapt existing instruments for diverse populations by eliminating test bias, thereby increasing the utility of these measures. Additionally, IRT can be used to generate more precise quantitative models of AD pathology and progression, leading to more accurate characterization of severity or staging. Together, all of these advances could lead to earlier and more accurate diagnosis, more efficient and tailored assessments, and ultimately, better informed treatment planning. Currently, IRT-informed clinical assessment is still in the relatively nascent stages of study and practice. We hope that we have been able to articulate how IRT has been used thus far to answer important theoretical and practical clinical assessment questions and how it might be used in the near future to improve clinical practice in the assessment and treatment of AD.
Footnotes
Declaration of Conflicting Interests
The author(s) declared no potential conflicts of interest with respect to the research, authorship, and/or publication of this article.
Funding
The author(s) received no financial support for the research, authorship, and/or publication of this article.
Supplementary Material
Supplementary material is available for this article online.
References
Supplementary Material
Please find the following supplemental material available below.
For Open Access articles published under a Creative Commons License, all supplemental material carries the same license as the article it is associated with.
For non-Open Access articles published, all supplemental material carries a non-exclusive license, and permission requests for re-use of supplemental material or any part of supplemental material shall be sent directly to the copyright owner as specified in the copyright notice associated with the article.