
Abstract
Ziyuan3-01 and Ziyuan3-02, Chinese civilian high-resolution stereo mapping satellites, were designed to satisfy the requirements of 1:50,000 digital topographical mapping. Platform vibration detection plays an important role in the Ziyuan3 satellite project. Various methods have been used to detect the vibration of Ziyuan3-01, but none focuses on that the vibration frequency is not a fixed value. To detect and model the vibration, this study proposes a method based on a set of raw gyroscope data to detect long-term vibration and model it with considering frequency changing. Two experiments were conducted, and the results showed that (a) the proposed method can detect the long-term vibration frequency and model it; (b) there is a same vibration frequency of approximately 0.65 Hz in the Ziyuan3-01 and Ziyuan3-02; (c) the 0.65 Hz vibration suffered by the Ziyuan3 satellite series is not a fixed value, varying from 0.59 Hz to 0.7 Hz, and the period of the vibration change is a constant value of approximately 1 year, which we modeled with a sine function; and (d) the working state of loads on the platform, such as solar panels, has an influence on the vibration frequency certainly.
Keywords
1. Introduction
A stable platform is essential for high-resolution Earth observation satellites (HREOSs) to obtain high-accuracy geospatial image products. However, HREOSs always suffer from vibration, which considerably influences geolocation accuracy when it exceeds a particular threshold. Vibration may be caused by operating loads on the platform, including such devices as control moment gyroscopes (CMGs), momentum wheels, and solar panels (Zine, 2017; Zine and Salah, 2013, 2018). Orbiting satellites are also influenced by the space environment, such as solar radiation pressure and the Earth’s gravity (Amberg et al., 2013; Johnston and Thornton, 2000; Tong et al., 2014). Therefore, satellite platform vibration detection is an important area of HREOS research.
Vibration detected among various satellites.
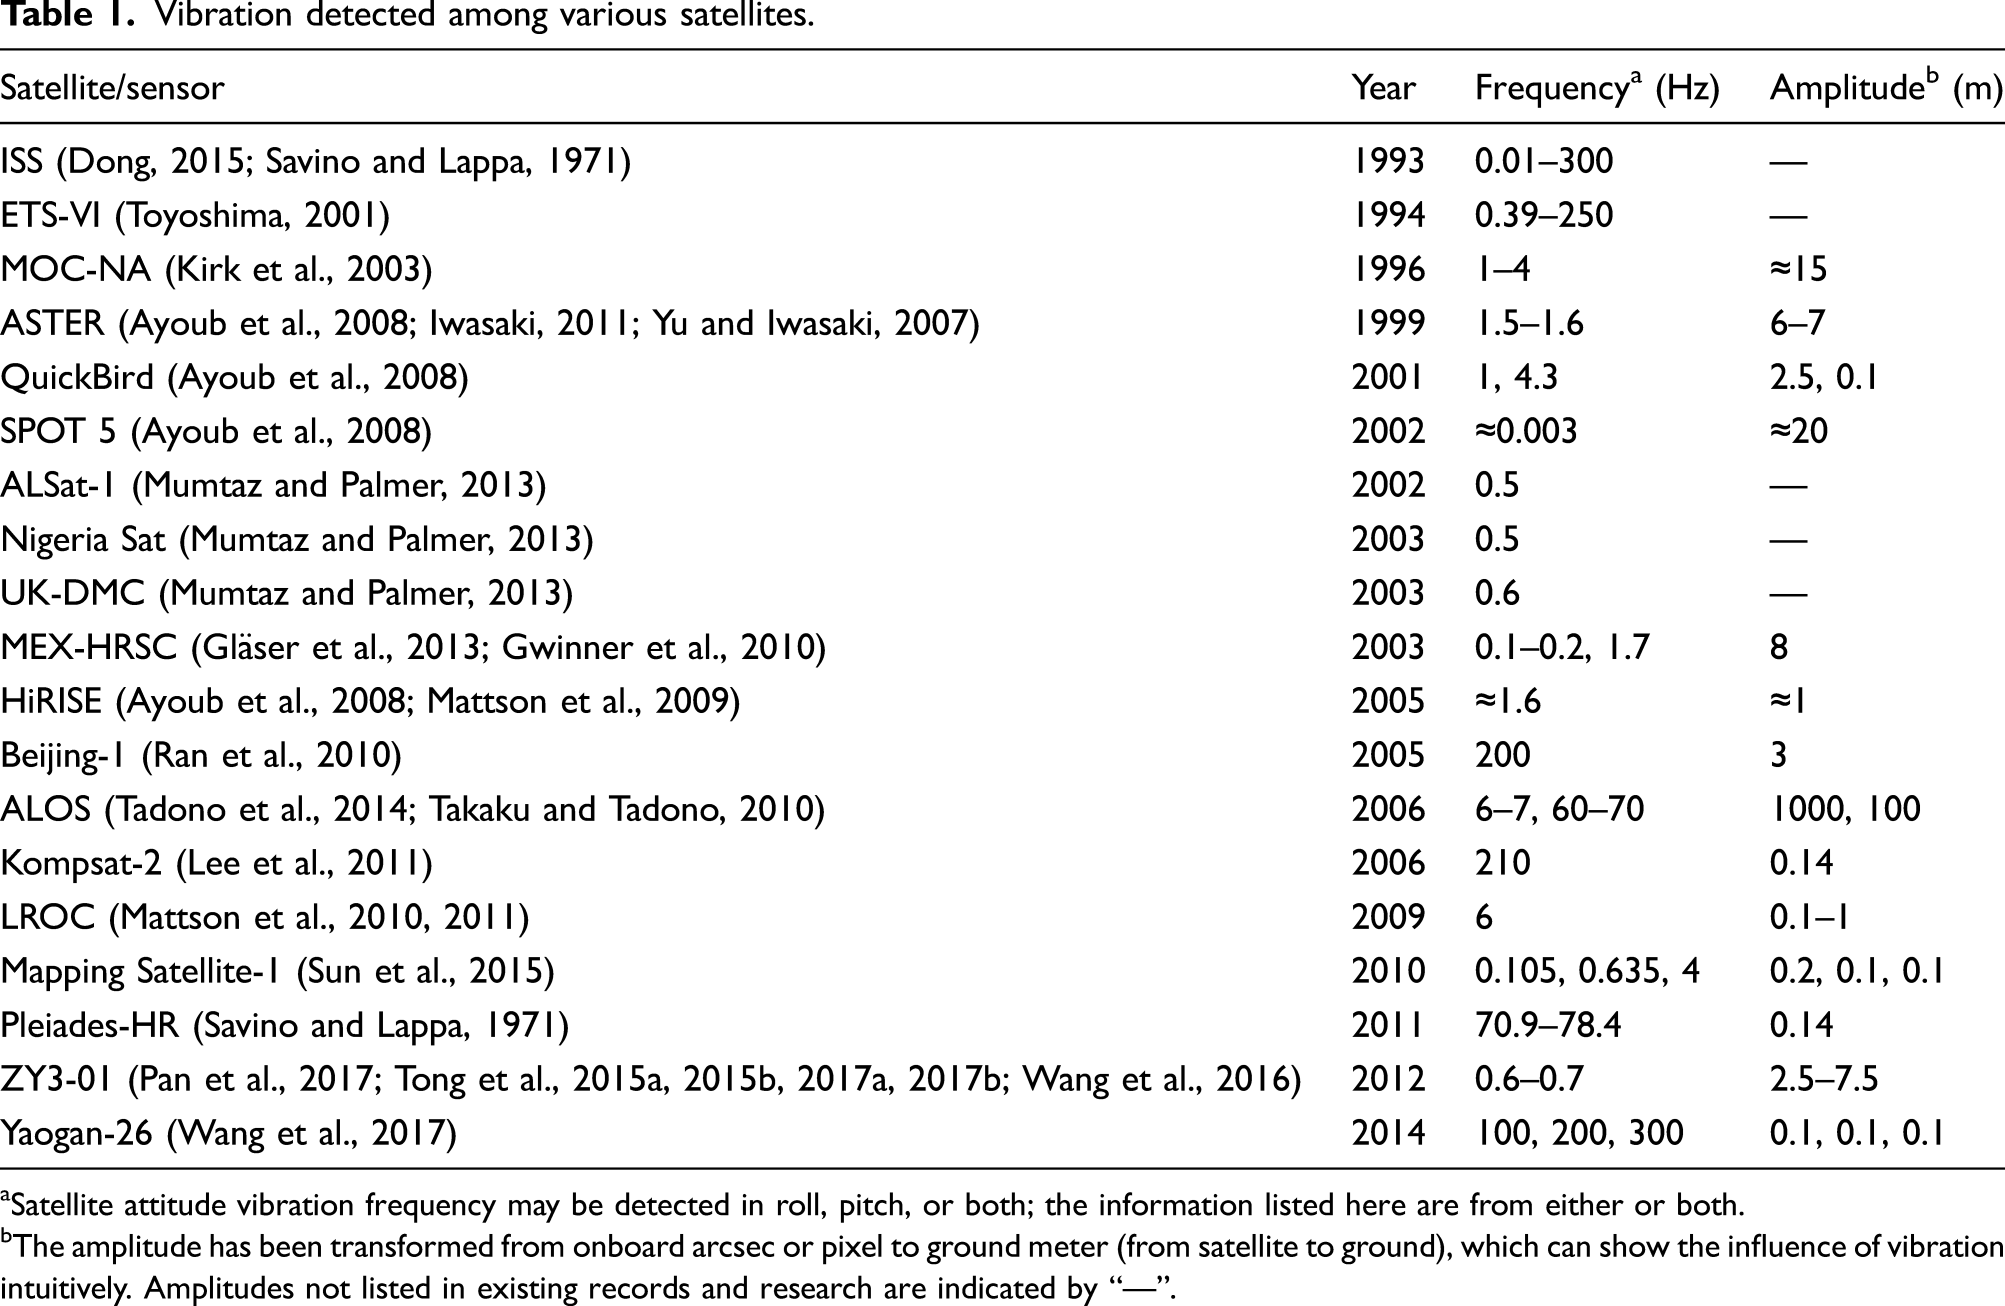
Satellite attitude vibration frequency may be detected in roll, pitch, or both; the information listed here are from either or both.
The amplitude has been transformed from onboard arcsec or pixel to ground meter (from satellite to ground), which can show the influence of vibration intuitively. Amplitudes not listed in existing records and research are indicated by “—”.
Table 1 includes the current primary vibration detection results in this area of study. Three conclusions may be drawn as follows: (1) Vibration exists in nearly every satellite platform, although the frequencies and amplitudes vary from one platform to another. (2) A satellite platform is not stable during the initial stage following launch, resulting in a large amplitude and unstable frequency. Following this initial stage, amplitude and frequency tend to stabilize around a particular value within a small range. (3) Vibration influences the product accuracy of satellite loads if it becomes sufficiently large, especially for HREOSs.
Traditional platform vibration can be expressed as follows
The Ziyuan3-01 (ZY3-01) satellite, launched on 9 January 2012 is China’s first civilian stereo surveying and mapping satellite and is part of the Ziyuan3 (ZY3) satellite series. Ziyuan3-02 (ZY3-02), launched on 30 May 2016 was the second satellite in the series (Xie et al., 2017). Most of the loads in ZY3-02 are identical to those in ZY3-01, and both satellites use the same platform. The vibration detected in ZY3-01 generally had a frequency of approximately 0.65 Hz, with an amplitude that gradually diminished and stabilized.
In fact, we found that vibration frequency was constantly changing when we processed the ZY3 satellite’s products, with this frequency change continuing through the entire life cycle of the satellite. That means the traditional satellite platform vibration model should be improved, and it is not a single sine function. This change adds indeterminacy to the platform vibration detection, thereby making it more difficult to correct the vibration and improve the satellite products. There have been no existing investigations of this frequency change phenomenon, either in ZY3-01 or in any other satellites. To detect and model the vibration frequency changes of the ZY3 satellite series, this study proposes a satellite platform vibration detection and vibration frequency change modeling strategy using ZY3 satellite series long-term raw gyroscope data. The proposed method takes advantage of the high precision and continuity of gyroscope data because the gyroscopes in the satellite run continuously and provide a rich source of data.
2. Study data
The ZY3 attitude measurement hardware system includes three star trackers and four groups of gyroscopes, each group consisting of three orthogonal gyroscopes. The star trackers measure the absolute attitude of the satellite platform, each measurement of which is discrete. The gyroscopes acquire the relative attitude, and the continuous gyroscope data show the angular changes of the platform. The installment schematic of the star trackers and gyroscopes is illustrated in Figure 1. Installment schematic of the Ziyuan3 satellite series. (a) Three star trackers and (b) four groups of three orthogonal gyroscopes.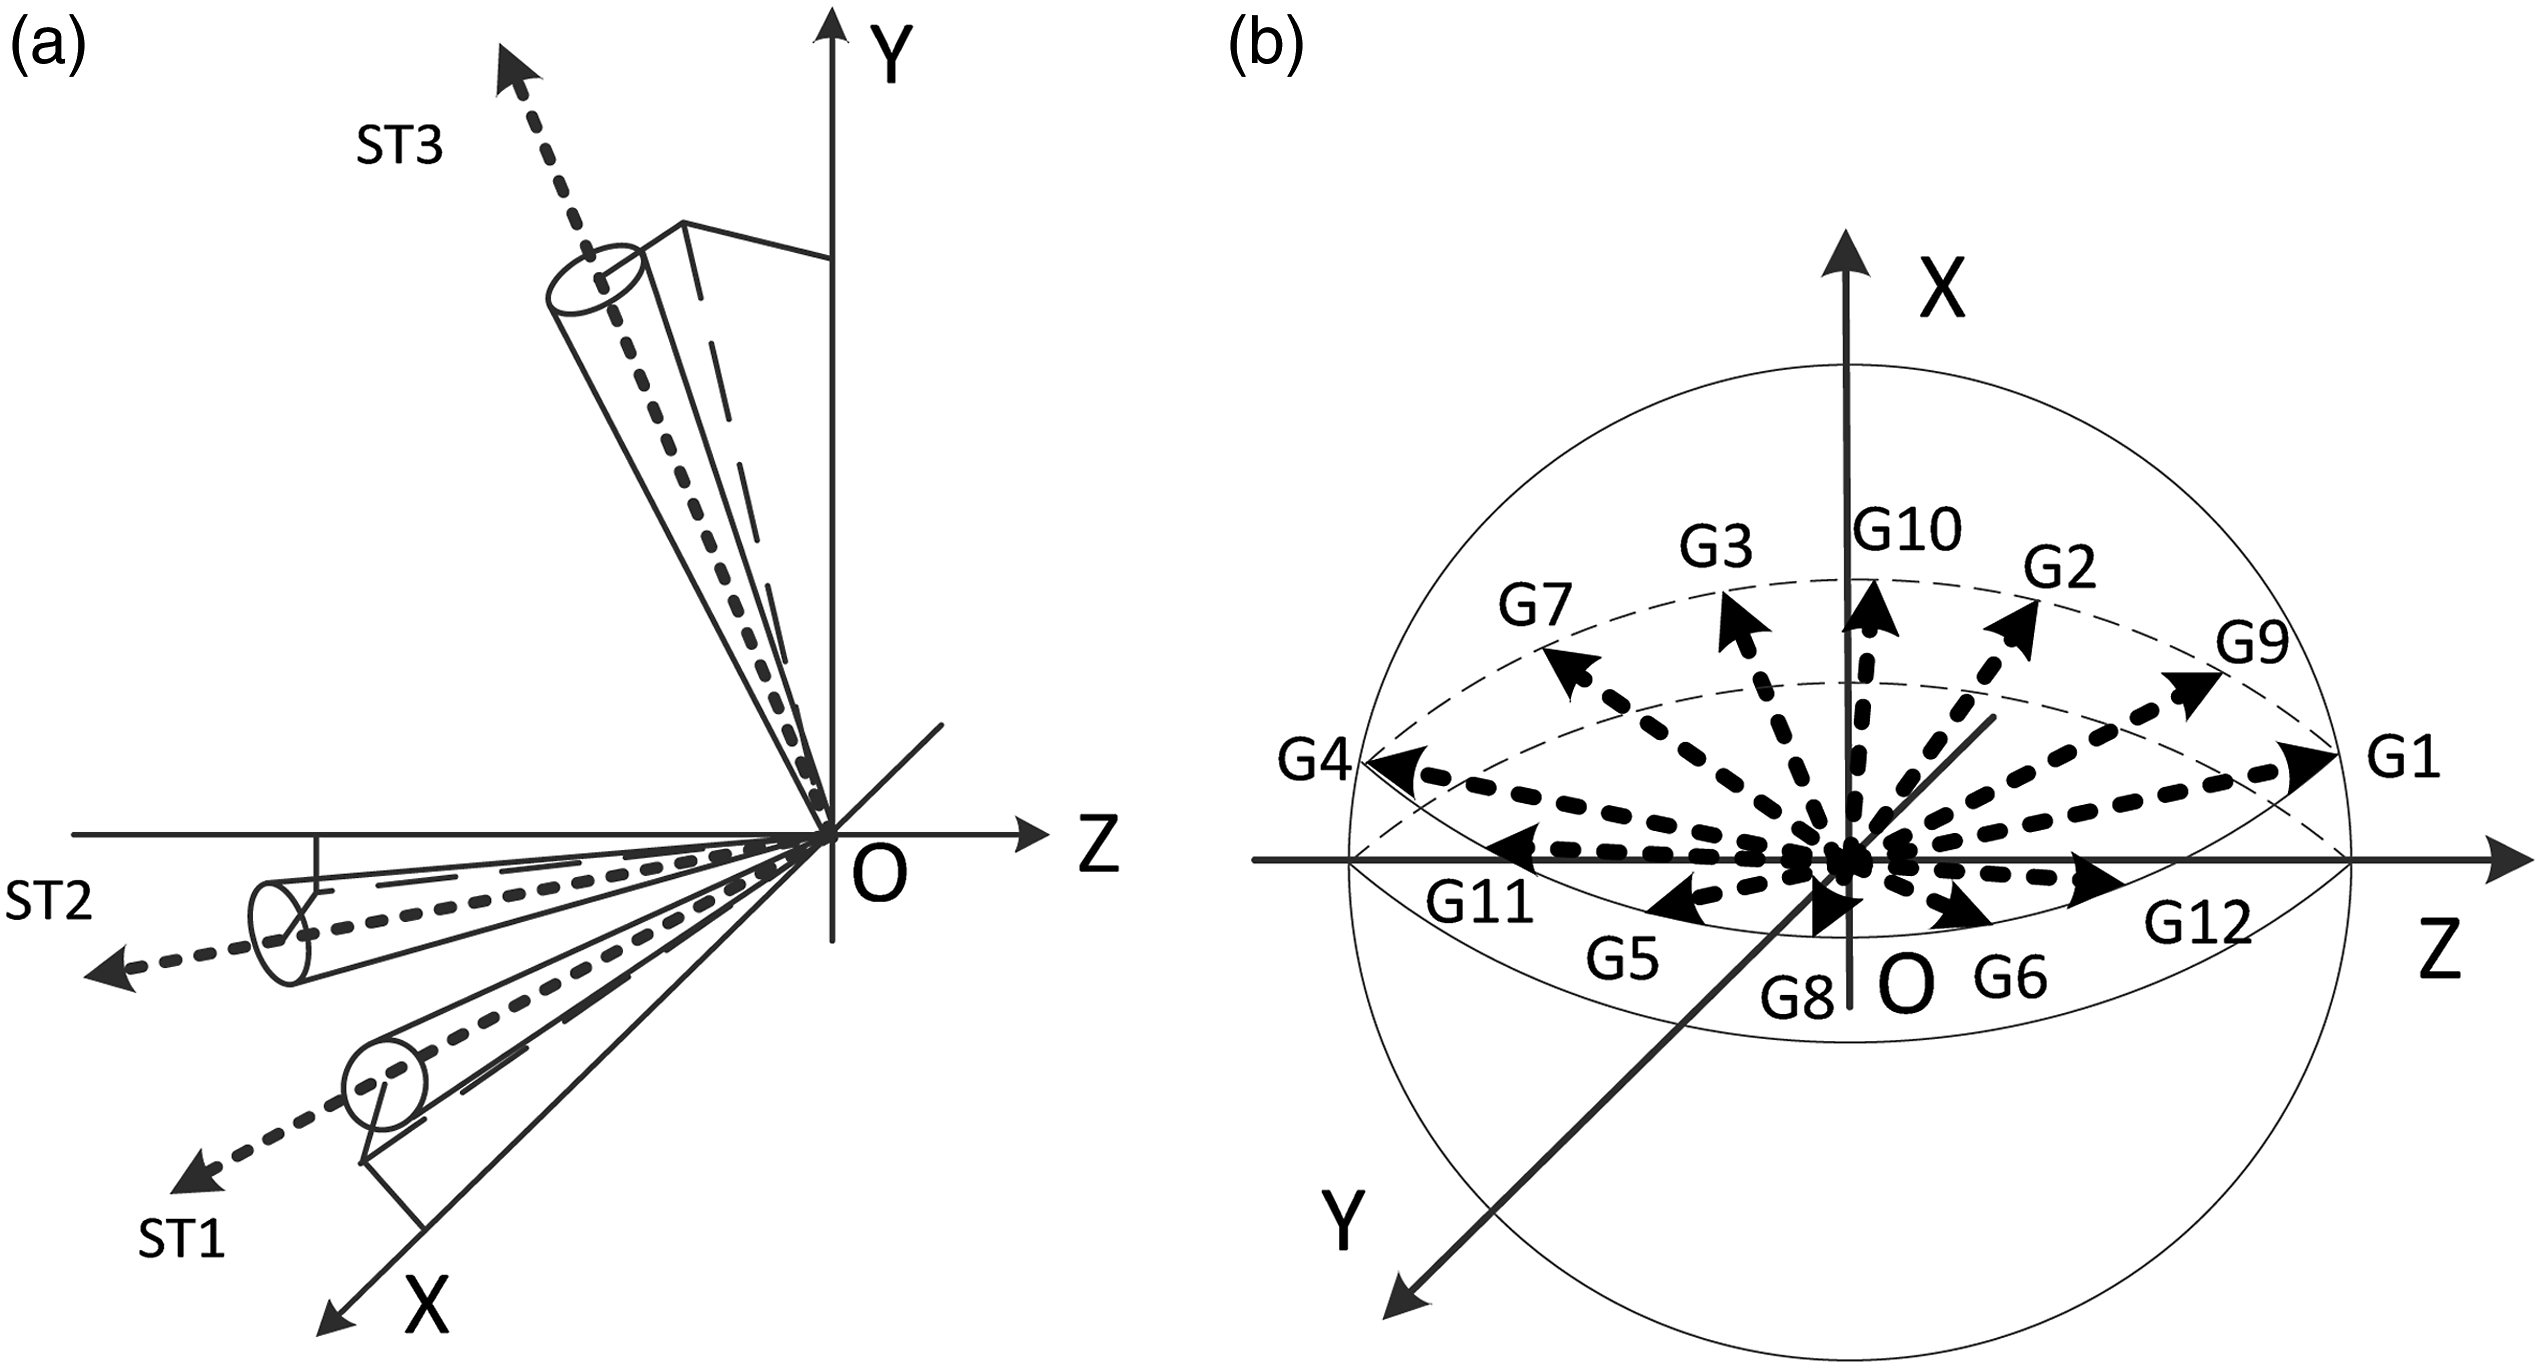
As shown in Figure 1(a), O-XYZ is the satellite body coordinate system, and the three star trackers (ST1, ST2, and ST3) are installed on the platform with the relative relationship illustrated in the schematic. ST1 is an active pixel sensors (APS), which is a back-up test load. ST2 and ST3 are ASTRO 10, which operate and provide data for attitude determination. There are 12 gyros (4 groups of 3) installed on the ZY3-01 platform. As seen in Figure 1(b), the first group consists of G1, G3, and G5; the second has G2, G4, and G6; the third includes G7, G8, and G9; and the fourth consists of G10, G11, and G12. The first and second groups are made up of three 3-floated gyroscopes, the third group includes three 2-floated gyros, and the fourth group includes three fiber-optic gyroscopes. The 12 gyroscopes are distributed in a divergent shape, with the three in each group aligned orthogonally.
ZY3-01 has been orbiting for approximately 7 years and has acquired more than 12,000 data tracks. ZY3-02 has been aloft for approximately 3 years and has obtained more than 3000 data tracks. Given that there is such a large amount of satellite transmission data, we store historical data in disk arrays. To detect the platform vibration and vibration frequency changes of the ZY3 satellite series, we selected a large amount of gyroscope data spread evenly overtime. Approximately 2400 tracks of ZY3-01 gyroscope data and 2100 tracks of ZY3-02 gyroscope data were used as test data. Because the preparation of ZY3-01 gyroscope data is extremely tedious, we selected them among disk arrays on a tape drive, applying 1 data track per day. As the ZY3-02 gyroscope data were collected ever since the satellite was launched in 2016 up to the present, we used 3 data tracks per day. Given that the primary mission of the ZY3 satellite series is to acquire a 1:50,000 digital topographical map of China, the test data mainly focus on areas in and around China. This means that there is not large variation in latitude among the test data, which may decrease the influence of latitude in our findings.
There are four groups of gyroscopes on-board ZY3-01 and ZY3-02. Not all of them are activated, and only a single group is actually used to determine the attitude. In addition, a certain group is activated to serve as a back-up. G1, G3, G5, G7, G8, G10, G11, and G12 of ZY3-01 were functional before 15 October 2015. However, only G1, G3, G5, G7, and G8 were working after 15 October 2015. This was because of a problem with one side of the solar panels that occurred on that day, resulting in a lower supply of power. To ensure that the satellite would continue to function normally, G10, G11, and G12 were turned off. G1, G3, G5, G7, and G8 on ZY3-02 have been working continuously up to the present.
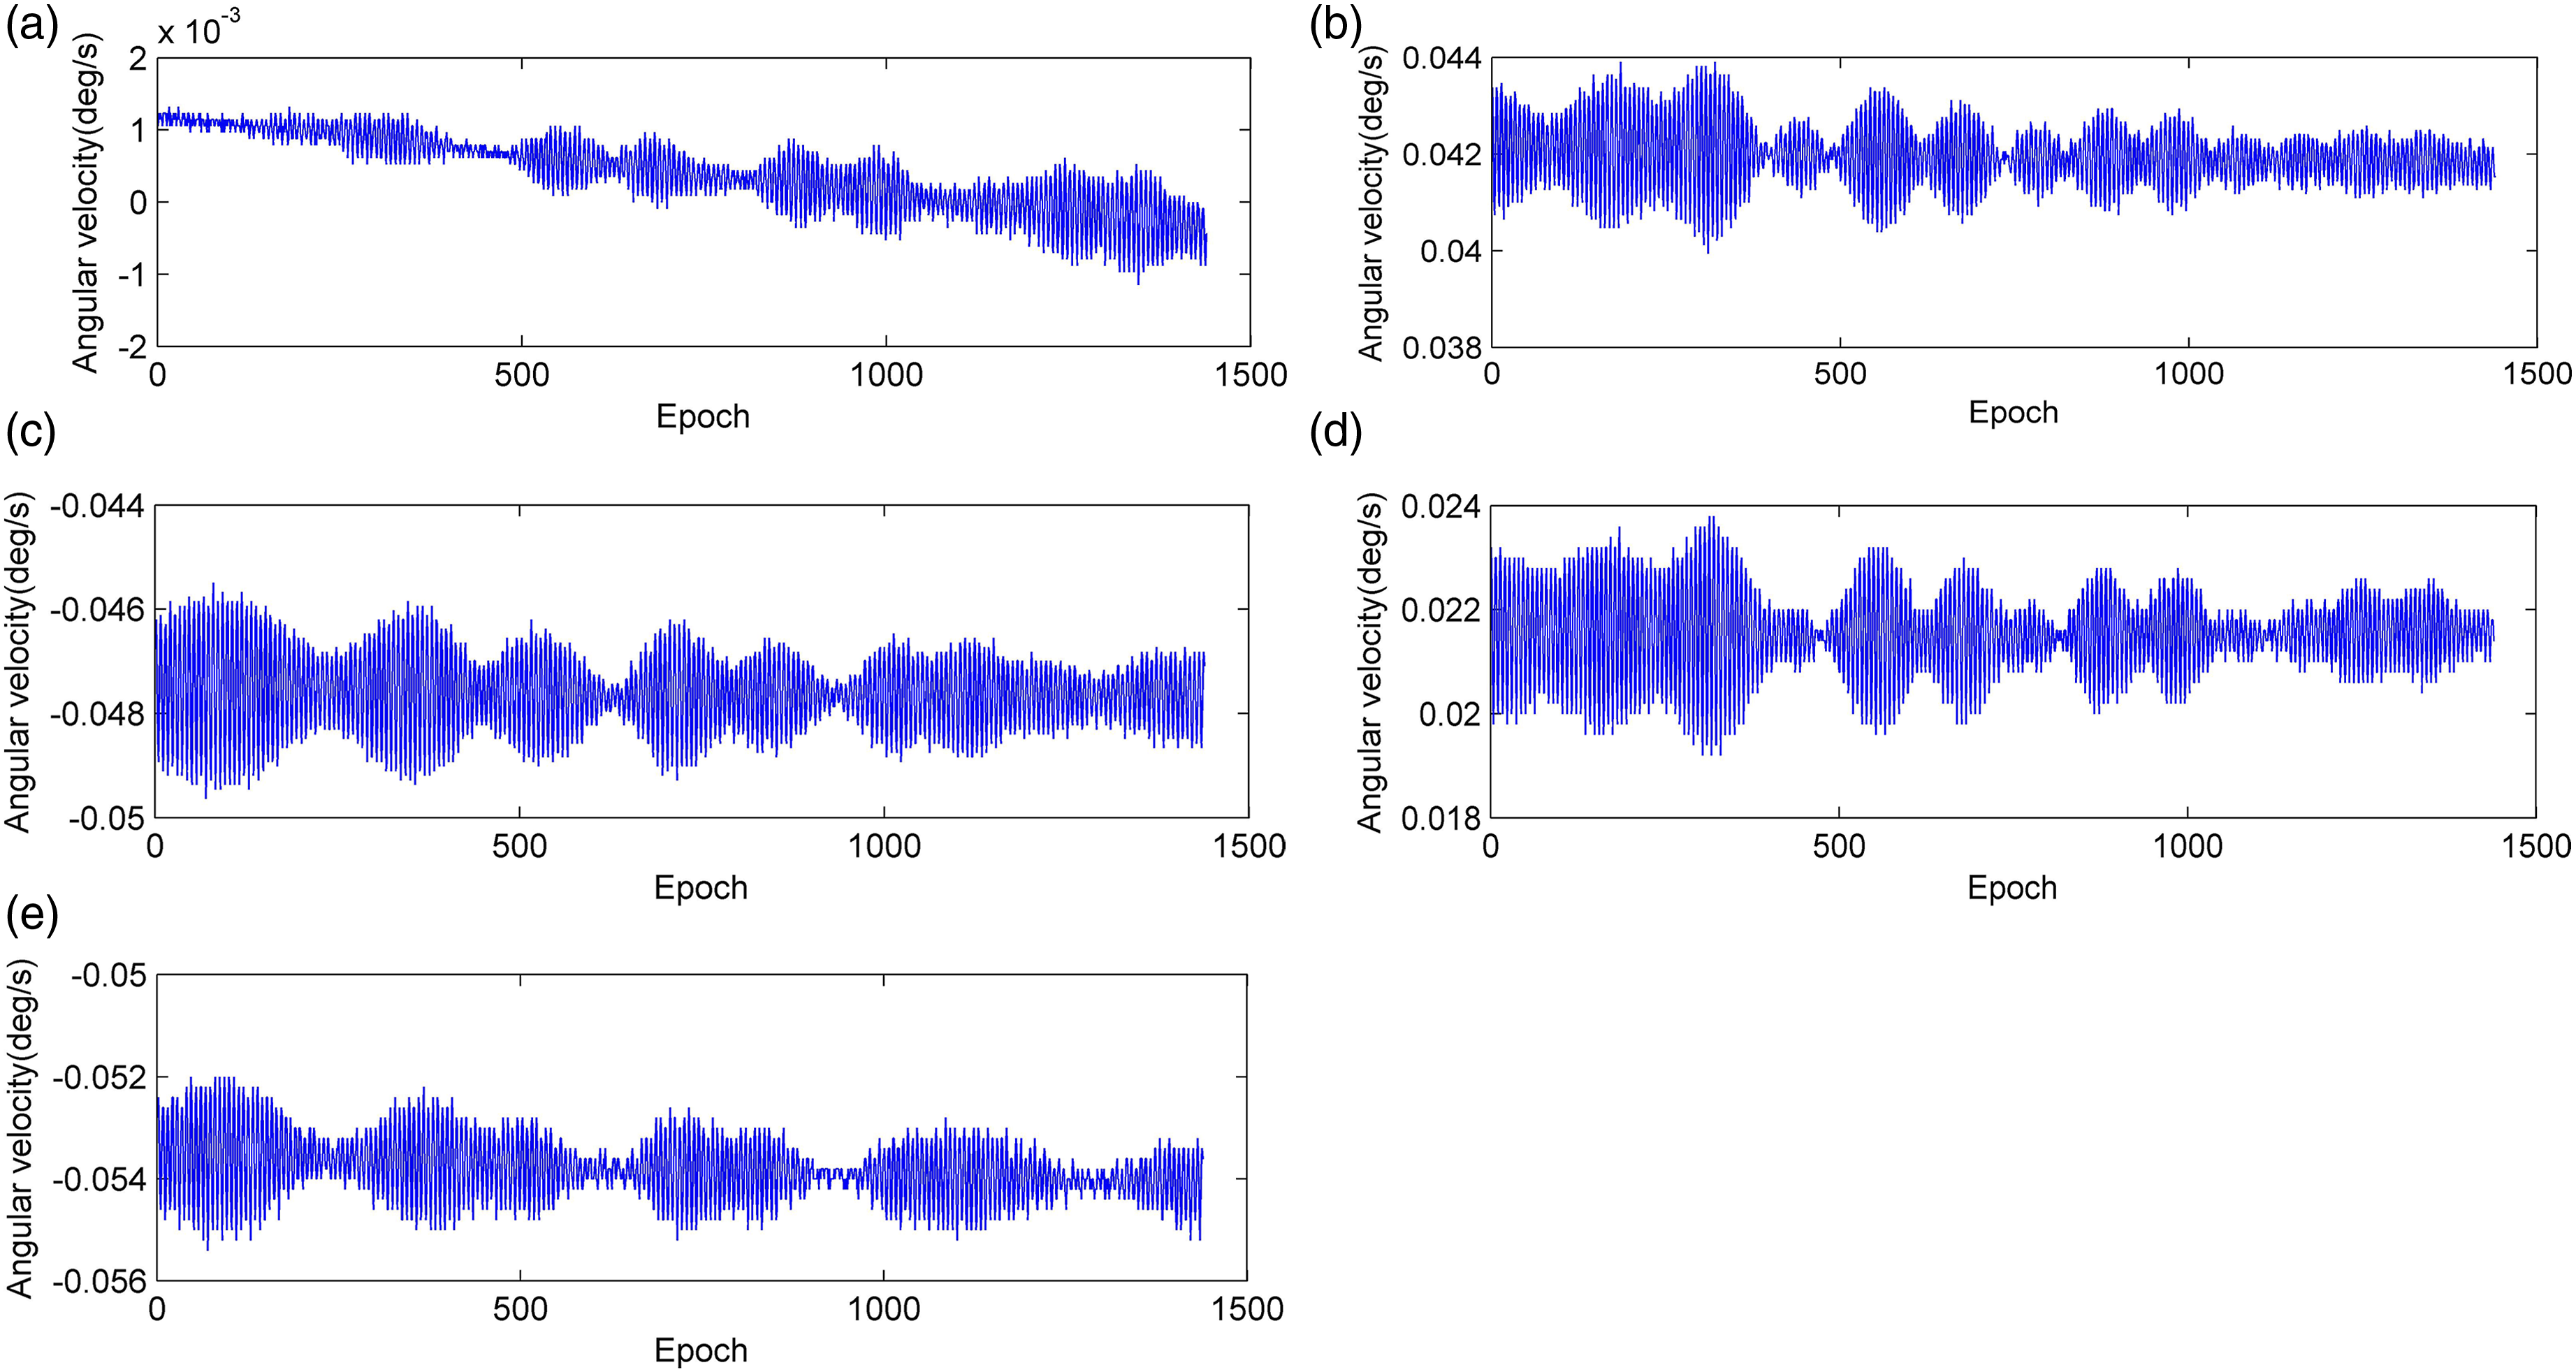
As the gyroscopes of ZY3-01 are the same as those of ZY3-02, we take the 00504th gyroscope data track of ZY3-01, recorded on 11 February 2012, and the 00738th gyroscope data track of ZY3-02, recorded on 17 July 2017, as examples. These tracks are illustrated in Figures 2 and 3, respectively. 00504th raw gyroscope data track of Ziyuan3-01 measured by (a) G1, (b) G3, (c) G5, (d) G7, (e) G8, (f) G10, (g) G11, and (h) G12, G1-G8 are outputs in satellite body coordinates, G10-G12 are in J2000 coordinates of the international celestial reference frame. 00738th raw gyroscope data track of Ziyuan3-02 measured by (a) G1, (b) G3, (c) G5, (d) G7, (e) G8, all outputs in satellite body coordinates.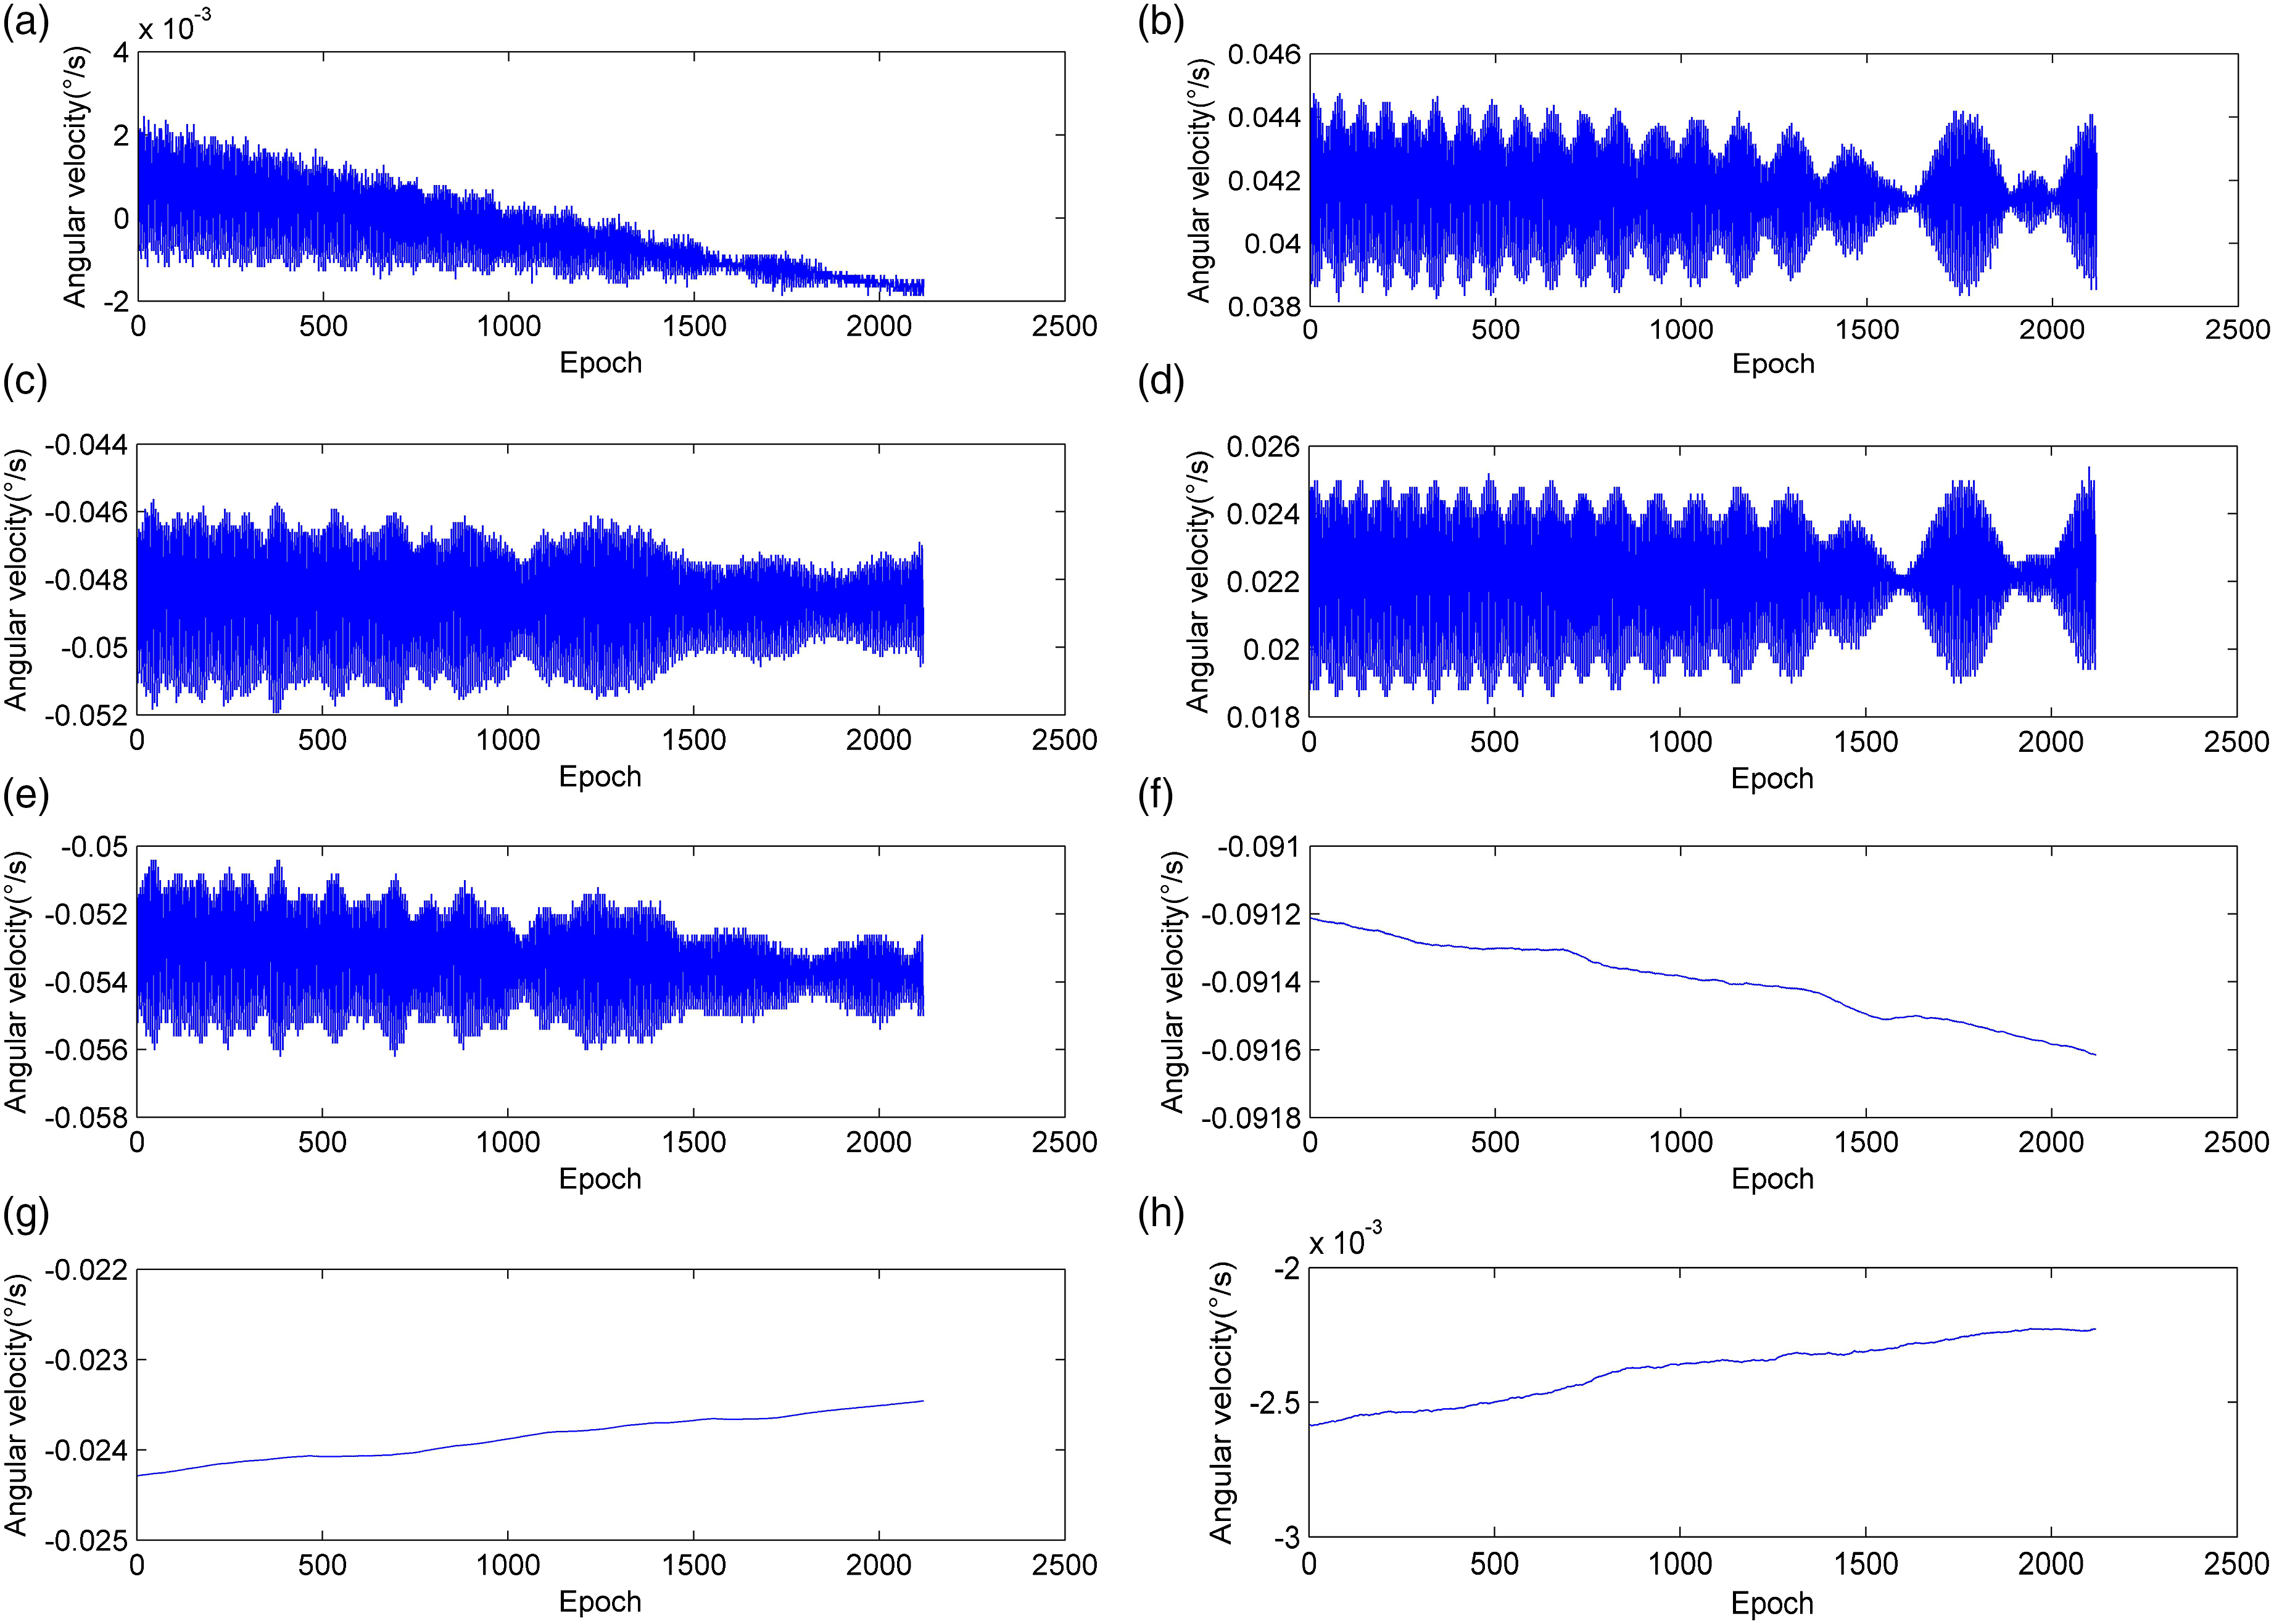
3. Methodology
To detect platform vibration and model its change in frequency, this study proposes a strategy based on long-term raw gyroscope data, which consist of three steps: (1) Preprocessing, which is the preparatory work for processing the gyroscope data. This involves examination and selection of the long-term gyroscope data. The goal of this step is to obtain suitable experimental data. (2) Processing, which consists of applying polynomial and fast Fourier transform (FFT) analyses to acquire the two-dimensional frequency spectra. The three-dimensional VFCI—vibration frequency changing image is then derived using superposition. (3) Modeling, which involves applying Gaussian low-pass filtering (GLPF) to suppress the high-frequency noise and grading local energy based on energy distribution. Finally, the vibration change curve is modeled by a weighted sine function for the VFCI. The framework of the proposed method is shown in Figure 4. Framework of satellite platform vibration detection and frequency change modeling.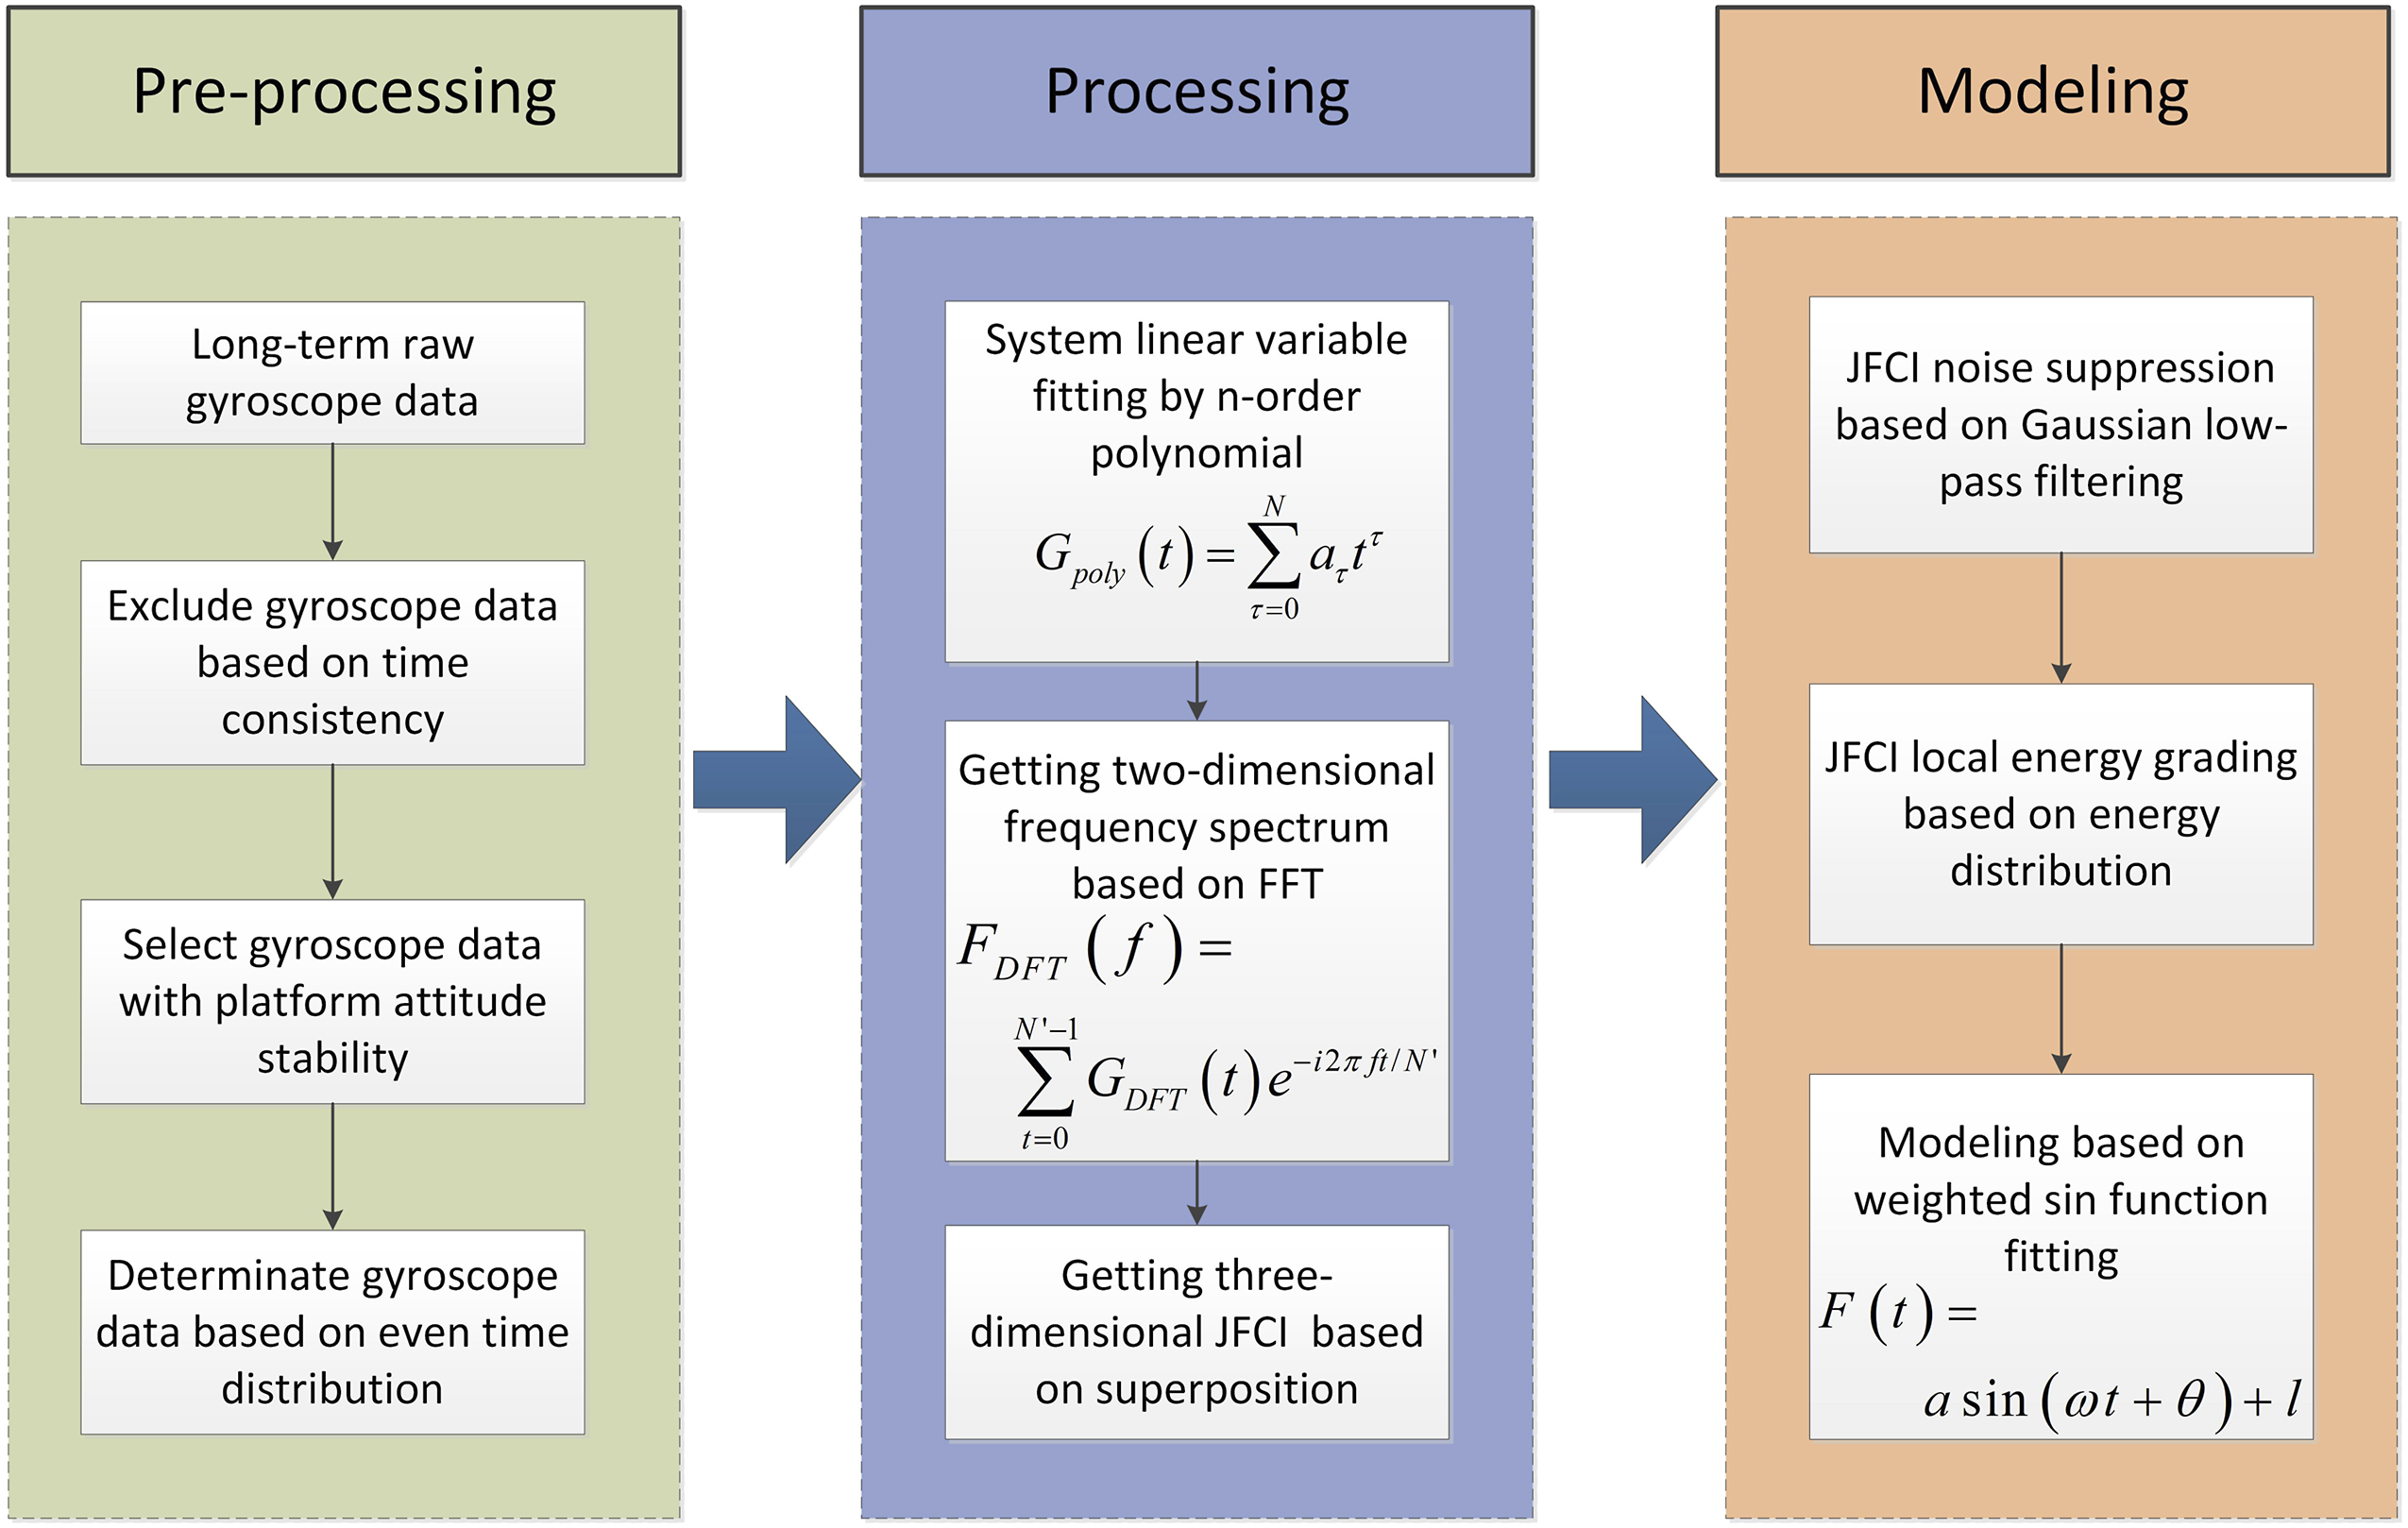
3.1. Preprocessing
The environment in space is different from that of the laboratory and influences the payloads carried by satellites. Downloaded raw gyroscope data may include some outliers or lost data, which will lead to the failure of the vibration detection and frequency change modeling. The time distribution of gyroscope data should be uniform during the life of the satellite. This makes preprocessing a necessary first step. To screen the gyroscope data, we used two constraint conditions as the judgment criteria: time consistency and platform design stability.
3.1.1. Excluding gyroscope data based on time consistency
The sampling frequency of a gyroscope is 4 Hz, and the time interval between two adjacent points is 0.25 s. There is some data loss and some repeat transmissions, in the raw data, and the constant time interval can be used to check for these discrepancies. The data checking process is illustrated in Figure 5. Time coherence of satellite gyroscope data.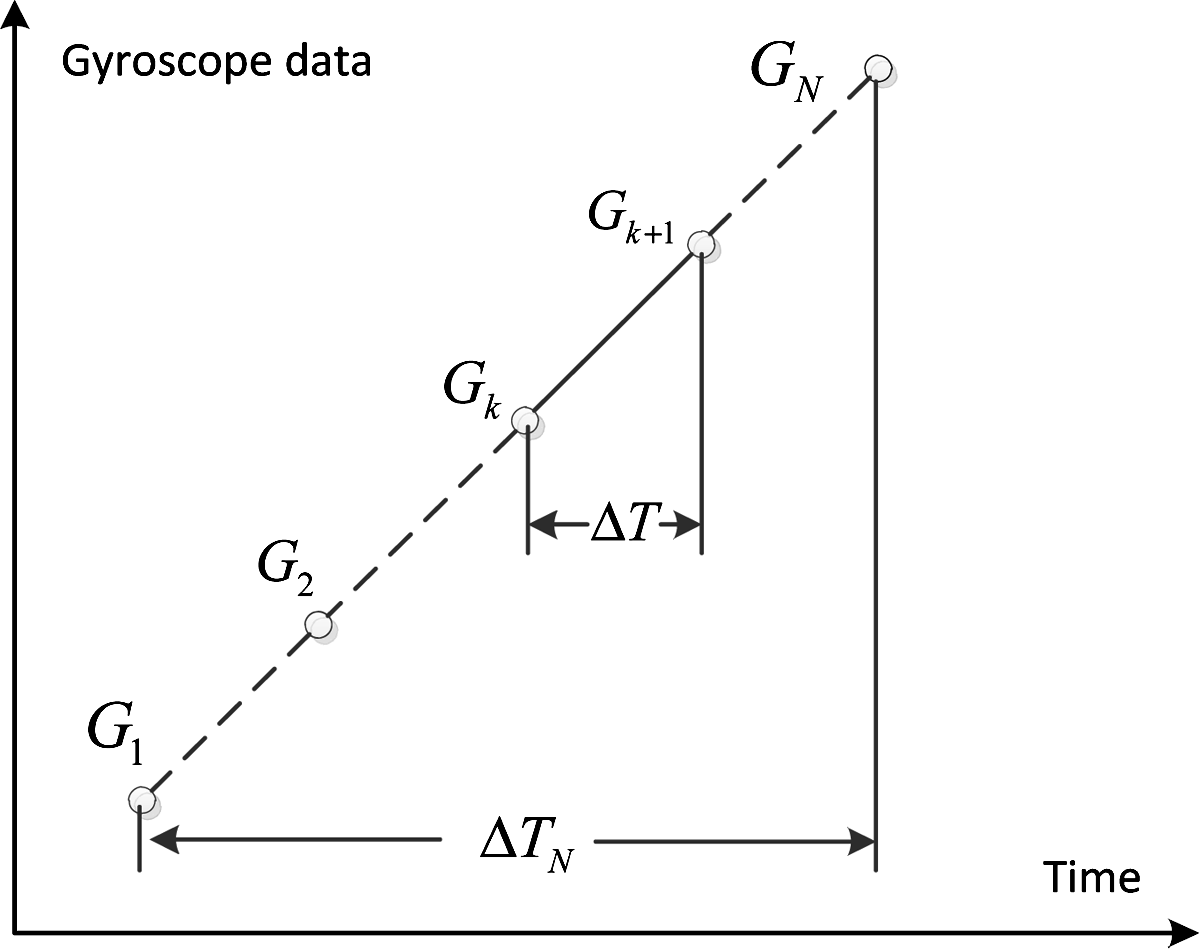
The open circles 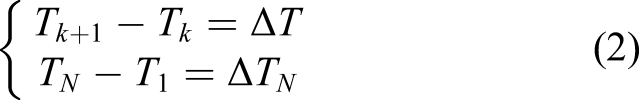
Valid data should meet the
3.1.2. Selecting gyroscope data with platform attitude stability
Platform stability is a basic design requirement for all orbiting satellites. Because of such factors as satellite platform swing and the operation of CMGs, gyroscope data may include small errors, which can influence test results. To minimize measurement error, we apply platform design stability as a constraint. As a gyroscope measures angular changes, its data should meet angular change stability requirements. The angular change stability formula is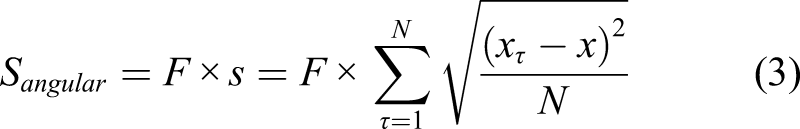
The design value of the ZY3 satellite series platform is 5×10⁻⁴ degree/s, and we set 1×10⁻³ degree/s as the threshold value. We discard all data tracks in which
3.2. Processing
3.2.1. Gyroscope data analysis based on polynomial and FFT analyses
Gyroscopes can precisely record platform angular changes. Detection resolution is dependent on the sampling frequency of the gyroscope, being equal to half its value. Gyroscope data in satellite body coordinates are better for detecting vibration, which can express the state of the satellite platform with high sensitivity. For this reason, all angular measurements should be transformed to satellite body coordinates.
Gyroscopes measure angular changes along a particular axis, so different installation relationships between a gyroscope and its platform will yield different results. There is also some constant drift noise and other linear variations in the gyroscope data. Linear variations influence vibration detection when FFT is applied to analyze the data in the frequency domain, so a general polynomial is first used to fit the data, thereby reducing linear variations and their influence. The general polynomial is as follows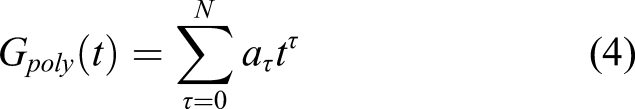
Following general polynomial processing, we apply FFT to process the data. The FFT divides the gyroscope data into its frequency components, consisting of single sinusoidal oscillations at distinct frequencies, each with their own amplitude and phase. An FFT computes the discrete Fourier transform (DFT) and produces exactly the same result as evaluating the DFT directly; the most important difference is that an FFT is much faster. The FFT is a calculation algorithm, and the DFT is the theoretical foundation. The DFT is defined by the following formula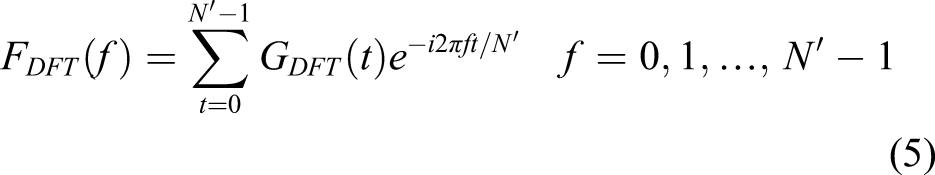
The gyroscope data can be fitted by the general polynomial and the DFT. The formula is as follows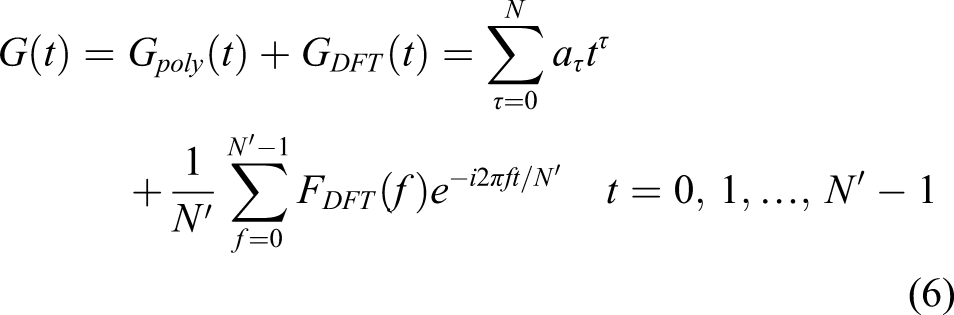
3.2.2. Deriving the three-dimensional VFCI based on superposition
We can obtain the frequency spectra of one track of gyroscope data after polynomial and FFT processing. These spectra include the frequency domain information. As the gyroscopes are activated only when the cameras are scanning, the frequency spectra only express the frequency information in approximately 10 min intervals. This short-term analysis does not sufficiently show changes in vibration. To detect and model vibration frequency changes in the long term, we add a set of gyroscope data frequency spectra to the VFCI. The schematic diagram of the VFCI is shown in Figure 6. The left diagram illustrates a selection of two-dimensional frequency spectra. Here, the horizontal axis represents frequency, and the vertical axis represents amplitude. The right illustration is the VFCI, with time as the horizontal dimension, frequency as the vertical dimension, and the various colors representing amplitude intensity. Plotting of vibration frequency change image.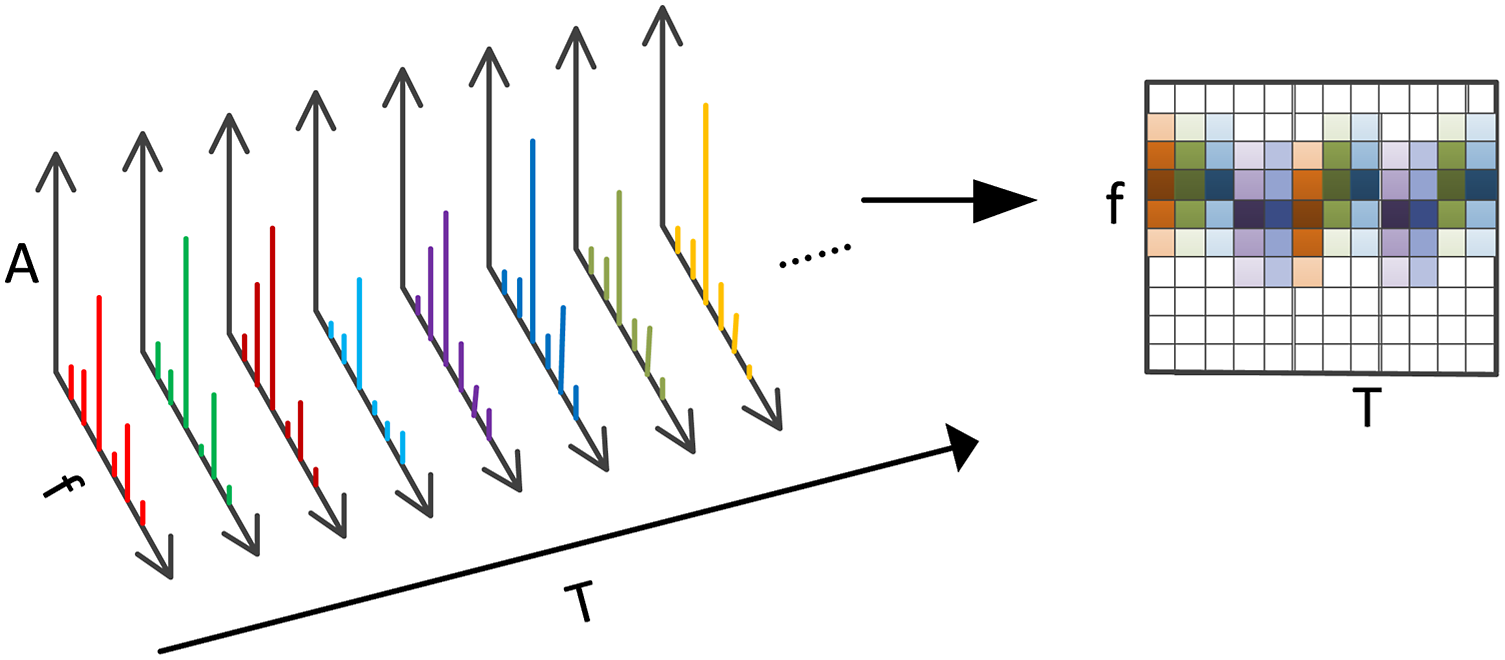
In the VFCI illustration, we set the detection result of one gyroscope’s data, which is the frequency spectrum in the left portion of Figure 6, as a column in the right grid. The gray intensity value of the VFCI is the same as the vertical axis variable of the two-dimensional frequency spectra; thus, it expresses vibration amplitude. From the VFCI, the frequency changes of various vibrations in the satellite platform can be obtained.
3.3. Modeling
The VFCI shows the long-term vibration frequency of the satellite platform, with the gray pixels representing vibration amplitude. As the vibration amplitude is not a fixed value and may be influenced by various factors, there is noise in the VFCI. This noise may influence the modeling of the frequency change curve. To decrease this influence, it is necessary to use image processing technology to improve the VFCI before modeling.
The VFCI is an image composed of some two-dimensional frequency spectra. Two-dimensional frequency spectra express the frequency information of raw gyroscope data. Gyroscope data are influenced by various factors in space; in addition, the main frequencies of satellite platform vibrationinclude several constant values. Thus, the two-dimensional frequency spectra include bits of low-frequency vibration information and high-frequency noise. To decrease the high-frequency noise, we apply a GLPF to process the VFCI in the frequency domain. The GLPF is as follows
Taking the VFCI as an image and applying a GLPF to process the noise cause the vibration data of the VFCI to become more prominent. To model the curve shown in the filtered VFCI, we need to apply grading to the remaining data to normalize it. We first add the three adjacent values within the same column. If the summation of the three values is the maximum, the three values of the pixels will be left, and all others are set to 0. If the values in the column are all 0 after GLPF, no action is taken and the state is retained. The grading model is as follows
The VFCI shows a regular change curve; therefore, we apply the sine function to model it.
The curve in the VFCI is modeled by a sine function, but the amplitude grading (gray value) varies. To avoid ignoring this amplitude information when we model the curve, we apply a weighted sine function to fit the curve, with the amplitude grading used as the weight. The adjustment formula is as follows
The vibration frequency change model based on grading the VFCI with a weighted sine function is shown in Figure 7. Each set of three adjacent boxes in the same column are the local frequency maximum summation for a particular gyroscope’s data, the gray value is the amplitude grading, and the red curve is a best-fit of the result. Based on VFCI processing, the vibration change of a satellite platform can be modeled, and the vibration frequency change curve can be derived. Weighted sine function fitting based on the graded vibration frequency changing image.
4. Experiments and discussion
To detect platform vibration and model the changes in its frequency, we performed two separate experiments with ZY3-01 and ZY3-02.
4.1. Experiment 1: ZY3-01 raw gyroscope data
We processed the raw gyroscope data from the ZY3-01 satellite using the proposed method and obtained the two-dimensional frequency spectra after polyfit and FFT analysis. The spectra show the frequency information of the gyroscope data. The ZY3-01 data include measurements from eight gyroscopes before 15 October 2015 and measurements from five gyroscopes after that date. We selected the 03427th track, acquired on 5 May 2013, for frequency spectrum analysis and shown as example.
In Figure 8, it can be seen that 0.6–0.7 Hz is the main frequency range of the ZY3-01 platform based on data from the 03427th track. Different gyroscope frequency spectra have the same frequency, but varying amplitudes. The main reason for this has to do with variations in the installment relationships between each gyroscope and the platform; a gyroscope can only measure the angle change in one direction. Two-dimensional frequency spectra only show the frequency data of a single track for approximately 10 min. To detect the vibration and its frequency changes for longer time periods, we superpose these two-dimensional frequency spectra on a three-dimensional VFCI. Ziyuan3-01 two-dimensional frequency spectra. Result of (a) G1, (b) G3, (c) G5, (d) G7, (e) G8, (f) G10, (g) G11, and (h) G12.
After processing all of the ZY3-01 raw gyroscope data for approximately 2400 tracks, we superposed them onto the VFCI. The column of the VFCI is the amount of raw gyroscope data, and the row is its frequency, ranging from 0–2 Hz. The gray values of pixels in the VFCI represent the amplitude shown in the two-dimensional frequency spectra. ZY3-01 has a total of 12 gyroscopes, eight of these were activated before 15 October 2015, and five remained activated following this date. Each gyroscope can generate a series of two-dimensional frequency spectra, so we get one VFCI per gyroscope. The VFCIs of ZY3-01 are shown in Figure 9. Three-dimensional vibration frequency changing images of Ziyuan3-01, which consisted of two-dimensional frequency spectra of 2400 tracks. The vibration frequency changing image of (a) G1, (b) G3, (c) G5, (d) G7, (e) G8, (f) G10, (g) G11, and (h) G12. The analysis time ranged from February 2012 to July 2018. On 15 October 2015, one side of the solar panels broke, resulting in a frequency break of the vibration frequency changing image.
From the VFCIs shown in Figure 9, we can see that the frequency change approximates a sine function curve. Vibration amplitude is large during the first 3 months following the satellite’s launch, after which it tends to stabilize. In these first 3 months, the satellite was in the onboard testing stage when various satellite functions were activated to ensure that the satellite is functioning properly. Various types of loads were turned on, and the platform swaying function would cause the vibration amplitude to be abnormal. To decrease the influence of the onboard testing, we graded the amplitude in every column of the VFCI. This provided us with the relative normalized values, which were used for weighting in the sine function fitting.
After GLPF and energy grading, the image quality of the VFCI improved and the noise in the VFCI decreased. Given that one side of the solar panel broke on 15 October 2015, the satellite platform vibration rule changed, as seen in Figure 9. Thus, we should not use a single sine function for fitting. The fitting result using two curves is shown in Figure 10. Ziyuan3-01 vibration frequency change model. Fitting model of (a) G1, (b) G3, (c) G5, (d) G7, (e) G8, (f) G10, (g) G11, and (h) G12. The red curve is the fitting based on the gyroscope data before 15 October 2015, and the green curve is the fitting using data after that date.
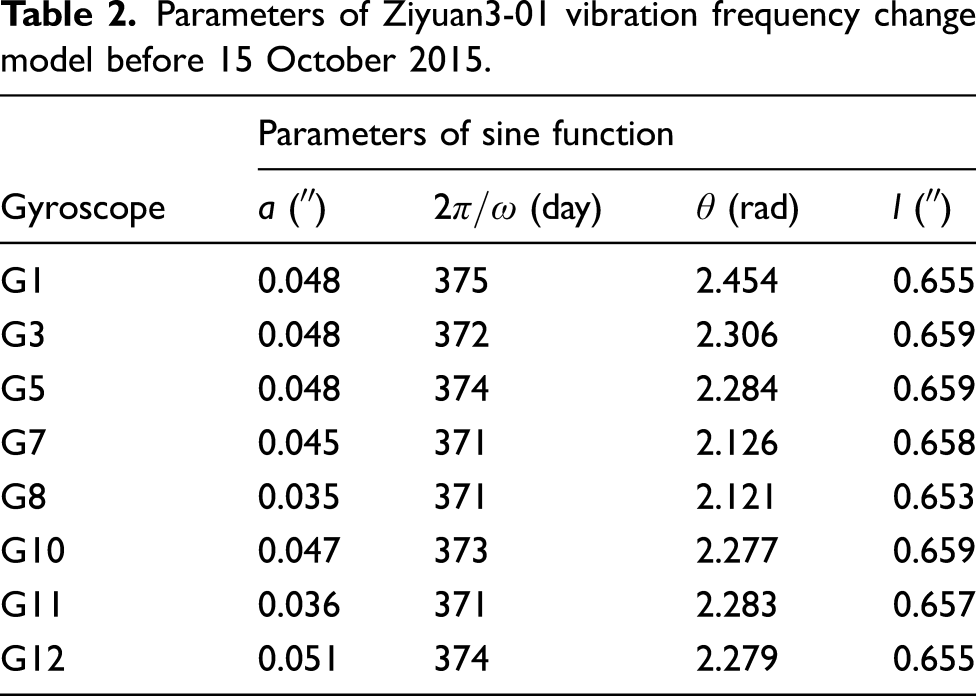
Parameters of Ziyuan3-01 vibration frequency change model before 15 October 2015.
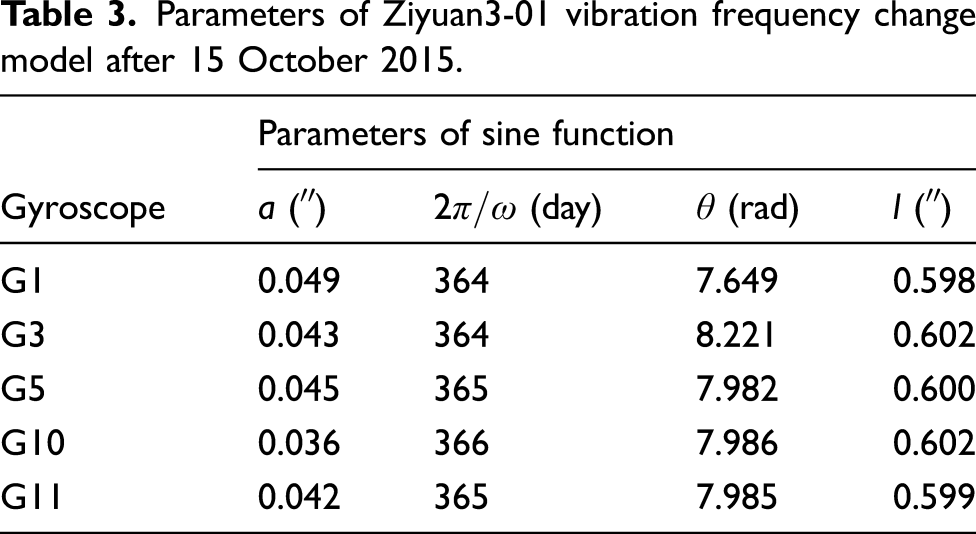
Parameters of Ziyuan3-01 vibration frequency change model after 15 October 2015.
4.2. Experiment 2: ZY3-02 raw gyroscope data
Most of the loads carried by the ZY3-02 platform are the same as those on the ZY3-01 platform, as are the platforms themselves. To verify the proposed method and to detect the ZY3-02 vibration frequency changes, we used ZY3-02 long-term raw gyroscope data for testing. Similar to ZY3-01, ZY3-02 only activates 5 gyroscopes, including 1 group of 3 gyroscopes (G1, G3, and G5) and 2 back-up gyroscopes (G7 and G8). In our verification test, we used the raw angular measurement data from these 5 gyroscopes.
We processed the raw gyroscope data using the proposed method, and we obtained the frequency spectra following FFT analysis. These spectral curves show the frequency information from the gyroscope data. The frequency spectra for the 00738th track, as an example, are shown in Figure 11 as an example. Ziyuan3-02 two-dimensional frequency spectra. Results from (a) G1, (b) G3, (c) G5, (d) G7, and (e) G8.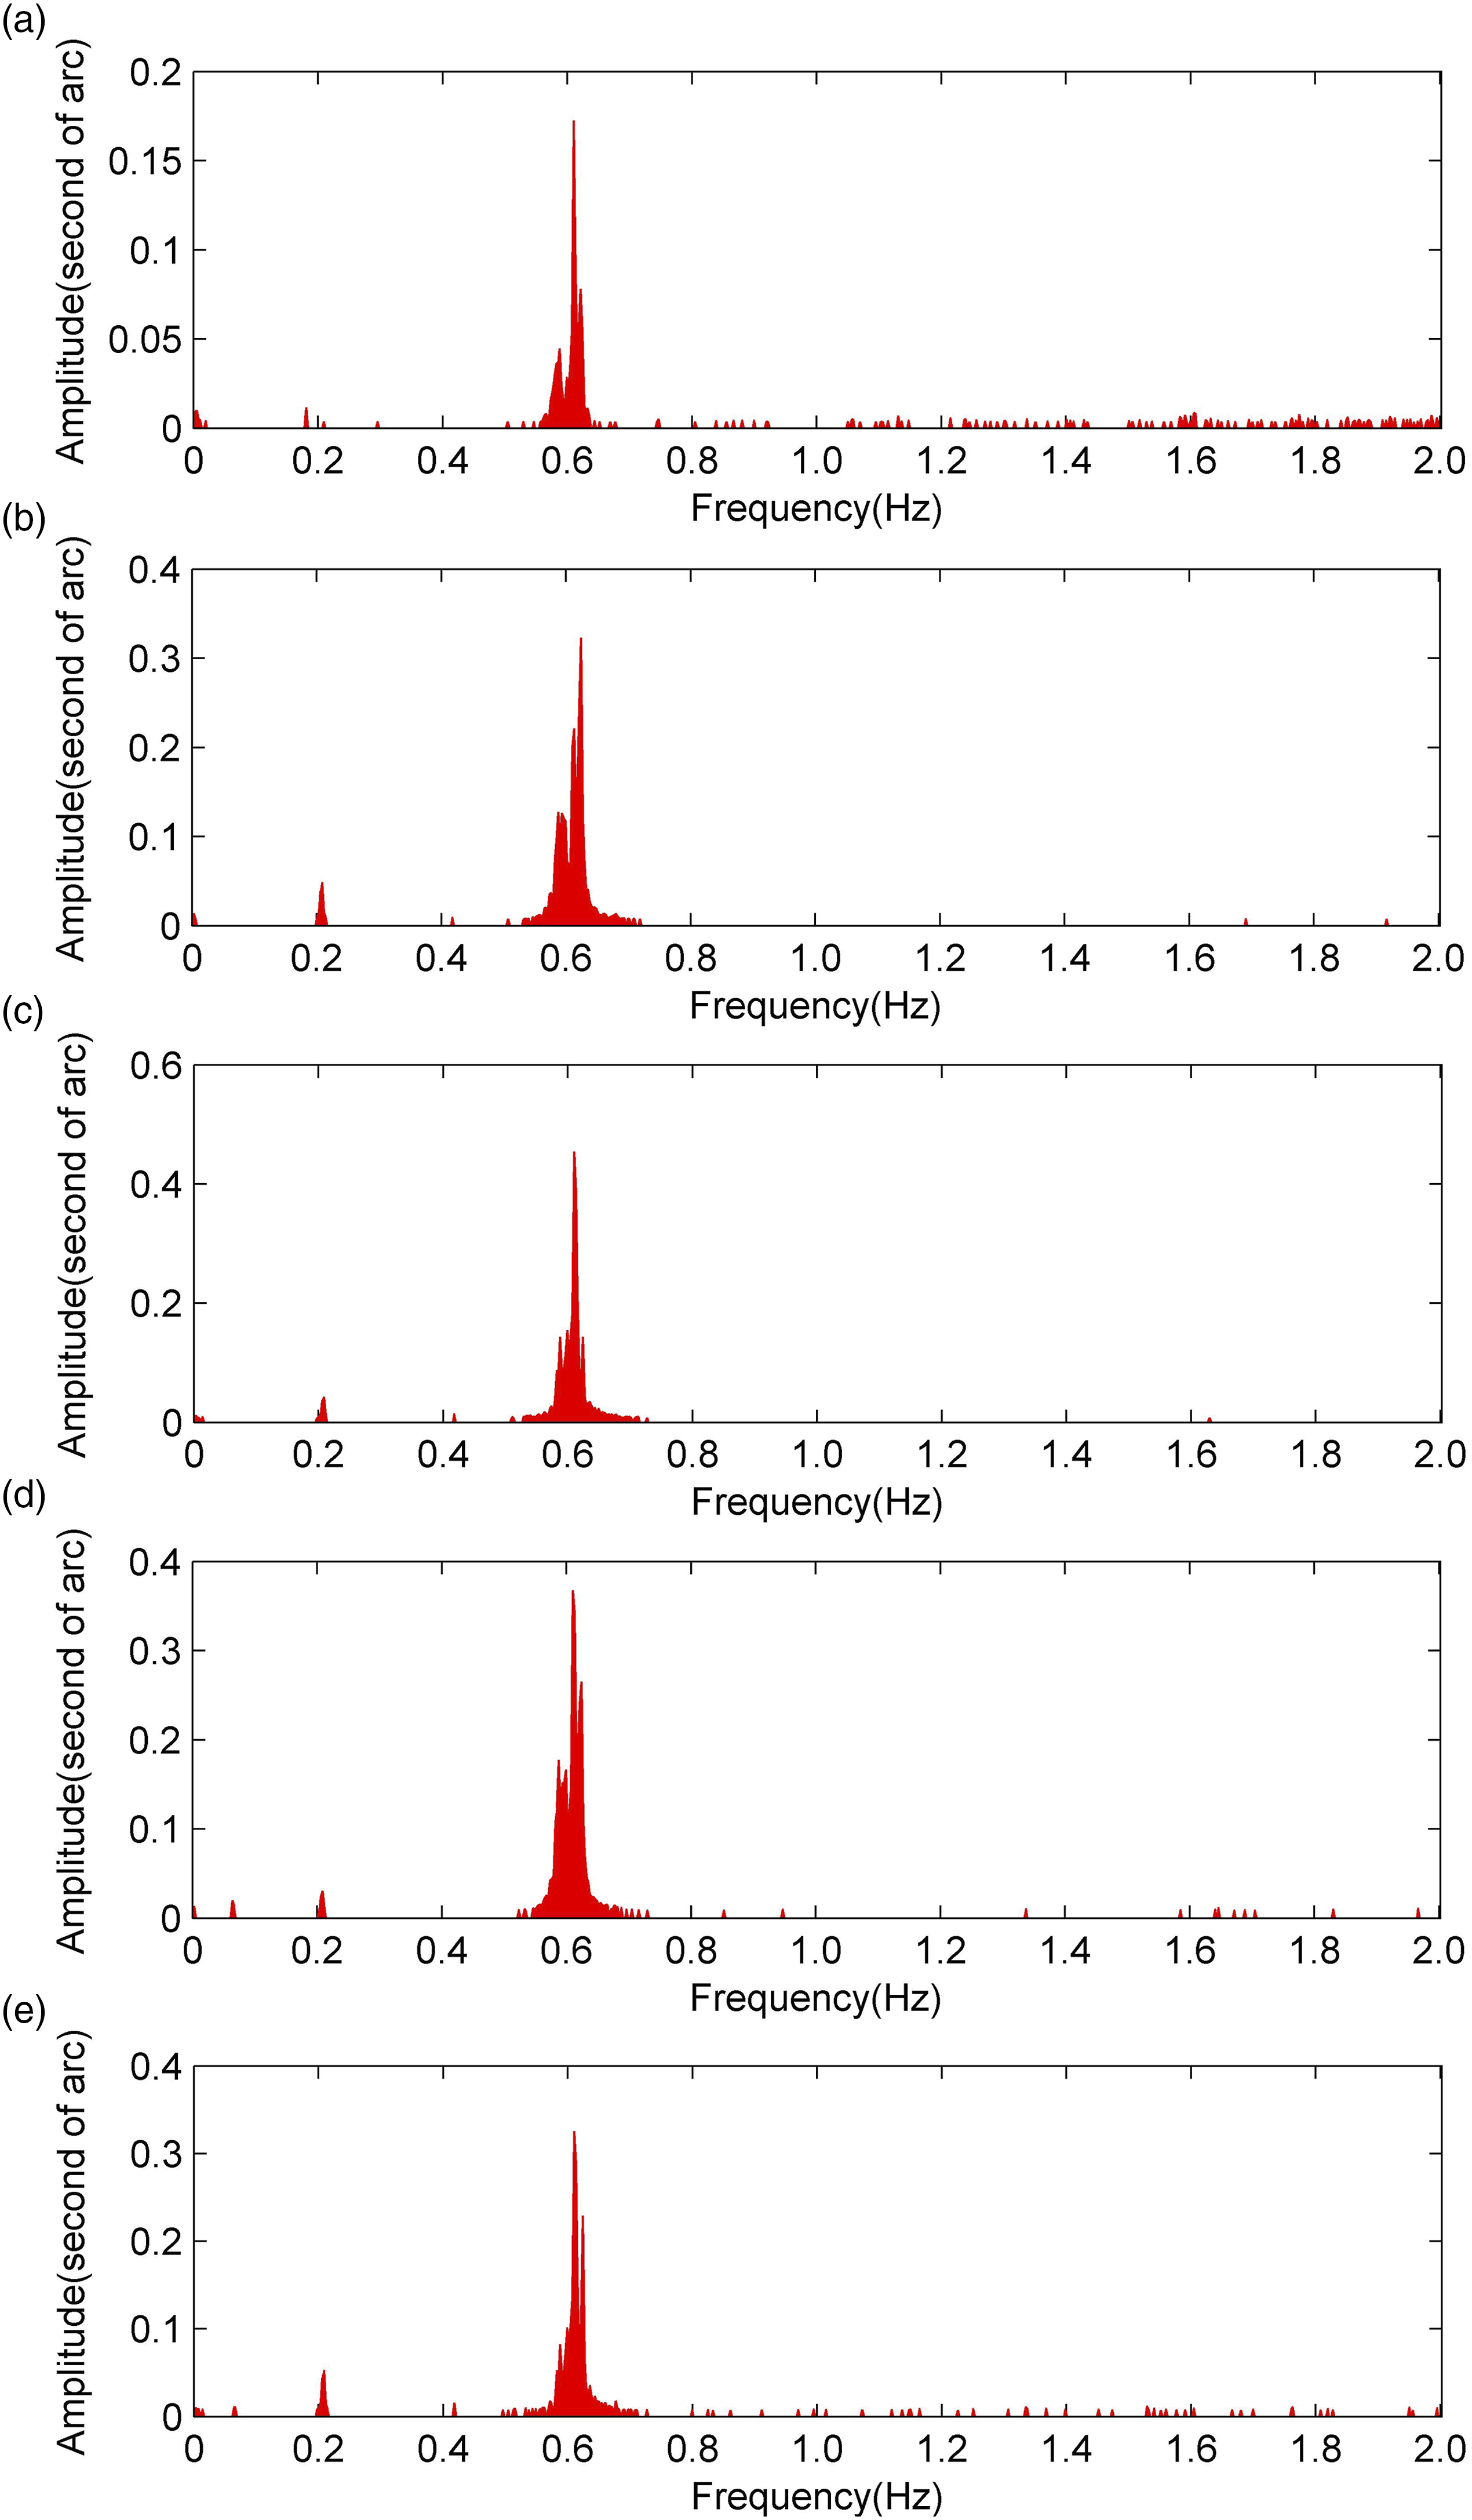
From Figure 11, it can be seen that 0.5–0.7 Hz is the main frequency range of the ZY3-02 platform based on data from the 00738th track, similar to that of ZY3-01 (see Figure 8).
After processing all of the ZY3-02 raw gyroscope data for approximately 2100 tracks, we superposed them onto the VFCI. The column of the VFCI is the amount of raw gyroscope data, and the row is its frequency, ranging from 0 to 2 Hz. The gray pixels in the VFCI represent the amplitude shown in the two-dimension frequency spectra. The VFCIs of ZY3-02 are shown in Figure 12. Three-dimensional vibration frequency changing images of Ziyuan3-02, which consisted of the frequency spectra of approximately 2100 tracks. The vibration frequency changing image of (a) G1, (b) G3, (c) G5, (d) G7, and (e) G8.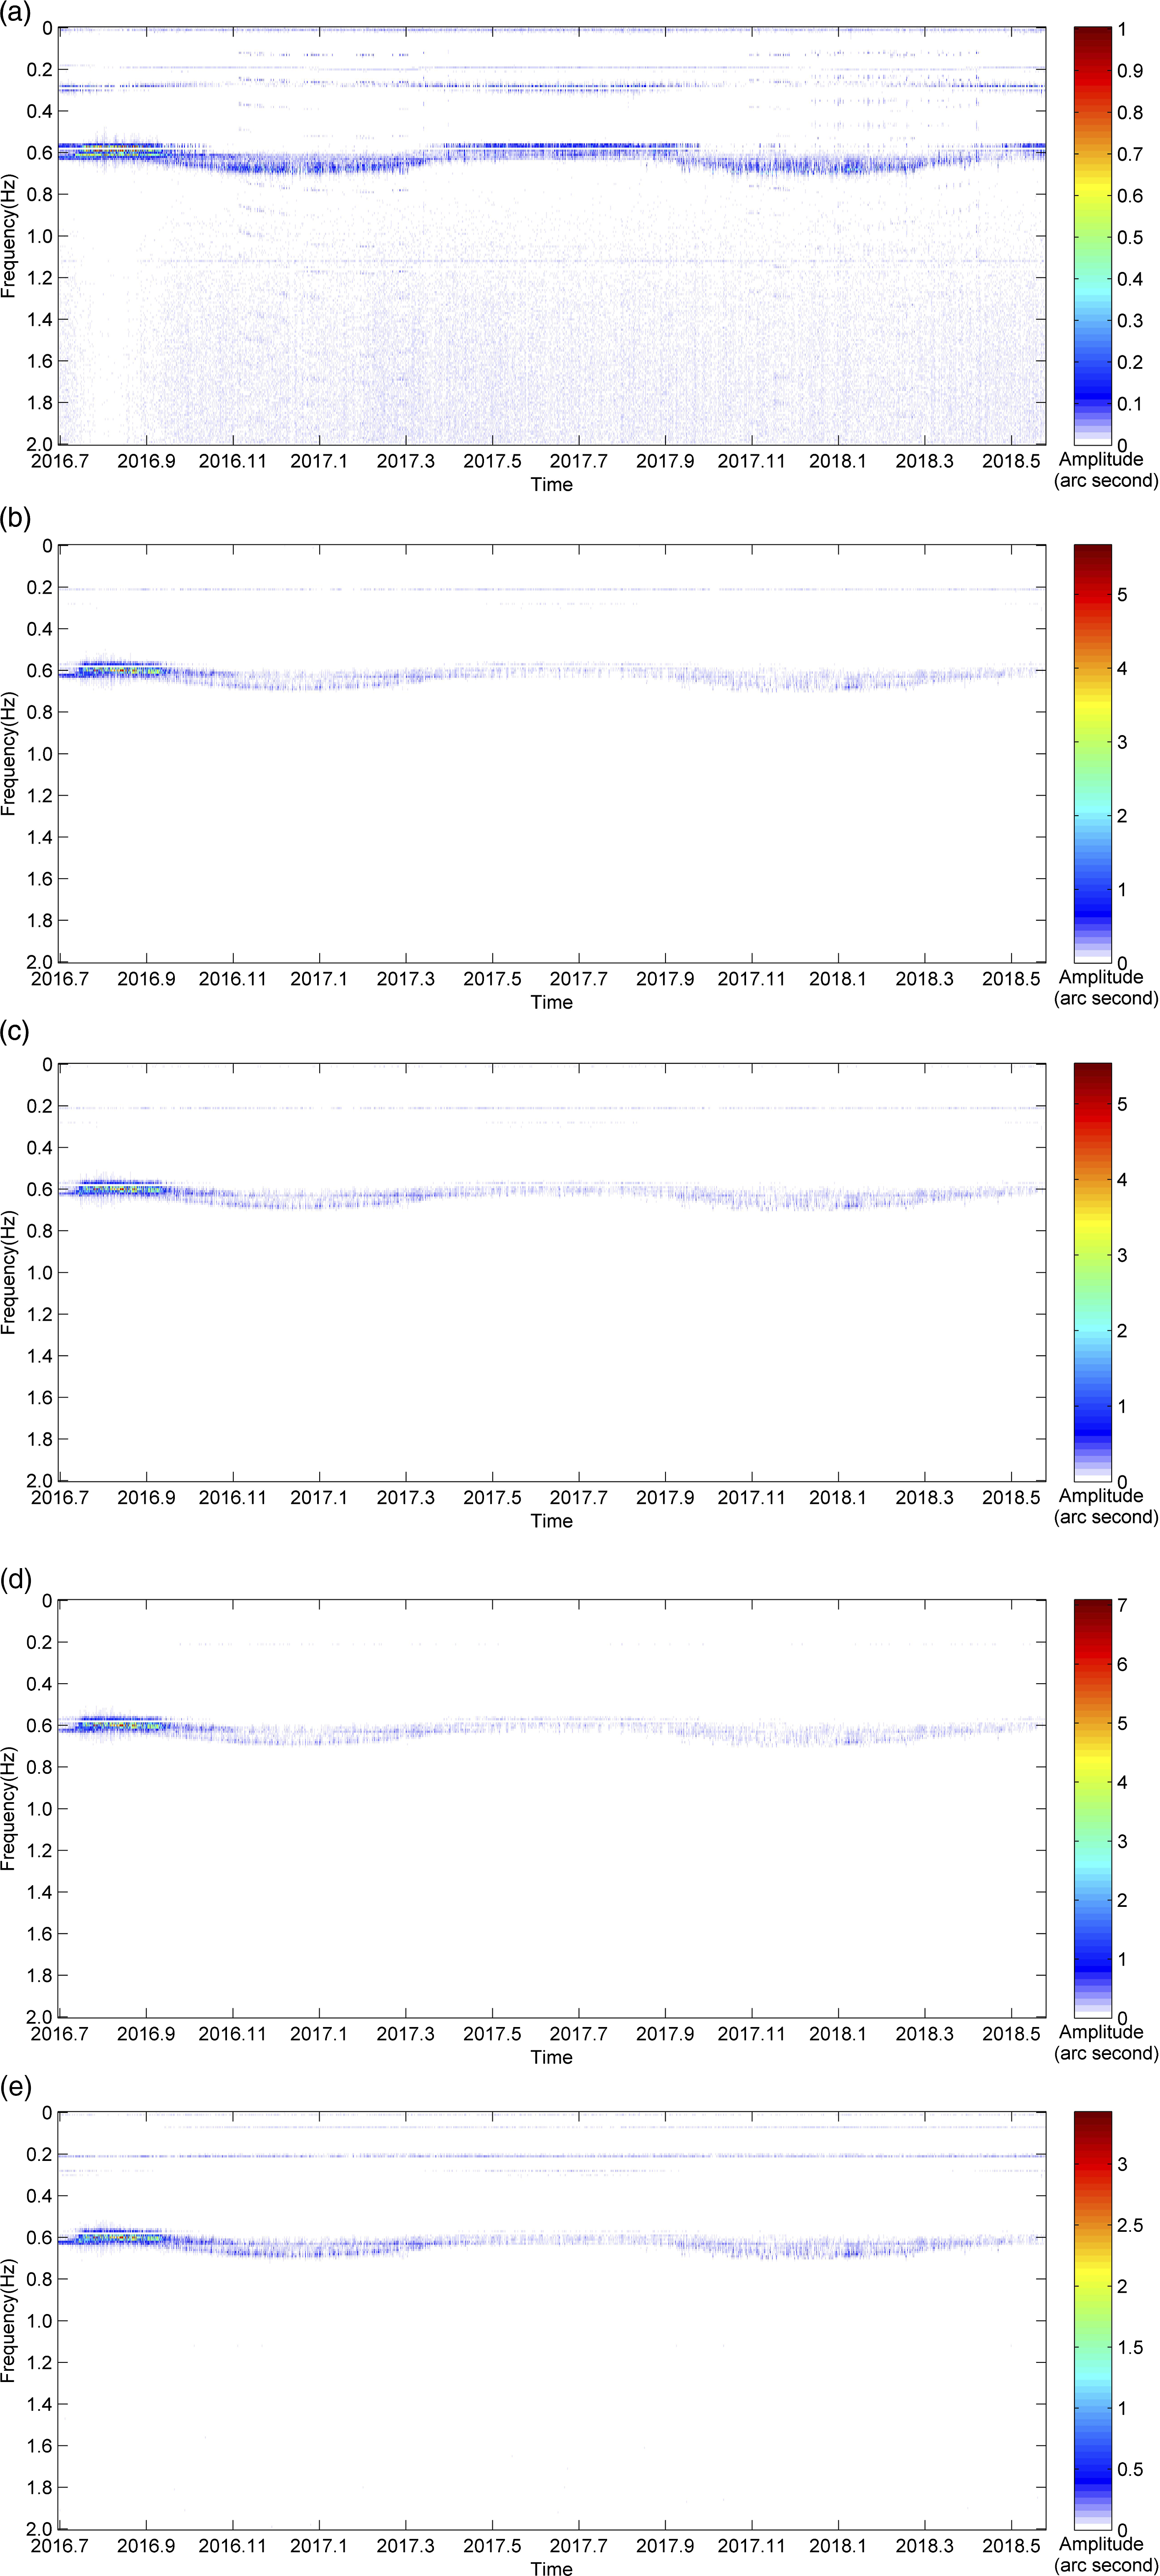
From the VFCIs shown in Figure 12, we see that the ZY3-02 frequency changes are sine function curves, as was the case with those of ZY3-01. Vibration amplitude is large during the first 3 months following the satellite’s launch, after which it tends to stabilize. In the onboard testing stage of ZY3-02, in addition to routine functional testing, an onboard laser altimeter calibration test was also performed. During the laser altimeter calibration test of ZY3-02, from 9–29 August 2016, the satellite platform swayed several times, which impacted the stability of the platform. We can see that the vibration amplitude is large, which may be related to the swaying.
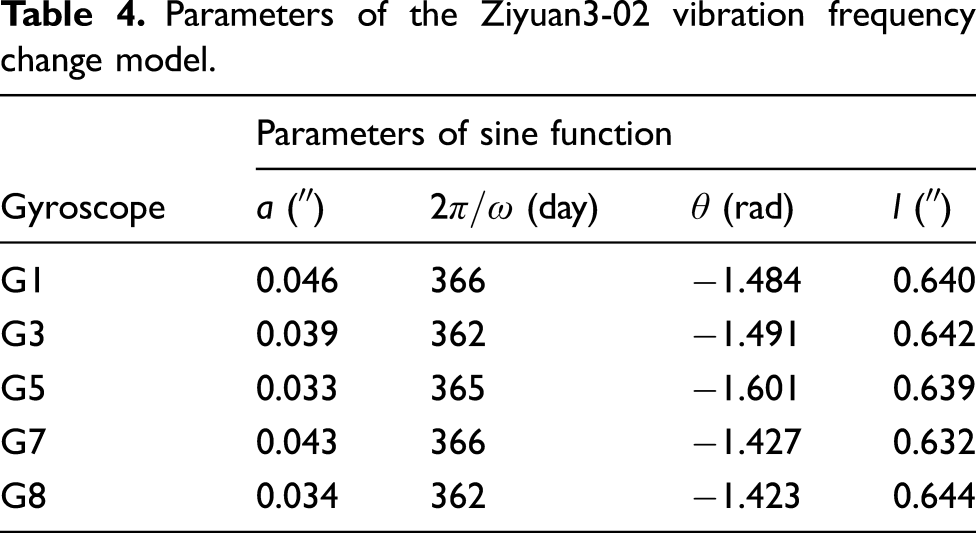
We graded the amplitude in every column of the VFCI and derived the relative normalized values, which were used for weighting in the sine function fitting. After GLPF and energy grading, the image quality of the VFCI improved, and the noise in the VFCI decreased. The sine function was used to fit the vibration frequency change curve; the fitting model is shown in Figure 13. Ziyuan3-02 vibration frequency change model. Fitting model of (a) G1, (b) G3, (c) G5, (d) G7, (e) and G8.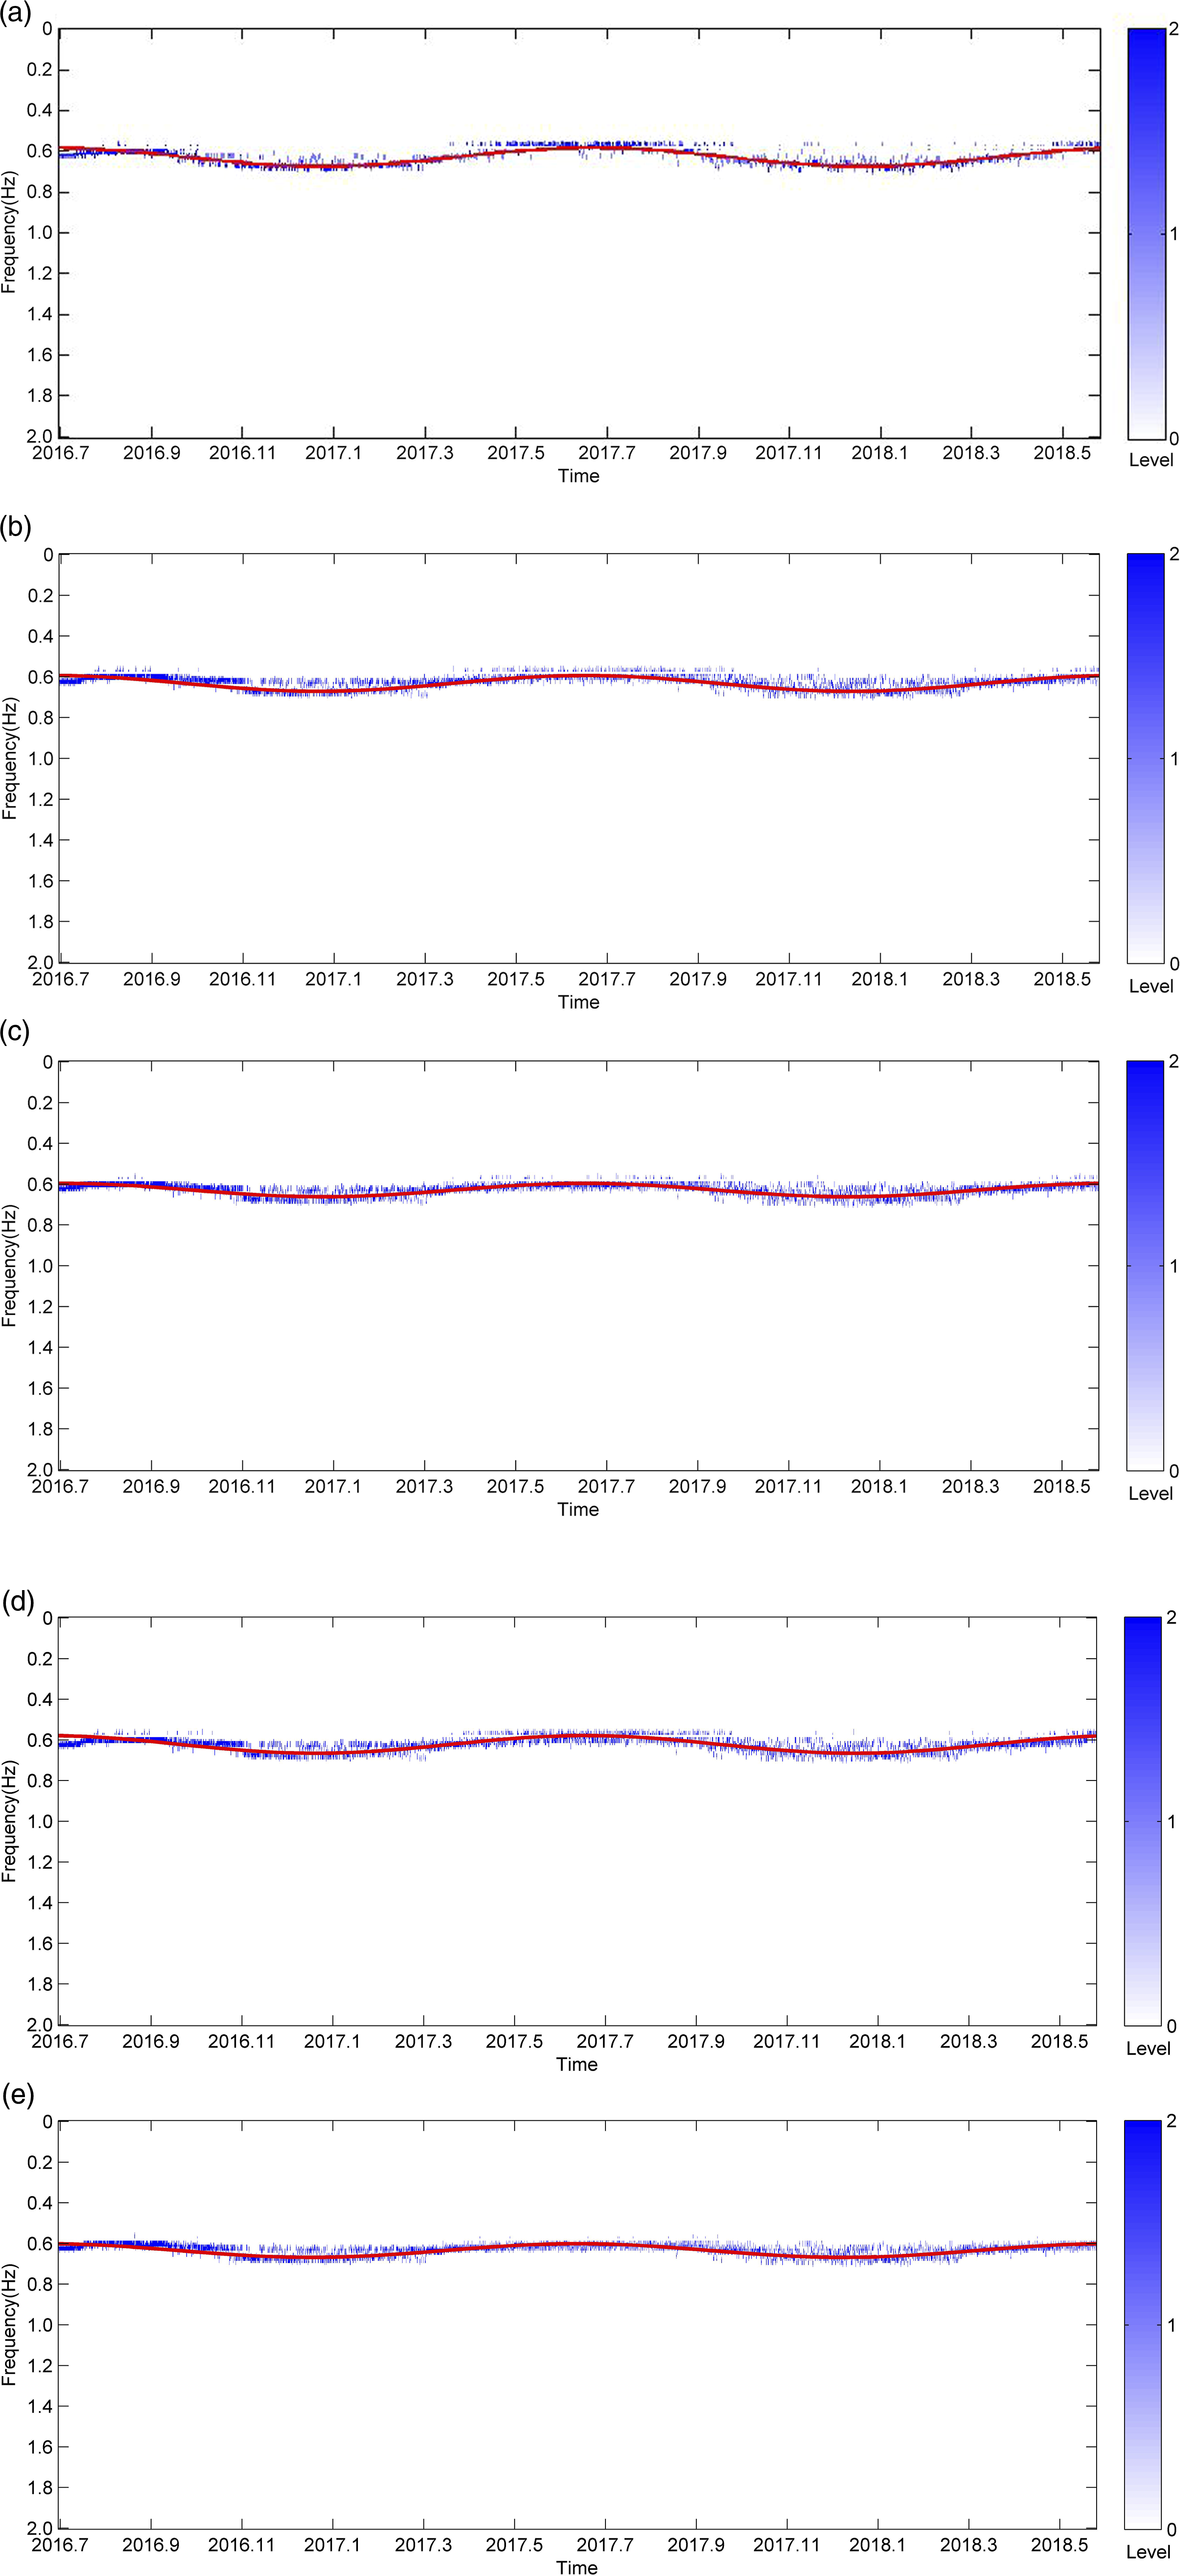
Parameters of the Ziyuan3-02 vibration frequency change model.
From above two experiments, we can find that the ZY3 satellite platform vibration frequency change can be expressed with a model, and the traditional satellite platform vibration model, showed as equation (1), could be improved based on the frequency changing.
After that, the ZY3 platform vibration is not a single and simple sine function. Instead, vibration frequency changes, and the platform vibration is actually a combination of two sine functions. The traditional and proposed model is showed in Figure 14; the traditional one is a sine wave with a certain frequency, but the improved one is a sine wave whose frequency is changing. The satellite platform vibration model schematic map, (a) is traditional one and its period T is a fixed value, (b) is an improved one, and its period (T0–T5) is changing with a frequency.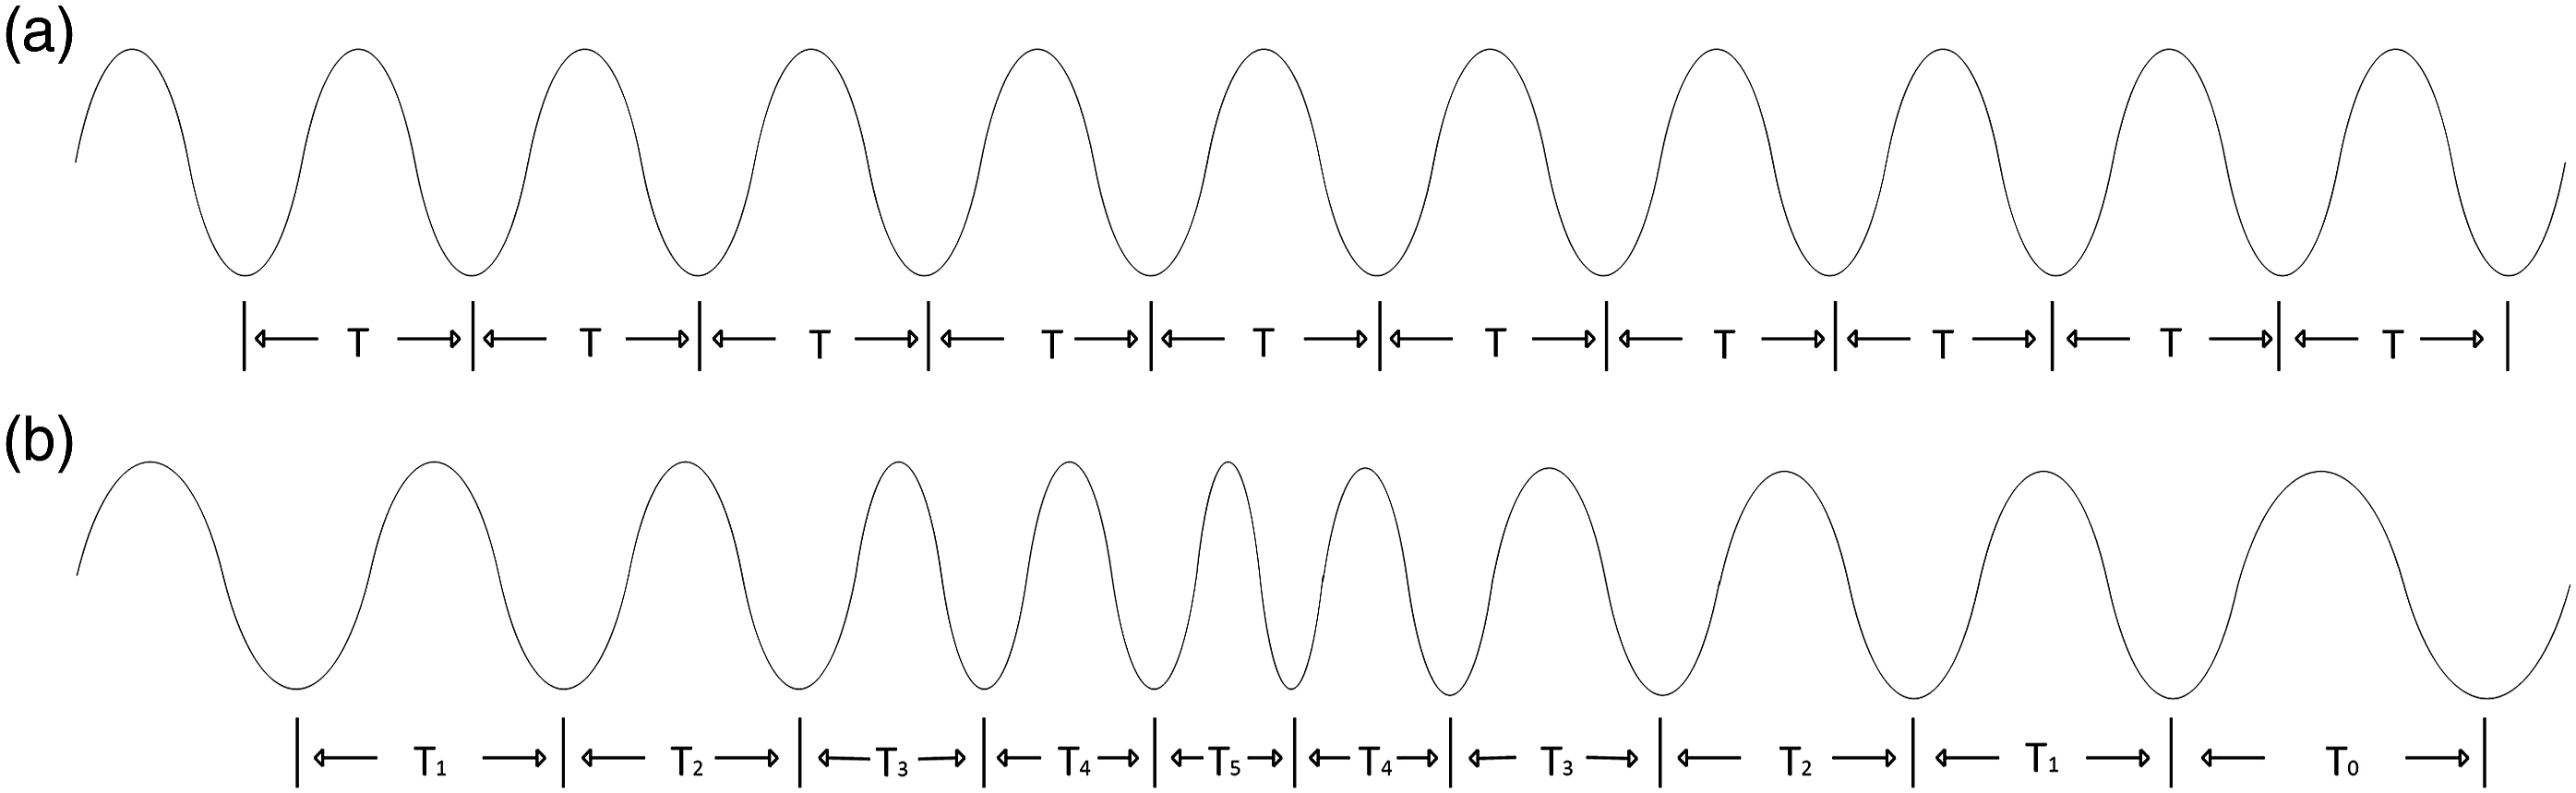
Formula (9) shows the change in platform vibration frequency. This frequency change is added to the traditional vibration model formula (1) to obtain the improved vibration model
5. Conclusions
In this study, we built a satellite platform vibration model with considering frequency changing using long-term raw gyroscope data. We found that the ZY3 satellite series platform vibration frequency changes with a period of approximately 1 year. Several conclusions can be drawn: The proposed strategy can detect ZY3 satellite series platform vibration, which is approximately 0.65 Hz and ranges from 0.59 Hz to 0.7 Hz. This vibration also includes several other small-amplitude frequencies, including 0.2 Hz and 1.1 Hz. The vibration amplitude of ZY3-01 decreased when one of its solar panels broke. There is noise of varying frequencies in the satellite platform vibration as well. The model showed that the vibration of ZY3-01 is same as that of ZY3-02. The vibration frequency change of the two satellites is also similar, with a period of approximately 1 year. The vibration frequency change model improved and expanded on the traditional vibration detection analysis, taking into account variations overtime. The platform vibration of ZY3-01 is almost the same as that of ZY3-02, although there are some improved loads in ZY3-02 compared with ZY3-01, and vibration is influenced by the loads carried by the platform. The vibration frequency change period showed almost no variation after one of ZY3-01’s solar panels broke on 15 October 2015. As the vibration frequency change period difference between ZY3-01 and ZY3-02 is very small, it may be influenced by other outside factors.
Footnotes
Declaration of conflicting interests
The author(s) declared no potential conflicts of interest with respect to the research, authorship, and/or publication of this article.
Funding
The author(s) disclosed receipt of the following financial support for the research, authorship, and/or publication of this article: National Natural Science Foundation of China; 41571440.