





Abstract
This article reports the development of a Bayesian method for assessing the damage status of railway ballast under a concrete sleeper based on vibration data of the in situ sleeper. One of the important contributions of the proposed method is to describe the variation of stiffness distribution of ballast using Lagrange polynomial, for which the order of the polynomial is decided by the Bayesian approach. The probability of various orders of polynomial conditional on a given set of measured vibration data is calculated. The order of polynomial with the highest probability is selected as the most plausible order and used for updating the ballast stiffness distribution. Due to the uncertain nature of railway ballast, the corresponding model updating problem is usually unidentifiable. To ensure the applicability of the proposed method even in unidentifiable cases, a computational efficient Markov chain Monte Carlo–based Bayesian method was employed in the proposed method for generating a set of samples in the important region of parameter space to approximate the posterior (updated) probability density function of ballast stiffness. The proposed ballast damage detection method was verified with roving hammer test data from a segment of full-scale ballasted track. The experimental verification results positively show the potential of the proposed method in ballast damage detection.
Keywords
Introduction
Vibration-based damage detection of sleeper–ballast system
Railway ballast, which retains the sleepers and rails in their required positions against forces from different directions, is a crucial component of the ballasted railway track system (see Figure 7 for a segment of ballasted track). Damage to the ballast causes uneven support of the sleepers, which increases the likelihood of track settlement and changes in the geometry of the track. These changes may result in rail buckling and derailment. Chinese Railways (CR) statistics have revealed that about 75% of the daily maintenance work on track structures is performed due to railway ballast deterioration. 1 Regular visual inspection is common practice of track maintenance adapted by industry. However, it is difficult to visually identify the ballast damage under the concrete sleeper without lifting up the sleeper. The literature reviews regarding non-model based methods of detecting ballast damage are available in Lam et al.2,3 and are not repeated here. It is clear from the reviews that the existing methods to detect the ballast damage only focus on the ‘average’ stiffness of a given layer of substructure materials, but not the distribution of stiffness within a layer and it is difficult to locate the ballast damage. Therefore, there is a great demand of a practical method for non-destructive evaluation of ballast under a sleeper.
Theoretically, degradation of the ballast reduces the stiffness of the ballast in supporting the sleeper. When the stiffness distribution of the in situ sleeper is altered, its vibration characteristics change. This change can be reflected by variations in the modal parameters of the in situ sleeper. Therefore, it is possible to calculate the reduction in the ballast stiffness on the basis of the natural frequencies and the mode shapes of the in situ sleeper. The detection of damage by solving an inverse problem (i.e. the calculation of a set of model parameters of a system based on a set of measured responses) is not new for civil engineering structures. 4 For example, the detection of cracks on beam and plate types of structures,5,6 the assessment of operational condition of bridges 7 and the structural damage detection of a benchmark through the vibration data.8,9 Comprehensive reviews in vibration-based damage detection for civil engineering structures are available in references.10,11 However, the extension of this idea to the detection of damage for railway ballast is new and challenging.
In 2012, Lam et al. 2 proposed the use of the measured modal parameters of an in situ concrete sleeper for ballast damage detection following a deterministic approach. The results of the numerical and experimental verification were very encouraging and showed that the modal parameters of in situ sleepers were sensitive to ballast damage. One of the major barriers in applying this method 2 in real-life applications is the high degree of uncertainty associated with the mechanical properties of the rail–sleeper–ballast system (especially for the layers of irregular ballast particles), and the uncertainties induced from the modelling error and measurement noise. To quantify this uncertainty, a probabilistic method was developed in Lam et al. 3 for determining the posterior probability density function (PDF) of the ballast stiffness using the Bayesian statistical system identification framework.
Bayesian inference can update the uncertainties in the values of the model parameters12,13 and provide a feasible identification solution for the purpose of structural health monitoring and crack growth prediction.14,15 The original formulation of the Bayesian framework based on the measured time-domain data was developed by Beck and Katafygiotis 16 in 1998. In 2000, it was extended to use measured modal data. 17 Recently, Au et al. 18 combined the Bayesian modal identification method and the Bayesian model updating method for the model updating of a coupled-slab system based on a set of ambient field test data. 19 In this article, the Bayesian statistical system identification framework based on modal data is extended for the purpose of identification of the railway ballast damage.
Challenges in vibration-based damage detection of sleeper–ballast system
Modelling of ballast stiffness distribution
Previously, the sleeper–ballast system was modelled as a Timoshenko beam on an elastic foundation with several discrete ballast regions and the ballast stiffness in a given region was assumed to be a constant2,3 (see Figure 1 for the discrete ballast model). Because the variation in the ballast stiffness is continuous along the sleeper in real situations, the discontinuous ‘jumps’ in the ballast stiffness at the interfaces between two discrete regions are ‘artificial’. This artificial modelling error induces the discrepancy between the model-predicted and measured modal parameters and reduces the reliability of the results. In this article, a newly developed polynomial modelling method is proposed to avoid the problem of discontinuous jumps.
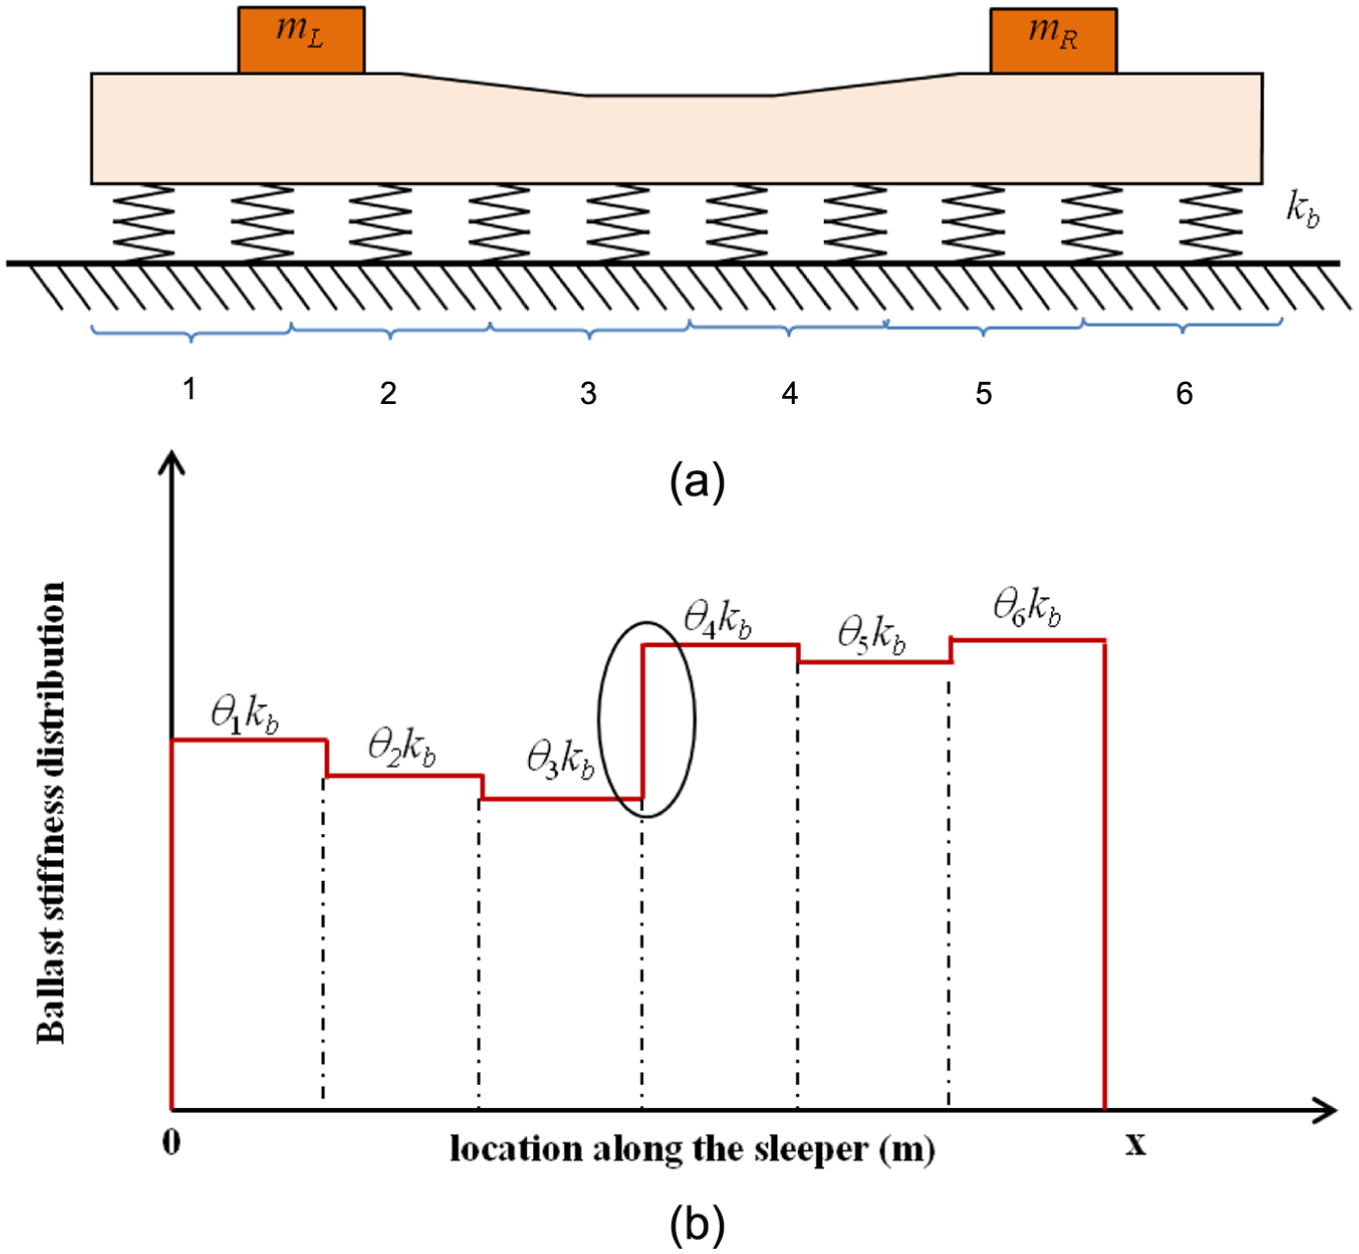
An example of the discrete modelling method: (a) discrete ballast regions (extracted from Lam et al. 2 ) and (b) ballast stiffness distribution.
Unidentifiability in model updating
Model updating is a popular method to identify the most probable set of model parameters conditional on a set of measured data under an assumed class of models.20,21 Following the Bayesian framework, the model updating problem is considered to be locally identifiable when the posterior PDF of the uncertain parameters can be approximated by a weighted sum of multivariable Gaussian distributions. 16 Depending on the quantity and quality of the measurements and the complexity of the class of models, model updating problems may not necessarily be identifiable. The definition of unidentifiable cases and the transition from identifiable to unidentifiable model updating problems are extremely complicated, and they were comprehensively studied by Katafygiotis and Lam 22 in 2002. It must be pointed out that the Bayesian ballast damage detection method proposed in Lam et al. 3 is applicable only for locally identifiable model updating problems. In general, a model updating problem may become unidentifiable 22 when the model class has great complexity (when other factors are unchanged) and a limited measurement data is available. The objectives of this article are to overcome these limitations and develop a new and more general ballast damage detection method that is applicable even when the model updating problem is not locally identifiable, that is, handling the conditions, such as (1) model class with great complexity, (2) limited measured data and (3) high level of measurement noise. To achieve this goal, the enhanced Markov chain Monte Carlo (MCMC) simulation 23 is employed and extended in this study for model updating and model class selection of the rail–sleeper–ballast system.
MCMC methods have been popular for sampling from a complicated probability distribution based on the construction of a Markov chain whose limit distribution is the target probability distribution.24,25 These methods have recently been adopted for Bayesian model updating. 26 It has been demonstrated that samples generated by MCMC can be used to approximate the posterior PDF of uncertain parameters regardless of the identifiability of the model updating problem. In 2007, Ching and Chen 27 derived the transitional Markov chain Monte Carlo (TMCMC) method for Bayesian model updating and model class selection with particular consideration of complicated PDFs that have multiple modes. The TMCMC method was numerically verified with shear building data and its computational efficiency was demonstrated. To efficiently explore the parameter space, the user must appropriately determine the number of sampling levels; this issue is still a challenging research problem for the application of MCMC methods in model updating, especially for the purposes of damage detection. Recently, an enhanced MCMC method that focuses on the calculation of an appropriate number of sampling levels was developed and successfully verified through field test data from a coupled-slab system. 23 One of the main contributions of this study is to extend the formulation of the MCMC method in Lam et al. 23 for Bayesian model class selection, which forms an important element in the proposed ballast damage detection method. Following the MCMC-based Bayesian method, the railway ballast stiffness distribution under the sleeper can be estimated together with the corresponding posterior uncertainties, and the ballast damage detection results can be well exhibited using the graphical presentation, which can directly display valuable information about the uncertainties to inspectors and engineers during their visual inspection.
Proposed ballast damage detection method
The proposed method integrates the newly developed polynomial modelling method with the MCMC-based Bayesian model updating and model class selection methods. Due to the modelling error induced by the discrete modelling method, 3 the polynomial modelling method is developed in this article to capture the ballast stiffness distribution using Lagrange polynomials. 28 In this study, the order of polynomial to be employed in modelling the ballast stiffness distribution is calculated by extending the Bayesian model class selection method in Beck and Yuen. 29 According to past experience, some possible model classes are relatively complex and the corresponding model updating problems are not locally identifiable. Therefore, the model class selection formulation in equation (3) of Beck and Yuen, 29 which works in globally identifiable cases, cannot be directly employed in this case. In the proposed method, the formulation in Beck and Yuen 29 was extended such that the probability of a model class can be approximated using the set of samples generated by MCMC. Once the most plausible class of models is selected, the posterior PDF calculated by the MCMC samples can be used to quantify the damage status of the ballast under the sleeper.
Polynomial modelling of ballast stiffness distribution
As verified by vibration data from a full-scale test panel, the in situ sleeper can be modelled as a Timoshenko beam located on an elastic foundation and the two rails are modelled as two independent masses on the beam. 3 Figure 1(a) shows an example that divides the ballast under the sleeper into six regions. Assuming the nominal value of ballast stiffness to be kb, the ballast stiffness in a given region is equal to the non-dimensional factor of that region multiplied by the nominal value. Figure 1(b) shows an example of the updated ballast stiffness distribution. The discrete modelling method is simple, but it may not be able to capture the ‘real’ ballast stiffness distribution because the ballast stiffness in a given region is a constant, resulting in a jump discontinuity in ballast stiffness at the interface between two regions (see Figure 1(b)). This jump discontinuity does not exist in reality and is a source of a modelling error that will affect the performance of the proposed method in ballast damage detection.
To overcome the jump discontinuity problem, the ballast stiffness distribution under the sleeper should be described by a class of continuous functions. One simple and logical choice of continuous functions for this purpose is the family of polynomials with different orders. 30 Figure 2(a) illustrates the idea by approximating the ballast stiffness distribution by a polynomial for a given order, say, the third-order polynomial (i.e. θ1x 3 + θ2x2 + θ3x + θ4 = 0). Because a polynomial is always a smooth function, the problem of jump discontinuity is avoided. The most straightforward way to use a polynomial as a class of models in model updating is to consider the polynomial coefficients (i.e. θ1 to θ4 in this illustrative example) as uncertain parameters (as in Hu and Lam 30 ). However, unlike the discrete modelling method (for which the uncertain parameters are the ballast stiffness values), the polynomial coefficients are nonparametric. The identified polynomial must be plotted before one can understand the distribution of the ballast stiffness. Furthermore, the MCMC-based model updating method calculates the posterior PDF of the polynomial coefficients, which cannot provide engineers and researchers with any direct insight into the posterior uncertainties of the ballast stiffness distribution. An additional step is required to map this information to the posterior uncertainties of the ballast stiffness distribution. To overcome this difficulty, the Lagrange polynomial is used in the polynomial modelling method to interpolate a polynomial by the ballast stiffness values at a discrete number of points under the sleeper.
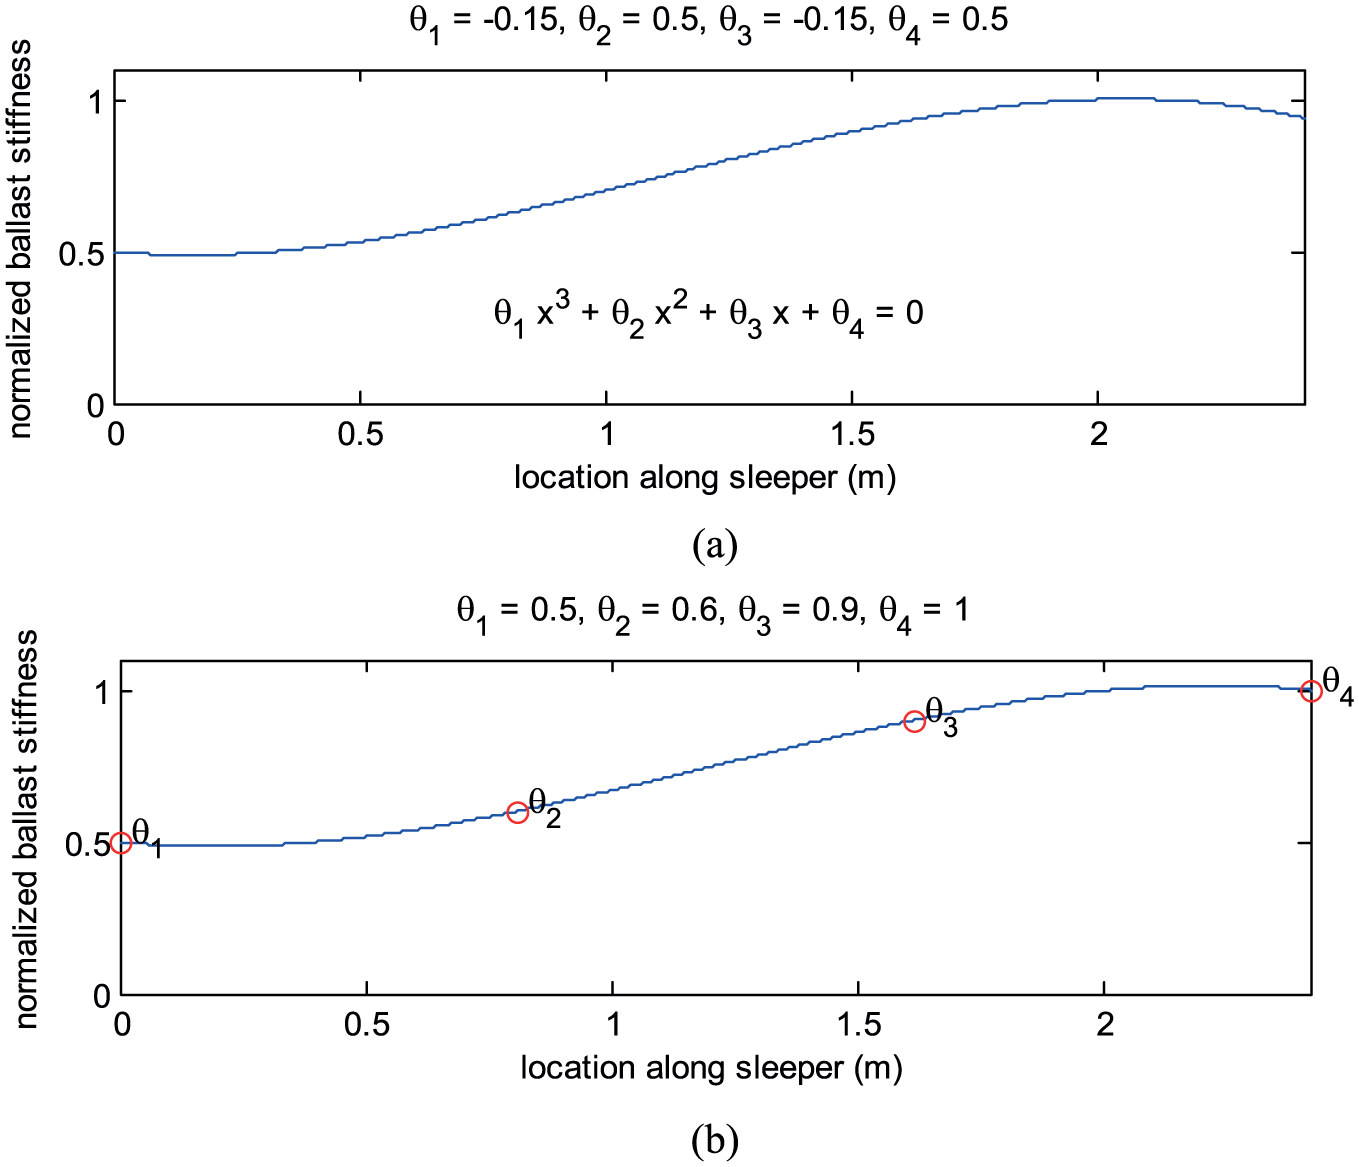
The polynomial modelling method, (a) using polynomial coefficient as uncertain parameters and (b) Lagrange polynomial: ballast stiffness value as uncertain model parameters.
The concept of polynomial modelling by Lagrange polynomial is illustrated by an example of a third-order polynomial in Figure 2(b). Four points are used to represent a third-order Lagrange polynomial. The most logical way to locate the four points under the sleeper is to distribute them uniformly (i.e. to divide the sleeper into three equal parts as shown in Figure 2(b)). The nominal value of the ballast stiffness is kb and a non-dimensional factor is assigned to the ballast stiffness at each point. The product of the nominal value and θ1 to θ4 are the values of ballast stiffness at the four points. This concept can be easily extended to a general case of a polynomial of order N. In this case, the sleeper is divided into N equal parts by N + 1 points and the ballast stiffness factors at these N + 1 points are the uncertain parameters for model updating.
Assuming that the length of the sleeper is equal to l, the coordinates of these N + 1 points are (0, θ1), (l/N, θ2), (2l/N, θ3),…, ((j − 1)l/N, θj),…, (l, θN + 1) for j = 1,…, N + 1. With this point arrangement rule, all data points are different and the Lagrange polynomial, L(x), can be formulated as a linear combination as 28
where
Finally, the
where θ1, θ2,…, θN + 1 are the uncertain parameters to be updated through the proposed MCMC-based Bayesian model updating method. Equation (1) is used to formulate the Lagrange polynomial for given ballast stiffness values at discrete points.
In general, a polynomial of higher order has a greater ability to capture more complicated variations (or fluctuations) in the ballast stiffness along the sleeper. Therefore, the selection of an appropriate order (or the most plausible class of models) is essential for the success of ballast damage detection.
The concept of model class in the polynomial modelling method based on Lagrange polynomial is discussed before introducing the model class selection method. Figure 3 shows a series of possible classes of models for capturing the ballast stiffness distribution under the sleeper with increasing model complexity (the simplest class at the top). The model class
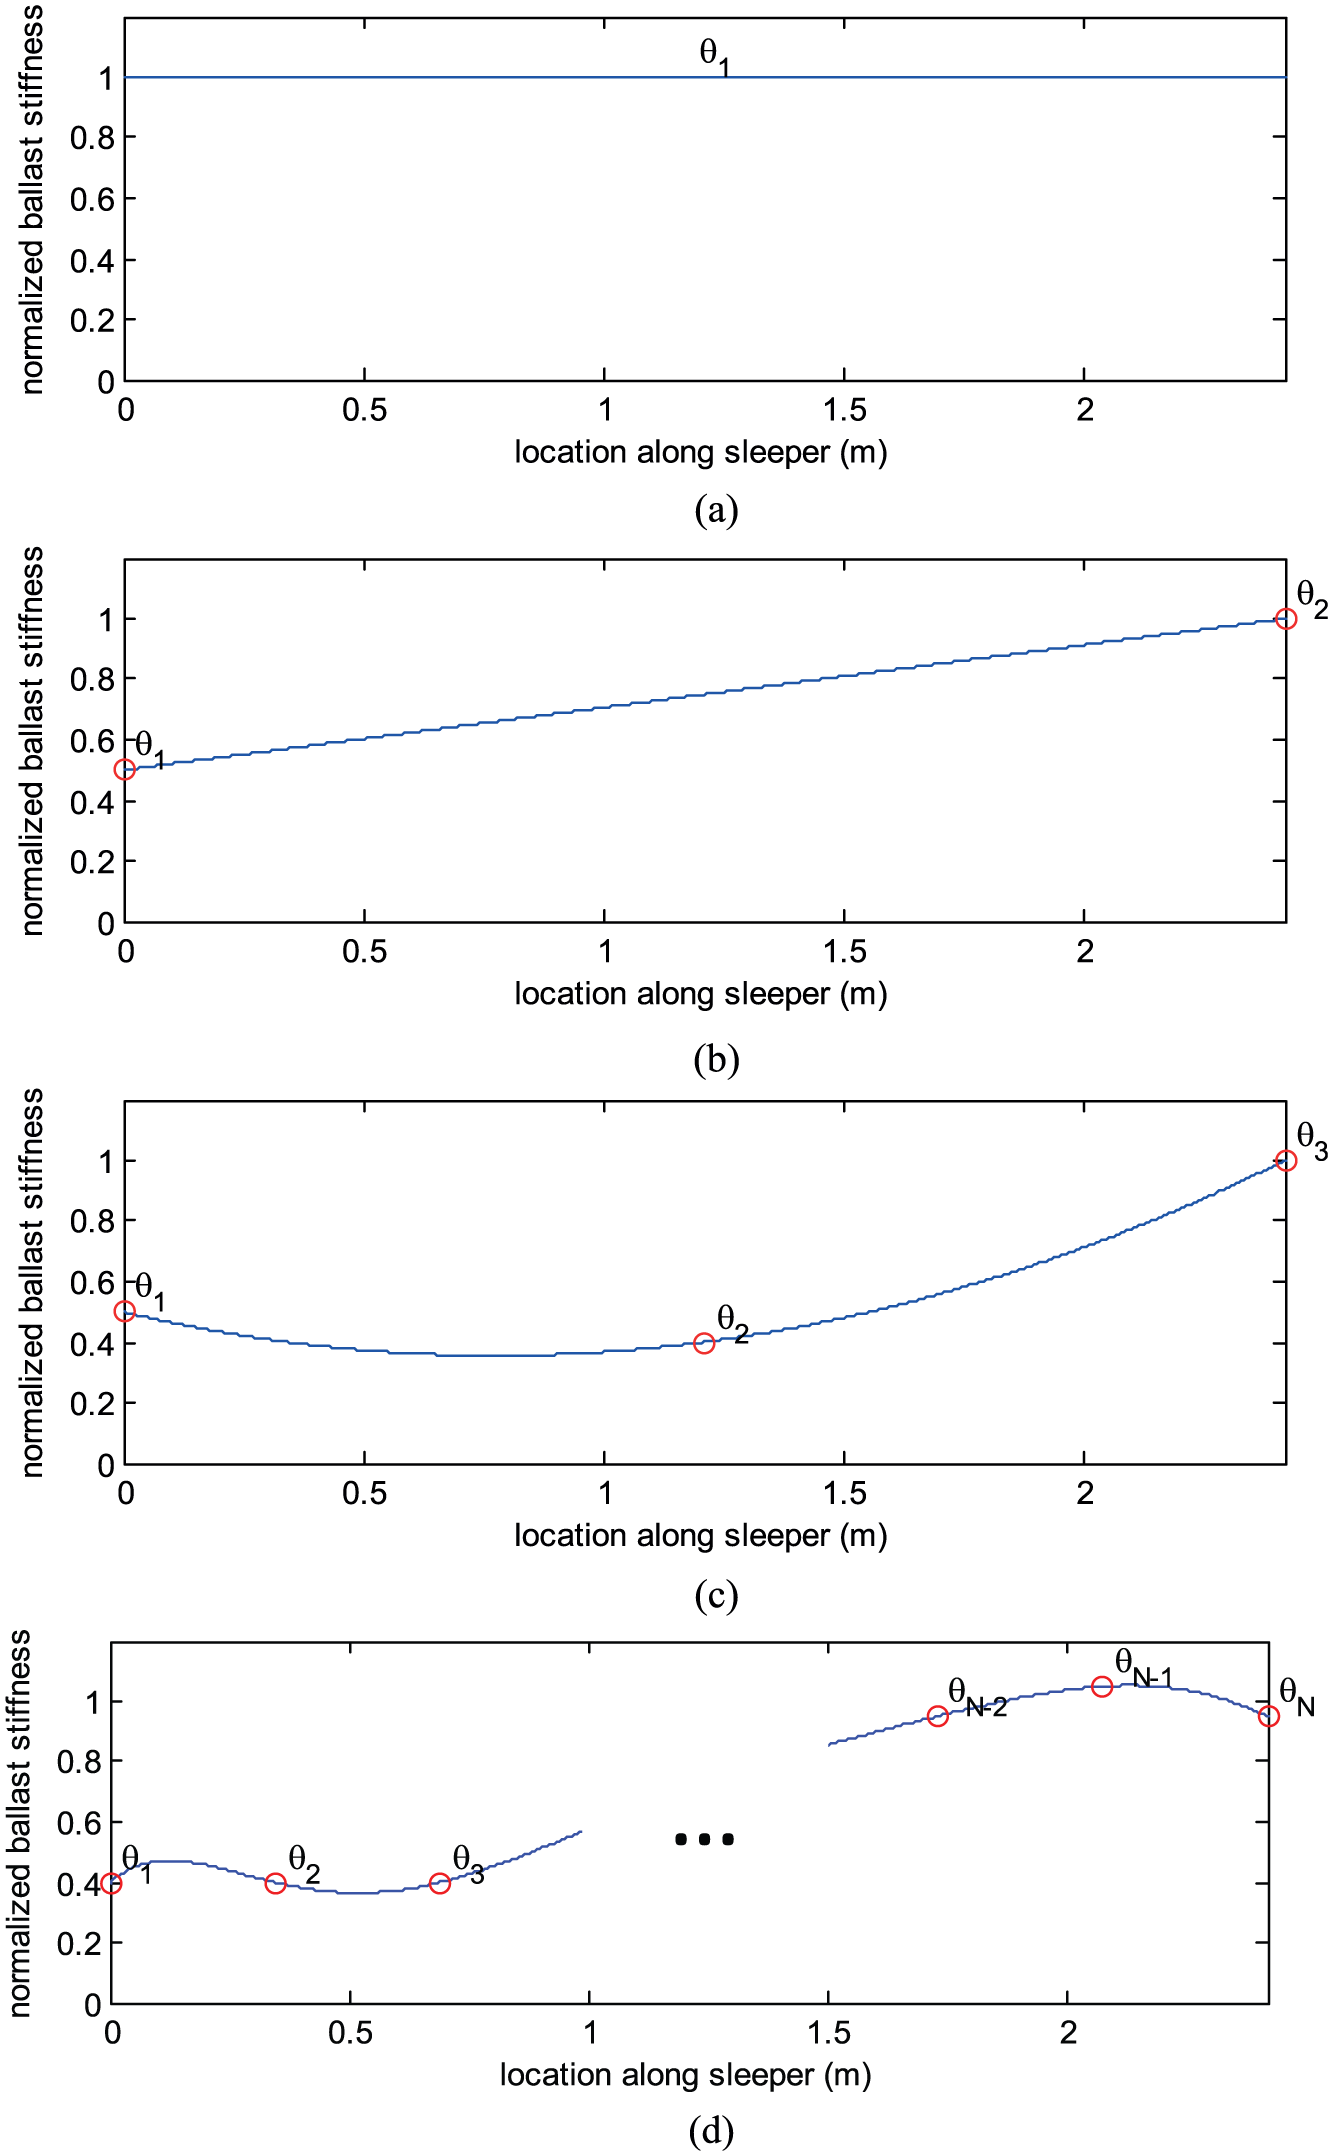
Different classes of polynomial models: (a) model class
Aside from the scaling factors for the ballast stiffness, several additional uncertain parameters are considered to further reduce the level of modelling error of the class of models. A non-dimensional scaling factor θE is used to scale the nominal value of Young’s modulus of the concrete sleeper. This is mainly due to the prestress of the concrete sleeper and also the authors’ lack of access to the material properties of the concrete sleeper, so the nominal value is the best estimation available. The two additional uncertain parameters are the left and right rail masses, θL and θR. As a result, a total of N + 3 uncertain model parameters are considered for the model class
The finite element method is used to model the rail–sleeper–ballast system in this study. The formulation of the element stiffness matrix of a Timoshenko beam element on an elastic foundation can be found in Lam et al. 3 and Krenk. 31 Because of the thickness of the sleeper, the effect of shear deformation cannot be neglected, especially in the vibrations of higher modes, 2 and therefore, the Timoshenko beam formulation is used instead of the relatively easy Euler beam formulation. The consistent mass matrix 32 is used in the dynamic analysis. The element stiffness and mass matrices are used to assemble the system stiffness and mass matrices. The system’s modal parameters, such as the natural frequencies and mode shapes, can be calculated by solving the corresponding eigenvalue problem.
MCMC-based Bayesian model updating
For a given model class
where
where the subscript a denotes the mode index, r is the total number of modes to be considered in the model updating process,
When the model updating problem is globally or locally identifiable, the posterior PDF in equation (2) can be approximated by a multivariable Gaussian PDF. 16 However, for the purpose of model class selection, model updating for different model classes ranging from simple to complex is necessary for finding an appropriate model class such that it can well fit the measured data, without over-fitting the noise and/or error parts of the measurements. For a given set of measurements, the model updating problem may become unidentifiable when the class of models is too complex. In this situation, the posterior PDF becomes very complicated (as shown in Katafygiotis et al. 34 ) and cannot be accurately approximated by a multivariable Gaussian distribution.
A newly developed MCMC-based Bayesian model updating method was proposed by the authors in Lam et al. 23 and Beck and Au 26 to approximate the posterior PDF and calculate posterior uncertainties by generating samples in the important regions (i.e. the regions in the parameter space with high probability). The MCMC method in Lam et al. 23 is used in this article for model updating. The main idea of generating samples by MCMC is to perform the sampling at multiple levels with a series of bridge PDFs to ensure that the samples converge to the important regions. In the proposed method, the bridge PDFs are constructed according to equation (2) at each level in such a manner that the covered regions decrease gradually and move towards the important region of the posterior PDF.
For the completeness of this article, the MCMC algorithm for model updating is briefly summarized in the flowchart in Figure 4. In the figure, gr denotes the number of required sampling levels. A is an algorithm parameter that controls the change rate of the bridge PDFs between two successive levels. To sample with the MCMC algorithm, in level 1, Nss samples of the uncertain parameter
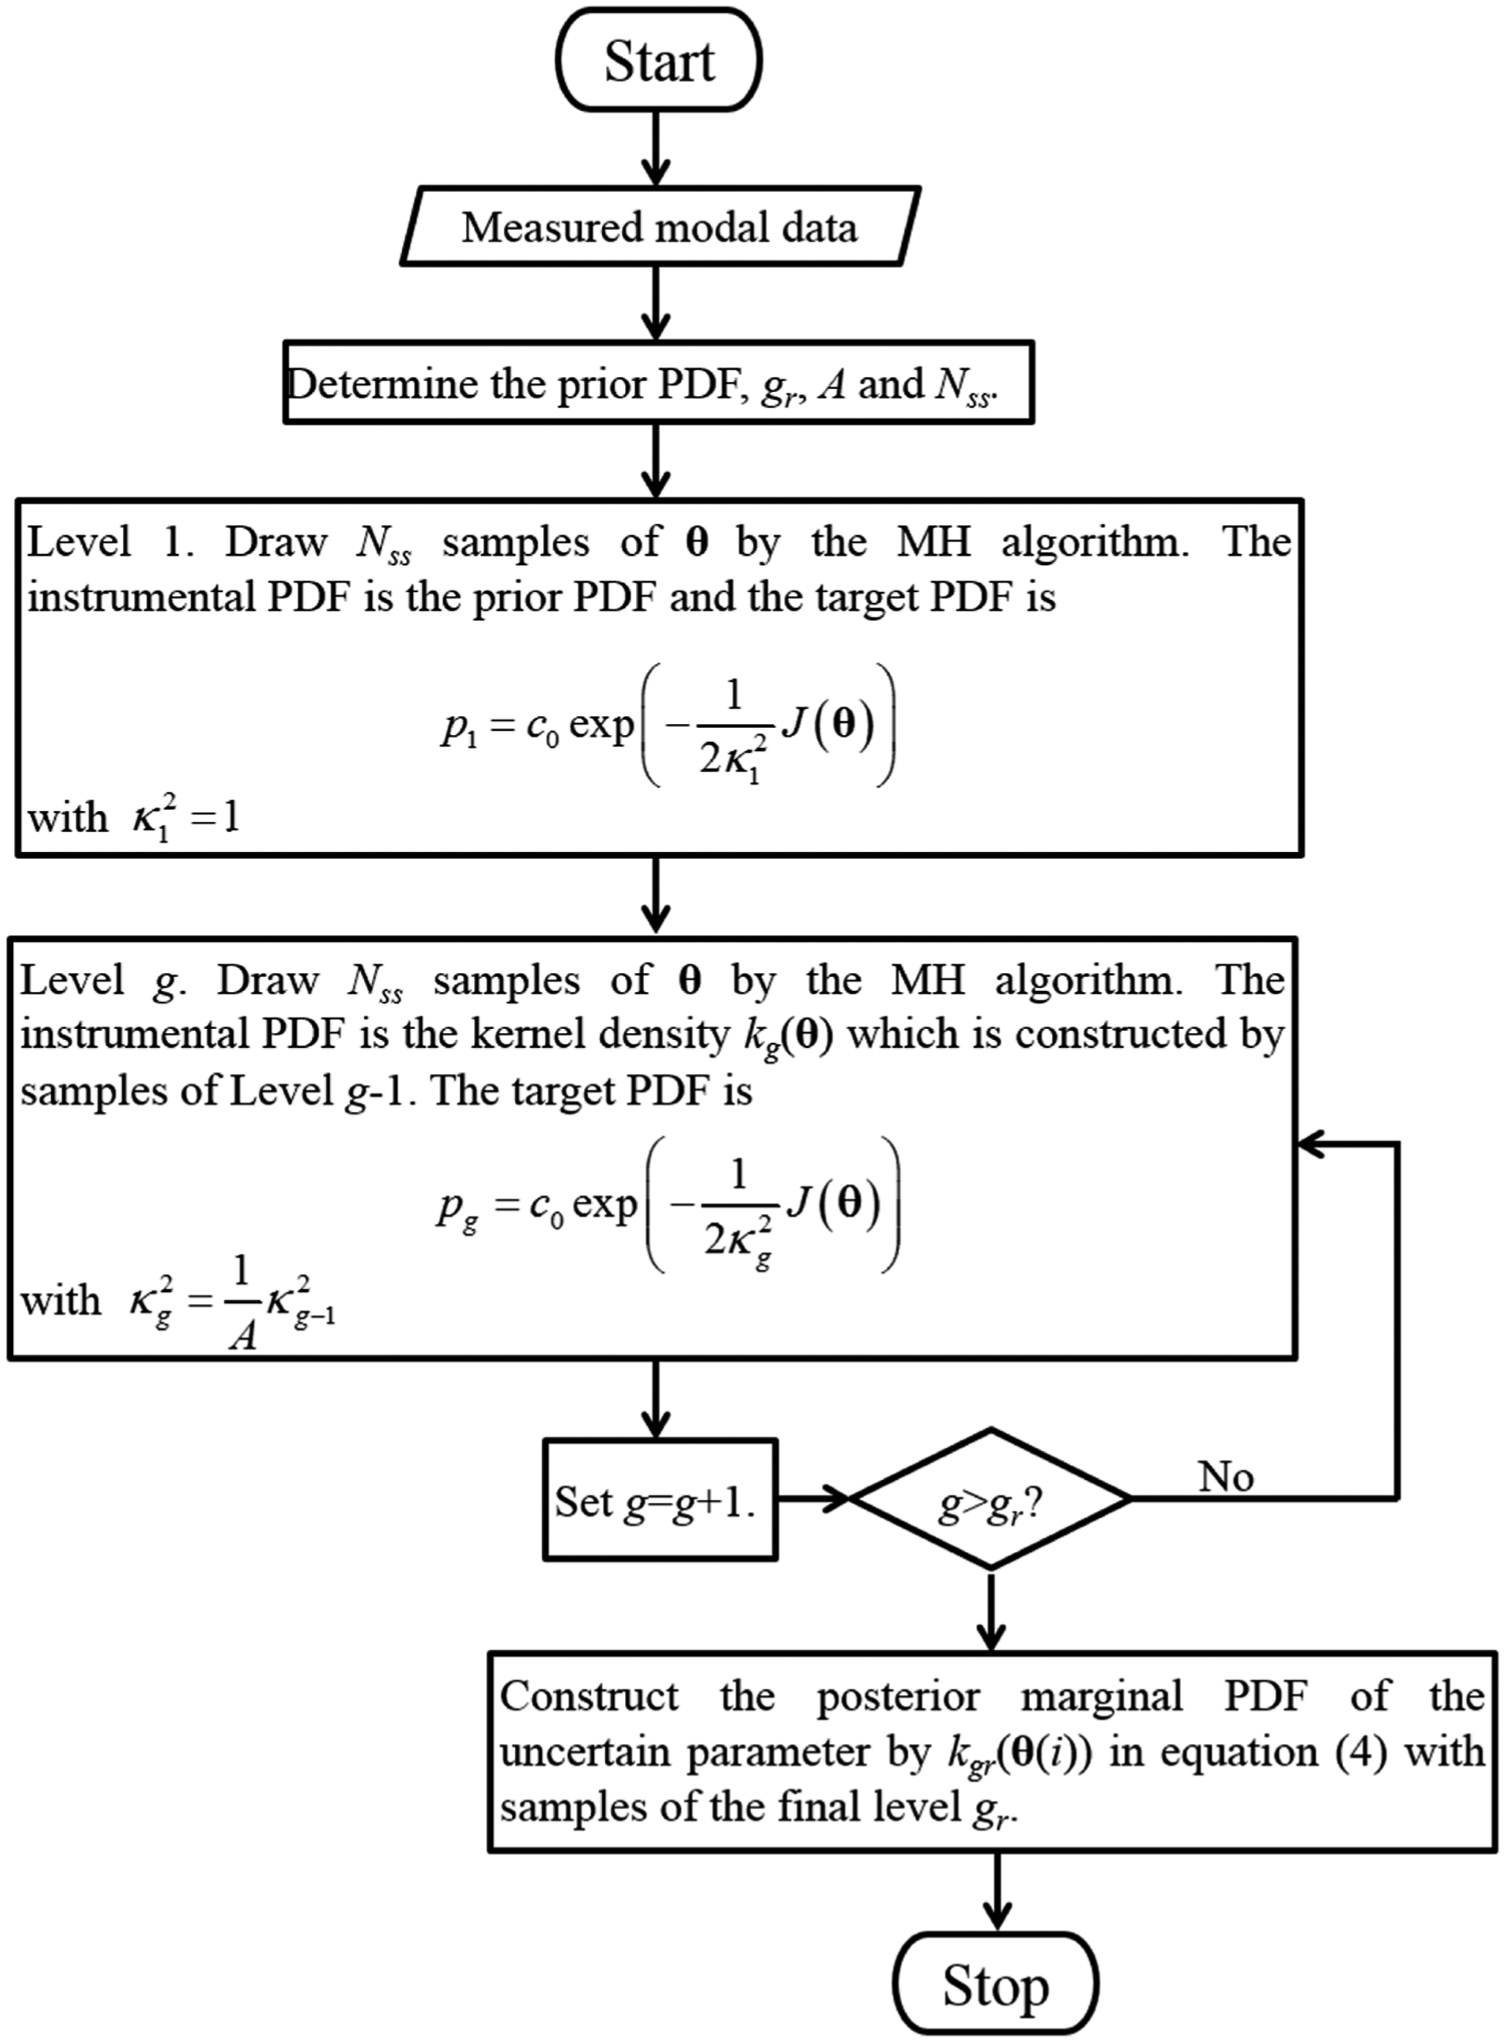
Procedures of the MCMC algorithm.
The posterior marginal PDF is the weighted sum of Gaussian PDFs
MCMC-based Bayesian model class selection
The order of polynomials used has a significant effect on the performance of model updating. As illustrated in Figure 3, a zero-order polynomial can only capture the ballast stiffness distribution in the undamaged situation. The higher the order, the more complicated the ballast stiffness distribution is captured. Instead of deciding the order in an arbitrary manner or following ad hoc rule-of-thumbs, the probability of a list of possible polynomial orders (i.e. model classes) conditional on a set of measurements is calculated by following the Bayesian approach. 29 The model class with the highest probability is considered to be the most plausible model class and is used for the purpose of ballast damage detection.
Considering the situation with Nm possible model classes, the probability of each model class conditional on the set of measurements is, p(
where
To implement this idea, equation (5) is rewritten according to the concept of importance sampling, 38 as
where the posterior PDF is introduced such that the evidence can be approximated by the following summation
where the superscript h denotes the sample index. When equation (7) is directly implemented, the PDF values are evaluated at discrete samples. However, the numerical value of the goodness-of-fit function J(
The right-hand side of equation (8) is part of the expression in the integral in equation (6). Since this part of the expression is independent of
In equation (9), the integration of the posterior PDF over the parameter space is equal to unity by definition; therefore, equations (8) and (9) are equivalent. Taking the natural logarithm of equation (8) and making use of equation (9) give
Approximating equation (10) using the MCMC samples gives
Instead of calculating the evidence, the logarithm of evidence is computed by equation (11) to avoid the computational problem. Readers are referred to Ching and Chen, 27 Cheung and Beck 39 and Muto and Beck 40 for more details about the Bayesian model class selection using stochastic simulation.
In general, a model class with greater complexity (i.e. with more uncertain model parameters) can have better fitting to the measurement, resulting in a higher likelihood value. According to equation (11), the logarithm of the evidence of a model class is not solely determined by the likelihood. It must be pointed out that the most plausible class of models cannot be obtained by the likelihood alone. In this study, the class of models to be selected is the one with the highest value of evidence among all the model classes considered. The selected model class, on one hand, is complex enough to provide a ‘good fit’ to the measurement data and, on the other hand, is simple enough that it will not ‘over fit’ the data.
MCMC-based ballast damage detection
In this section, the polynomial modelling method, MCMC-based Bayesian model updating and model class selection methods are integrated to form the proposed method of ballast damage detection, which is schematically illustrated in the flowchart in Figure 5. A set of vibration data (i.e. acceleration responses at a given degree-of-freedom under impact excitations at various degrees of freedom) is obtained from the target in situ sleeper (see process 1 in Figure 5). In the proposed method, inspectors or permanent way engineers can achieve this by a simple roving hammer test. The MODE-ID method
41
is used to identify the modal parameters, such as the natural frequencies and mode shapes, from the measured time-domain responses (see process 2 in Figure 5). The set of measurements
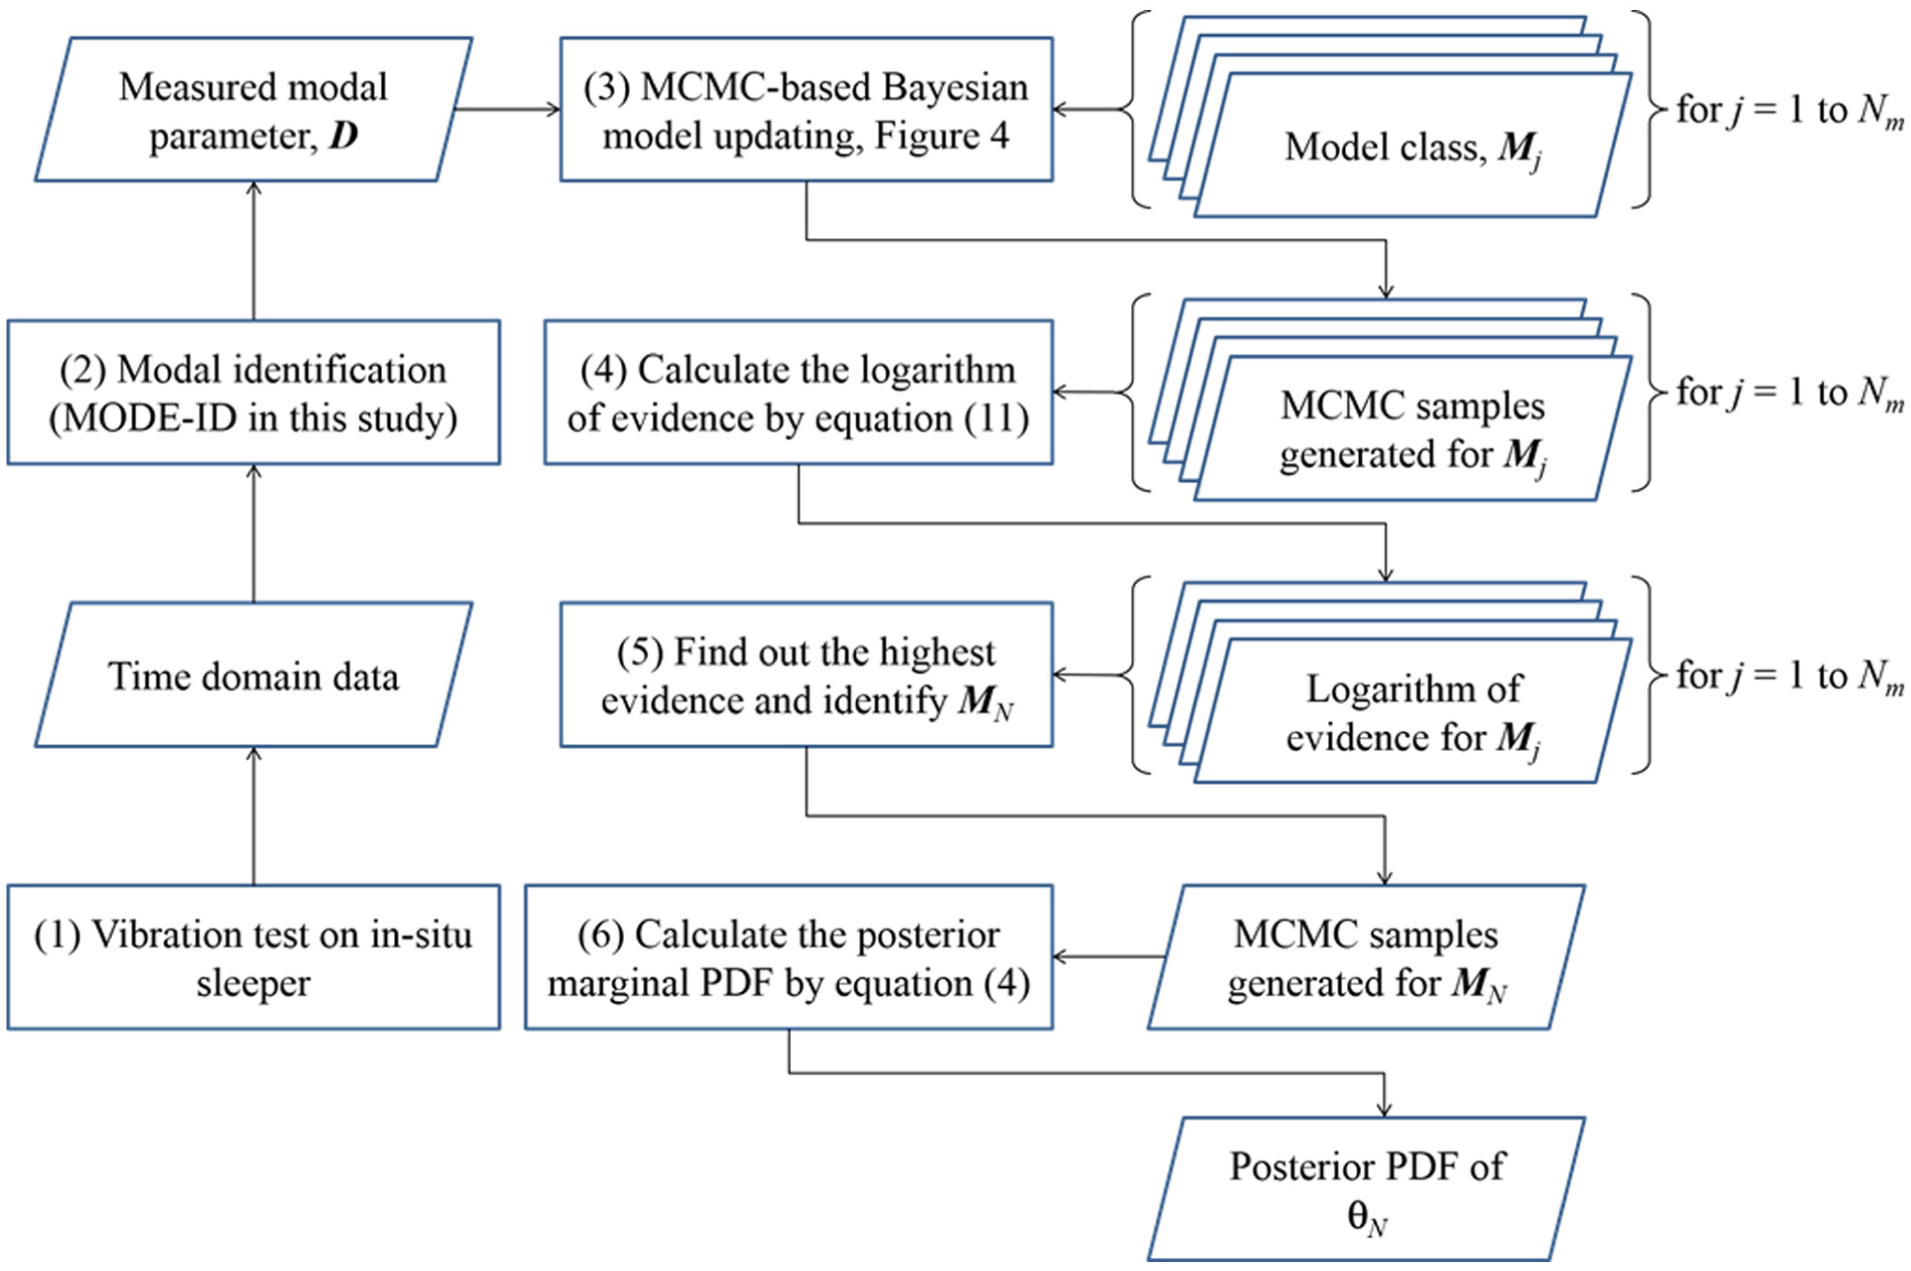
Flowchart of the proposed ballast damage detection method.
With different orders of polynomial, Nm model classes of the rail–sleeper–ballast system are formed (as discussed in section ‘Polynomial modelling of ballast stiffness distribution’). For each model class, the set of MCMC samples is generated on the basis of the set of measurements
According to the authors’ experience, in most cases, the posterior marginal PDFs of the ballast stiffness are similar to but not exactly the same as Gaussian distributions. The mean and standard deviation of each ballast stiffness parameter can be calculated and used to generate the ballast stiffness distribution using Lagrange polynomial.
A schematic figure is shown in Figure 6 to illustrate the idea of ballast damage detection following the proposed MCMC-based method. The solid line shows the posterior mean of the ballast stiffness distribution under the sleeper and the two dashed lines represent the upper and lower boundaries of one standard deviation from the mean. It is clear that the ballast under the left side of the sleeper is damaged, with a reduction in stiffness of approximately 40%. The upper and lower boundaries show the relatively small uncertainty of the identified ballast stiffness distribution, and hence, it reflects the great reliability of the ballast damage result.
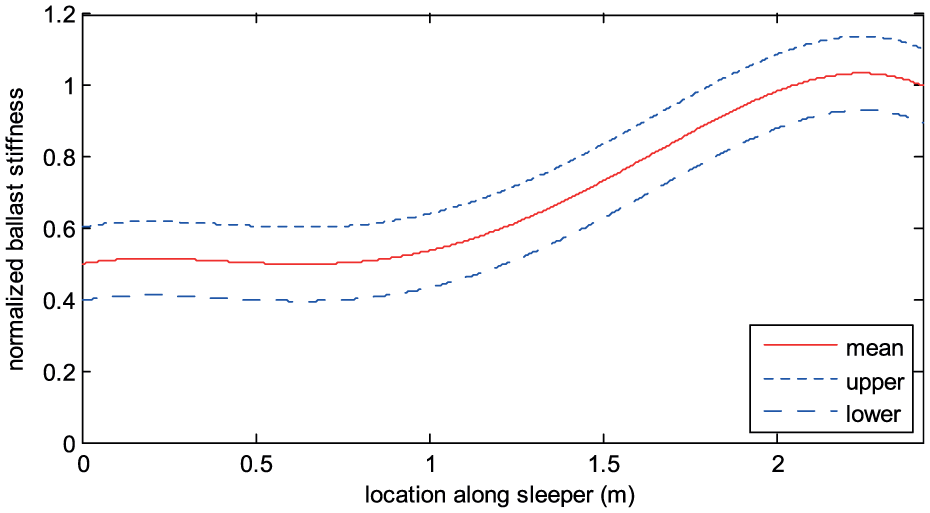
A schematic figure illustrating the result of the proposed ballast damage detection method.
Experimental verification using full-scale tests
To illustrate the proposed procedures and verify the proposed MCMC-based Bayesian method for detecting ballast damage, a full-scale indoor test panel consisting of eight in situ sleepers was built in the basement of a factory building in Kowloon Bay, Hong Kong (see Figure 7). The sleepers were labelled 1 to 8 from the bottom to the top of the figure. The ballasted track in the test panel was constructed according to Hong Kong MTR specifications. 42 Two UIC60 rails (with a mass density of 60 kg/m) were fastened to the concrete sleepers. The centre-to-centre spacing of the sleepers was 700 mm and the thickness of the granite ballast layer was 350 mm. The ballast was made of crushed rock aggregate of about 50 mm (ballast of this size is considered normal under the Hong Kong MTR specifications).
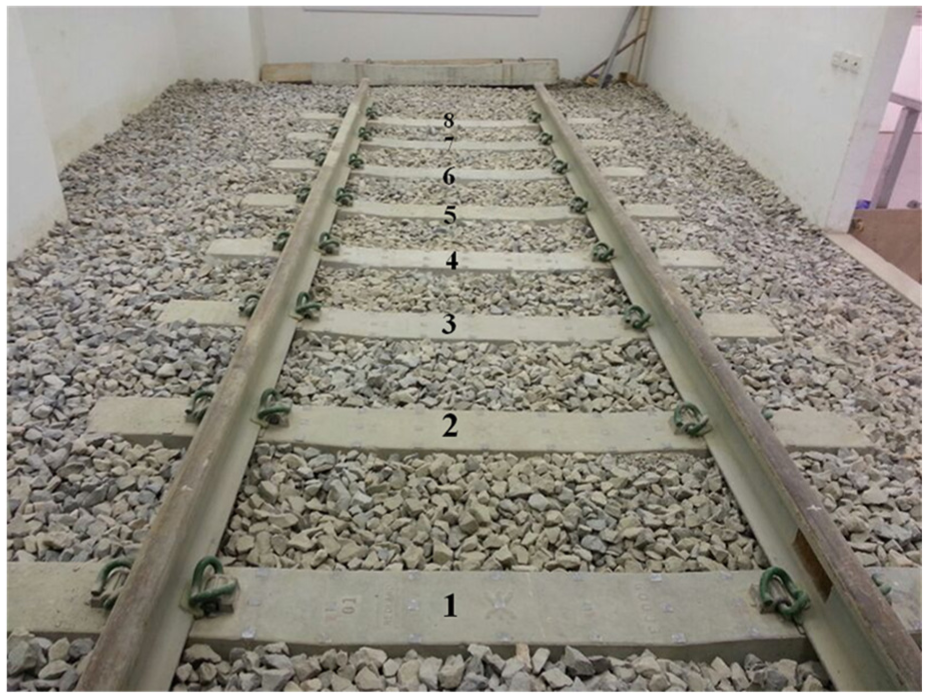
The full-scale indoor test panel at Kowloon Bay, Hong Kong.
Experiment description
In this study, ballast damage is defined as railway ballast degradation, which leads to a reduction in the ballast size, resulting in a decrease in the ballast’s packing level and stiffness in supporting the concrete sleeper. In the full-scale test panel, ballast damage was artificially simulated by replacing the normal-sized ballast (~50 mm) with smaller ballast (~15 mm). Sleepers 1–4 were undamaged and the artificial ballast damage was simulated under the middle of sleepers 5–8. To avoid boundary effects (the situation of the sleepers 1 and 4 is different from that of sleepers 2 and 3 (considered as undamaged), and the situation of the sleepers 5 and 8 is different from that of sleepers 6 and 7 (considered as damaged)), measured data from sleepers 1, 4, 5 and 8 were not used in model updating. In this article, data measured from sleepers 3 (undamaged) and 6 (damaged at the middle of the sleeper) were employed to demonstrate and verify the proposed method.
The equipment used in the roving hammer tests is listed in Figure 8. The target in situ sleeper was excited by an impact hammer that can be equipped with tips with different hardness (represented by different colours), as shown in Figure 8(c). A soft tip is suitable for exciting lower modes (e.g. modes 1 and 2), and a stiff tip is more appropriate for exciting higher modes (e.g. modes 3–5). One KISTELER-8776A50M3 accelerometer with sensitivity level about 100 mV/g as shown in Figure 8(a) was installed on the top surface of the concrete sleeper at a fixed location at the central line. The sensor was installed vertically to capture the system’s vertical vibration, and the impacts were applied at 11 considered locations (i.e. 11 measured degrees of freedom), as illustrated in Figure 9. The measured vibration responses from the sensor were transferred through the cables with special coating (see Figure 8(b)) and digitized using one NI-9234 module on a Compact DAQ-9178 chassis (see Figure 8(d)). For each sleeper, the entire measurement was divided into 11 parts. In each part, the excitation impact force was applied to a given measured degree of freedom, as shown in Figure 9. The measurement duration for each part was set to 20 s with a sampling frequency of 6400 Hz. During the measurement, the impact forces were applied one by one at an interval of about 1–2 s. As a result, more than 10 impulses were recorded in each part of the measurement.
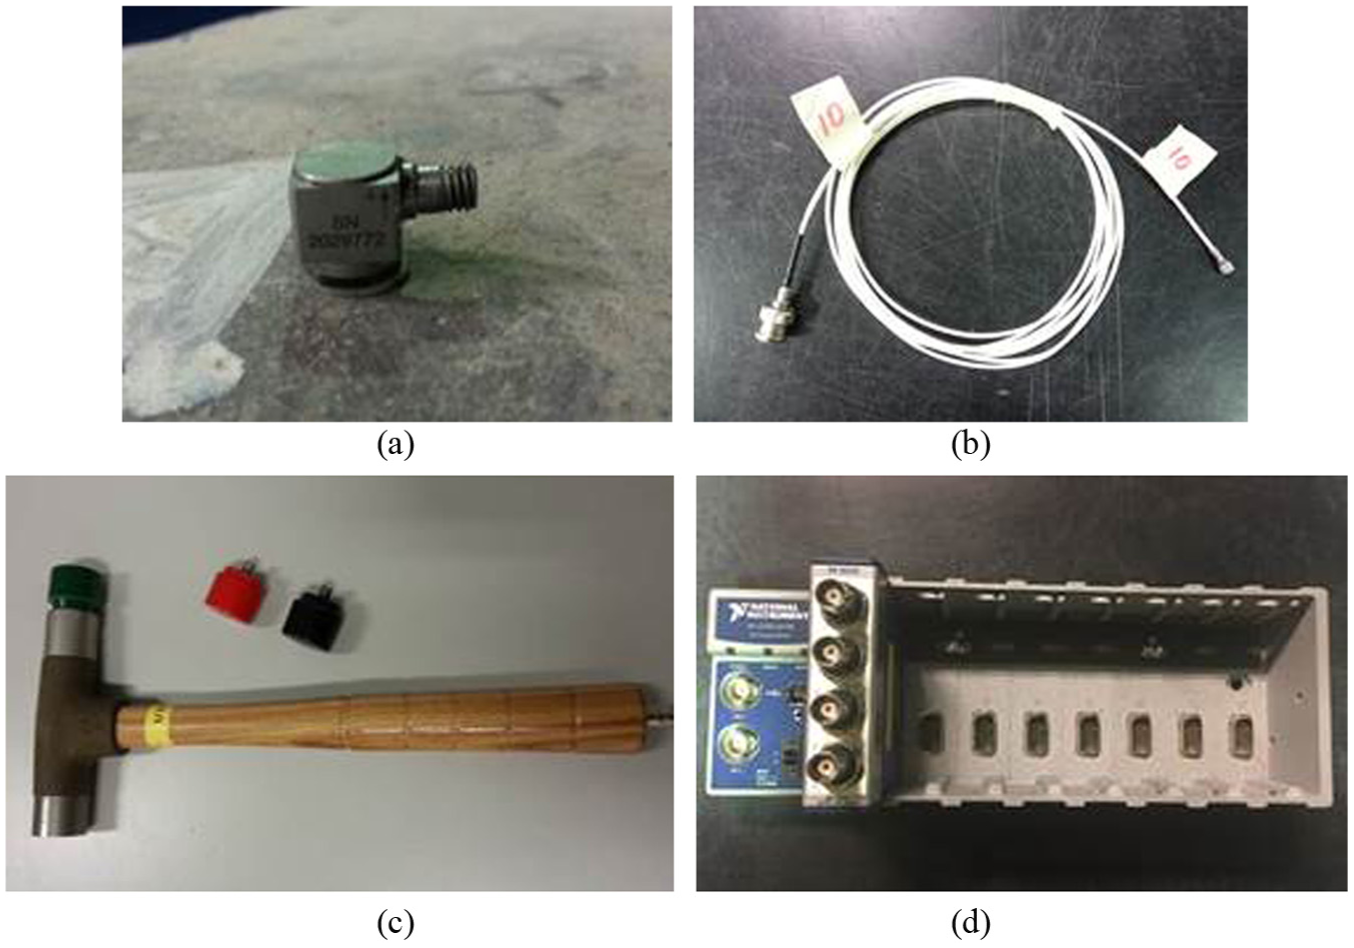
List of equipment for the impact hammer test: (a) KISTELER accelerometer, (b) cable with special coating, (c) impact hammer and (d) one NI-9234 module installed on a Compact DAQ-9178 chassis.
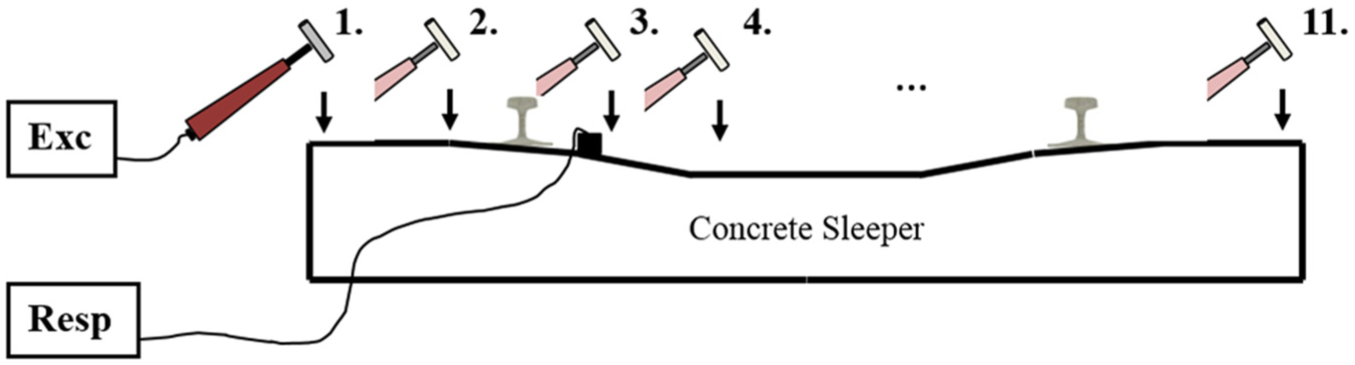
Roving hammer test arrangement.
Modal identification
A set of measured time-domain data is shown in Figure 10. The time-domain responses were transformed to the frequency domain via fast Fourier transformation. The modal parameters, such as the natural frequencies and mode shapes, were identified by MODE-ID. 42 Due to the space limitation, detail procedures for obtaining a set of measured natural frequencies and mode shapes are not presented, and interested readers are redirect to Lam et al.2,3 The first five modes were identified with high accuracy and were used in ballast damage detection; the natural frequencies of the first five modes for both undamaged and damaged cases were summarized in Table 1. It is clear from the table that the ballast damage in general reduces the natural frequencies of the in situ sleeper. The first two modes are very sensitive to the ballast damage (with over 30% reduction in natural frequency), while mode 3 can also be considered as sensitive (with about 10% reduction in natural frequency). In this case study, modes 4 and 5 are not sensitive to the ballast damage.
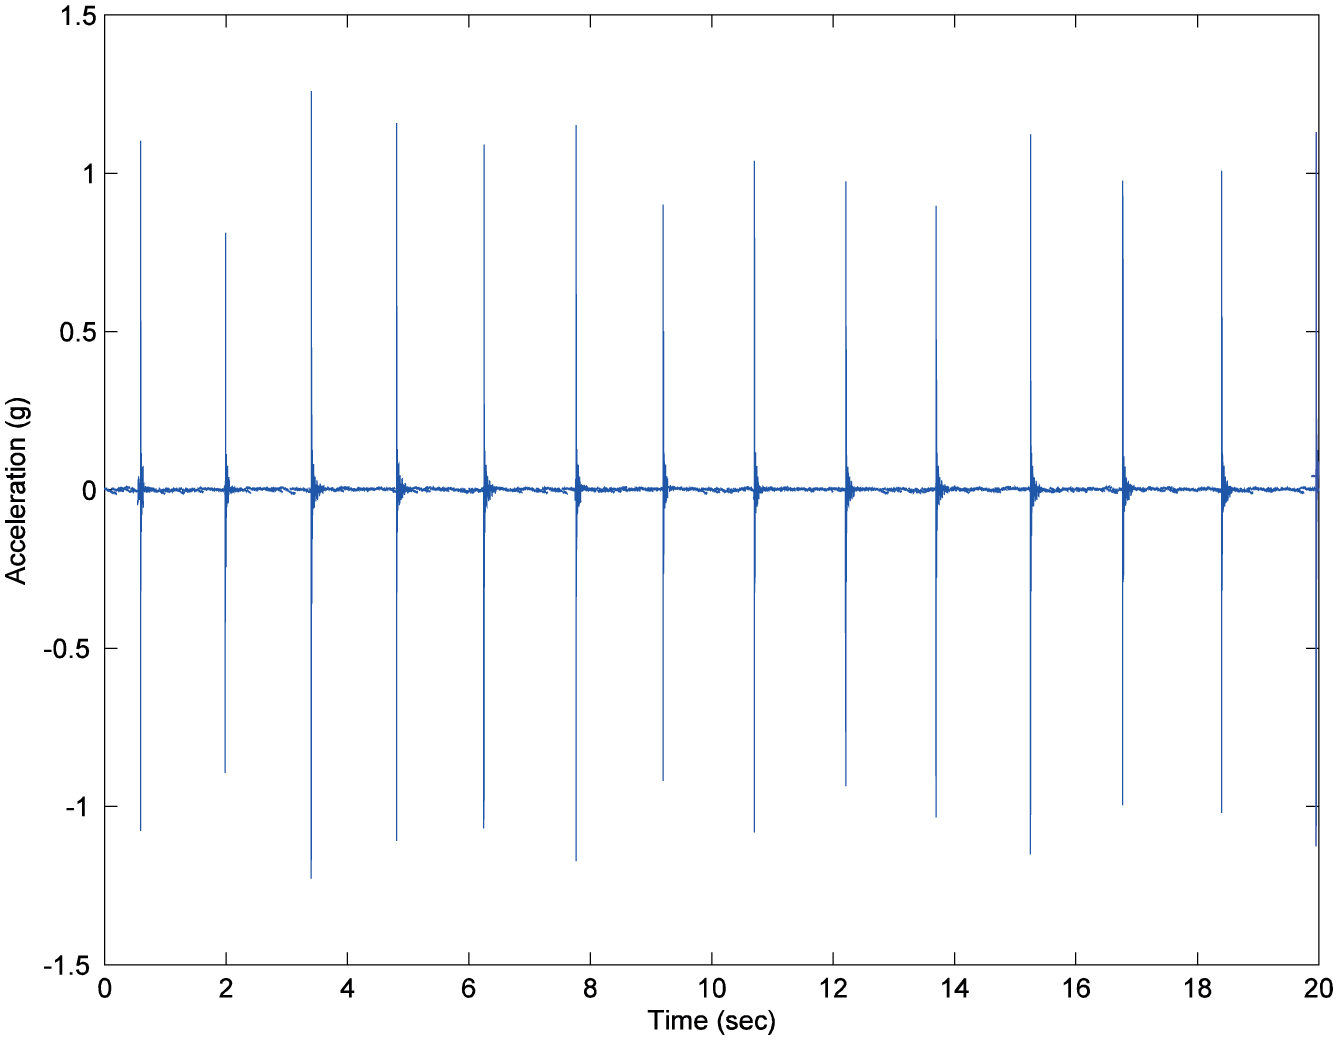
A typical time-domain response.
Natural frequencies for the undamaged (sleeper 3) and damaged (sleeper 6) cases (Hz).

Lagrange polynomials were used in the polynomial modelling method. Following the MCMC-based model updating method, experimental verification was carried out on both the undamaged and damaged cases in the following sections. According to Lam et al.2,3 and Kumaran et al., 43 the nominal values of Young’s modulus and the density of the concrete sleeper were set to 38 × 109 N/m2 and 2200 kg/m3, respectively, and the nominal values of the ballast stiffness and rail mass were set to 120 × 107 N/m2 and 42 kg, respectively.
Undamaged case
The proposed MCMC–based method of ballast damage detection was first tested using the measurements from the undamaged system (i.e. sleeper 3). The class of zero-order polynomials (i.e. model class
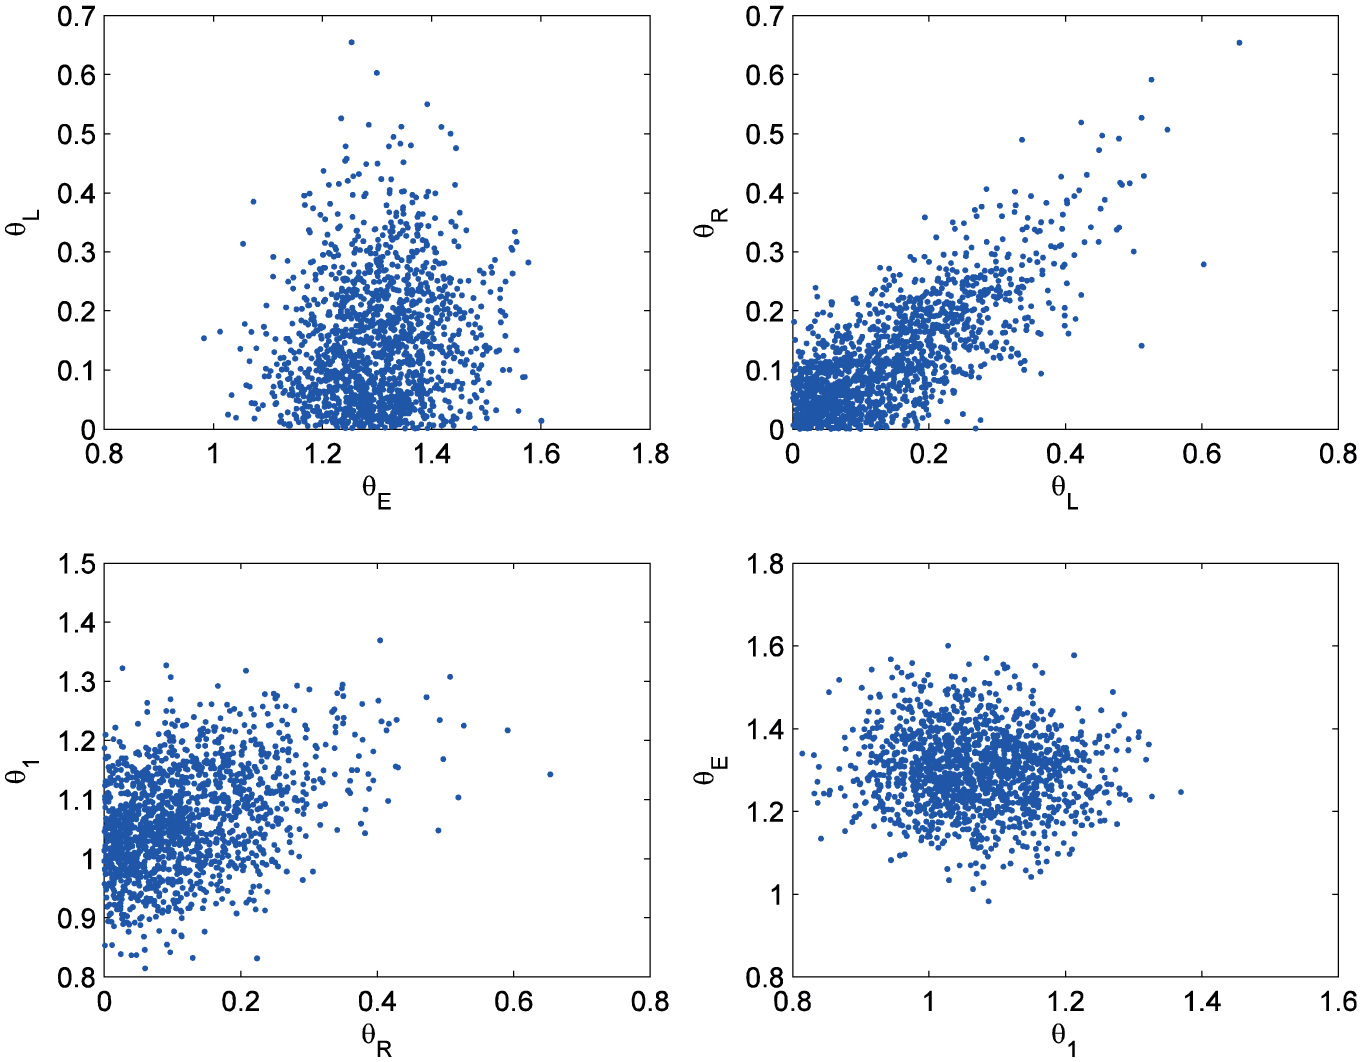
Markov Chain Monte Carlo samples for the zero-order model class.
The evidence of this model class was calculated by equation (11) using the MCMC samples. The value of the logarithm of the evidence is shown in the first row of Table 2. Next, a more complicated model class was tested. Similar procedures were carried out for model class
Evidences for different classes of models in the undamaged and damaged cases.

Once the most plausible model class (
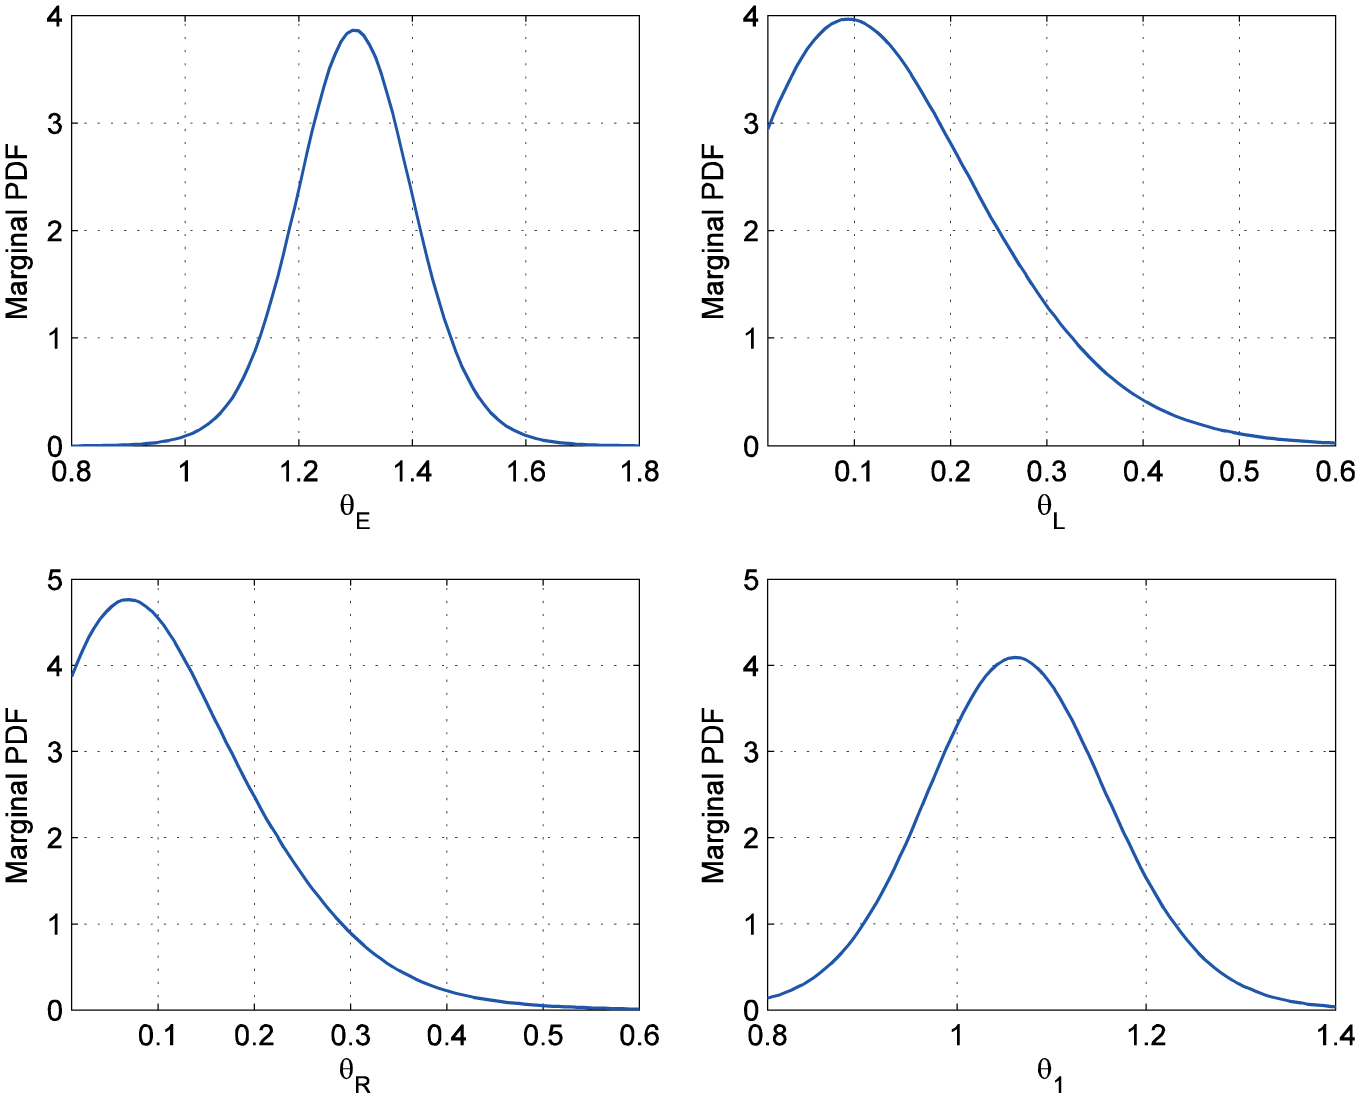
Posterior marginal PDF of the uncertain parameters for the zero-order model class, M1.
Optimal parameters and the corresponding standard deviations in the undamaged and damaged cases.

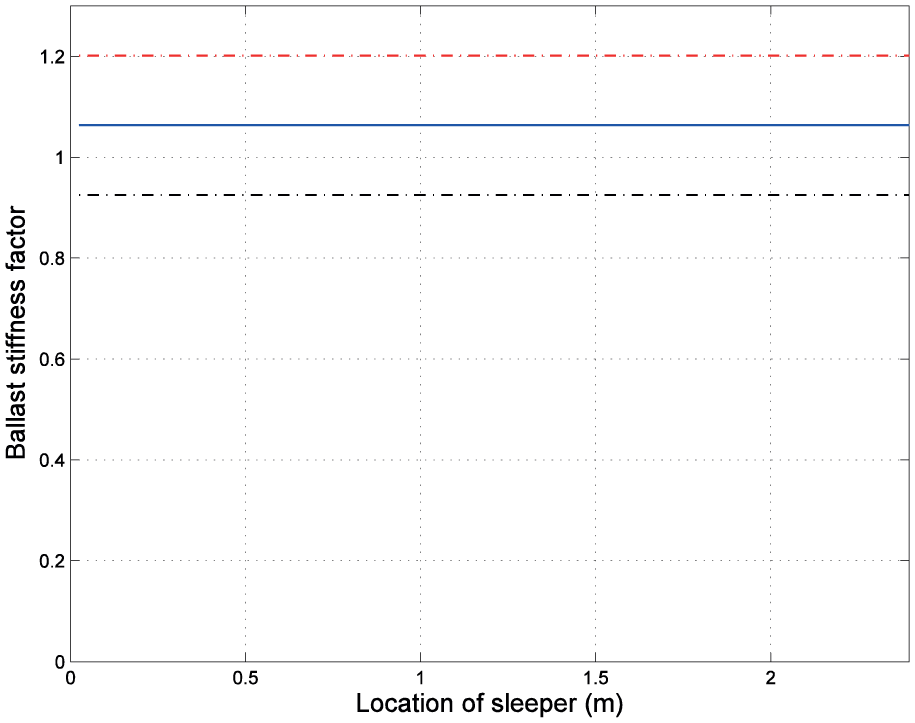
Ballast stiffness distribution with the upper and lower boundaries in undamaged case.
Other uncertain model parameters identified in Table 3 are also discussed. The updated Young’s modulus of the sleeper was 30% greater than the nominal value. Since the effect of prestressed force in the sleeper was not considered in the modelling, the nominal value underestimated Young’s modulus of the sleeper. The updated rail masses on the left and right sides were both smaller than the nominal value due to the uneven levelling of the neighbouring sleepers. 3
Damaged case: ballast damage at the middle under the sleeper
The measurements from the damaged system (i.e. sleeper 6) were used to test the proposed method. The model classes
Based on the set of MCMC samples generated for model class
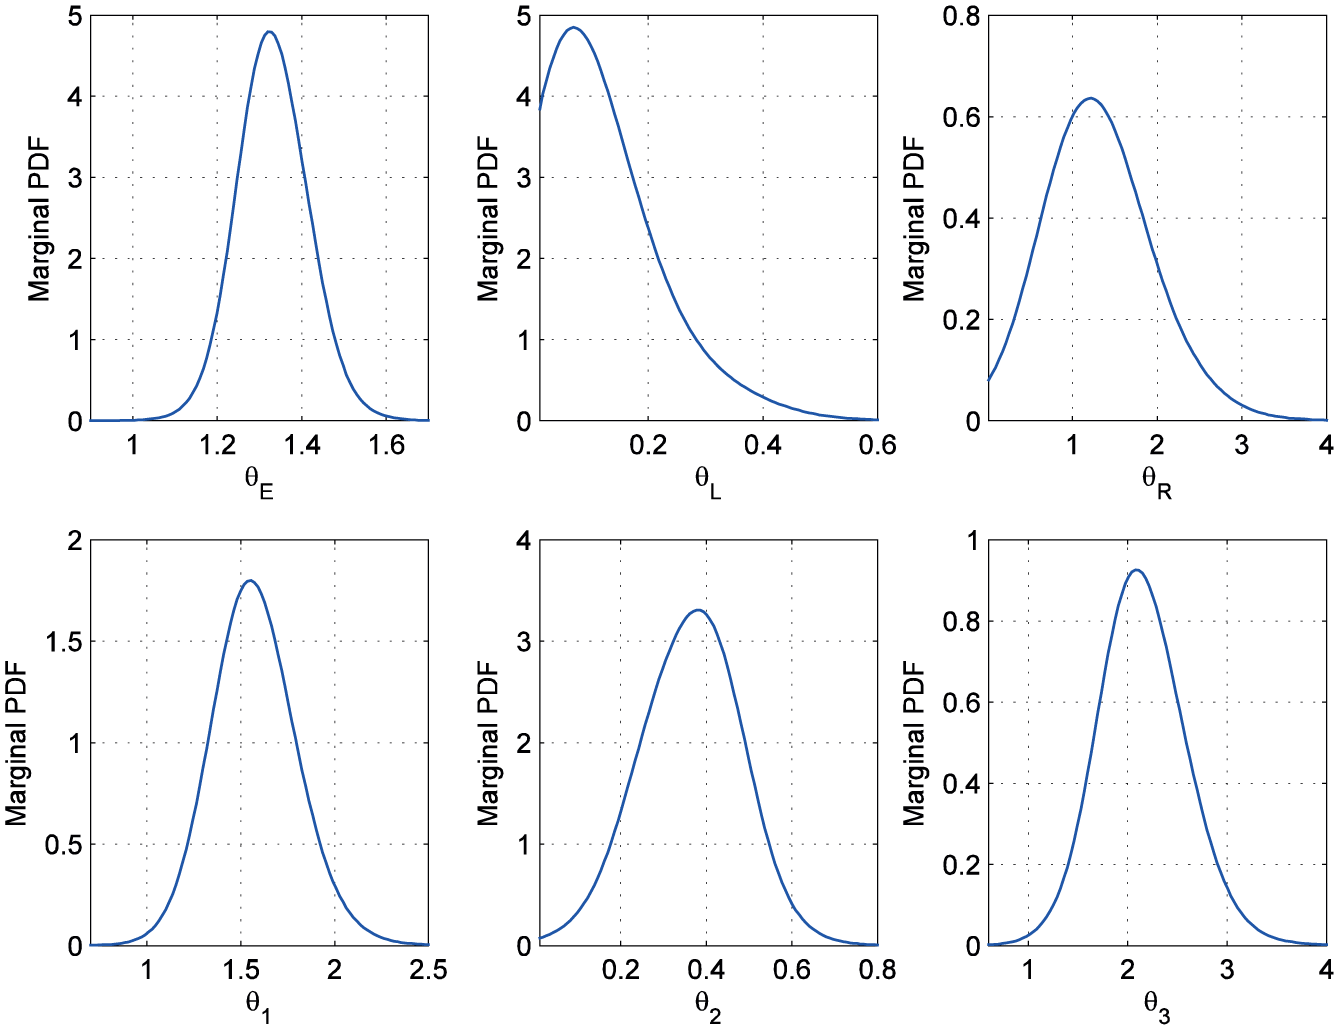
Marginal PDFs of the uncertain parameters for the two-order model class.
Based on model class
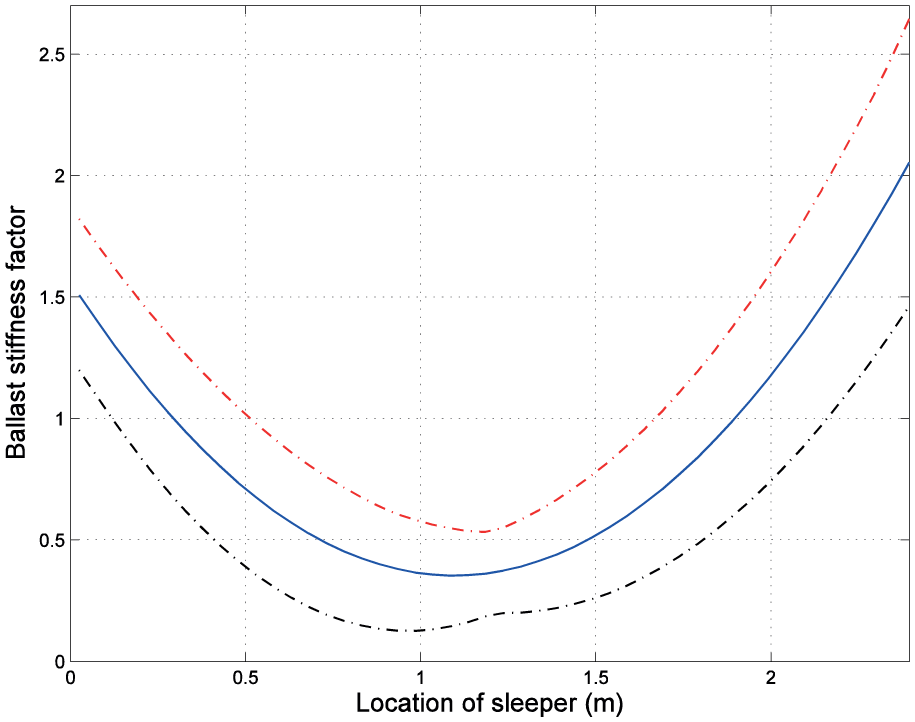
Ballast stiffness distribution with the upper and lower boundaries in the damaged case.
To get an idea of the accuracy of the match between the measured and model-predicted (after model updating) modal parameters, the ‘most probable’ model (i.e. the mean values estimated in Table 3) of
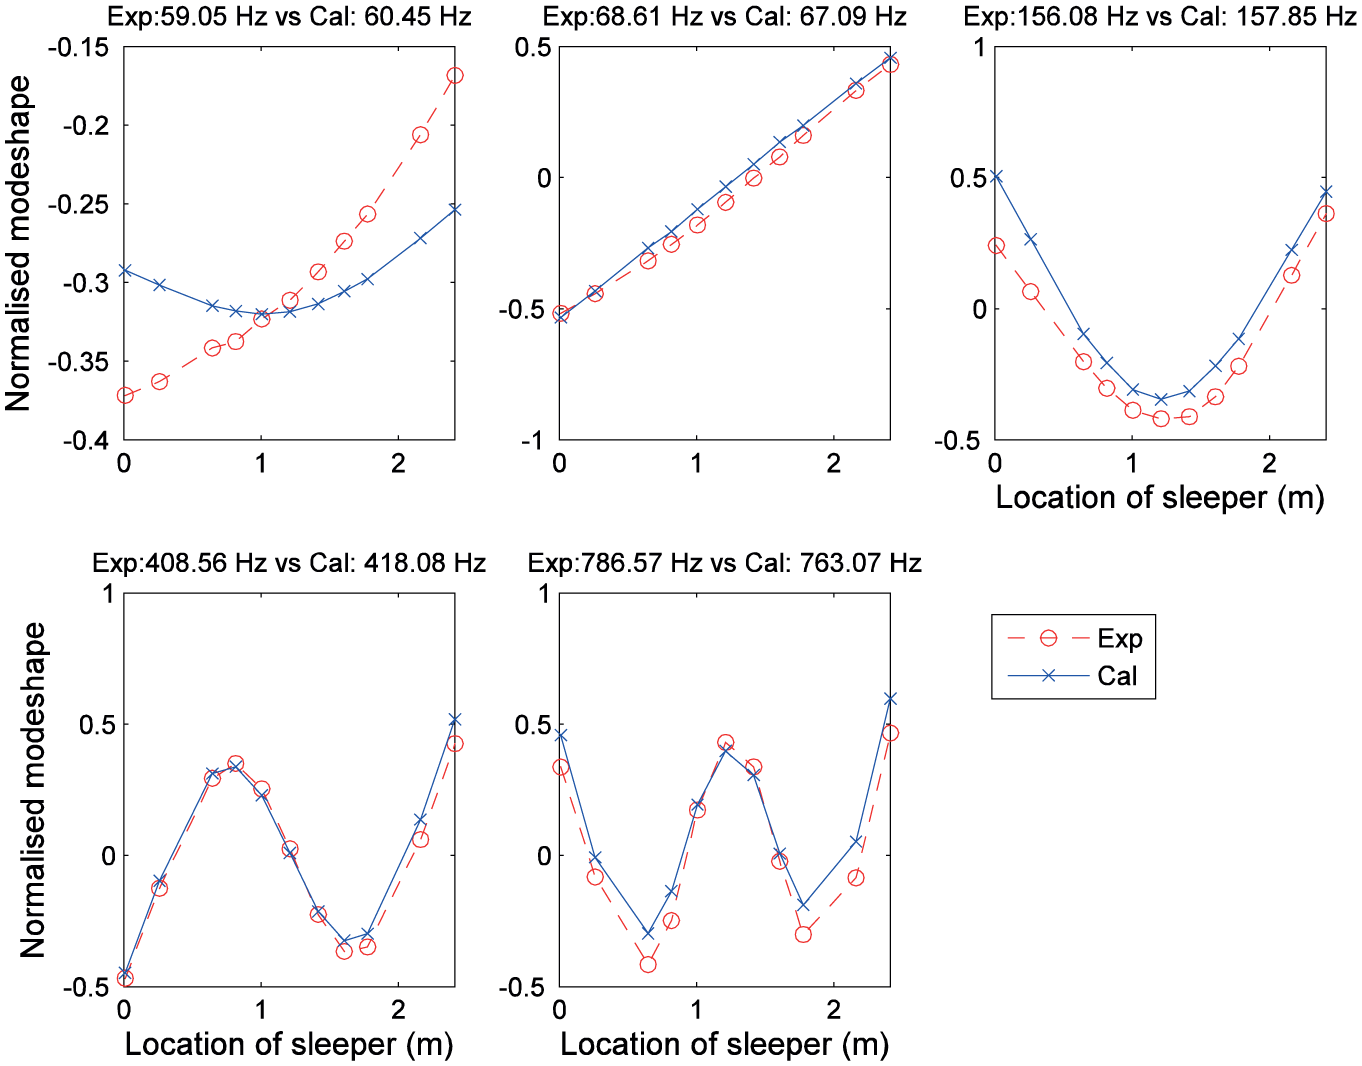
The matching between the measured and model-predicted modal parameters (after model updating) for the damaged case.
Measured and model-predicted (after model updating) natural frequencies for the damaged case (Hz).

Conclusion
A new polynomial modelling method has been developed to determine the ballast stiffness distribution under a sleeper using Lagrange polynomials to prevent artificial jumps in the ballast stiffness. The newly developed modelling method has been integrated with the MCMC-based Bayesian model updating and model class selection methods to form a practical method for detecting ballast damage.
To ensure that the method is applicable for both identifiable and unidentifiable cases, MCMC has been used to generate samples for approximating the probability of a model class conditional on a set of measurements and for approximating the posterior PDF of uncertain model parameters. This article has derived the new formulations for using MCMC samples in Bayesian model class selection.
The use of Lagrange polynomials in modelling the variation in ballast stiffness under a sleeper not only reduces the level of modelling error, but also provides physical meaning to the uncertain model parameters in the model updating process. It should be noted that it is difficult to judge the ballast damage situation from the posterior PDF of uncertain parameters if the polynomial coefficients are directly considered as the uncertain parameters in the model updating process.
There were few investigations in the literature regarding the application of MCMC-based Bayesian methods for the detection of damage in structural systems, and this article is the first to deal with the detection of damage to railway ballast. Experimental verification using measured data from the full-scale test panel has clearly proved the feasibility and practical value of the proposed method in detecting ballast damage. It provides valuable information for inspectors and engineers about the condition of the ballast under concrete sleepers during their visual inspection.
If the selected model class shows a uniform distribution of ballast stiffness under a sleeper and the identified value of the ballast stiffness is close to the nominal value, the target in situ sleeper is treated as undamaged. Otherwise, the ballast at certain locations under the sleeper may be damaged. The Bayesian model class selection is the key component in the proposed method for the selection of the most plausible model class conditional on a given set of measurements.
Using the Bayesian model updating method, the ballast stiffness distribution under the sleeper can be estimated together with the corresponding posterior uncertainties. It turns out that Bayesian model updating has high potential of application in railway ballast damage detection.
The damage simulated in this study was relatively large at the development stage of the proposed method to ensure the damage-induced change in modal parameters was not contaminated by measurement noise and modelling error. Additional experiments are needed in the future to study the effects of ballast damage extents by simulating ballast damage with various ballast sizes (e.g. 20–30 mm).
Roving hammer test data has been used in this study, and it can provide supplementary information to the inspector during visual inspection. In the final stage of this approach, the inspector can graphically see the ballast stiffness distribution and quantify the condition of the rail–sleeper–ballast system.
The frequency domain method assumes that the system behaviour is linear. However, the ballast only behaves linearly under small-amplitude vibrations. For large-amplitude vibrations, it is believed that the nonlinear effects cannot be neglected and the proposed method can only provide an approximate solution. Research is ongoing to perform Bayesian model updating in the time domain with the consideration of the nonlinear effects in the vibration. In addition, it is in general believed that time-domain data are more reliable because they are free from error, which may be introduced by conversion of the time-domain data to other domains, such as the frequency and modal domains.
It is clear from the literature that the natural frequencies of a structural system depend on the temperature and humidity. 44 In the development stage, the proposed method has been verified using measured data from the indoor test panel, which allows the environmental factors, such as temperature and humidity, to be well controlled. Since the proposed method directly estimates the ballast distribution without a set of baseline data (i.e. a set of measured modal parameters of the system in the undamaged status), the problem of temperature difference in the two measurements (one for the baseline and one for the possibly damaged system) is not valid for the proposed method. A long-term monitoring program for recording the modal parameters and the corresponding temperatures of several in situ sleepers is in progress for studying the effects of environmental factors on the modal parameters of in situ sleepers.
Footnotes
Acknowledgements
The authors would like to thank Dr Man-Tat Wong and Hong Kong MTRC for their help in the development of the full-scale test panel in Kowloon Bay, Hong Kong. The help from Dr Hua-Yi Peng and Mr Alabi Stephen in the experiment is highly appreciated.
Declaration of conflicting interests
The author(s) declared no potential conflicts of interest with respect to the research, authorship and/or publication of this article.
Funding
The work described in this article was fully supported by a grant from the Research Grants Council of the Hong Kong Special Administrative Region, China (Project No. 9041889 (CityU 115413)).