






Abstract
In high-speed railway ballastless track systems, sleeper spacing governs the density of discrete rail supports and the load transfer path, making it a key parameter affecting rail deformation, internal forces, fastener loads, wheel–rail interaction, and dynamic responses during train passage. This study investigates the influence of sleeper spacing on the static and dynamic behavior of double-block ballastless track. A Hertzian wheel–rail contact model and a finite element model of the rail–fastener–sleeper–track slab system were developed to analyze deformation, stiffness, shear force, and bending moment under static wheel loads. A field-validated vehicle–track coupled dynamic model was further established to evaluate rail vibration, fastener reaction forces, and wheel–rail contact forces during train passage at different speeds. The results indicate that increasing sleeper spacing reduces support density and strengthens the rail span effect. Under static loading, rail deformation and the peak values of rail shear force and bending moment increase, while fastener reactions shift from distributed multi-point bearing to localized concentration near the loading region. Under dynamic loading, the rail vibration response increases with train speed, and larger sleeper spacing further amplifies this effect. As sleeper spacing increased from 500 to 900 mm, the peak rail acceleration increased by 14.81% at 100 km/h and 19.08% at 300 km/h, indicating that larger sleeper spacing further amplifies rail vibration under high-speed conditions. Moreover, larger sleeper spacing intensifies fastener reaction forces and increases the fluctuation amplitudes of vertical and lateral wheel–rail forces, which is unfavorable for vehicle running stability. Overall, excessive sleeper spacing weakens rail support continuity, aggravates local force concentration, and deteriorates the dynamic performance of the track–vehicle system.
1. Introduction
With the large-scale construction and long-term operation of high-speed railways (Qu et al., 2021, 2024; Zhai et al., 2020), the geometric stability and service reliability of track structures have become crucial to ensuring running safety, ride comfort, and maintenance economy (Han et al., 2025). As a core parameter of longitudinal discrete support in railway tracks (Luo et al., 2025), sleeper spacing governs the support density and load transfer scale of the rail, fastening system, and ballastless track structure, thereby affecting rail bending response, support reaction distribution, and system dynamic characteristics (Dong et al., 2025, 2026). Recent studies have further demonstrated that dynamic interactions and parameter variability can significantly influence the vibration responses and service performance of transportation infrastructure systems (Hou et al., 2026). In early timber-sleeper ballasted tracks, sleeper spacing was mainly selected empirically according to rail type, material strength, construction conditions, and maintenance practice (Han et al., 2026; Xing et al., 2026). With the development of track structural mechanics, the Winkler elastic foundation assumption laid the theoretical foundation for rail beam-elastic foundation analysis (Winkler, 1887), while Zimmermann and co-workers promoted the transition from empirical selection to theoretically calculable design (Zimmermann, 1888). In high-speed railways, ballastless track has been widely adopted because of its high structural integrity, strong geometric retention capability, and low maintenance demand (Ji et al., 2024). Because ballastless track provides limited post-construction adjustment flexibility (Lv et al., 2026; Sun et al., 2025), rational sleeper spacing is particularly important: excessively small spacing increases the numbers of fasteners and sleepers and strengthens longitudinal restraint, whereas excessively large spacing may increase rail bending stress and deflection, intensify wheel–rail dynamic interaction and peak support reactions, and aggravate the risks of rail corrugation and fatigue damage (Ji et al., 2025a, 2025b; Qu et al., 2024).
As a direct parameter characterizing the longitudinal discrete support of railway tracks, sleeper spacing affects structural safety assessment and nodal force control mainly through changes in rail span scale and support reaction redistribution. Its influence is especially significant at track expansion joints and transition zones, where spacing may locally deviate from the standard value because of thermal expansion and contraction or structural layout requirements. Lee et al. (2011) showed that increased sleeper spacing near bridge expansion joints can significantly increase rail bending stress and deflection, and proposed the concept of allowable maximum sleeper spacing. Ali et al. (2013) emphasized that larger spacing may amplify rail bending response and nodal force concentration. Real et al. (2012) incorporated sleeper spacing, pad stiffness, and subgrade parameters into a unified deflection estimation framework for engineering evaluation. Sadeghi et al. (2017) demonstrated that, in ballastless track systems, sleeper spacing together with train speed and wheel load governs the rail seat load level and load transfer pattern, thereby influencing the mechanical design of concrete supporting members. Mohsen et al. (2019) further presented an engineering-oriented procedure for the techno-economic optimization of support parameters.
Sleeper spacing determines the spatial periodicity of support points and is a typical discrete-support excitation parameter in vehicle–track coupled dynamics theory. Through the transmission of wheel–rail forces and interface forces, it affects the rail vibration frequency band, resonance peak, and overall response level. Zakeri and Xia, 2008 showed that reducing sleeper spacing and adjusting pad and track bed parameters can decrease the peak values of wheel–rail force, rail–support interface force, and critical contact force. Batjargal et al. (2012) pointed out that sleeper spacing has a stronger suppressive effect on high-frequency vibration transmission, whereas low-frequency responses are more dependent on support-system characteristics. Abe et al. (2013, 2014) discussed the effects of random sleeper spacing on resonance amplitude and frequency-response peaks. Hall (2003) showed that three-dimensional effects are more critical under soft-soil and embankment conditions. Kouroussis et al. (2012) further quantified the influence of sleeper spacing and related parameters on the vibration indices of the vehicle, rail, and foundation. Zhao et al. (2020) classified the dominant frequency bands of subgrade vibration into axle-spacing-related, sleeper-spacing-related, and irregularity-spectrum-related bands. Sung et al. (2020) demonstrated that vibration transmission within specific low-frequency ranges can be controlled by adjusting sleeper spacing and support stiffness, while Zou et al. (2019) proposed the optimal sleeper spacing for specific line conditions and emphasized the effects of speed and axle load on sleeper-spacing sensitivity.
From the perspective of long-term service, the degradation of the mechanical performance of track structures is influenced not only by track bed and subgrade conditions, but also by parameters such as sleeper spacing, pad stiffness, axle load, and traffic volume. Sadeghi and Askarinejad, 2007 identified sleeper spacing as an important sensitive factor affecting the degradation rate. Ng et al. (2018) showed that different sleeper spacings lead to differences in corrugation growth rate and dominant wavelength, thereby affecting maintenance cost and service reliability. Li et al. (2026) further showed that the relationship between short-pitch corrugation and dynamic responses in the frequency range of several hundred hertz highlights the coupled chain among support parameters, high-frequency dynamic responses, and corrugation evolution. Meanwhile, recent studies have discussed the optimal sleeper spacing from the perspectives of global practice and cost optimization (Ortega et al., 2021), indicating that although safety concerns have long constrained the relaxation of sleeper spacing, it still has the potential to be extended to larger values provided that limit requirements and key assumptions are satisfied (Sañudo et al., 2022; Sutar and Tande, 2024) discussed the feasibility of larger sleeper spacing and its energy-saving and emission-reduction benefits through response evaluation and regression models. Nasrollahi and Nielsen (2024) pointed out that reducing sleeper spacing or modifying the support configuration can alleviate stiffness mutations and reduce the risk of hanging sleepers and differential settlement. In ballasted track systems, however, increasing sleeper spacing may also alter the lateral resistance of ballast and therefore needs to be constrained from the perspective of structural stability (Koyama et al., 2021; Sutar and Tande, 2025) systematically summarized the role of sleeper spacing in techno-economic trade-offs and the corresponding requirements for optimization modeling.
In summary, existing studies have revealed the importance of sleeper spacing from the perspectives of safety control for local spacing variation, frequency-domain resonance characteristics of discrete supports, environmental vibration propagation, long-term service degradation, and economic performance. However, for ballastless track systems, current engineering practice still mainly relies on empirical values or typical layout schemes. For different forms of ballastless track structures, there is still a lack of unified and explicit provisions, as well as systematic selection criteria, that can be directly used for the integrated evaluation of mechanical response and running dynamic performance. In particular, systematic comparative studies over a relatively wide range of sleeper spacings remain limited. Therefore, this study takes double-block ballastless track as the research object and considers six sleeper-spacing cases ranging from 400 mm to 900 mm TB/T 10621-2014 (2014). In the static analysis, the three-directional rail displacements, the internal forces and bending moments of the rail and track slab, and the three-directional fastener reaction forces are systematically obtained. In the dynamic analysis, the model is validated against measured responses of high-speed railway rails and track slabs, including rail acceleration, displacement, wheel–rail contact force, and track slab response. On this basis, comparative analyses of rail acceleration, displacement, and wheel–rail contact force are further conducted under different train speeds, so as to establish a unified static and dynamic evaluation framework for the discrete-support parameters of ballastless track and provide a reference for sleeper spacing selection.
2. Methodologies
2.1. Vehicle–track coupled dynamic system
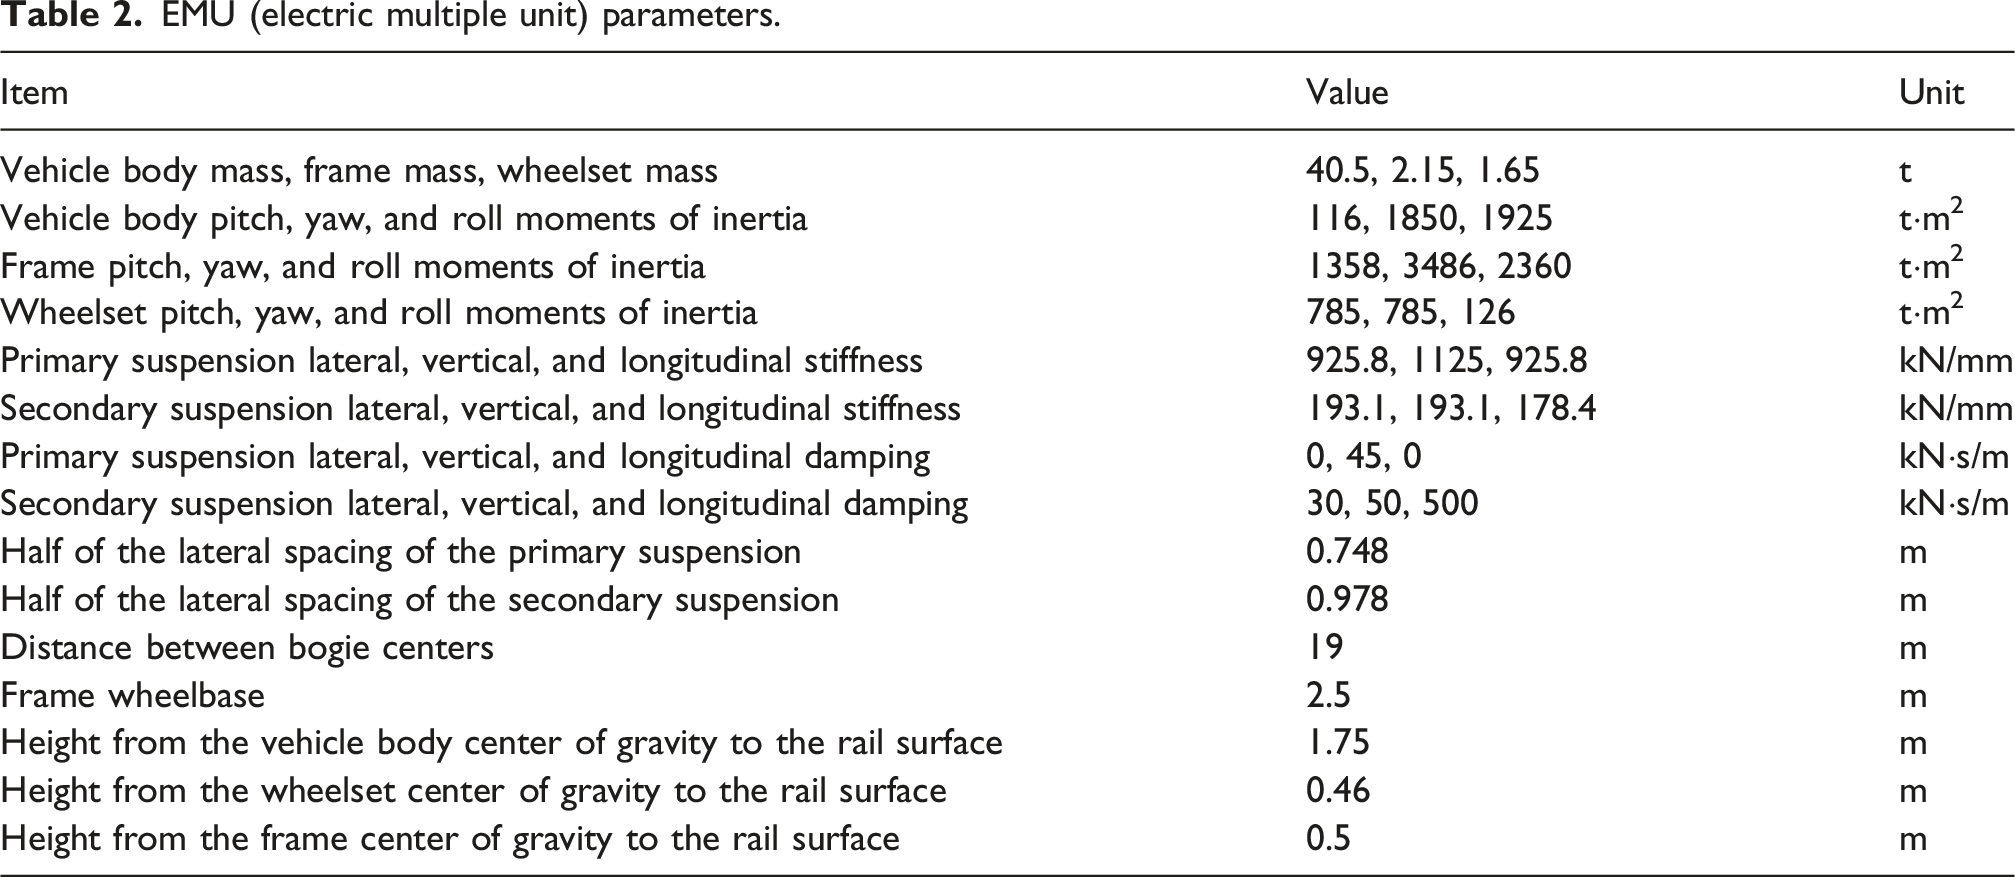
Based on the vehicle–track coupled dynamics theory (Zhai, 2020), a vehicle–track coupled system consisting of the car body, bogies, wheelsets, rails, fastening system, and double-block ballastless track structure was established in this study (Li et al., 2025, 2026). Specifically, the vehicle subsystem comprises one car body, two bogies, and four wheelsets. The wheel–rail contact model was solved using Hertzian nonlinear contact theory. The track subsystem consists of the rails, fastening system, and double-block ballastless track structure, as shown in Figure 1. In the vehicle subsystem, the car body, each bogie, and each wheelset each have five degrees of freedom, resulting in a total of 35 degrees of freedom for the system (Zhai, 2020). The detailed degree-of-freedom composition is listed in Table 1, and the vehicle parameters are given in Table 2. Vehicle–track coupled dynamic model. Degrees of freedom for vehicle components. EMU (electric multiple unit) parameters.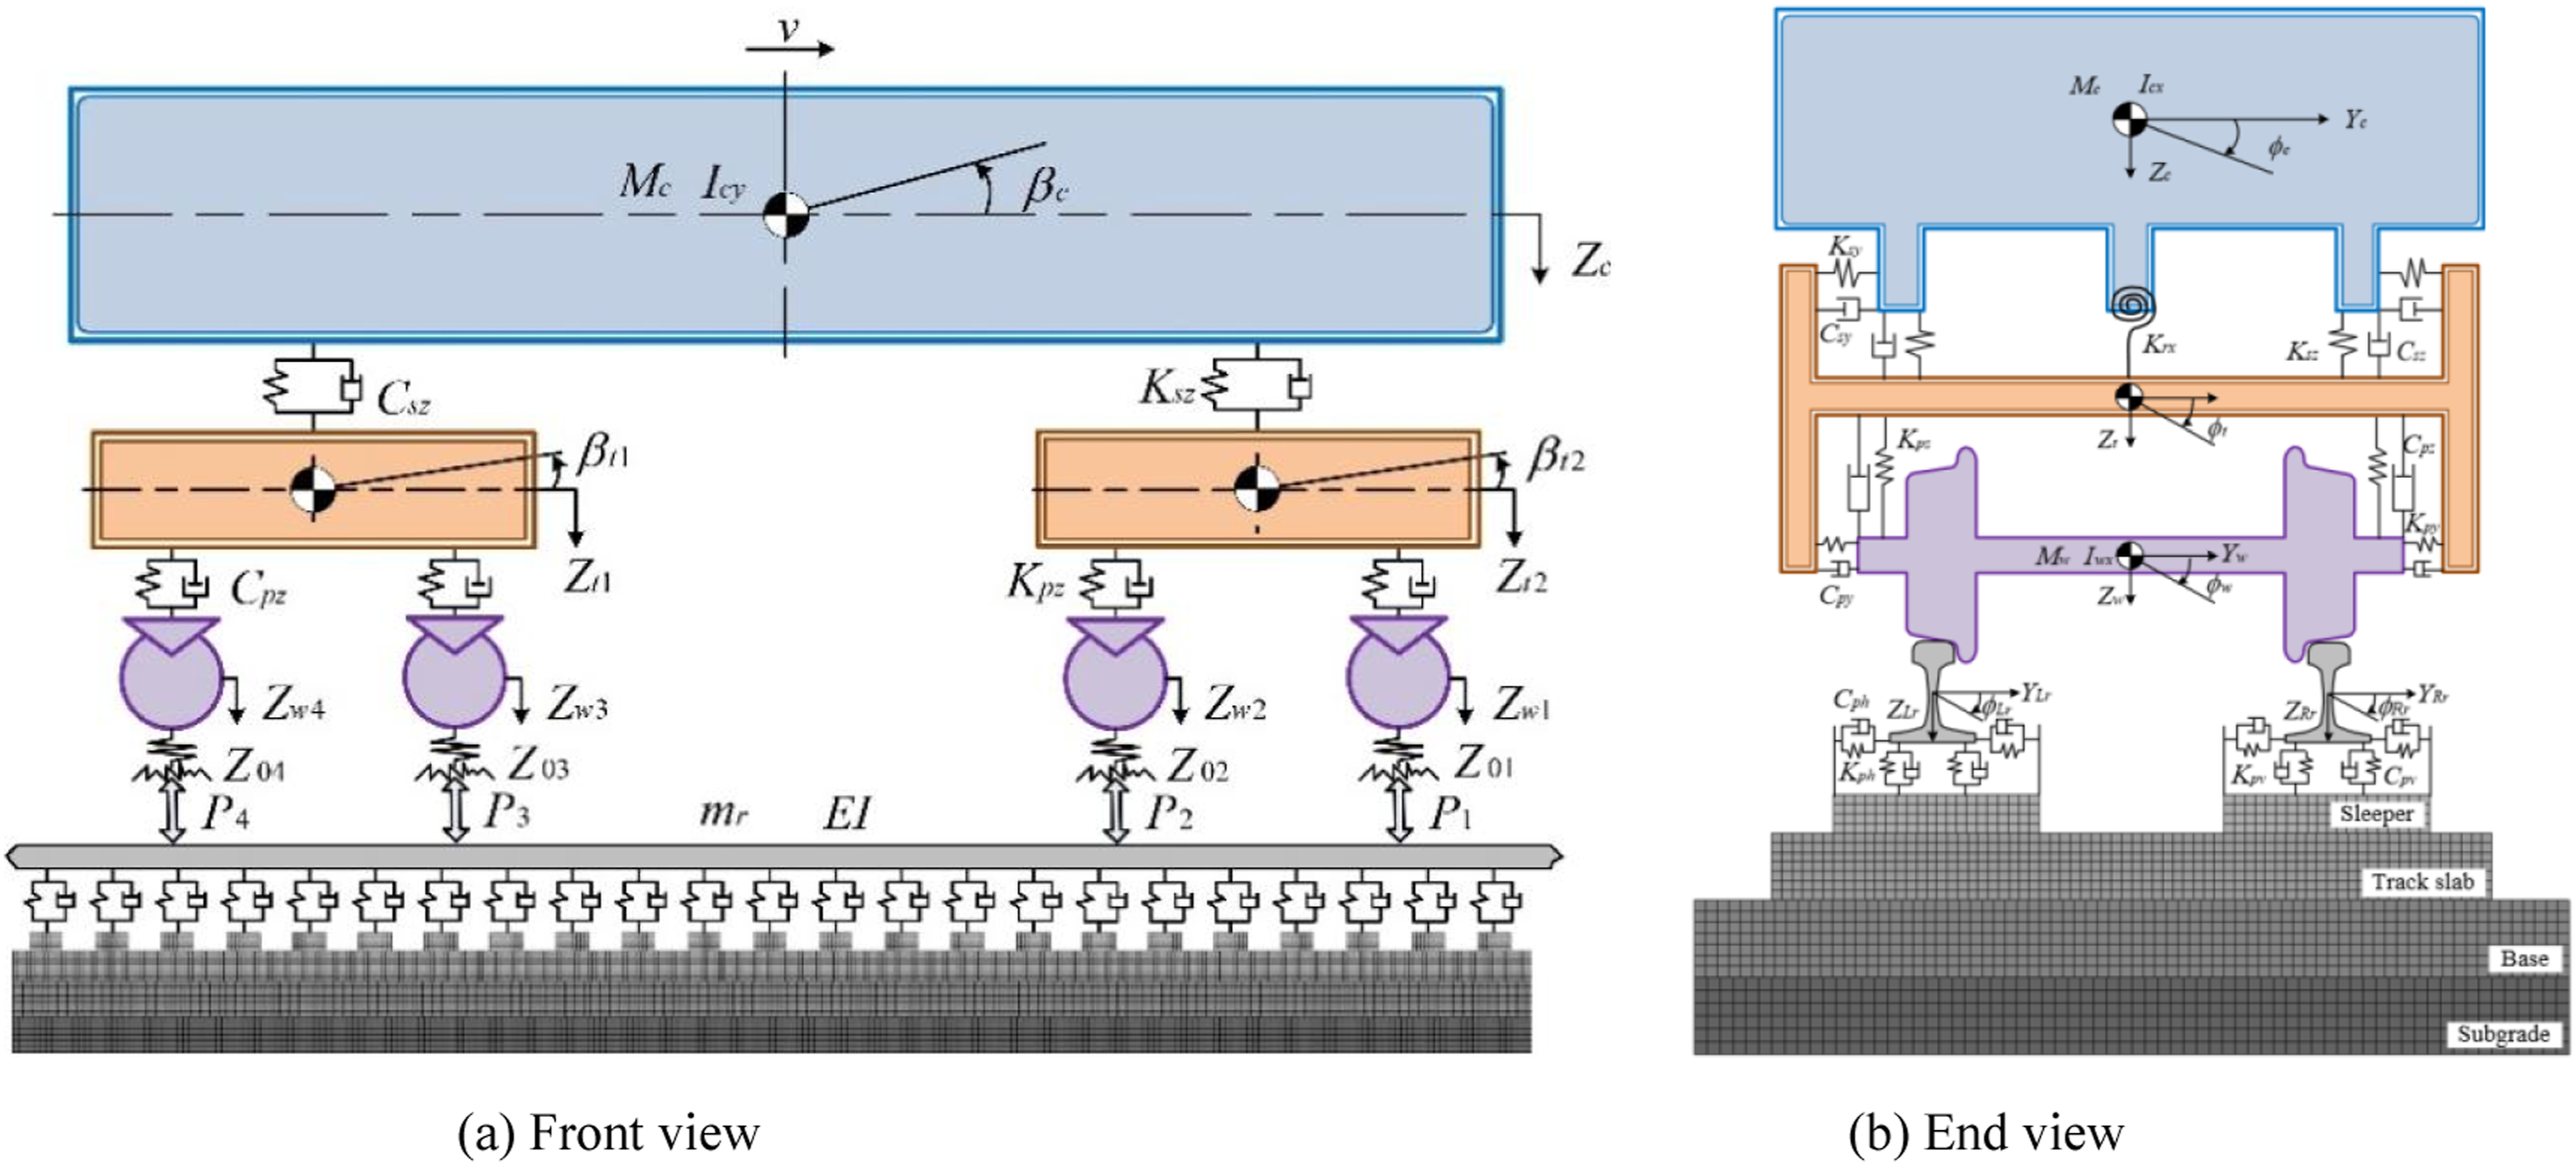

2.2. Theory of wheel–rail contact
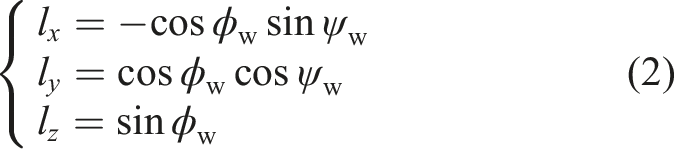
In this study, the trace-line method was adopted to geometrically describe wheel–rail contact (He et al., 2023). Based on the spatial relative position between the wheel flange-tread profile and the rail head profile, the contact trace line was generated along the wheel–rail profiles, and the instantaneous contact point and its local geometric characteristics were determined. The wheel–rail contact mode and the corresponding spatial displacement relationship are shown in Figure 2. The relative displacement components between the wheelset and the rail, as well as its geometric constraint equations, are expressed as follows: Spatial contact geometry between wheel and rail.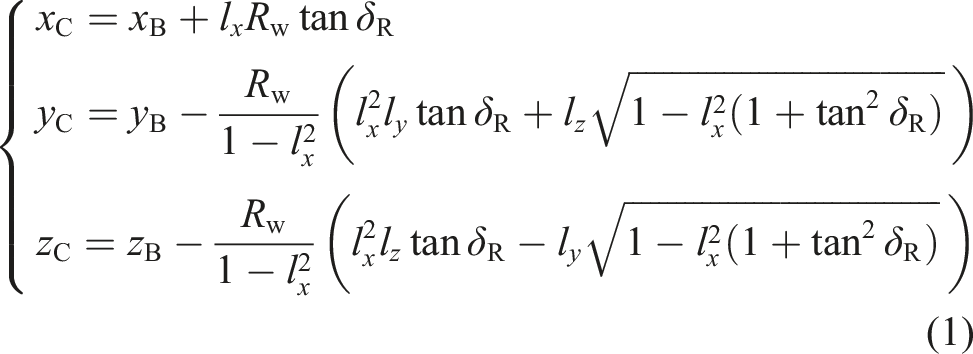
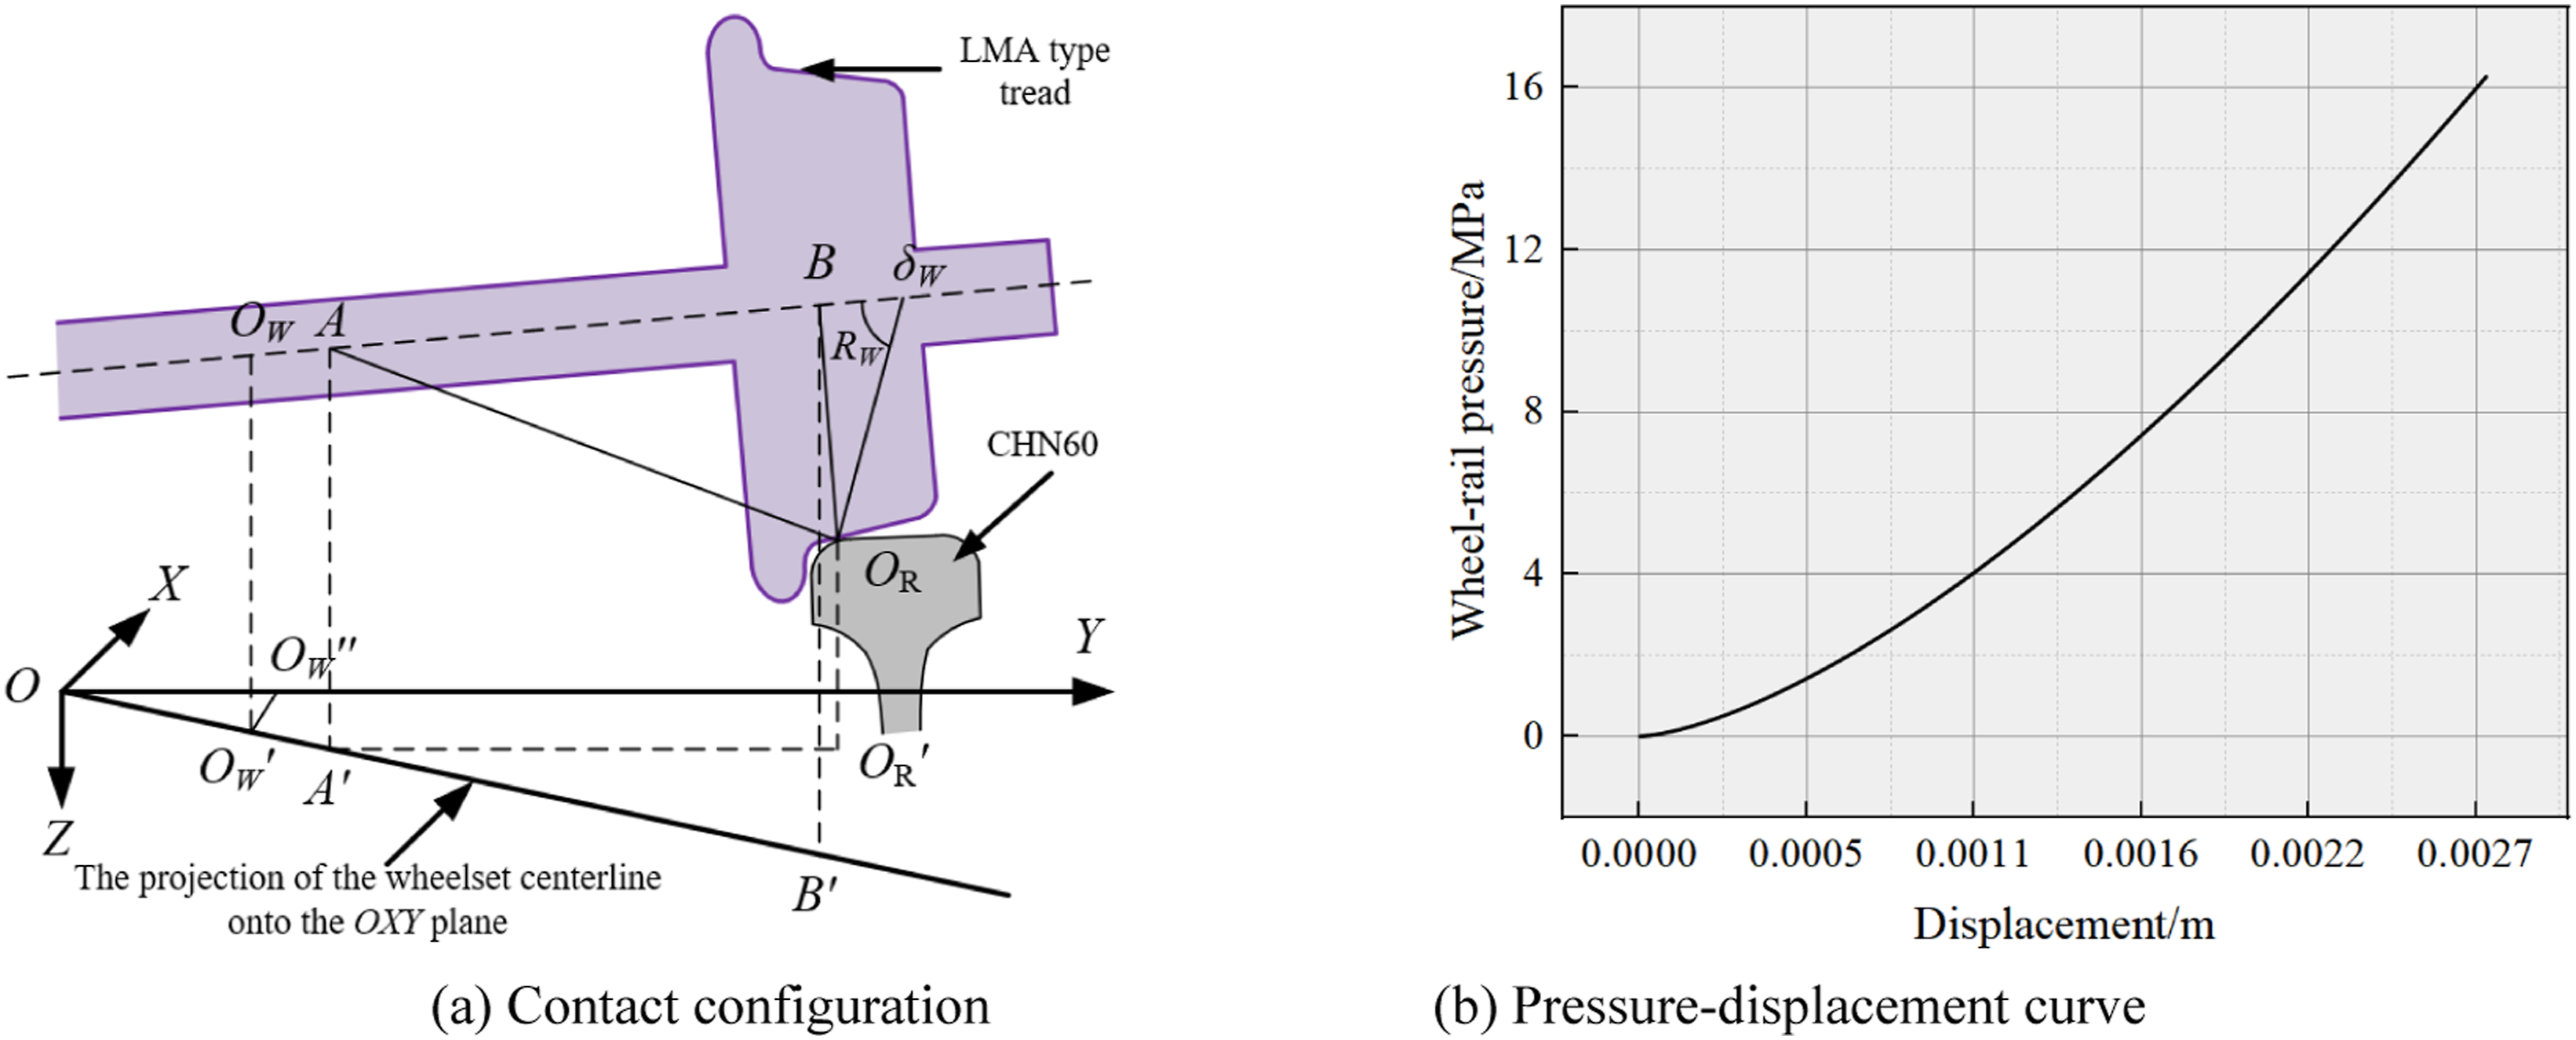
In the finite element model adopted in this study, wheel–rail contact is described by the normal contact force and tangential contact force. Specifically, the normal contact between the wheelset and rail was calculated using Hertzian nonlinear contact theory (Hertz, 1882), while the tangential contact was calculated using Coulomb friction theory (Zhu and Cai, 2014). The wheel–rail normal force was calculated based on Hertzian nonlinear contact theory, as expressed in the following equation:
2.3. Establishment of a double-block ballastless track structure model
Model dimensions and material parameters.
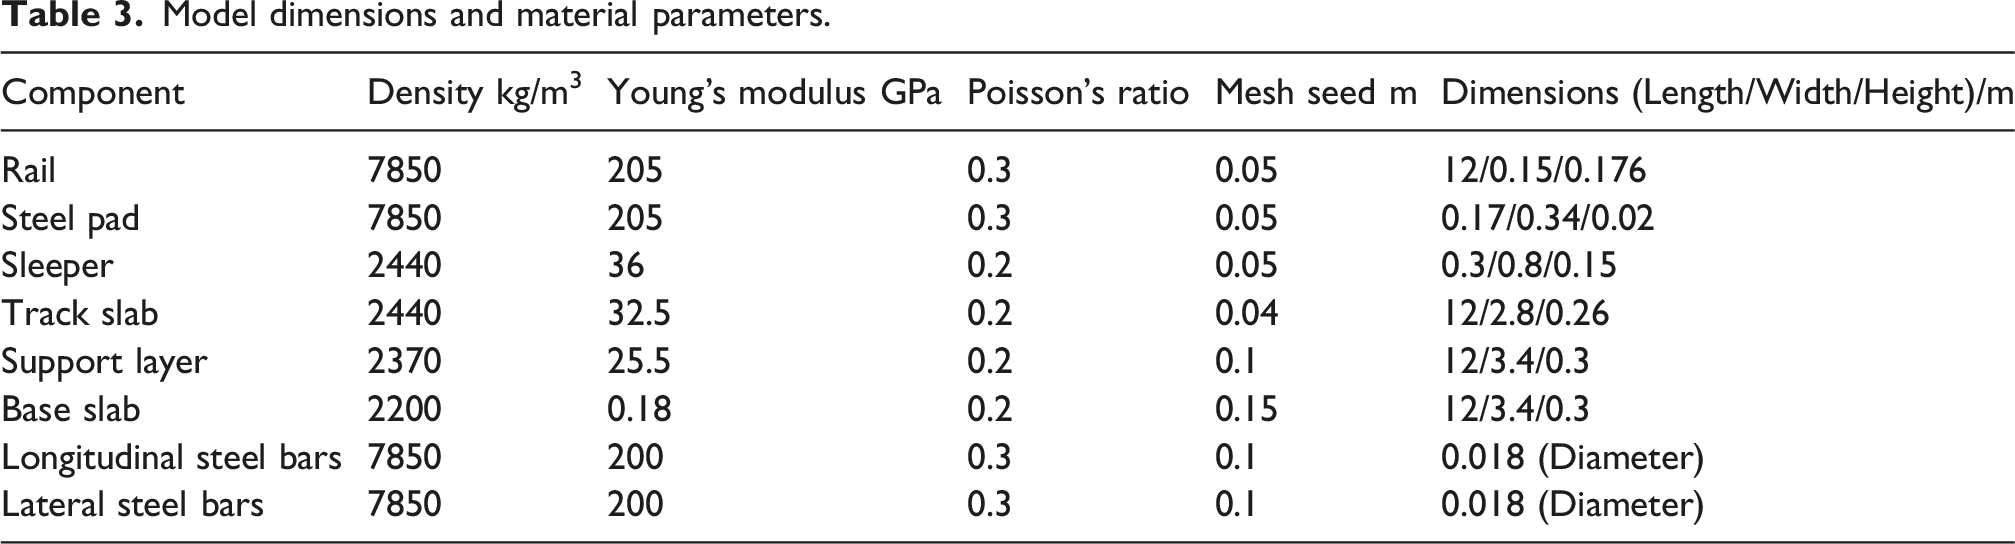
2.4. Numerical methods in dynamics
As described in Section 2.1, the established vehicle subsystem incorporates the motion relationships of the car body, bogies, wheelsets, and other components, with a total of 35 degrees of freedom. During high-speed operation, the vehicle subsystem interacts with the track subsystem through the wheel–rail contact interface. Based on the flexible treatment of the wheelsets and rails, the wheel–rail contact force evolves dynamically with changes in relative displacement, relative velocity, and contact geometric parameters, thereby coupling the two subsystems into a unified vehicle–track overall dynamic system. Owing to variations in wheel–rail contact conditions, including contact-point migration, normal and tangential contact stiffness, and frictional characteristics, together with the nonlinear response of the track structure, the coupled system exhibits pronounced strong nonlinear characteristics. On this basis, the dynamic equations of the vehicle–track overall system can be uniformly expressed as (Zhai, 2020):
The system is solved using the Zhai method in vehicle–track coupled dynamics theory. This method is a fast explicit integration method, and its specific solution form is given as follows:
3. The effect of sleeper spacing on the structural static mechanical performance
To calculate the longitudinal and vertical responses of the rail, the corresponding force levels of the fastening system, and the shear forces and bending moments of the rail and track slab under static loading at different sleeper spacings, a wheelset–rail Hertzian contact model was established in this section based on the wheel–rail contact theory described above, and the fastening system was simulated using Cartesian three-directional connectors. Symmetry constraints were applied to both end faces of the rail. Six sleeper-spacing cases, namely, 400, 500, 600, 700, 800, and 900 mm, were considered, as shown in Figure 3(a). The entire model mainly consists of the wheelset, rail, fastening system, tie plate, double-block sleepers, track slab, foundation, and base slab. The rail was designed with a rail cant of 1/40, the bottom of the base slab was fully fixed, and a vertical load of 17 t was applied at the wheelset axle (Yun et al., 2025), as shown in Figure 3(b). Finite element model of a double-block ballastless track structure with different sleeper spacings.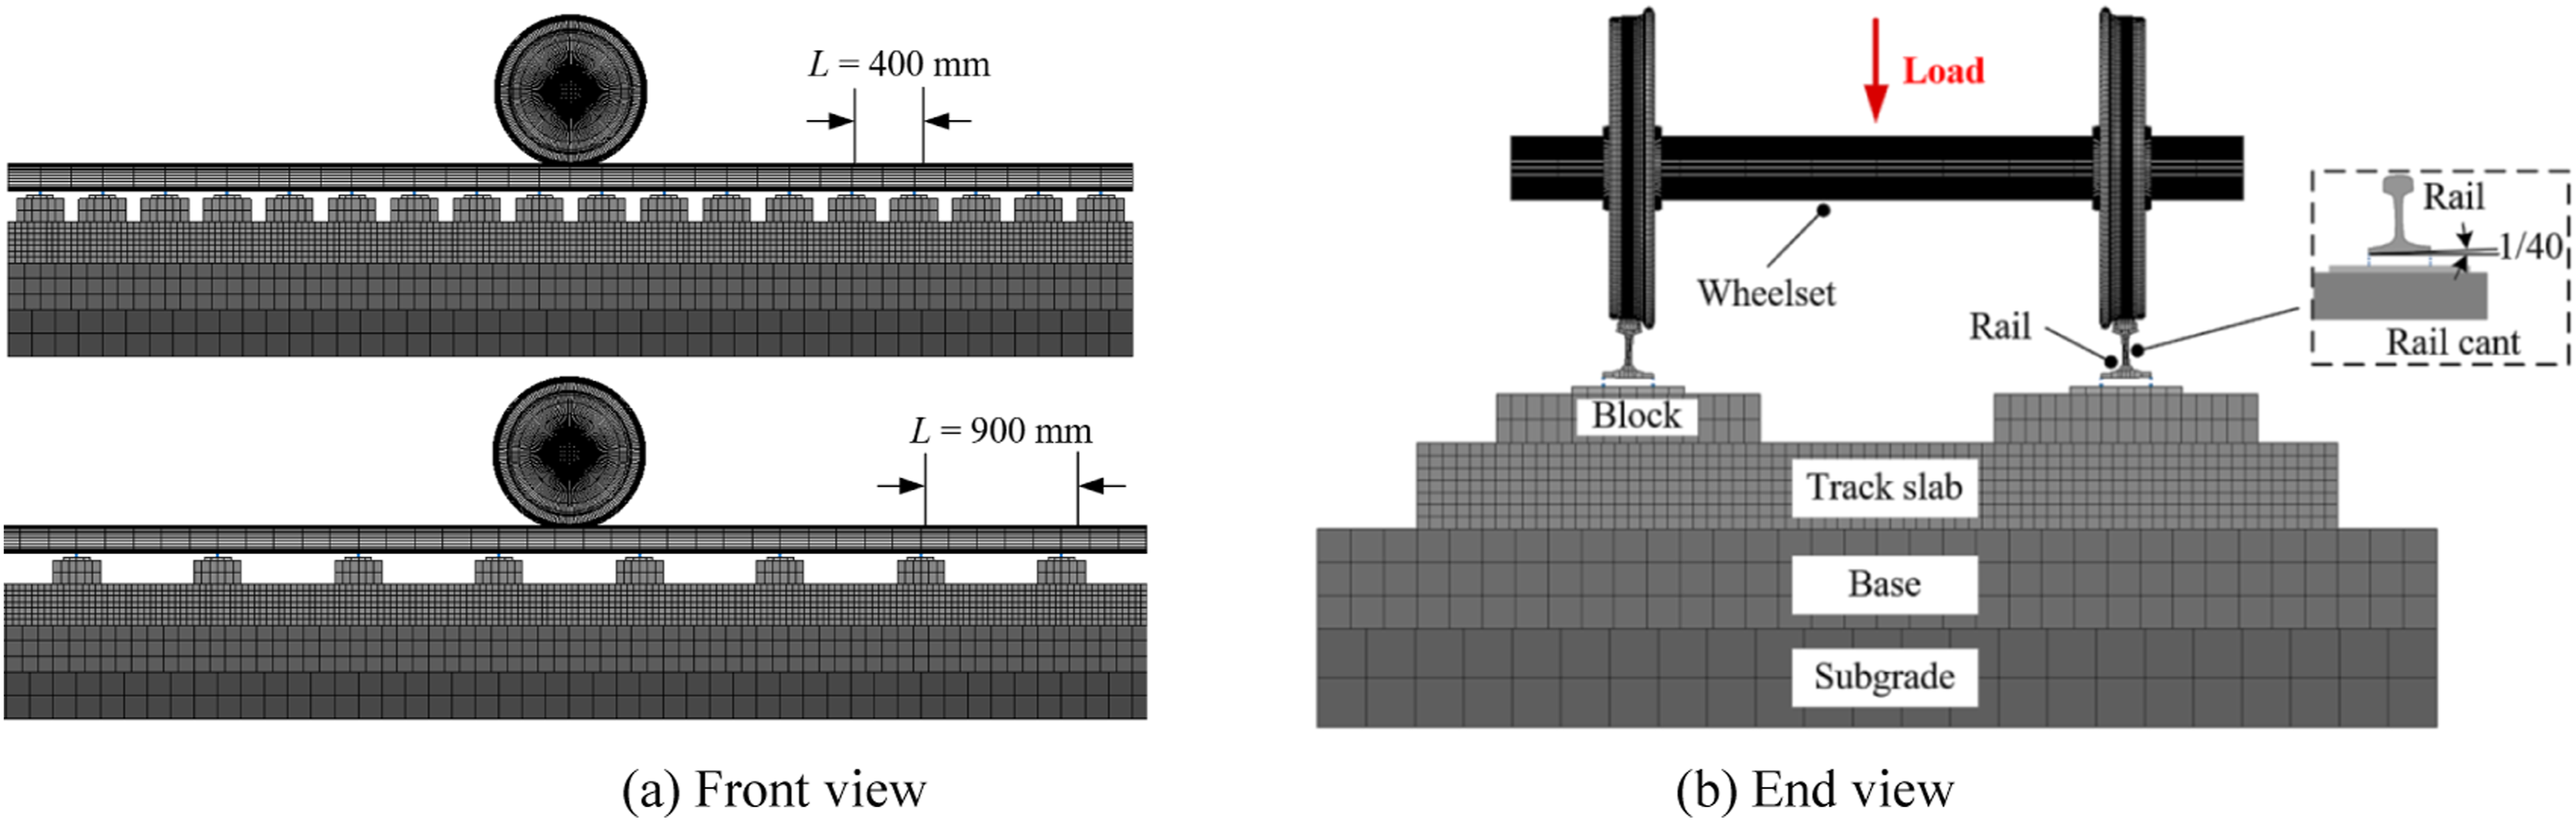
3.1. Response of rail displacement to the reaction forces of fasteners
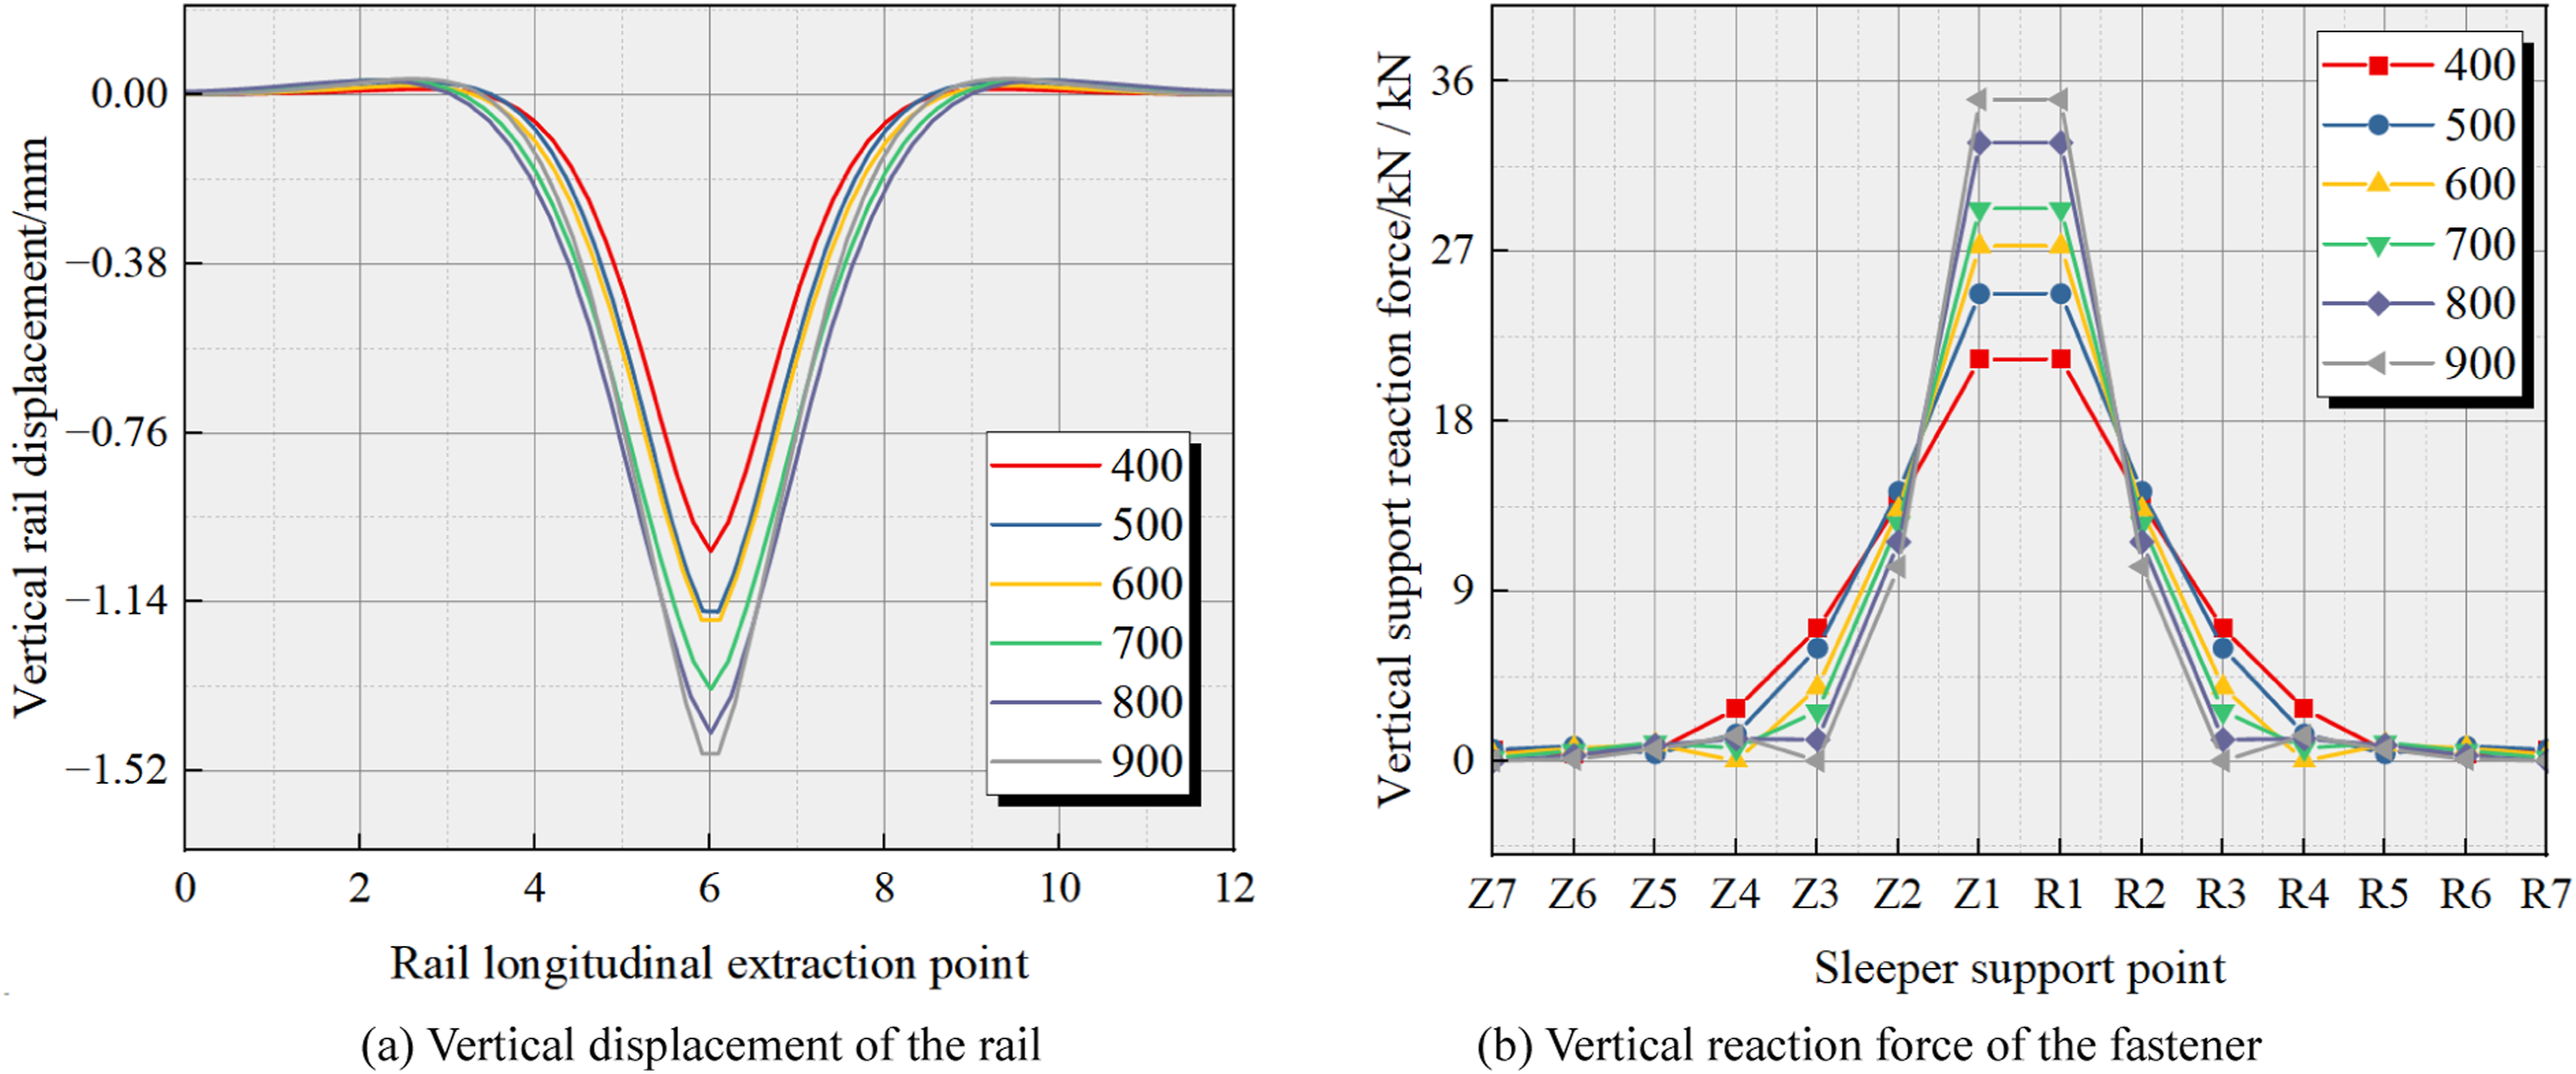
For the extraction of rail displacements in different directions, the nodes at the rail head on one side of the track centerline were selected and extracted sequentially along the longitudinal direction according to the mesh order. For the extraction of fastener reaction forces, the fastening systems on one side of the track centerline were selected, and the reaction forces of each fastening system were extracted sequentially along the longitudinal direction. The extraction point of the fastener reaction force at the first pair of sleepers to the left of the loading point was denoted as L1, and that at the second pair of sleepers was denoted as L2, with the remaining positions labeled in the same manner; the same definition was adopted on the right side (Yun et al., 2026). Figure 4 shows the longitudinal rail displacement and the longitudinal fastener reaction force results, while Figure 5 shows the vertical rail displacement and the vertical fastener reaction force results. Longitudinal displacement of the rail and longitudinal reaction force of the fasteners. Vertical displacement of the rail and vertical reaction force of the fastener.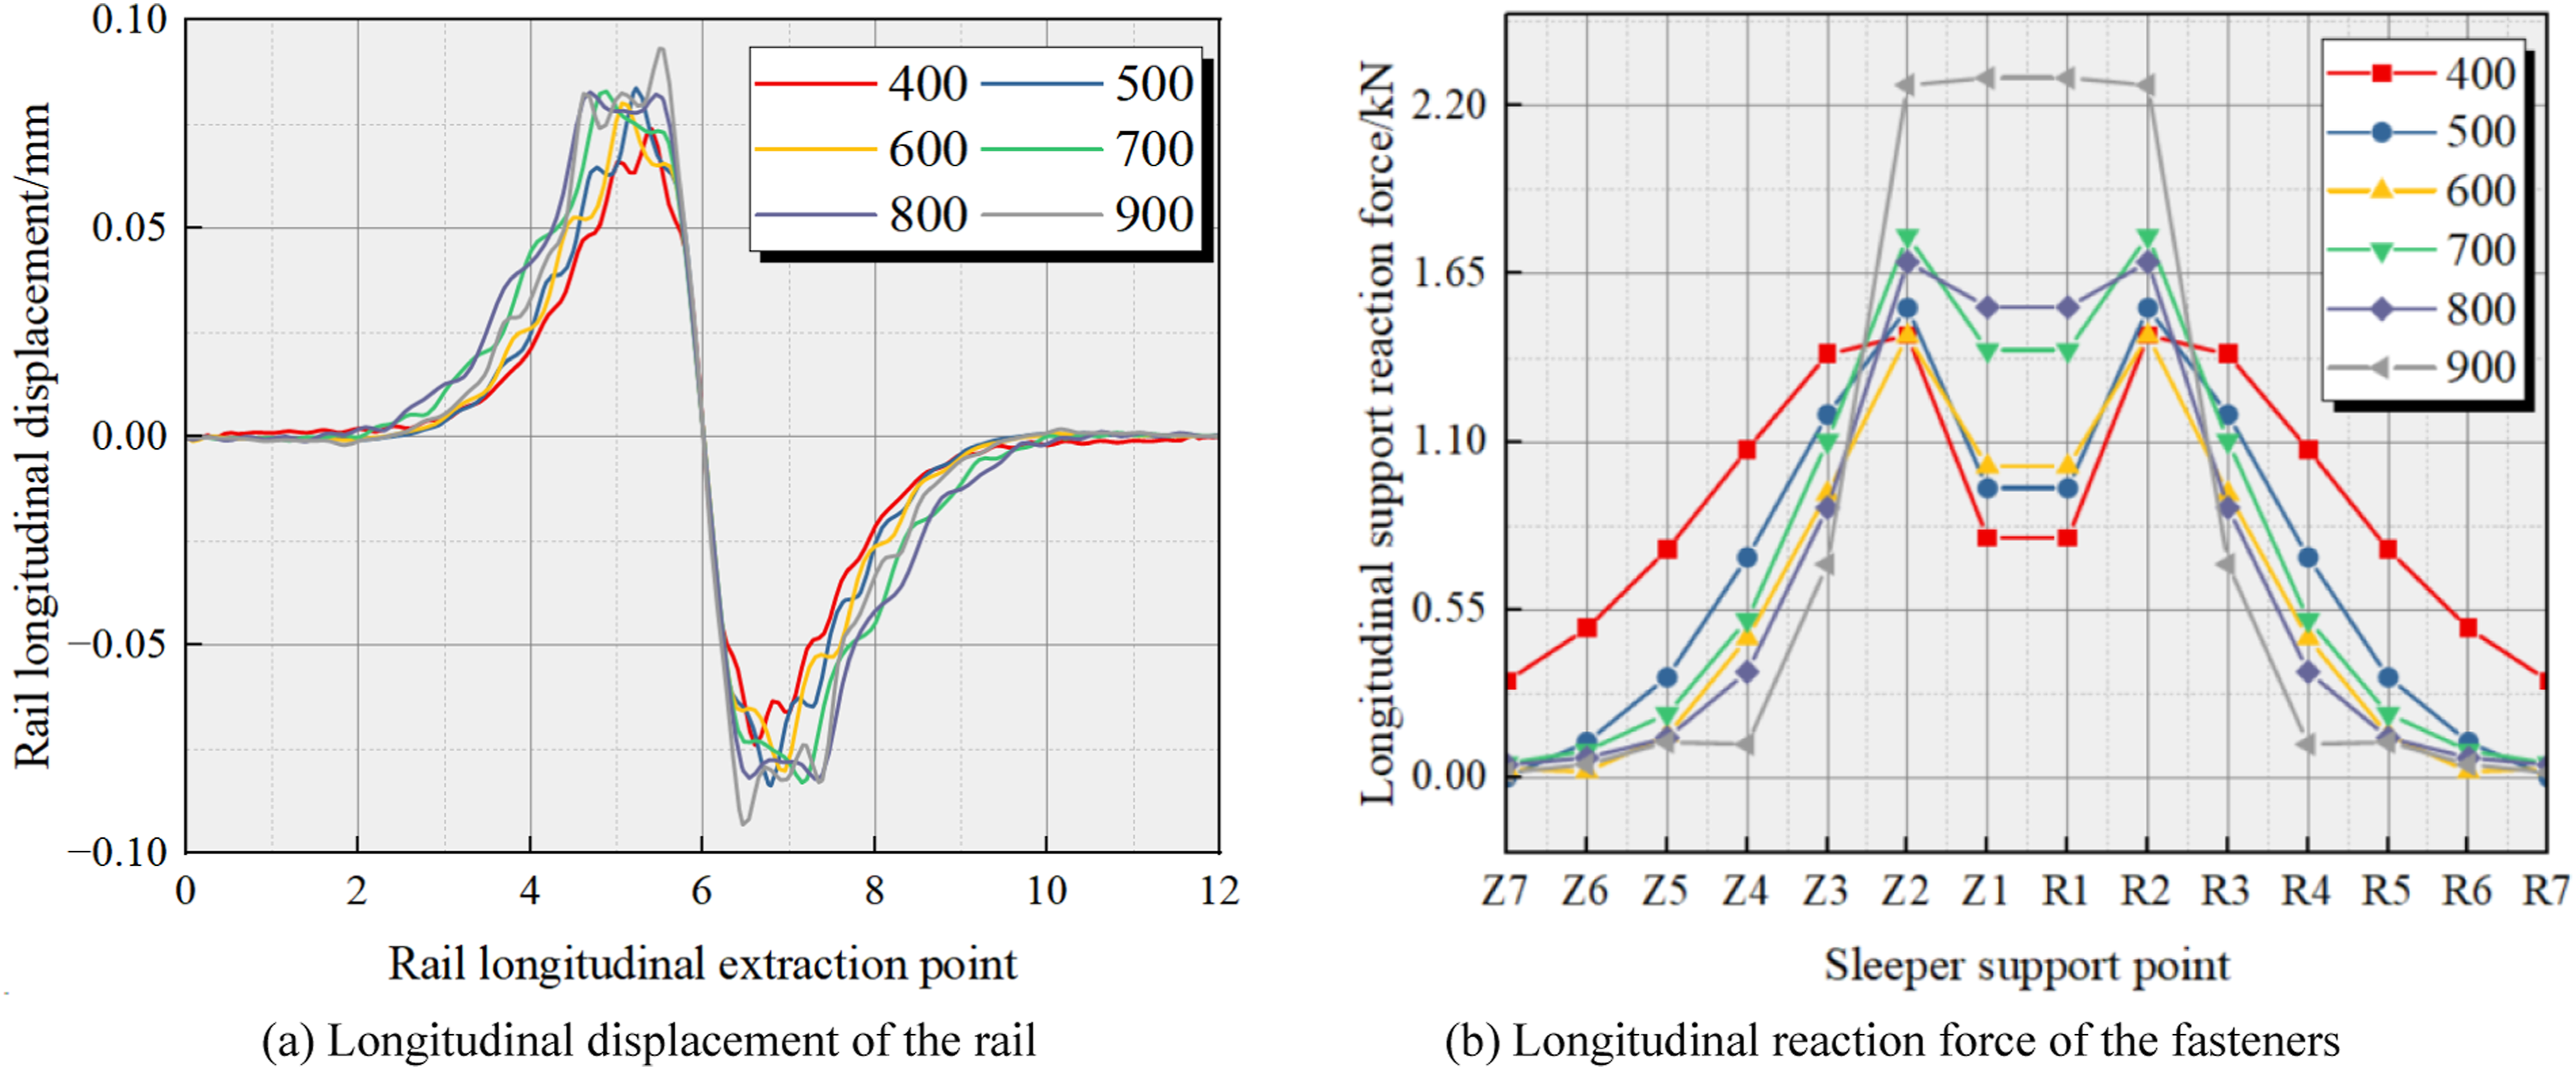
As shown in Figure 4(a), under static wheel load, the longitudinal rail displacement exhibits a local fluctuating distribution along the track direction, with the maximum value occurring near the loading point and gradually decreasing toward both sides, and the overall distribution is basically symmetric. As the sleeper spacing increases from 400 mm to 900 mm, both the peak and trough values of the longitudinal rail displacement increase significantly, and the curve becomes steeper, indicating that the longitudinal deformation and relative sliding tendency of the rail in the loading region are enhanced after the discrete support becomes weaker. Specifically, the longitudinal rail displacement is 0.0739 mm under the 400 mm case and increases to 0.0930 mm under the 900 mm case, corresponding to an increase of 25.8%. The longitudinal fastener reaction force also shows a symmetric distribution, but its distribution range shrinks markedly with increasing sleeper spacing, and the reaction force gradually concentrates near the loading point. Under the 400, 500, and 600 mm cases, the peak reaction forces at Z1 adjacent to the loading point are 0.78, 0.95, and 1.02 kN, respectively, while the reaction force at Z2 is larger, exceeding that at Z1 by 0.67, 0.59, and 0.43 kN, respectively. As the sleeper spacing further increases to 700 mm and 800 mm, the difference between Z1 and Z2 gradually decreases. When the sleeper spacing reaches 900 mm, the longitudinal fastener reaction force is mainly concentrated in a few fasteners near Z2, Z1, and their symmetric positions, with similar peak values reaching about 2.29 kN, whereas the reaction forces at the fourth pair of sleepers and beyond decay rapidly and approach zero.
As shown in Figure 5(a), under static wheel load, the vertical rail displacement presents a symmetric distribution along the track longitudinal direction centered near the loading point, and is overall characterized by the coexistence of a main downward deflection region and local upward arching on both sides. As the sleeper spacing increases, both the downward deflection and the upward arching increase simultaneously, and the vertical rail displacement under the 900 mm sleeper-spacing case is 44.4% greater than that under the 400 mm case. As shown in Figure 5(b), the vertical fastener reaction force is symmetrically distributed along the support points, and because the loading point is located between Z1 and R1, the reaction forces at these two fasteners are equal and serve as the main load-bearing points. With increasing sleeper spacing, the vertical fastener reaction force at Z1 rises from 21.297 kN under the 400 mm case to 35.057 kN under the 900 mm case, representing an increase of 64.6%. In contrast, the reaction force at the adjacent support point Z2 decreases from 13.668 kN to 10.308 kN. The reaction forces at support points farther from the loading point decay more rapidly and gradually approach zero, indicating that the number of support points effectively sharing the load decreases and that the load transfer range shrinks significantly.
Figures 4 and 5 collectively show that increasing sleeper spacing weakens the multi-point load-sharing capacity of the track structure in both the longitudinal and vertical directions, causing load transfer and structural deformation to become more concentrated in a few support points near the loading point. The underlying reason is that a larger sleeper spacing reduces the support density and equivalent stiffness of the track structure, making it more difficult for rail deformation to be effectively distributed through adjacent support points. As a result, the distribution range of the fastener reaction force contracts and the local span effect is intensified. These results indicate that changes in sleeper spacing significantly affect the force distribution characteristics of the rail and fasteners near the loading region.
3.2. Response of rails and track slabs to shear forces and bending moments
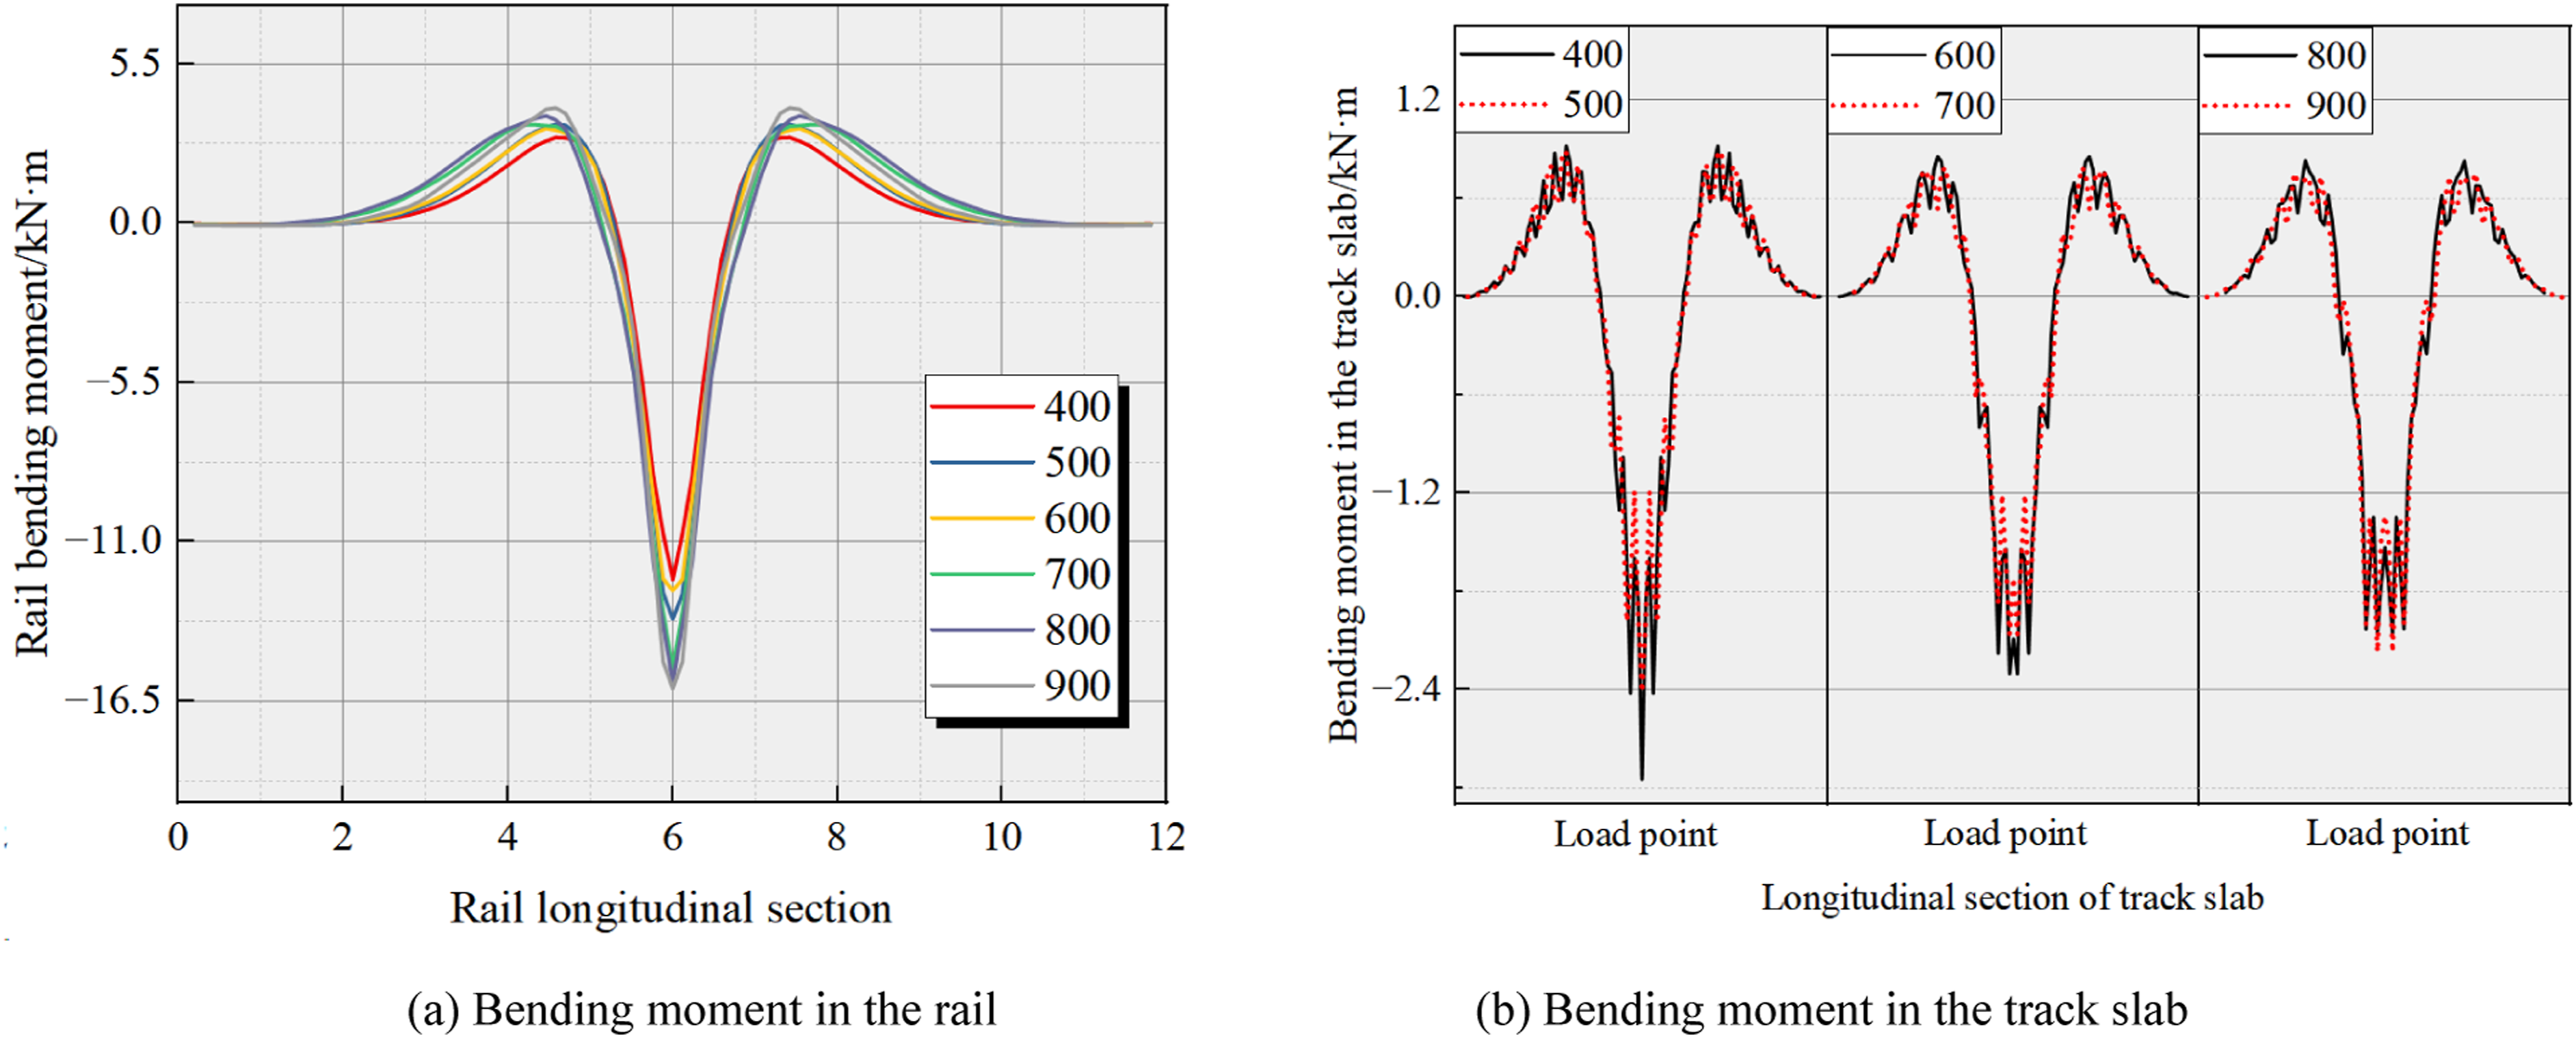
When extracting the shear force and bending moment, 100 sections were defined for the rails on both sides by taking the loading point as the center and slicing longitudinally toward both directions. The extracted results were then averaged to reduce the influence of local geometric errors during loading. For the track slab, 100 sections were directly defined by taking the loading point as the center and slicing toward both sides. Figure 6 shows the shear forces of the rail and track slab under single-point loading by the wheelset, and Figure 7 shows the corresponding bending moments. Shear force in the rail and track slab. Bending moment in the rail and track slab.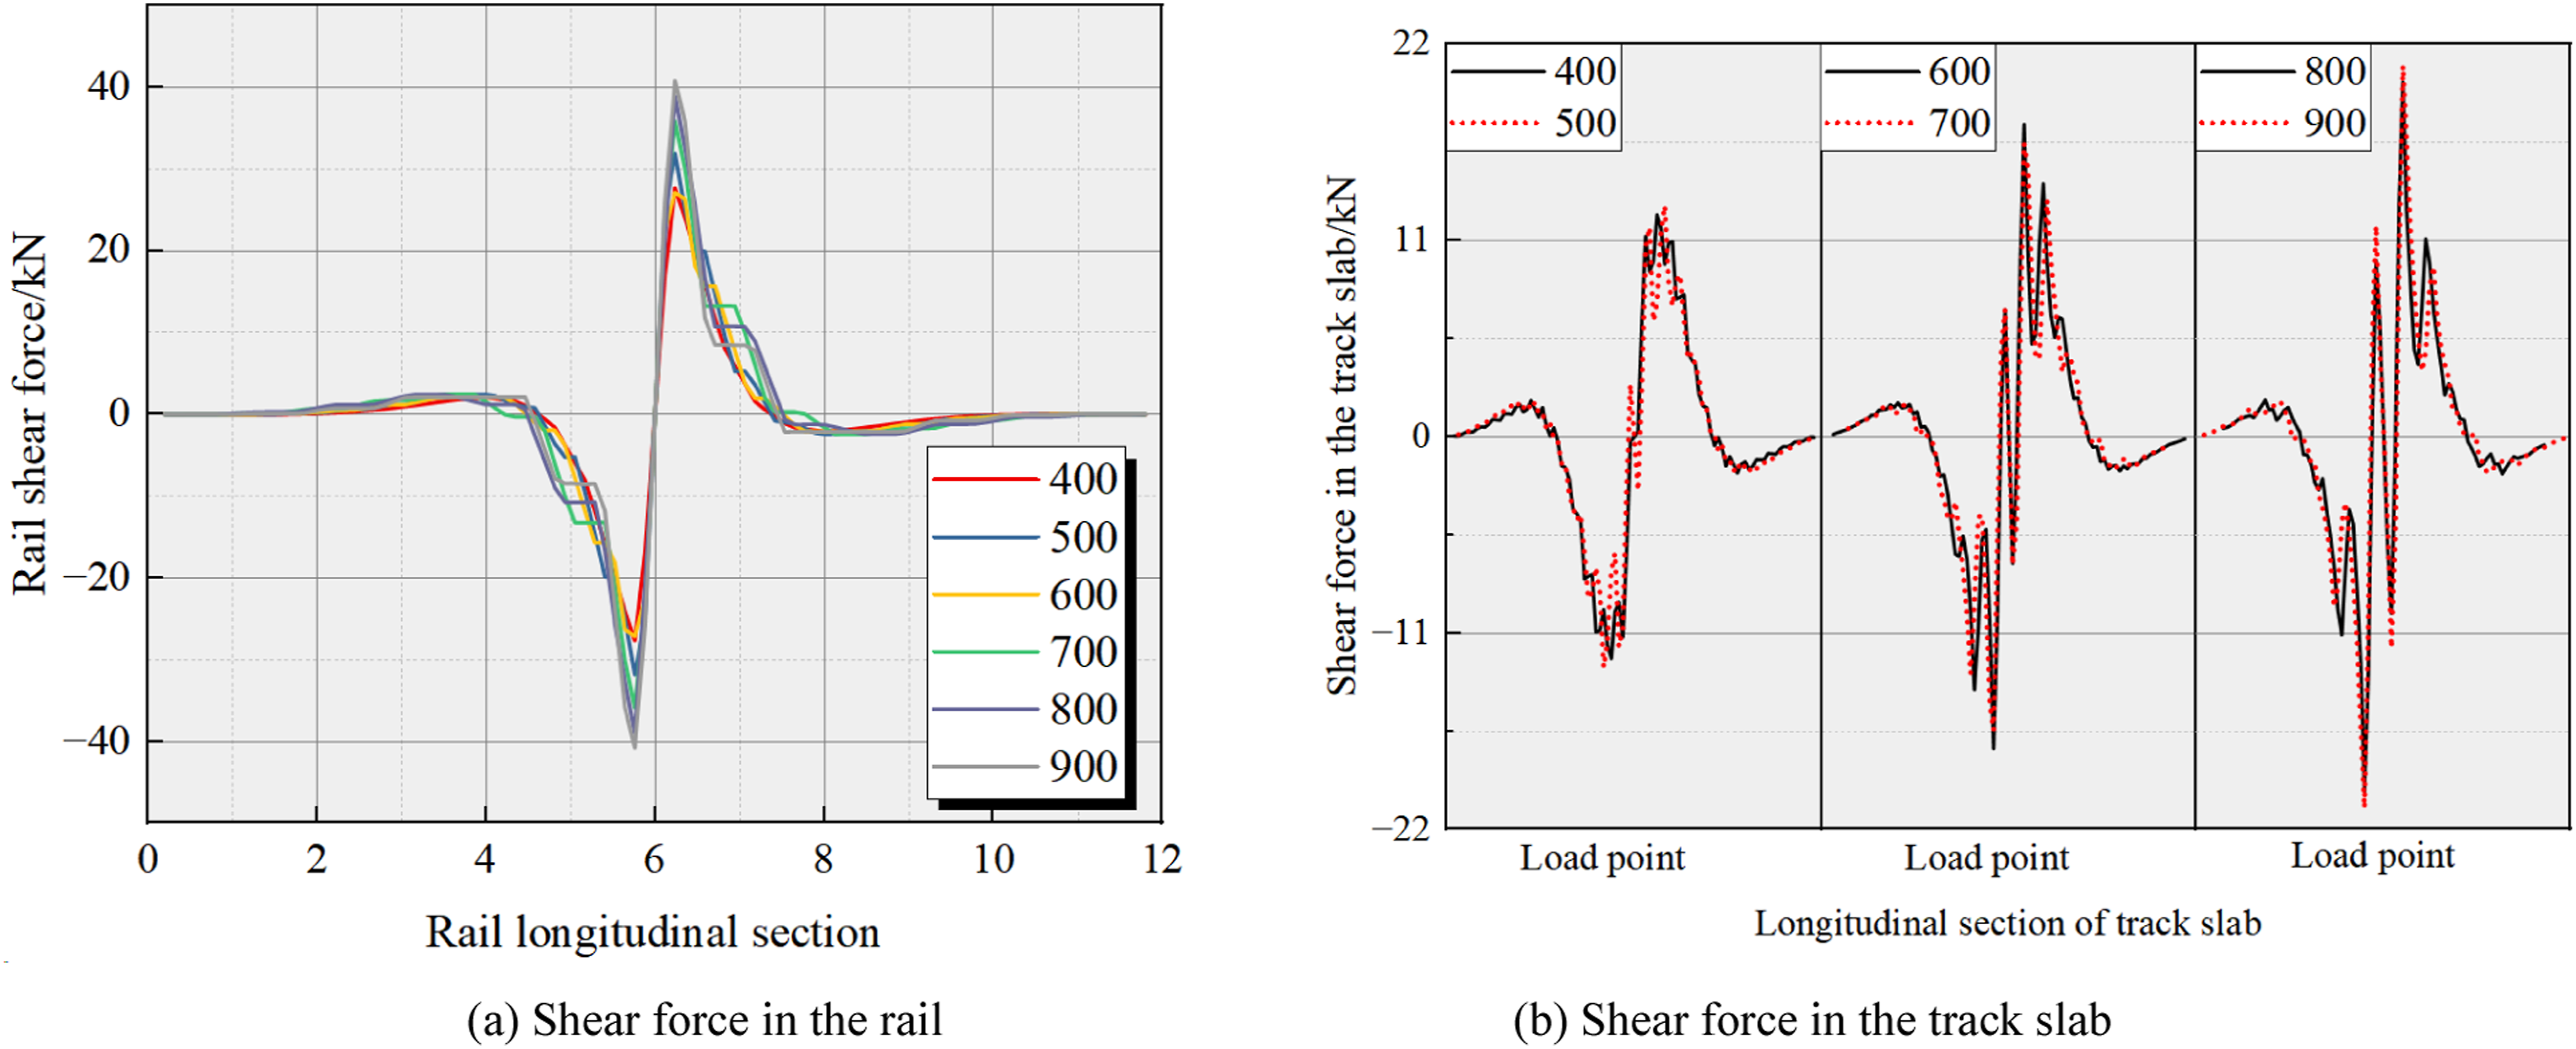
As shown in Figure 6(a), the rail shear force exhibits a symmetric distribution along the track longitudinal direction with the loading point as the center. A rapid sign change occurs near the loading point, and the shear force decays rapidly to nearly zero away from the loading point, indicating that the internal force equilibrium under vertical wheel load is mainly completed within a limited range near the loading region. As the sleeper spacing increases, the peak values of rail shear force near the loading point continue to rise, the peaks become sharper, and the shear transition zone becomes more concentrated. The peak rail shear force increases from 27.64 kN under the 400 mm case to 40.77 kN under the 900 mm case, corresponding to an increase of about 47.5%. This indicates that increasing sleeper spacing strengthens the local span effect of the rail so that the wheel load must be transferred through fewer support points, thereby significantly amplifying the sectional shear force of the rail. As shown in Figure 6(b), the track slab shear force also shows a symmetric distribution centered at the loading point, but more pronounced local fluctuations and multiple peaks appear near the loading point. This reflects that, after the wheel load is transferred to the track slab in a discrete manner through the double-block sleepers and fastening system, a relatively large shear gradient is generated in the local load-transfer region. The peak shear force of the track slab increases from 12.43 kN under the 400 mm case to 20.78 kN under the 900 mm case, corresponding to an increase of about 67.2%.
As shown in Figure 7(a), the rail bending moment exhibits a symmetric bending pattern along the track longitudinal direction that is typical of a beam under a single-point vertical load. A pronounced negative bending moment trough appears at the loading point, while positive bending moment peaks develop at a certain distance on both sides, after which the bending moment gradually decays to nearly zero. As the sleeper spacing increases from 400 mm to 900 mm, the most unfavorable negative bending moment at the loading point increases from −12.28 kN·m to −16.08 kN·m, an increase of about 30.9%. Meanwhile, the positive bending moment peak on both sides increases from 2.96 kN·m to 3.98 kN·m, an increase of about 34.4%, indicating that increasing sleeper spacing enhances the bending-moment concentration effect in the rail. As shown in Figure 7(b), the bending moment of the track slab also exhibits a symmetric distribution centered at the loading point, but more pronounced short-range fluctuations occur near the loading point, reflecting the non-uniform local bending behavior under discrete nodal load transfer. Under different sleeper spacing cases, the peak negative bending moment of the track slab generally shows a trend of first decreasing and then slightly increasing, decreasing from −2.95 kN·m under the 400 mm case to −1.87 kN·m under the 700 mm case, and then increasing to −2.17 kN·m under the 900 mm case. The peak positive bending moment of the track slab also decreases overall, from 0.92 kN·m under the 400 mm case to 0.75 kN·m under the 900 mm case. This indicates that increasing sleeper spacing weakens the overall longitudinal bending level of the track slab, although the local nodal control effect becomes somewhat stronger under very large spacing conditions.
As indicated by Figures 6 and 7, increasing sleeper spacing enhances the local force concentration effect near the loading region. Specifically, the peak values of the shear force in both the rail and the track slab increase while their distribution range contracts, the bending-moment concentration in the rail becomes more pronounced, and the bending moment of the track slab shows a trend of first decreasing and then locally increasing. This phenomenon is mainly attributed to the discrete load transfer path and the continuous support condition of the track slab. The wheel load is transmitted to the track slab through the rail–fastener–sleeper system, causing local downward bending near the loading point; meanwhile, the adjacent slab regions are restrained by the foundation support and slab continuity, resulting in curvature reversal and the formation of positive bending moments on both sides. These results indicate that changes in sleeper spacing significantly affect the internal force distribution characteristics of the rail and track slab under discrete support conditions.
4. The effect of rail sleeper spacing on the structural dynamic mechanical performance
This study adopted the field measurement layout shown in Figure 8 for the passage of a high-speed electric multiple unit train on the Lanzhou–Xinjiang high-speed railway TB/T 2489-2016 (2016). The measured train speed was 112 km/h, and the collected response quantities included rail vibration response, wheel–rail vertical force and lateral force, as well as track slab vibration response. In this test, a 16-channel INV3062 T data acquisition system developed by Oriental Institute was employed, with a sampling frequency of 6000 Hz (Bai et al., 2026). The sampling frequency of 6000 Hz provides a Nyquist frequency of 3000 Hz, which is higher than the dominant frequency range of the measured rail and slab responses considered in this validation. These indicators characterize the wheel–rail interaction, rail dynamic response, and track slab vibration behavior, respectively. Among them, the rail vibration response can directly reflect the vibration and deformation levels of the rail under train-passage conditions and therefore serves as a key observable for evaluating vehicle passing performance and track dynamic effects. The wheel–rail vertical force and lateral force are used to characterize the intensity of wheel–rail interaction and its variation, whereas the track slab vibration response is used to reflect the dynamic transmission and vibration response of the underlying track structure. Based on an integrated validation framework involving vibration response, deformation response, and wheel–rail force, the model was validated from three aspects, namely, rail response, wheel–rail contact force response, and track slab response. Specifically, rail vertical displacement and vertical acceleration were selected to characterize the dynamic deformation and vibration level of the rail, rail vertical wheel–rail force was used to represent the wheel–rail excitation input, and track slab acceleration was employed to characterize the dynamic transmission and vibration characteristics of the underlying track structure, thereby enabling a comprehensive verification of the vehicle–track coupled dynamic model. In the dynamic response analysis under different sleeper-spacing cases, this study focuses on rail vibration response and wheel–rail contact force as the main evaluation indices. This is because changes in sleeper spacing directly alter the discrete support state, equivalent span, and support stiffness distribution of the rail, to which rail acceleration and displacement are the most sensitive. Meanwhile, as the core interaction quantity at the vehicle–track coupled interface, wheel–rail contact force can directly characterize the influence of sleeper-spacing variation on wheel–rail interaction and vehicle passing performance. Layout of on-site test points for high-speed railway.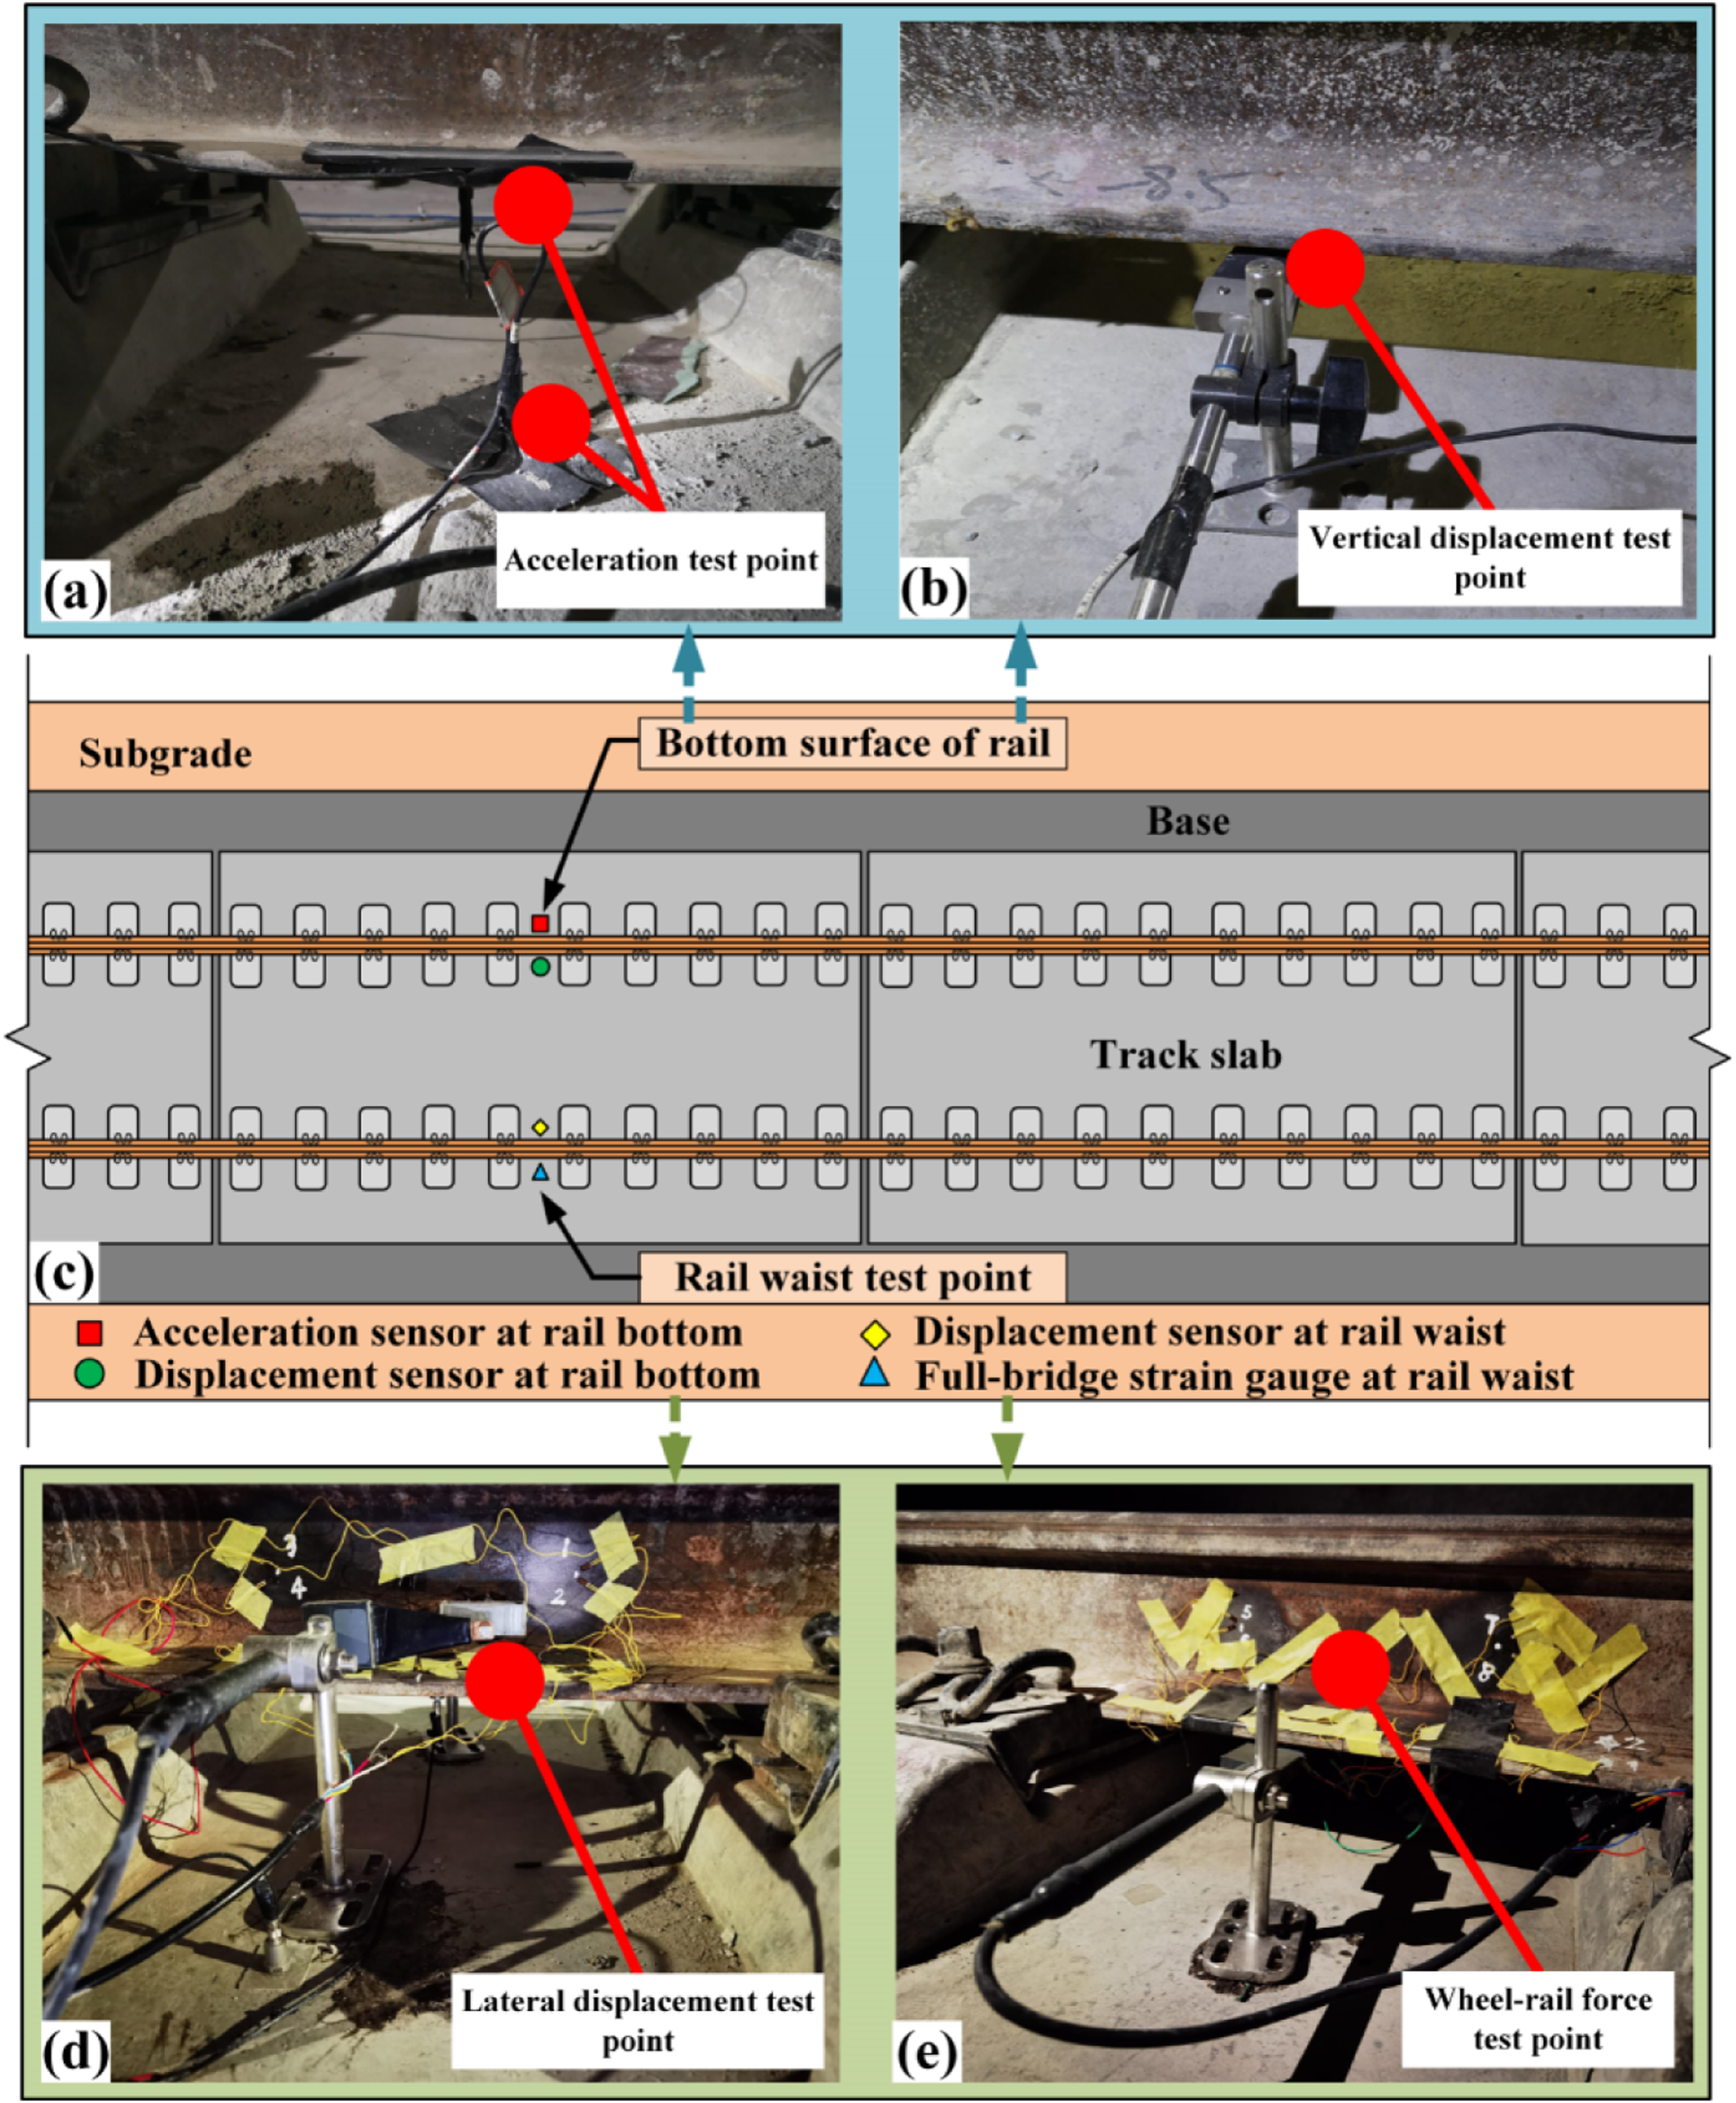
Figures 9 and 10 present the comparison between field measurements and numerical results for key response quantities, including rail acceleration, rail displacement, track slab acceleration, and wheel–rail force. In the field test, the measuring points for rail acceleration and displacement were arranged at the bottom of the rail between two adjacent sleepers. The measuring point for track slab acceleration was located in the track slab region between two adjacent pairs of sleepers. The measuring position corresponding to the wheel–rail vertical force was arranged at the rail web. To ensure comparability and consistency, the corresponding response time histories and peak indices were extracted in the numerical model strictly according to the above field measuring-point locations, so that the simulation outputs corresponded one-to-one with the field observations in space. In the dynamic numerical analysis, the integration/output time interval was set to 5.0 × 10⁻⁶ s to ensure sufficient temporal resolution and reliable extraction of transient peak responses during train passage. In addition, considering the time cost of explicit dynamic analysis and the model scale, a single vehicle was adopted as the baseline case for the train-passage simulation, and the superposition effect of interactions between adjacent vehicles under train-set conditions on the wheel–rail force and track response was not further considered. This simplification was adopted to improve the computational efficiency of model validation while ensuring that the main dynamic characteristics could still be captured accurately. Comparison between measured data and numerical results for rail vibration response. Comparison between measured data and numerical results for wheel–rail force and track slab vibration response.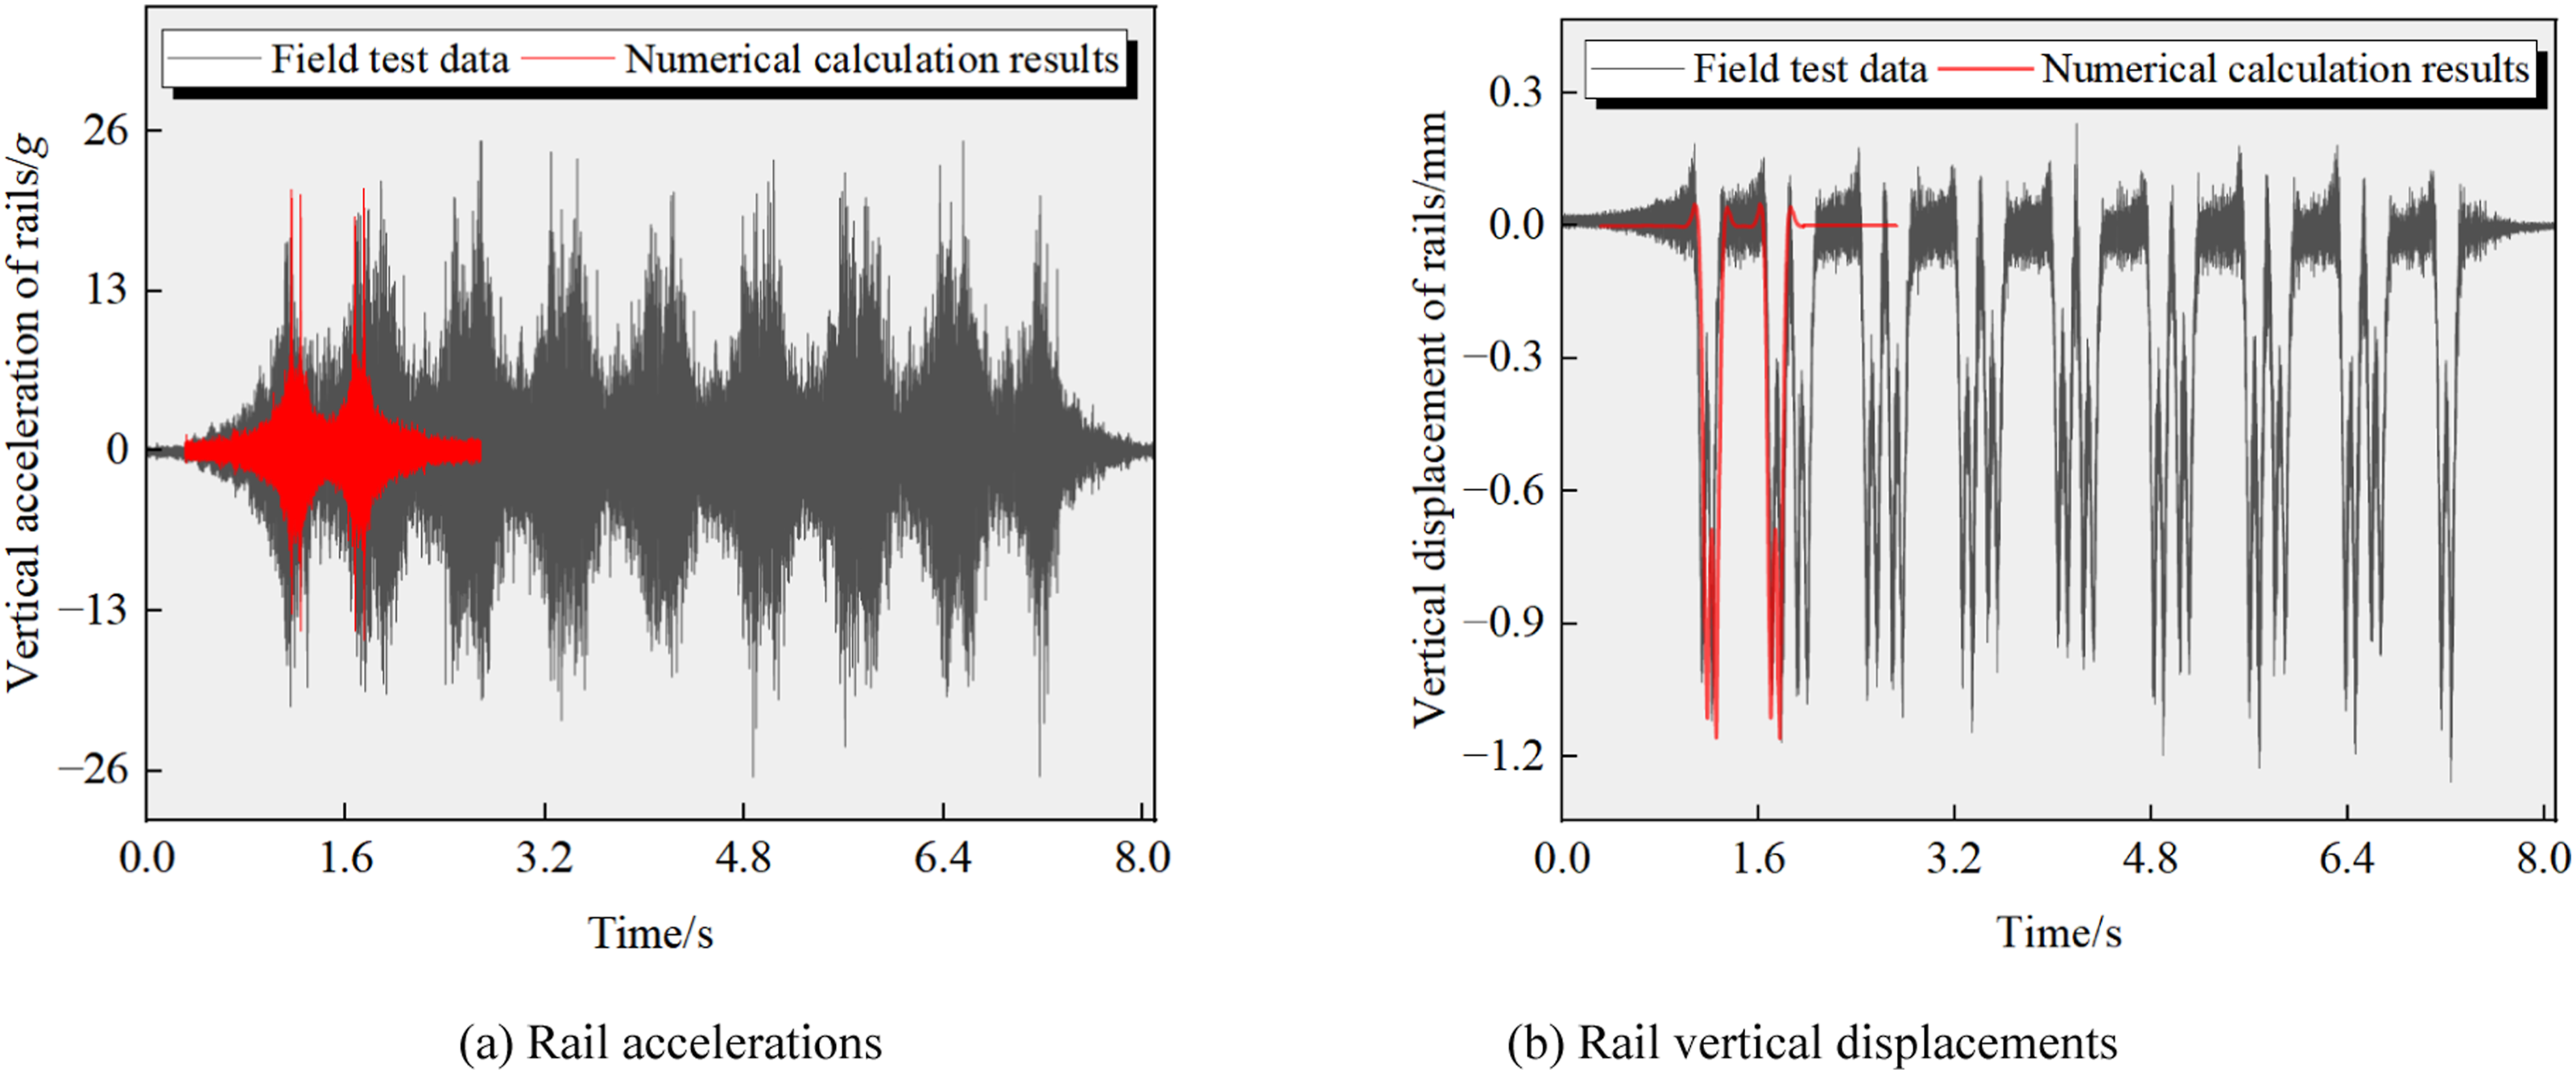
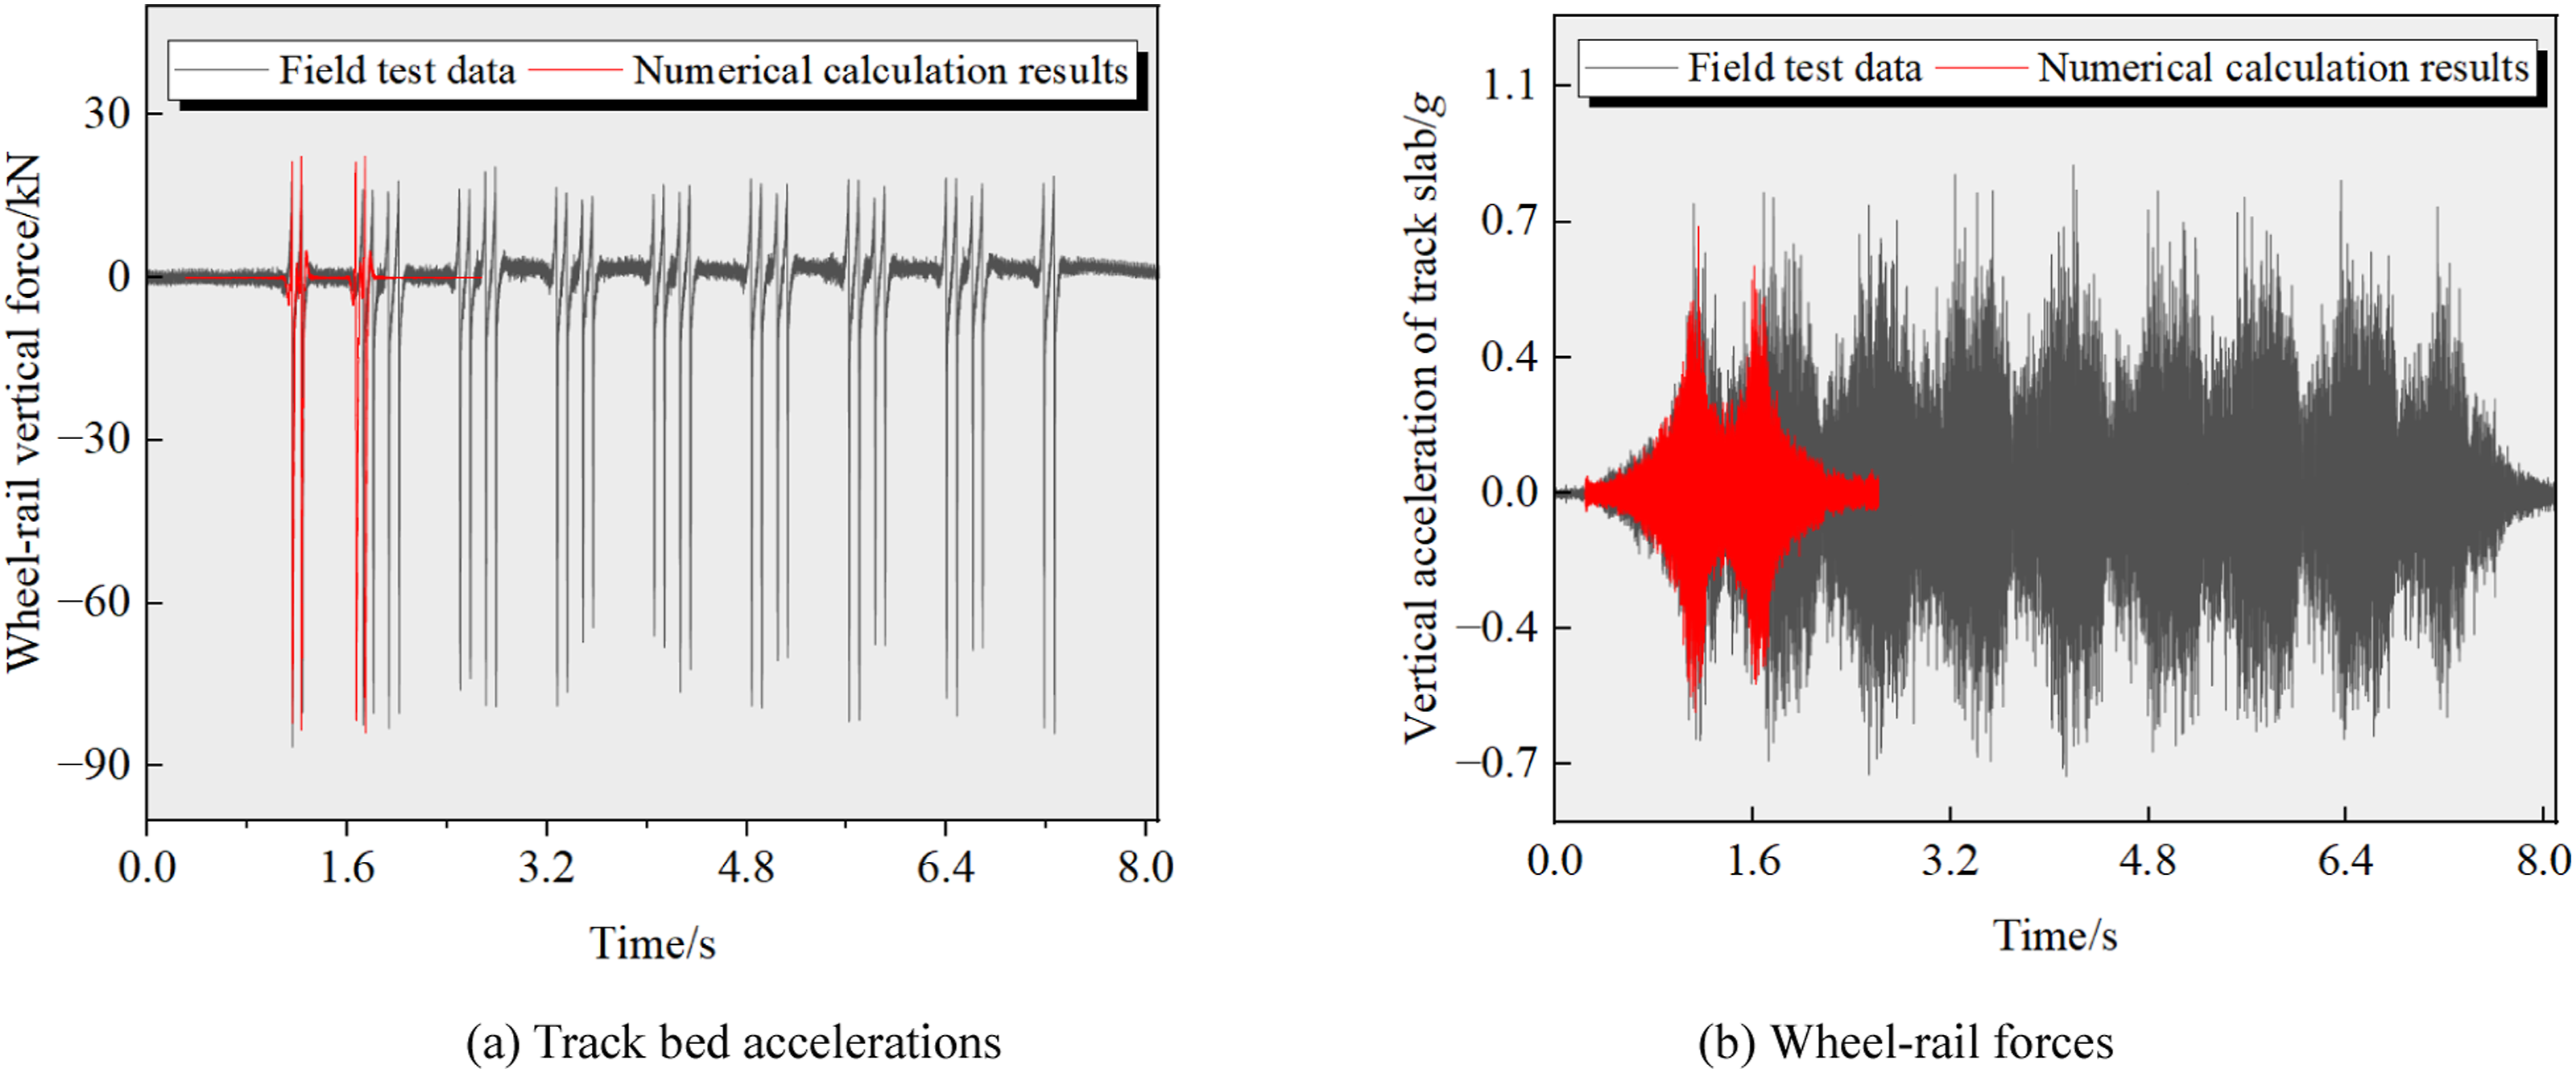
As shown in Figures 9 and 10, the numerical results are generally consistent with the field measurements in terms of both the amplitudes and variation patterns of the main response quantities. To further quantify the validation accuracy, the relative errors of the main peak responses were calculated. The measured and calculated peak rail vertical accelerations are 21.934 g and 21.24 g, respectively, with an error of 3.16%. The measured and calculated rail vertical displacements are 1.12972 mm and 1.12 mm, respectively, with an error of 0.8%. The measured and calculated wheel–rail vertical forces are 86.499 kN and 83.87 kN, respectively, with an error of 3.03%. For the track slab acceleration, the measured and calculated peak values are 0.79 g and 0.72 g, respectively, corresponding to an error of 8.8%. These results indicate that the numerical model can reasonably reproduce the main dynamic responses of the vehicle–track system. In particular, the peak rail vertical acceleration agrees well with the measured result. However, owing to factors such as rail corrugation, weld irregularities, discrete fastener parameters, and local structural and geometric defects in the actual track, the field excitation is more complex in the high-frequency range, which results in relatively richer high-frequency components in the measured responses. The calculated rail vertical displacement is in good agreement with the measured value, indicating that the dynamic model matches the field test results well. The fluctuation amplitude of the calculated track slab acceleration is slightly lower than the measured value. This is mainly because the bottom boundary of the base slab was idealized as fully fixed in the numerical model, which weakens the flexibility and damping energy dissipation effects of the actual foundation-base slab system and thus makes the local slab vibration more sensitive. Nevertheless, its peak level and time-history characteristics remain basically consistent with the measured results. The calculated vertical wheel–rail force also agrees well with the measured data, indicating that the model can accurately capture the wheel–rail interaction under train-passage conditions and its dynamic transmission to the track structure.
4.1. Dynamic response of rails
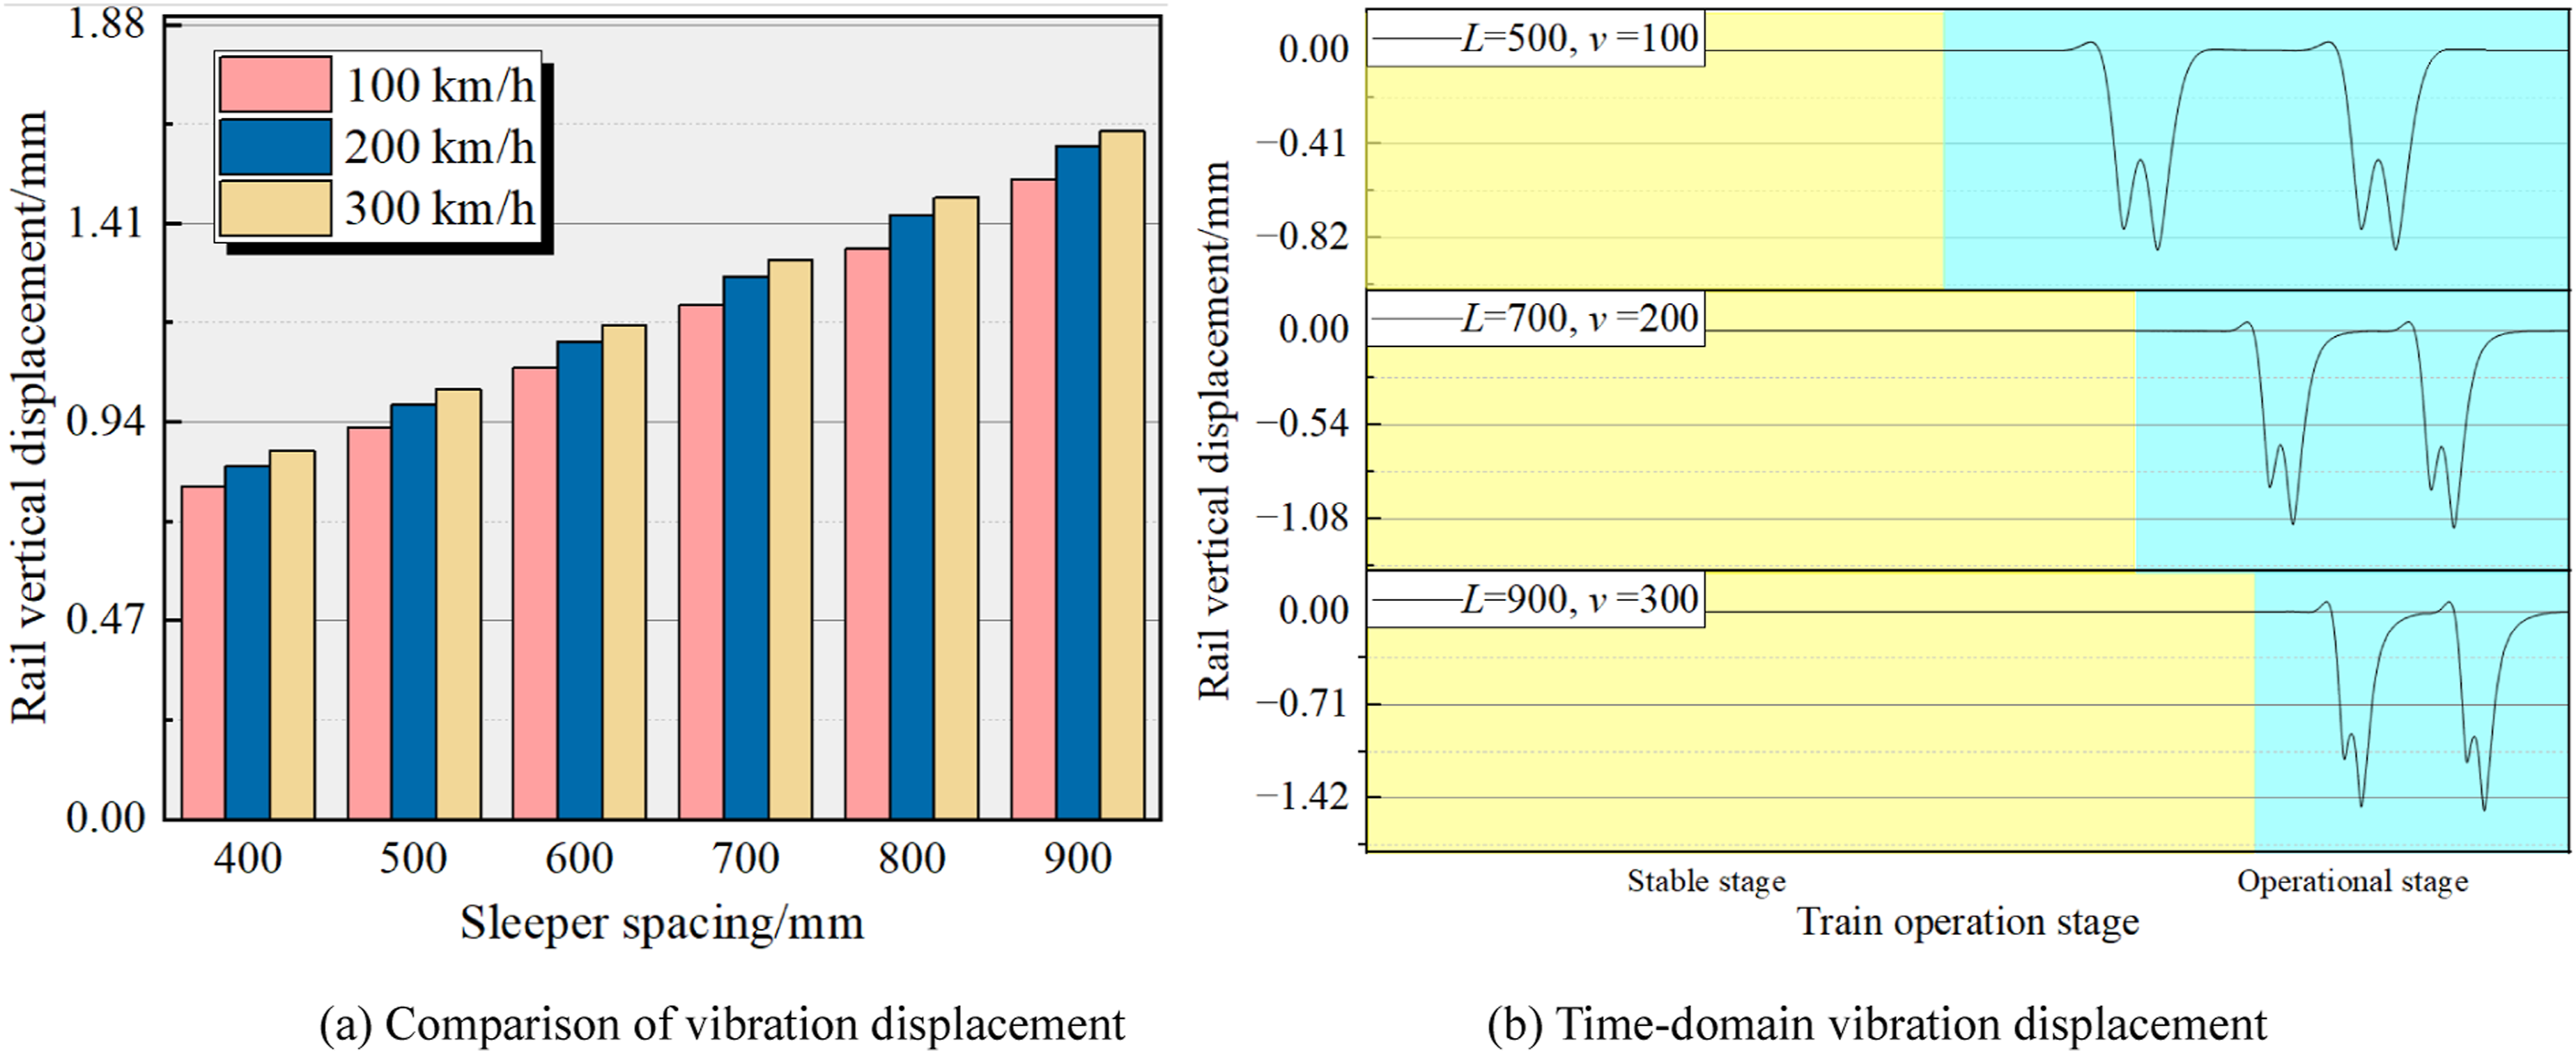
Based on the vehicle–track coupled dynamic model and the finite element model of the double-block ballastless track structure established above, six sleeper-spacing cases ranging from 400 mm to 900 mm were considered in this study, with an interval of 100 mm between adjacent cases. The vertical rail vibration acceleration responses were then calculated at train speeds of 100 km/h, 200 km/h, and 300 km/h. Figure 11 presents the comparison of peak rail vibration acceleration and the typical time-history responses, while Figure 12 shows the corresponding rail displacement responses. Vibration acceleration response of the rail. Vibration displacement response of the rail.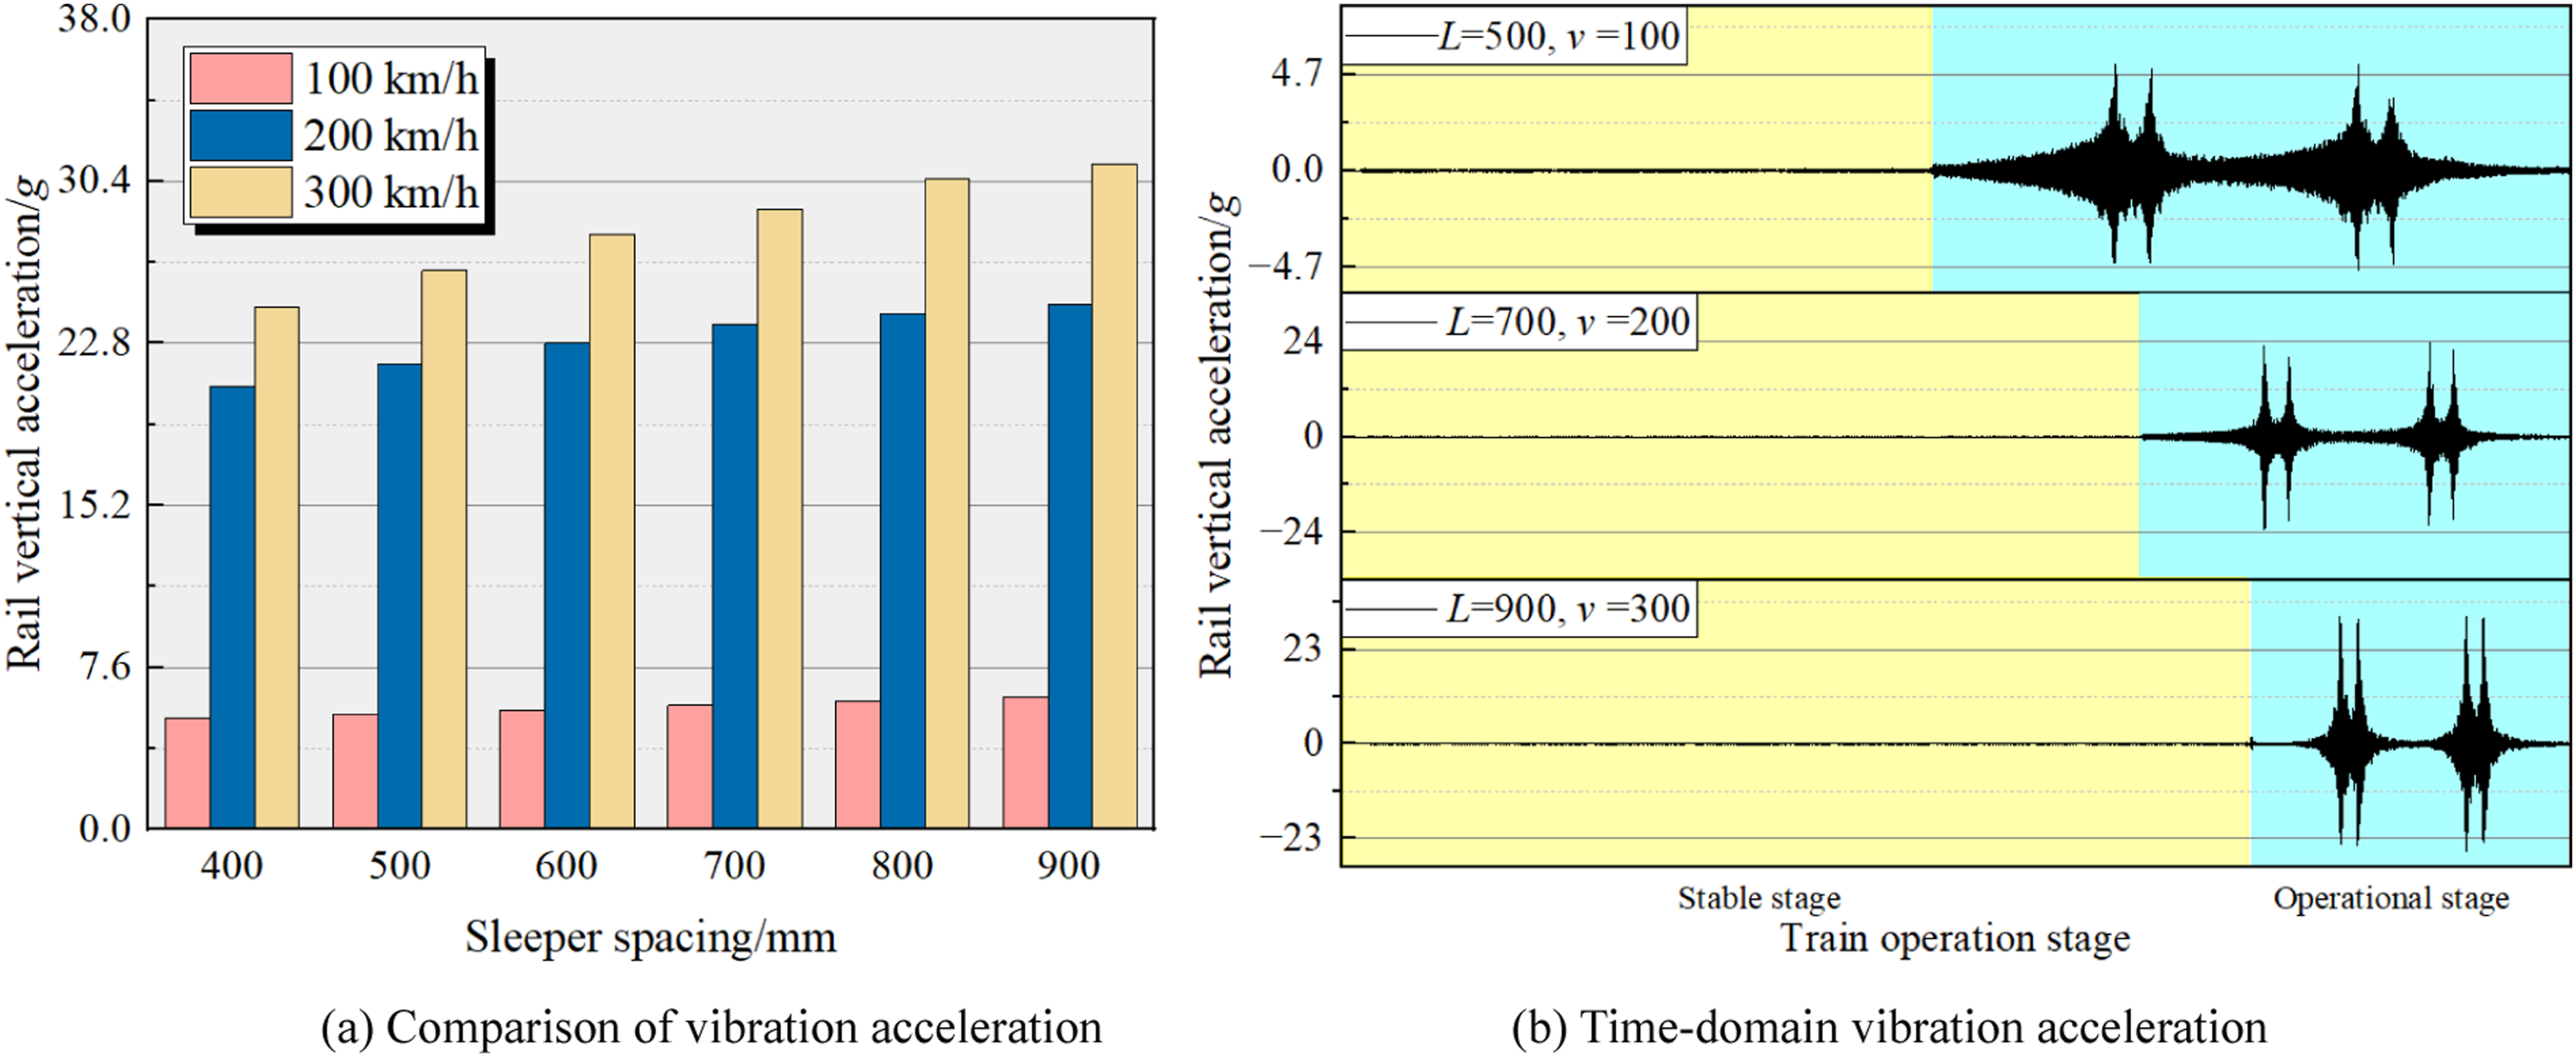
As shown in Figure 11, the vertical rail vibration acceleration is jointly influenced by train speed and sleeper spacing, and its sensitivity to sleeper spacing becomes more pronounced under high-speed conditions. Figure 11(a) and (b) show that, at a train speed of 100 km/h, the peak rail acceleration increases gradually with increasing sleeper spacing, and the overall variation remains relatively small. Specifically, when the sleeper spacing increases from 500 mm to 700 mm, the peak value rises from 5.4 g to 5.8 g, corresponding to an increase of 7.41%. When the sleeper spacing is further increased to 900 mm, the peak value reaches 6.2 g, which is 14.81% higher than that at 500 mm. This indicates that, under low-speed conditions, the effect of sleeper spacing on rail acceleration remains relatively limited. When the train speed increases to 200 km/h and 300 km/h, however, the peak rail acceleration increases significantly, and the increasing trend with sleeper spacing becomes more evident. At 200 km/h, the peak values corresponding to sleeper spacings of 400, 500, 600, 700, 800, and 900 mm are 20.8, 21.8, 22.8, 23.7, 24.2, and 24.6 g, respectively, which are approximately 3.97 to 4.09 times those at 100 km/h for the same sleeper spacing; among them, the values at 400 mm and 700 mm are 4.00 and 4.09 times higher, respectively. At 300 km/h, the peak values further increase to 24.5, 26.2, 27.9, 29.1, 30.5, and 31.2 g, respectively, corresponding to approximately 4.71 to 5.08 times those at 100 km/h, with the 800 mm case reaching 5.08 times. These results indicate that the increase in train speed is the dominant factor driving the growth of vertical rail vibration acceleration, while a larger sleeper spacing further amplifies the vibration response under high-speed operating conditions.
As shown in Figure 12(a) and (b), the peak rail vertical displacement increases steadily with increasing sleeper spacing, and this trend remains essentially consistent at different train speeds, indicating that the displacement response is more sensitive to sleeper spacing. At a train speed of 100 km/h, when the sleeper spacing increases from 400 mm to 900 mm, the peak displacement rises from 0.7881 mm to 1.5144 mm, corresponding to an increase of 92.16%. At 200 km/h and 300 km/h, the peak displacement increases from 0.8358 mm to 1.5915 mm and from 0.8719 mm to 1.6276 mm, with increases of 90.42% and 86.67%, respectively. By contrast, under the same sleeper spacing, increasing the train speed from 100 km/h to 300 km/h leads only to a slight increase in the peak displacement, with an increase ranging from about 7.47% to 10.63%. This indicates that, when track irregularity is not considered, the rail vertical displacement is still dominated by the quasi-static deflection induced by wheel load, whereas the contribution of inertial amplification caused by high-speed operation is relatively limited. From the time-history curves, as the operating conditions change from L = 500&v = 100 to L = 700&v = 200 and then to L = 900&v = 300, the rail displacement waveform becomes progressively steeper. The main reason is that increasing sleeper spacing enlarges the effective rail span and reduces the number of support points per unit length, thereby decreasing the equivalent vertical support stiffness and causing the peak rail vertical displacement and fluctuation amplitude to increase simultaneously.
4.2. Wheel–rail force response
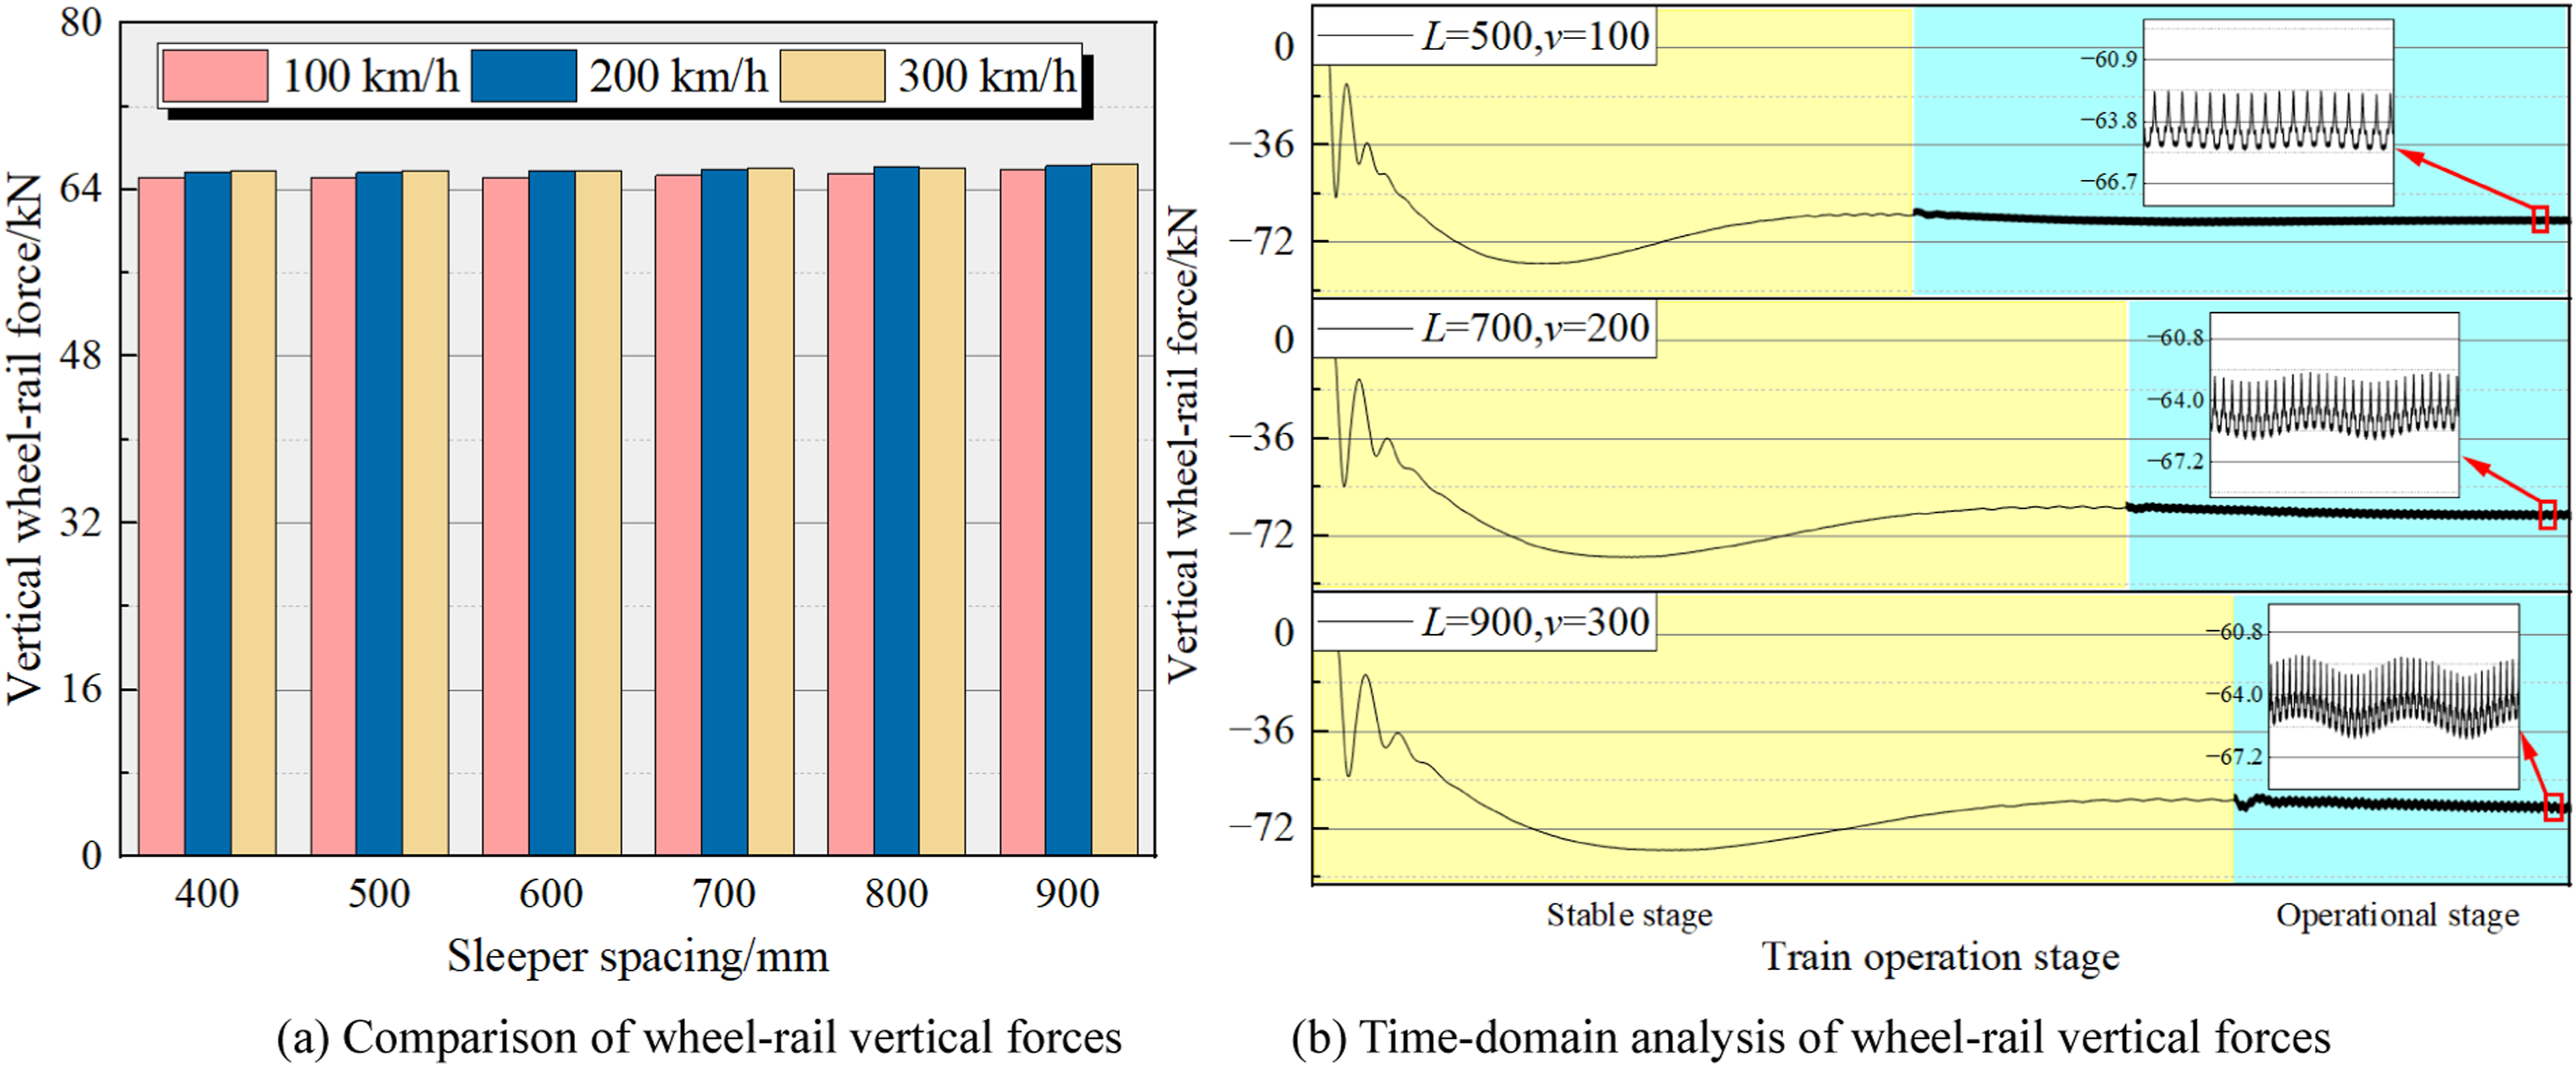
Wheel–rail force is an important indicator for characterizing the dynamic interaction of the vehicle–track coupled system. Changes in sleeper spacing alter the discrete support conditions of the rail, thereby affecting the response characteristics of the wheel–rail lateral force and vertical force. Therefore, this study further analyzes the response patterns of wheel–rail force under different sleeper-spacing conditions. Figures 13 and 14 show the wheel–rail lateral force and vertical force under different sleeper-spacing conditions. Moving wheelset–rail lateral force responses. Moving wheelset–rail vertical force responses.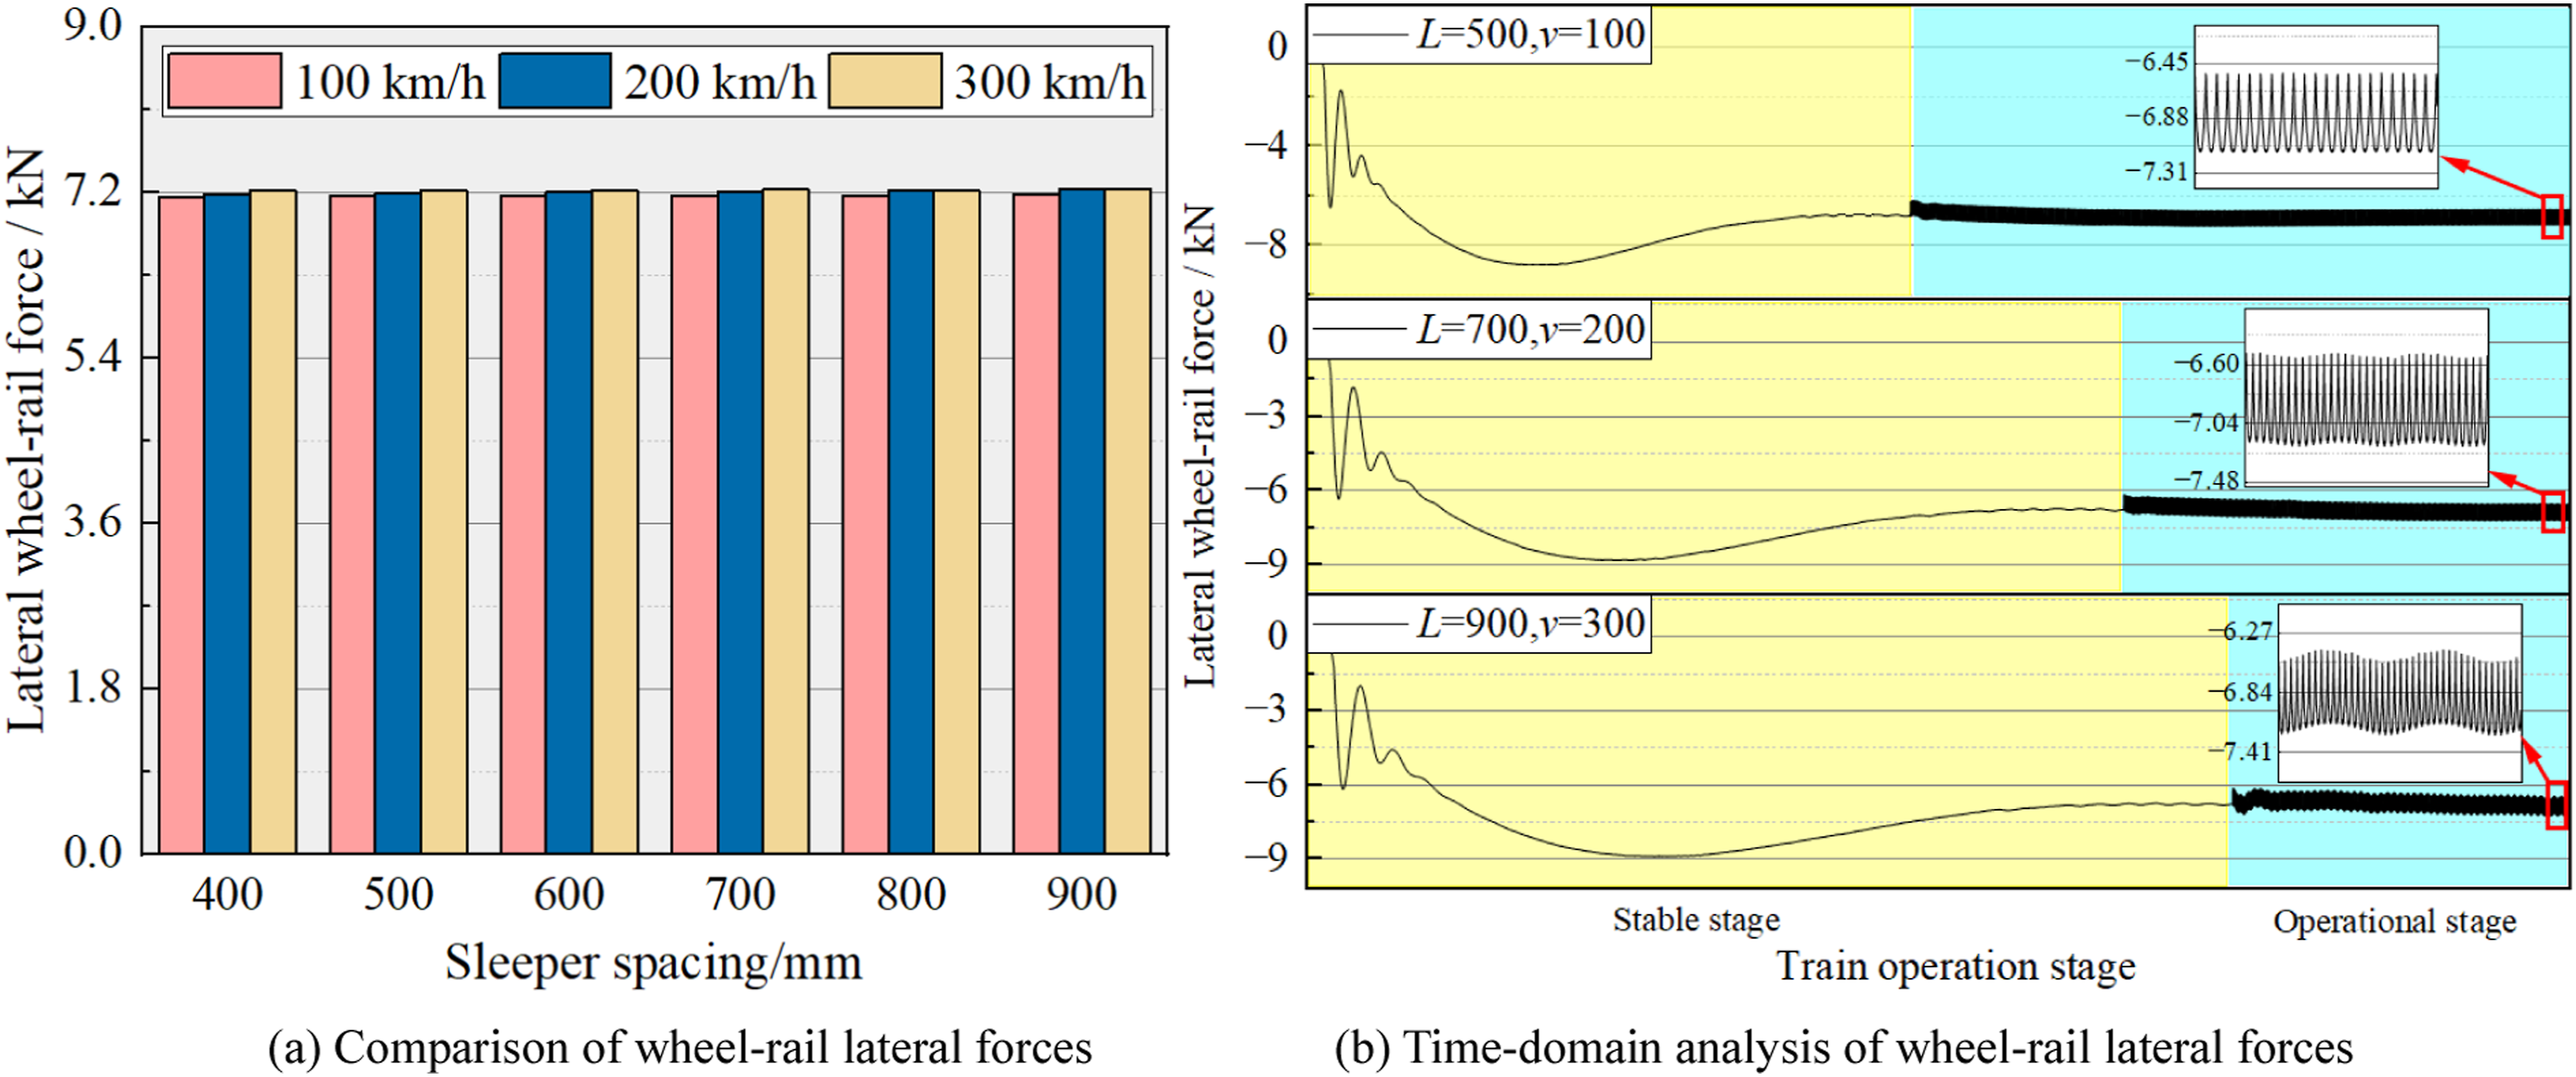
As shown in Figure 13(a), the peak wheel–rail lateral force remains within the range of 7.15 kN to 7.24 kN, and its variation with sleeper spacing and train speed is small. This indicates that, under the conditions where track irregularity is not considered and the wheel–rail contact parameters remain unchanged, the peak wheel–rail lateral force is mainly governed by the wheel–rail geometric relationship and contact state, whereas the influence of sleeper spacing is limited. At 100 km/h, the wheel–rail lateral force increases from 7.152 kN for the 400 mm case to 7.180 kN for the 900 mm case, corresponding to an increase of only 0.39%. At 200 km/h, it increases from 7.178 kN to 7.232 kN, with an increase of 0.75%; at 300 km/h, it increases from 7.217 kN to 7.242 kN, with an increase of 0.34%. Under the same sleeper spacing, the peak increase at 300 km/h relative to that at 100 km/h generally does not exceed approximately 1.3%, indicating that the amplifying effect of train speed on the peak wheel–rail lateral force is also insignificant. As shown in Figure 13(b), with increasing sleeper spacing, the fluctuation amplitude and envelope variation of the time-history curve of wheel–rail lateral force gradually become more pronounced, and the oscillation characteristics in local segments are more evident.
As shown in Figure 14(a), the peak wheel–rail vertical force remains generally stable within the range of 65.10 kN to 66.49 kN, and its variation with sleeper spacing and train speed is likewise small. This indicates that, under the conditions where track irregularity is not considered and the wheel–rail contact parameters remain unchanged, the wheel–rail vertical force is still dominated by the static load component, and the influence of sleeper spacing on its peak level is limited. At 100 km/h, the wheel–rail vertical force increases from 65.0964 kN for the 400 mm case to 65.945 kN for the 900 mm case, corresponding to an increase of 1.30%. At 200 km/h, it increases from 65.62 kN to 66.2562 kN, with an increase of 0.97%; at 300 km/h, it increases from 65.748 kN to 66.489 kN, with an increase of 1.13%. Under the same sleeper spacing, the peak increase caused by raising the train speed from 100 km/h to 300 km/h generally does not exceed approximately 1.0% to 1.5%, indicating that the amplifying effect of train speed on the peak wheel–rail vertical force is also limited. As shown in Figure 14(b), with increasing sleeper spacing, the oscillation amplitude and envelope variation of the time-history curve of wheel–rail vertical force become significantly stronger. Meanwhile, as the operating conditions change from L = 500&v = 100 to L = 700&v = 200 and then to L = 900&v = 300, the increments of wheel–rail force relative to the static vertical force are 0.172 kN, 0.571 kN, and 1.0302 kN, respectively, indicating that the increase in wheel–rail force is manifested not in a substantial rise in peak value, but in the continuous enhancement of its dynamic fluctuation component.
Considering the influence of sleeper spacing on wheel–rail force as a whole, the effect of sleeper spacing on the peak levels of wheel–rail lateral force and vertical force is relatively small. Within the sleeper-spacing range from 400 mm to 900 mm, the peak increases of both forces generally do not exceed approximately 1.5%, and the variation trends under different train speeds remain basically consistent. However, sleeper spacing has a much more significant influence on the time-domain fluctuation characteristics of wheel–rail force, as reflected by the increasing oscillation amplitude and envelope variation during operation with increasing sleeper spacing. In other words, the mean level of wheel–rail force changes little, whereas its dynamic fluctuation becomes markedly stronger. The reason for this pattern is that, under the conditions where track irregularity is not introduced and the wheel–rail contact parameters remain unchanged, the peak wheel–rail force is mainly determined by the static load component of the vehicle as well as the wheel–rail contact geometry and contact state, so changes in sleeper spacing cannot significantly increase the peak value. However, increasing sleeper spacing reduces the continuity of the equivalent support along the track and enlarges the discrete span, making the deformation coordination of the rail and the redistribution of support reactions between discrete supports more intense. As a result, the dynamic component of wheel–rail contact force is more easily excited, and its time-history fluctuation is further amplified.
5. Conclusions
This study established a Hertzian wheel–rail contact model and a three-directional fastener connector model to investigate the static and dynamic response characteristics of double-block ballastless track under different sleeper spacing conditions. Combined with field test data from the Lanzhou–Xinjiang high-speed railway, the model was validated against rail acceleration, rail displacement, track slab acceleration, and wheel–rail force. On this basis, within the framework of vehicle–track coupled dynamics, the static load-bearing characteristics and train-passage dynamic responses of the track structure under different sleeper spacings were systematically analyzed. The main conclusions are as follows: (1) Increasing sleeper spacing significantly amplifies both the longitudinal and vertical deformations of the rail and causes the distribution of fastener reaction forces to shift gradually from multi-point sharing to concentration near the loading region. Specifically, as the sleeper spacing increases from 400 mm to 900 mm, the peak longitudinal rail displacement increases by about 26%, while the maximum rail deflection increases by about 44%. Meanwhile, the vertical fastener reaction force at the central fastener increases significantly, indicating that the local force concentration effect near the loading region becomes markedly stronger with increasing sleeper spacing. (2) Increasing sleeper spacing generally intensifies the internal force concentration effect in the rail near the loading region, as reflected by the obvious increase in the peak values of shear force and bending moment and the enhancement of the local rail span effect. The internal forces of the track slab are more sensitive to changes in support density. Under large sleeper spacing conditions, although the overall bending level tends to decrease, the local nodal load-transfer effect becomes stronger, which still leads to more pronounced concentration and fluctuation of local shear force and bending moment. (3) Rail acceleration is more sensitive to changes in train speed, and increasing sleeper spacing has a clear amplifying effect under high-speed conditions. Within the investigated sleeper-spacing range, the peak rail acceleration is 5.4–6.2 g at 100 km/h, increases to 20.8–24.6 g at 200 km/h, and further reaches 24.5–31.2 g at 300 km/h. By contrast, rail displacement is more sensitive to sleeper spacing. When the sleeper spacing increases from 400 mm to 900 mm, the peak displacement nearly doubles. Under the same sleeper spacing, however, increasing the train speed from 100 km/h to 300 km/h causes only a slight increase, indicating that rail displacement is still dominated by the quasi-static deflection component induced by wheel load. (4) The peak values of the wheel–rail lateral and vertical forces vary only slightly with sleeper spacing and train speed without track irregularity, and the corresponding increases generally do not exceed 1.5%. However, increasing sleeper spacing significantly enhances the time-domain fluctuation characteristics of wheel–rail forces, as manifested by the intensified oscillation amplitude and envelope variation during train passage. In other words, the peak level changes only slightly, whereas the dynamic fluctuation becomes markedly stronger.
Overall, sleeper spacing determines the discrete support density and equivalent stiffness distribution of double-block ballastless track and is therefore a key controlling parameter affecting wheel–rail excitation input, rail response, and the force transfer characteristics of the underlying track structure. As sleeper spacing increases, the number of support points per unit length decreases, and the track structure gradually shifts from a relatively dispersed multi-point support mode to a force transfer mode dominated by fewer support points. Under static loading, this is mainly manifested as an enhanced rail span effect and higher concentration of deformation and internal forces. Under dynamic loading, it is mainly reflected in the amplification of rail vibration response and the further intensification of the time-domain fluctuations of wheel–rail force. Considering the balance between cost control and mechanical performance, the recommended reasonable range of sleeper spacing for double-block ballastless track is 600–700 mm. These conclusions can provide a reference for the rational selection of sleeper spacing and the control of structural forces in similar types of ballastless track.
Footnotes
Acknowledgments
This work was supported by the Key Research and Development Program of Gansu Province-Industrial Project (25YFGA053), the Gansu Provincial Department of Education: School Teacher Innovation Fund Project (2026B-071), the Open Project of State Key Laboratory of Rail Transit Vehicle System, Southwest Jiaotong University (RVL2516), Gansu Special Fund for Science and Technology Commissioners (26CXGA036), and Gansu Postdoctoral Special Project (25JRRA219).

Funding
The authors disclosed receipt of the following financial support for the research, authorship, and/or publication of this article: This work was supported by the Key Research and Development Program of Gansu Province-Industrial Project (25YFGA053), the Gansu Provincial Department of Education: School Teacher Innovation Fund Project (2026B-071), the Open Project of State Key Laboratory of Rail Transit Vehicle System, Southwest Jiaotong University (RVL2516), Gansu Special Fund for Science and Technology Commissioners (26CXGA036), and Gansu Postdoctoral Special Project (25JRRA219)
Declaration of conflicting interests
The authors declared no potential conflicts of interest with respect to the research, authorship, and/or publication of this article.