
Abstract
Previous studies show that survey-based reports of Medicaid participation are measured with error, but no prior study has examined measurement error in an important segment of the Medicaid population—low-income adults enrolled in Medicare. Using the Medicare Current Beneficiary Survey, we examine whether respondent self-reports of Medicaid enrollment match administrative records and present several key findings. First, among low-income Medicare beneficiaries, the false negative rate is 11.5% when the self-report is interpreted as full Medicaid and 3.7% when the self-report is interpreted as full or partial Medicaid. Second, the likelihood of a false negative report is systematically associated with respondent traits. Third, systematic measurement error results in biased coefficient estimates in models of Medicaid participation defined from self-reports, and the bias is more significant when the researcher interprets self-reports as full Medicaid coverage only. Researchers should use caution when interpreting survey reports as pertaining to full Medicaid coverage only.
Introduction
Survey respondents sometimes misreport participation in public programs, causing problems for program officials and researchers (Bitler, Currie, & Scholz, 2003; Bollinger & David, 1997; Colby, Debora, & Heggeness, 2017; Davies & Fisher, 2009; Harris, 2014; Huynh, Rupp, & Sears, 2002; Lynch, 2008; Meijer, Karoly, & Michaud, 2010; Meyer & George, 2011). Some respondents enrolled in a program say they are not (false negative error), while others who are not enrolled say they are (false positive error). In the case of Medicaid, false negative rates can range from 15% to 40% depending on the survey (Boudreaux, Call, Turner, Fried, & O’Hara, 2015; Card, Hildreth, & Shore-Sheppard, 2004; Lynch, 2008; Noon, Fernandez, & Porter, 2016), and survey counts of total enrollment can be 10% to 30% less than figures gleaned from administrative data (Card et al., 2004; Klerman, Ringel, & Roth, 2005; Pascale, Roemer, & Resnick, 2009). Furthermore, when measurement error causes a binary dependent variable (like an indicator of Medicaid participation) to be misclassified, it leads to biased coefficient estimates (Bound, Brown, & Mathiowetz, 2001; Hausman, Abrevaya, & Scott-Morton, 1998). The econometrics literature shows that this type of bias depends on the nature of the measurement error and that, in some cases, the bias can be addressed by using information from validation studies that compare survey reports with administrative data (Meyer & Mittag, 2017).
While several studies examine measurement error in Medicaid participation generally, no prior study has examined measurement error in an important segment of the Medicaid population—low-income adults who are aged or disabled and enrolled in Medicare. Nationwide, about 12 million Medicare beneficiaries receive benefits through Medicaid, including services not covered by Medicare (e.g., long-term services and supports, dental and vision benefits) and financial assistance with Medicare cost-sharing and/or monthly premiums (CMS Medicare-Medicaid Coordination Office, 2017). Given their income, age, and disability status, the average dual eligible has more serious health problems and higher health care spending than the typical Medicaid or Medicare beneficiary (CMS Medicare-Medicaid Coordination Office, 2018). As a result, many policy initiatives target the dual-eligible population, such as capitated managed care programs and integrated Medicare-Medicaid financing (Brown & Mann, 2012; Congressional Budget Office, 2013). These initiatives could affect Medicaid take-up, and modeling the impacts of these and other policies using survey data requires a better understanding of the measurement error in survey responses about Medicaid participation by this important population.
Additionally, reports of Medicaid enrollment by potential dual eligibles are likely affected by a type of measurement error that does not apply to other Medicaid-eligible groups. Dual eligibles consist of two groups: full-benefit duals, who qualify based on the rules in their state Medicaid program, and partial-benefit duals, who qualify through a Medicare Savings Program. 1 Both groups receive assistance with premiums and cost sharing, but only full-benefit duals have coverage for benefits that Medicare does not cover (Medicare Payment Advisory Commission, 2008). This full/partial distinction creates another complication when using survey data to study duals’ Medicaid participation; this is because none of the major household surveys use coverage questions that distinguish between full and partial Medicaid. This complication is made more important by a significant increase in the number of partial duals in recent years (CMS Medicare-Medicaid Coordination Office, 2017).
New Contributions
This study is the first to examine the extent and nature of measurement error in survey reports of Medicaid participation by Medicare enrollees. We use several years of data from the Medicare Current Beneficiary Survey (MCBS), a nationally representative survey that contains both the survey respondent’s report of Medicaid coverage plus administrative data on actual Medicaid enrollment and type of coverage (full or partial). First, we describe the extent of measurement error in survey reports of Medicaid participation by the dual-eligible population. Next, we examine how researchers can approach three issues related to measurement error in studies of the determinants of Medicaid participation by duals. We test whether false negative error is systematically associated with respondent traits, which has implications for how the researcher responds to the bias. We test whether the bias is larger when the researcher interprets self-reports of Medicaid participation as reflecting enrollment in either full or partial Medicaid or full Medicaid only. Last, we examine whether measurement error exhibits state-specific differences that vary over time, which has implications for researchers evaluating the effects of state policies on Medicaid take-up using survey data.
Bias in Models With Misclassified Binary Dependent Variables
For context, we briefly review some econometrics on the consequences of measurement error in a binary dependent variable, such as an indicator variable equal to 1 if the respondent has Medicaid coverage and 0 otherwise. Measurement error in a binary dependent variable, or misclassification, is known to lead to biased estimates of coefficients or marginal effects of the explanatory variables (Bound et al., 2001). Various studies of program participation have used validation data to illustrate the potential for bias in such cases (Bollinger & David, 1997; Davern, Klerman, Baugh, Call, & Greenberg, 2009). An important recent contribution to this literature is Meyer and Mittag’s “Misclassification in Binary Choice Models” (2017), which provides a general assessment of this type of bias and describes how researchers can approach it.
If misclassification is independent of the explanatory variables, the estimated coefficients from a linear regression of the misclassified dependent variable on the explanatory variables (or marginal effects from a probit model) will equal the true coefficients (or marginal effects) multiplied by (1 − α0 − α1), where α0 is the conditional probability of false positives and α1 is the conditional probability of false negatives (Bound et al., 2001; Hausman et al., 1998). Thus, when the conditional probabilities sum to less than 1, measurement error in the dependent variable attenuates the estimated coefficients or marginal effects. In this case, the researcher may use the probabilities of false positives and false negatives (assuming they are known) to correct the estimates for the bias—that is, by dividing the estimates by (1 − α0 − α1). Alternatively, the researcher may safely draw inferences from the relative sizes of the coefficients or marginal effects, since all estimates are attenuated proportionally (Meyer & Mittag, 2017).
If, however, misclassification is correlated with the explanatory variables, the size of the bias and corrections for bias differ. Meyer and Mittag (2017) derive a formula for the bias in linear probability models that can be used to correct coefficient estimates from models of misclassified dependent variables. This correction requires information on the means of the covariates among false negatives and false positives and the probabilities of false positives and false negatives conditional on the true response. For the probit model, Meyer and Mittag show that additional information from validation data can be used to improve coefficient estimates. In this setting, the researcher could calculate predicted probabilities of false negative and false positive errors with parameter estimates from misclassification models based on validation data (Bollinger & David, 1997). Alternatively, if the researcher has access to validation data, jointly estimating the outcome model and models of false negative and false positive error will improve coefficient estimates over the model using only the misclassified outcome.
In summary, the econometrics literature has established that misclassification of a binary dependent variable results in bias and that bias can be addressed with different approaches depending on the nature of the measurement error, the model specification, and the availability of validation data. Our analysis provides evidence of these measurement and estimation issues in the context of Medicaid coverage for Medicare enrollees.
Method
Data
We use data from the 2011-2013 Cost and Use files of the MCBS. Each survey year includes approximately 11,000 Medicare beneficiaries. The MCBS is well suited to our study for several reasons. First, while multiple household surveys contain information on both Medicare and Medicaid coverage, only the MCBS has survey-based information on Medicaid coverage and information about the respondent’s actual Medicaid enrollment from linked administrative records for all respondents. 2 Second, the MCBS contains rich detail on respondent demographic/economic traits and health status, which allows us to examine the association between measurement error and explanatory variables in models of Medicaid take-up. Third, MCBS data are often used to model Medicaid participation by duals, which helps our analysis inform an existing literature (McInerney, Mellor, & Sabik, 2017; Pezzin & Kasper, 2002; Ungaro & Federman, 2009). We use 2011 for the first year of our study period since the MCBS began using improved sources of administrative data on Medicaid enrollment in that year. Data for 2014 were not released by CMS. We exclude a small number of respondents who were only enrolled in Medicare Part B (n = 146 across all 3 years, less than 0.5% of the overall sample). Since the MCBS employs a rotating panel design, surveying individuals for up to 3 years, we randomly sampled one observation per respondent, yielding a sample of 19,889 unique Medicare beneficiaries.
The MCBS survey and administrative information on Medicaid coverage are aligned in terms of the reference period. That is, the questionnaire asks respondents whether they had Medicaid coverage for specific months of the year. Similarly, the MCBS indicates specific months of Medicaid coverage obtained from administrative records. However, while the administrative information distinguishes between full and partial Medicaid coverage, the survey does not. This is not unique to the MCBS; insurance coverage questions in other major household surveys do not make this distinction either, as shown in Appendix A (all appendixes are available online). Thus, our analysis of the match between survey response and type of Medicaid coverage may be informative to researchers using a variety of data sets. Appendix B provides more detail on information on Medicaid participation in the MCBS.
Measures
We construct several binary indicators of whether each MCBS respondent had Medicaid coverage during the year. We define one indicator for self-reported Medicaid participation from the survey data and three from the administrative data (for full Medicaid, partial Medicaid, and either full or partial Medicaid). We then identify whether the survey indicator is misclassified (i.e., survey and administrative coverage indicators do not align); here, we construct two misclassification dummies, allowing for different definitions of the administrative “truth” (i.e., “true” Medicaid coverage is [1] full coverage only or [2] either full or partial coverage). Likewise, we construct two indicators each for false negative error and false positive error.
In addition, we construct measures of respondents’ traits, including age, sex, race, ethnicity, marital status, education, household income, and state of residence. We also construct several measures of health, including fair or poor self-rated health status, whether the respondent has two or more limitations with activities of daily living or a cognitive impairment, residence in a facility during the year, annual Medicare spending, and the number of months enrolled in Medicaid. Last, we construct indicators for the type of Medicare coverage the beneficiary had (Part A only vs. both Parts A and B and Medicare Advantage vs. traditional Medicare) and whether the respondent had an interview completed by a proxy.
Statistical Analysis
The first part of our analysis describes measurement error in survey responses regarding Medicaid participation by Medicare beneficiaries and compares measurement error across different subgroups. We report rates of self-reported Medicaid participation, misclassification, false negative error, and false positive error for all MCBS respondents, as well as subgroups of low-income respondents and subgroups of important segments of the dual-eligible population (e.g., those above and below 65 years of age, those residing in the community or a facility).
The second part of our analysis examines several aspects of the bias caused by misclassified dependent variables. Since bias corrections depend on whether misclassification error is systematically associated with respondent traits, we first estimate models of false negative error. We estimate linear probability models where the dependent variable equals 1 if the survey measure of Medicaid is a false negative and the explanatory variables are respondent demographic, economic, and health measures. We estimate the models for different samples of known Medicaid enrollees (full, partial, and full/partial combined). This allows us to test whether false negative reports are systematically associated with age, race, income, and other respondent traits and whether those associations differ between full and partial duals.
Since there is more than one interpretation of the survey response about Medicaid coverage, we next test for differences in the bias that arise under two different researcher interpretations of Medicaid as (1) full Medicaid coverage and (2) either full or partial coverage. We estimate linear probability models of Medicaid participation using alternate definitions of the dependent variable—one in which the dependent variable is the possibly mismeasured survey response and another in which the dependent variable is the true Medicaid participation measure from the administrative data. We use the estimated coefficients to calculate the size of the bias and examine whether the bias varies under different interpretations of the survey report of Medicaid (i.e., as full Medicaid only or as either full/partial Medicaid). In these models, we use explanatory variables used in similar prior studies on elderly Medicaid/Supplemental Nutrition Assistance Program take-up (Borella, De Nardi, & French, 2018; Haider, Jacknowitz, & Schoeni, 2003) as well as characteristics of Medicare coverage. All models also include a full set of state and year dummies.
Last, since studies of the effects of state policies on Medicaid take-up rely on the assumption of nondifferential time trends across states (Boudreaux et al., 2015), we examine the potential for bias when reporting error exhibits significant state-specific trends. We estimate linear probability models where the dependent variable is either false negative or false positive error, and we test whether there is evidence of state-by-year variation in measurement error.
Results
Descriptive Statistics
Table 1 shows self-reported Medicaid participation rates in the full sample and in various subgroups. Column 2 shows that 23% of all 19,889 respondents in our sample self-report having Medicaid. As expected for a means-tested program, self-reported participation is higher (52%) among low-income Medicare beneficiaries (defined as having household income at or below 150% of the federal poverty guidelines for single and married respondents). Self-reported participation rates are even higher for low-income Medicare beneficiaries residing in facilities (81.9%) and under the age of 65 years (75.7%), which may reflect differences in awareness, need, or eligibility criteria.
Medicaid Reporting and Underreporting by Type of Respondent and Full/Partial Status.
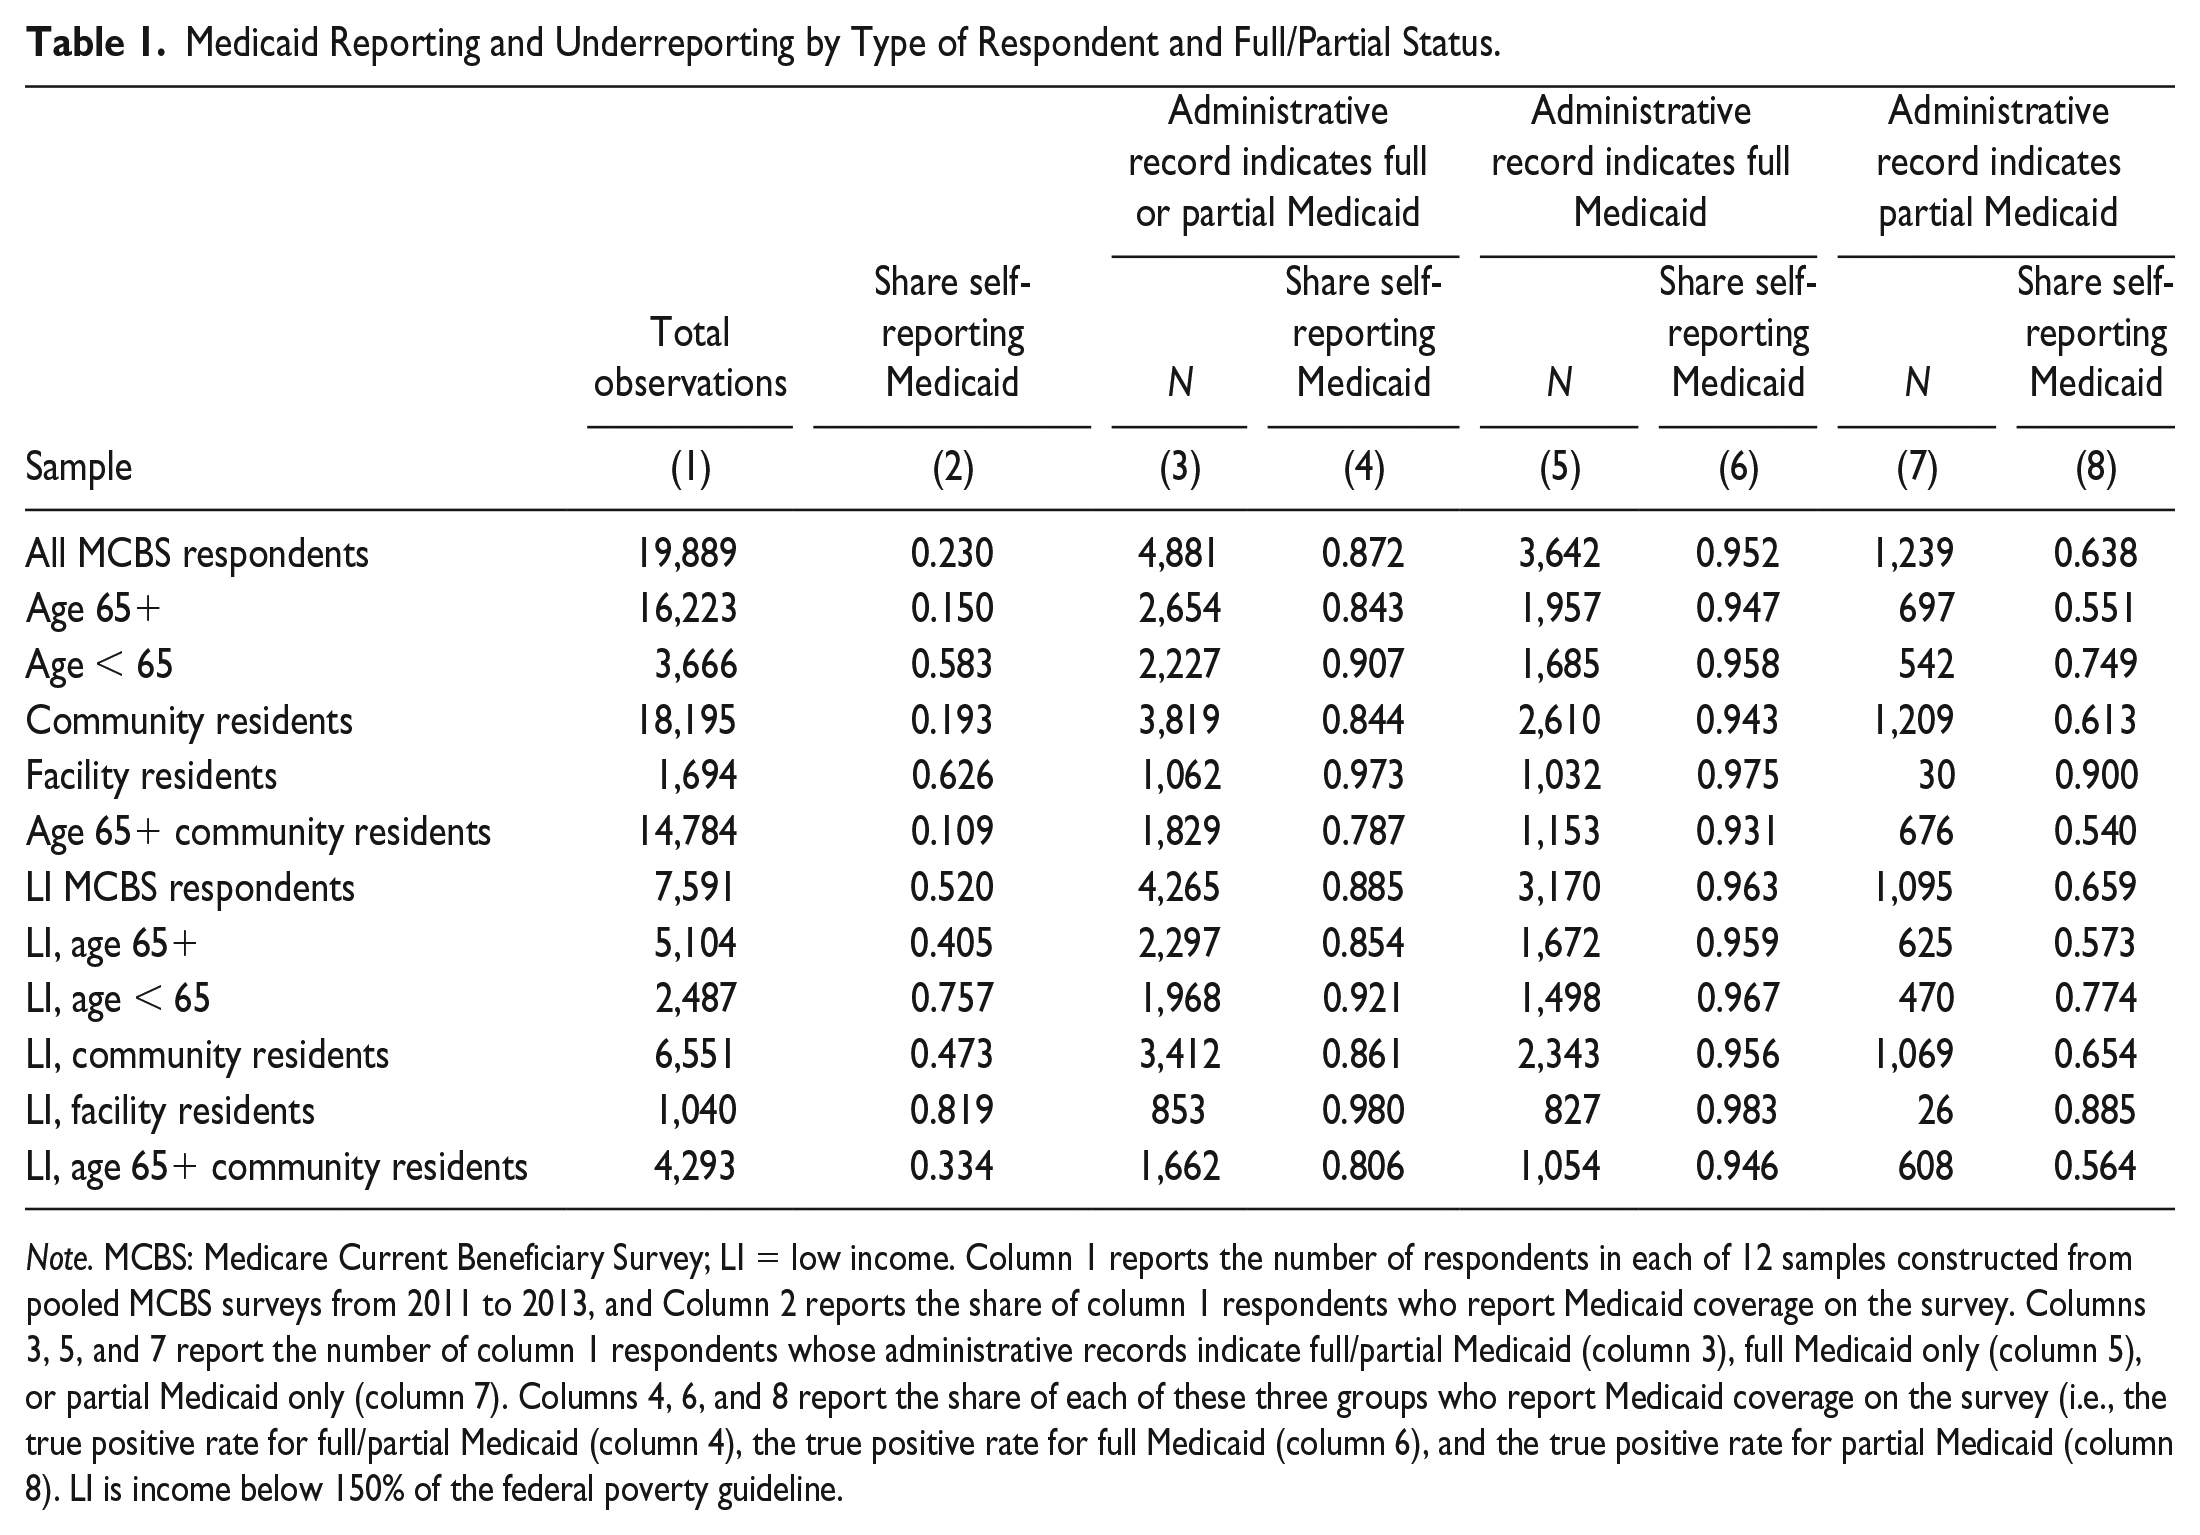
Note. MCBS: Medicare Current Beneficiary Survey; LI = low income. Column 1 reports the number of respondents in each of 12 samples constructed from pooled MCBS surveys from 2011 to 2013, and Column 2 reports the share of column 1 respondents who report Medicaid coverage on the survey. Columns 3, 5, and 7 report the number of column 1 respondents whose administrative records indicate full/partial Medicaid (column 3), full Medicaid only (column 5), or partial Medicaid only (column 7). Columns 4, 6, and 8 report the share of each of these three groups who report Medicaid coverage on the survey (i.e., the true positive rate for full/partial Medicaid (column 4), the true positive rate for full Medicaid (column 6), and the true positive rate for partial Medicaid (column 8). LI is income below 150% of the federal poverty guideline.
Columns 4, 6, and 8 of Table 1 report participation rates among confirmed Medicaid participants (i.e., true positive rates). We report rates separately by persons for whom the administrative record indicates either full or partial coverage, full coverage only, or partial coverage only. The observed true positive rates are high; when true Medicaid is defined from an administrative record of either full or partial coverage (column 4), 87.2% of all MCBS respondents on Medicaid and 88.5% of all low-income respondents on Medicaid respond affirmatively on the survey. Furthermore, true positive rates are even higher among full Medicaid enrollees (column 6). More than 95% of all MCBS respondents with full Medicaid and more than 96% of low-income respondents with full Medicaid report enrollment.
Table 1 also shows that many MCBS respondents with only partial Medicaid give survey responses indicating that they are on Medicaid (column 8). Nearly 64% of all MCBS respondents (and nearly 66% of low-income respondents) with partial Medicaid report having Medicaid. These rates are higher among facility residents (89% to 90%), although these samples are very small. Clearly, many partial duals see themselves as having Medicaid coverage; while less than the self-reported participation rates of known full duals (93% to 98%), the share of known partial enrollees reporting Medicaid coverage is sizable.
Table 2 extends our descriptive analysis by examining misclassification rates (the shares of all respondents whose survey responses do not match the administrative data) as well as false negative and false positive rates among low-income MCBS respondents (i.e., those most likely to be eligible for Medicaid). False negative rates are defined for samples of confirmed Medicaid participants, while false positive rates are defined for confirmed nonparticipants. We allow for two separate definitions of true Medicaid coverage based on administrative records. The top panel defines true Medicaid as either full or partial coverage (a looser definition of Medicaid), and the bottom panel defines true Medicaid as full coverage only (a stricter definition). Several prior Medicaid validation studies focusing on adults of all ages examine full-benefit coverage only (Boudreaux et al., 2015; Call, Davern, Klerman, & Lynch, 2013)—in one case noting that some survey questions are intended to measure full coverage.
Misclassification, False Negative, and False Positive Rates in Samples of Low-Income MCBS Respondents.
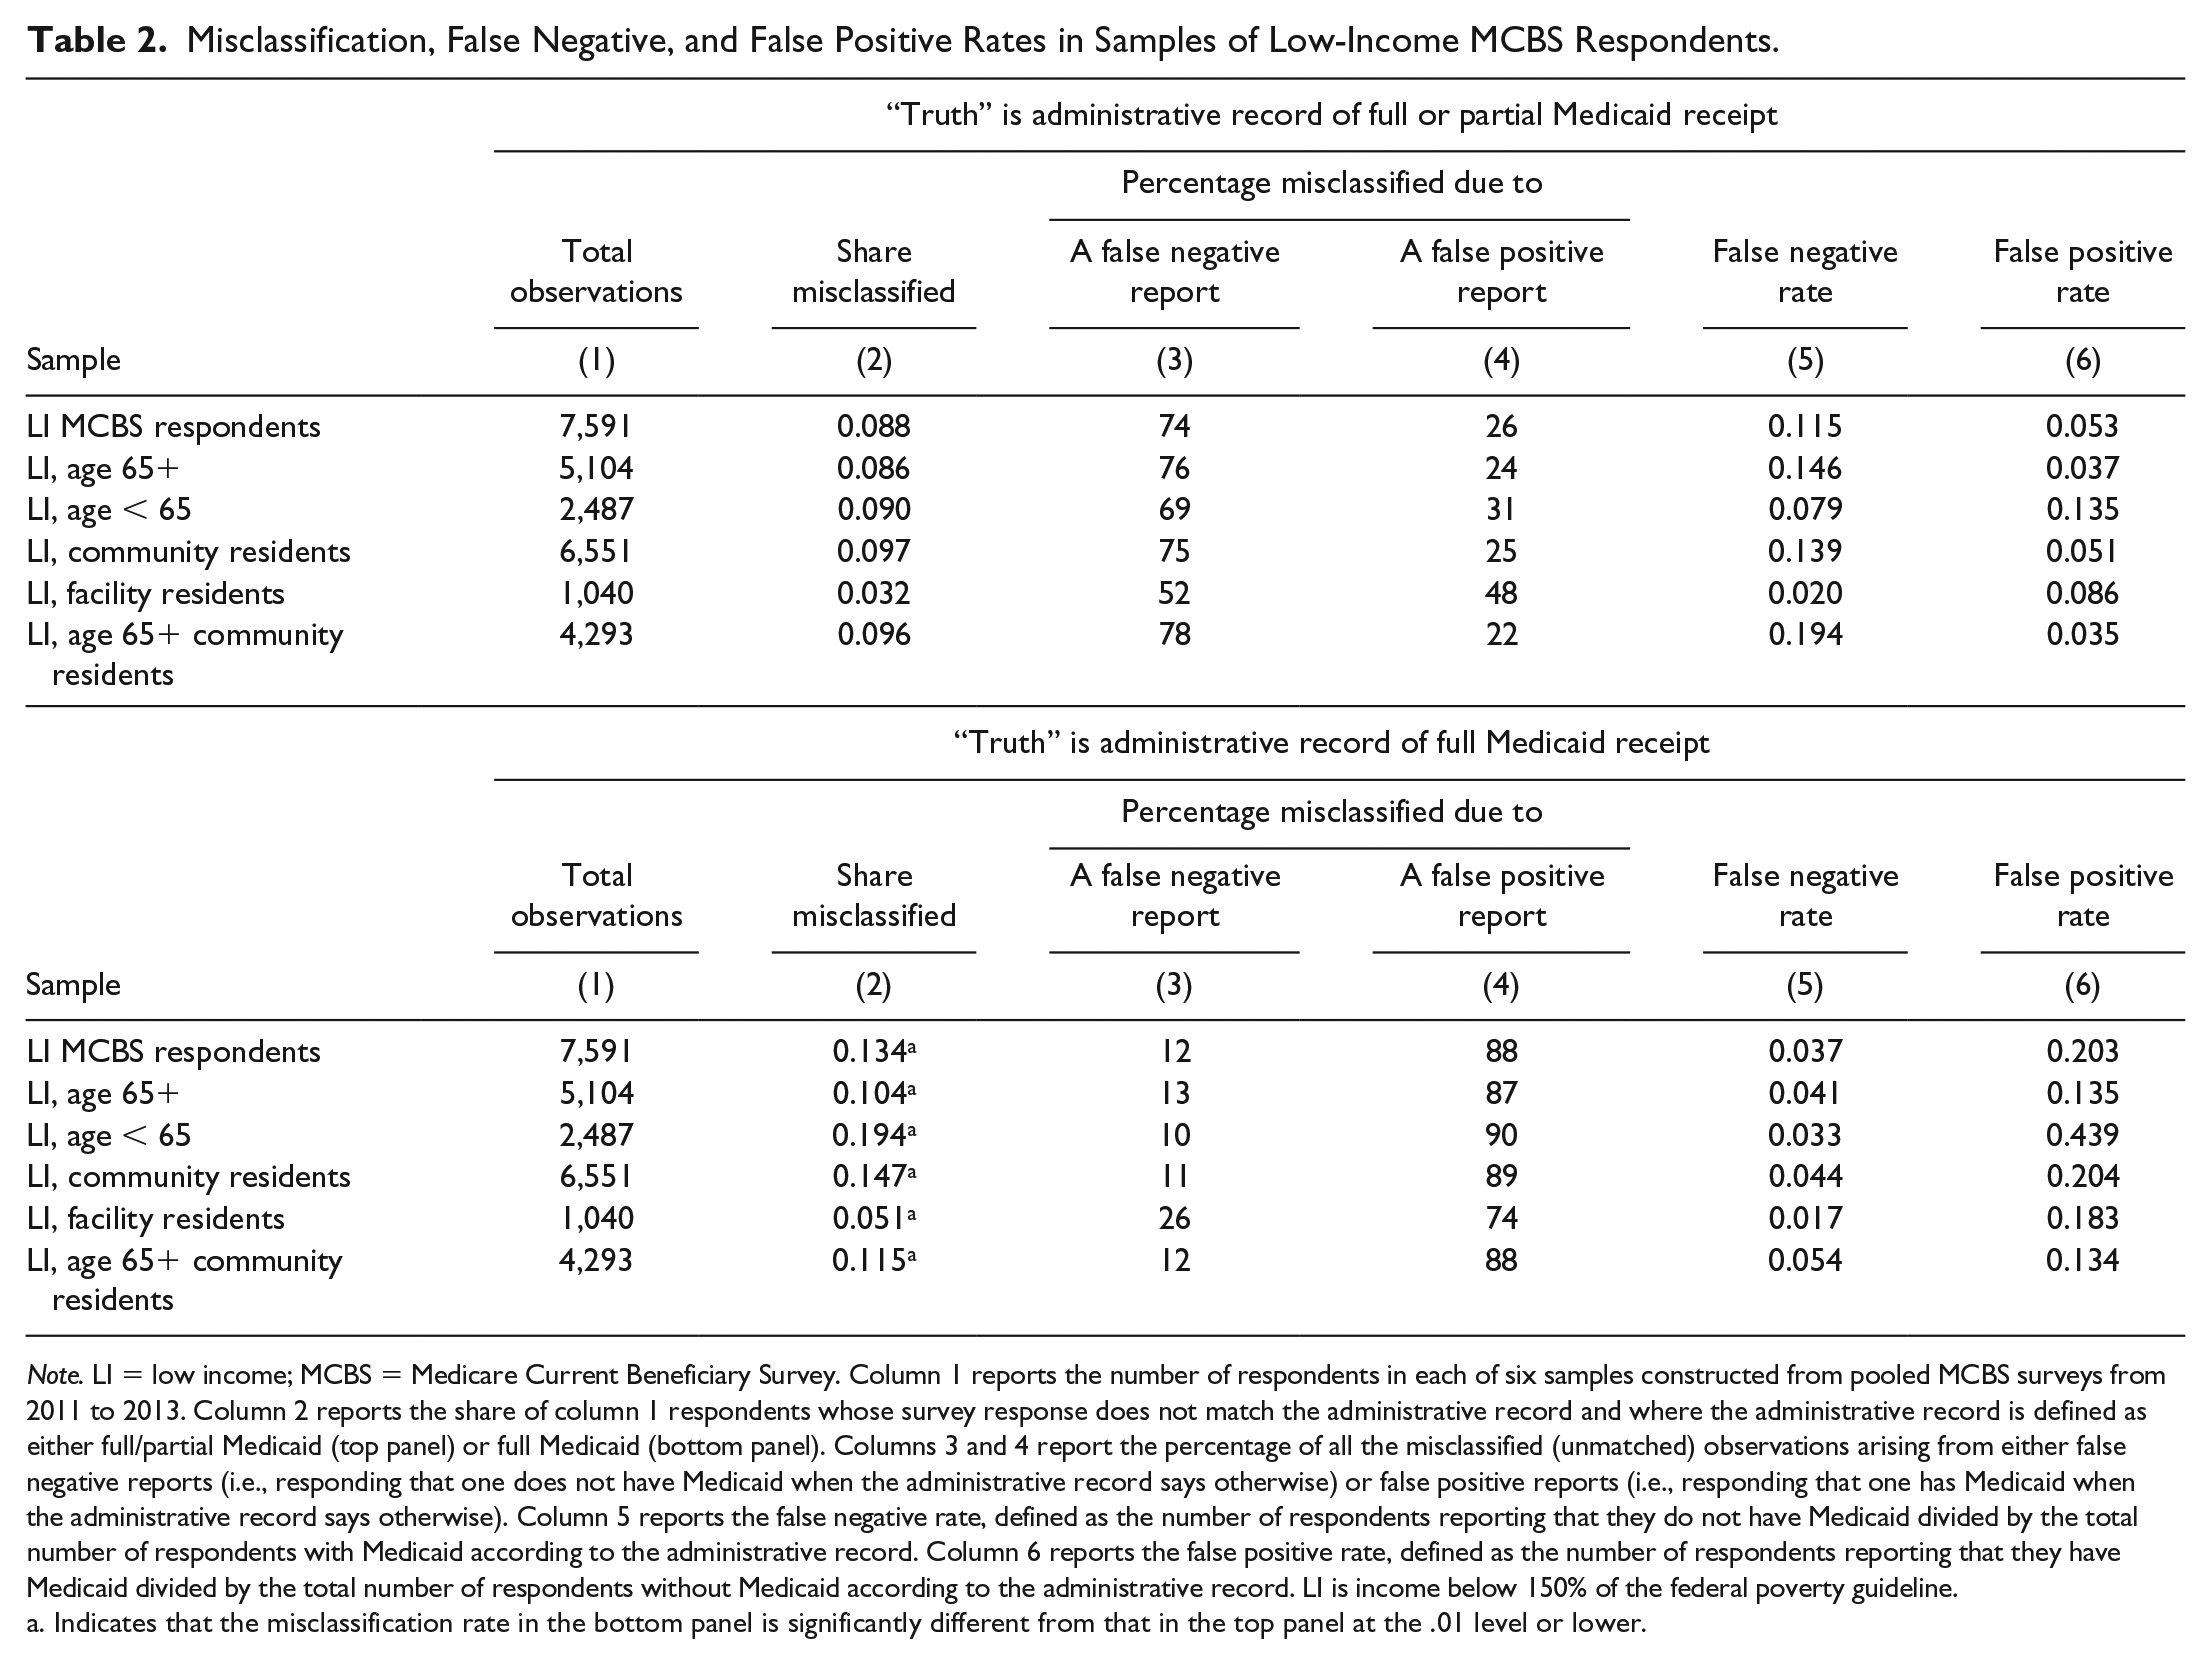
Note. LI = low income; MCBS = Medicare Current Beneficiary Survey. Column 1 reports the number of respondents in each of six samples constructed from pooled MCBS surveys from 2011 to 2013. Column 2 reports the share of column 1 respondents whose survey response does not match the administrative record and where the administrative record is defined as either full/partial Medicaid (top panel) or full Medicaid (bottom panel). Columns 3 and 4 report the percentage of all the misclassified (unmatched) observations arising from either false negative reports (i.e., responding that one does not have Medicaid when the administrative record says otherwise) or false positive reports (i.e., responding that one has Medicaid when the administrative record says otherwise). Column 5 reports the false negative rate, defined as the number of respondents reporting that they do not have Medicaid divided by the total number of respondents with Medicaid according to the administrative record. Column 6 reports the false positive rate, defined as the number of respondents reporting that they have Medicaid divided by the total number of respondents without Medicaid according to the administrative record. LI is income below 150% of the federal poverty guideline.
Indicates that the misclassification rate in the bottom panel is significantly different from that in the top panel at the .01 level or lower.
Table 2 shows that misclassification rates are significantly lower under the looser interpretation of true Medicaid. For example, 8.8% of low-income MCBS respondents are misclassified based on survey data when using the looser definition of Medicaid, while 13.4% of low-income MCBS respondents are misclassified under the stricter definition (column 2; p < .0001). In columns 3 and 4, we show that the type of misclassification depends on how we define true Medicaid. Under the looser definition of Medicaid, a larger share of the misclassified responses reflect false negatives, and under the stricter definition of Medicaid, a larger share of the misclassified responses reflect false positives. Accordingly, the false negative rate (defined for those who have Medicaid according to the administrative data) is higher under the looser interpretation of true Medicaid than under the stricter interpretation (e.g., 11.5% vs. 3.7% in the low-income sample, as shown in column 5).
Column 6 of Table 2 reports false positive rates, which are defined for respondents who are not enrolled in Medicaid according to the administrative data. False positive rates are higher when we define true Medicaid as full coverage only (the stricter definition). For example, 20.3% of low-income MCBS respondents without full Medicaid say that they have Medicaid, while only 5.3% of low-income MCBS respondents without either full or partial Medicaid say that they have Medicaid. This difference is consistent with the large numbers of partial duals interpreting their partial coverage as Medicaid.
Is Measurement Error Independent of Explanatory Variables?
To examine the relationship between misclassification error and respondent traits, we estimate linear probability models of false negative error. 3 Table 3 presents estimates from separate models for known full Medicaid participants (columns 1 and 2), known partial Medicaid participants (columns 3 and 4), and those known to have either full or partial Medicaid (columns 5 and 6). In each case, we separately focus on low-income respondents or low-income community-dwelling adults who are 65 years of age and above (an oft-studied segment of duals; Pezzin & Kasper, 2002; Ungaro & Federman, 2009).
Linear Probability Models of False Negative Responses (Dependent Variable = 1 If the Survey Response Is Not on Medicaid).
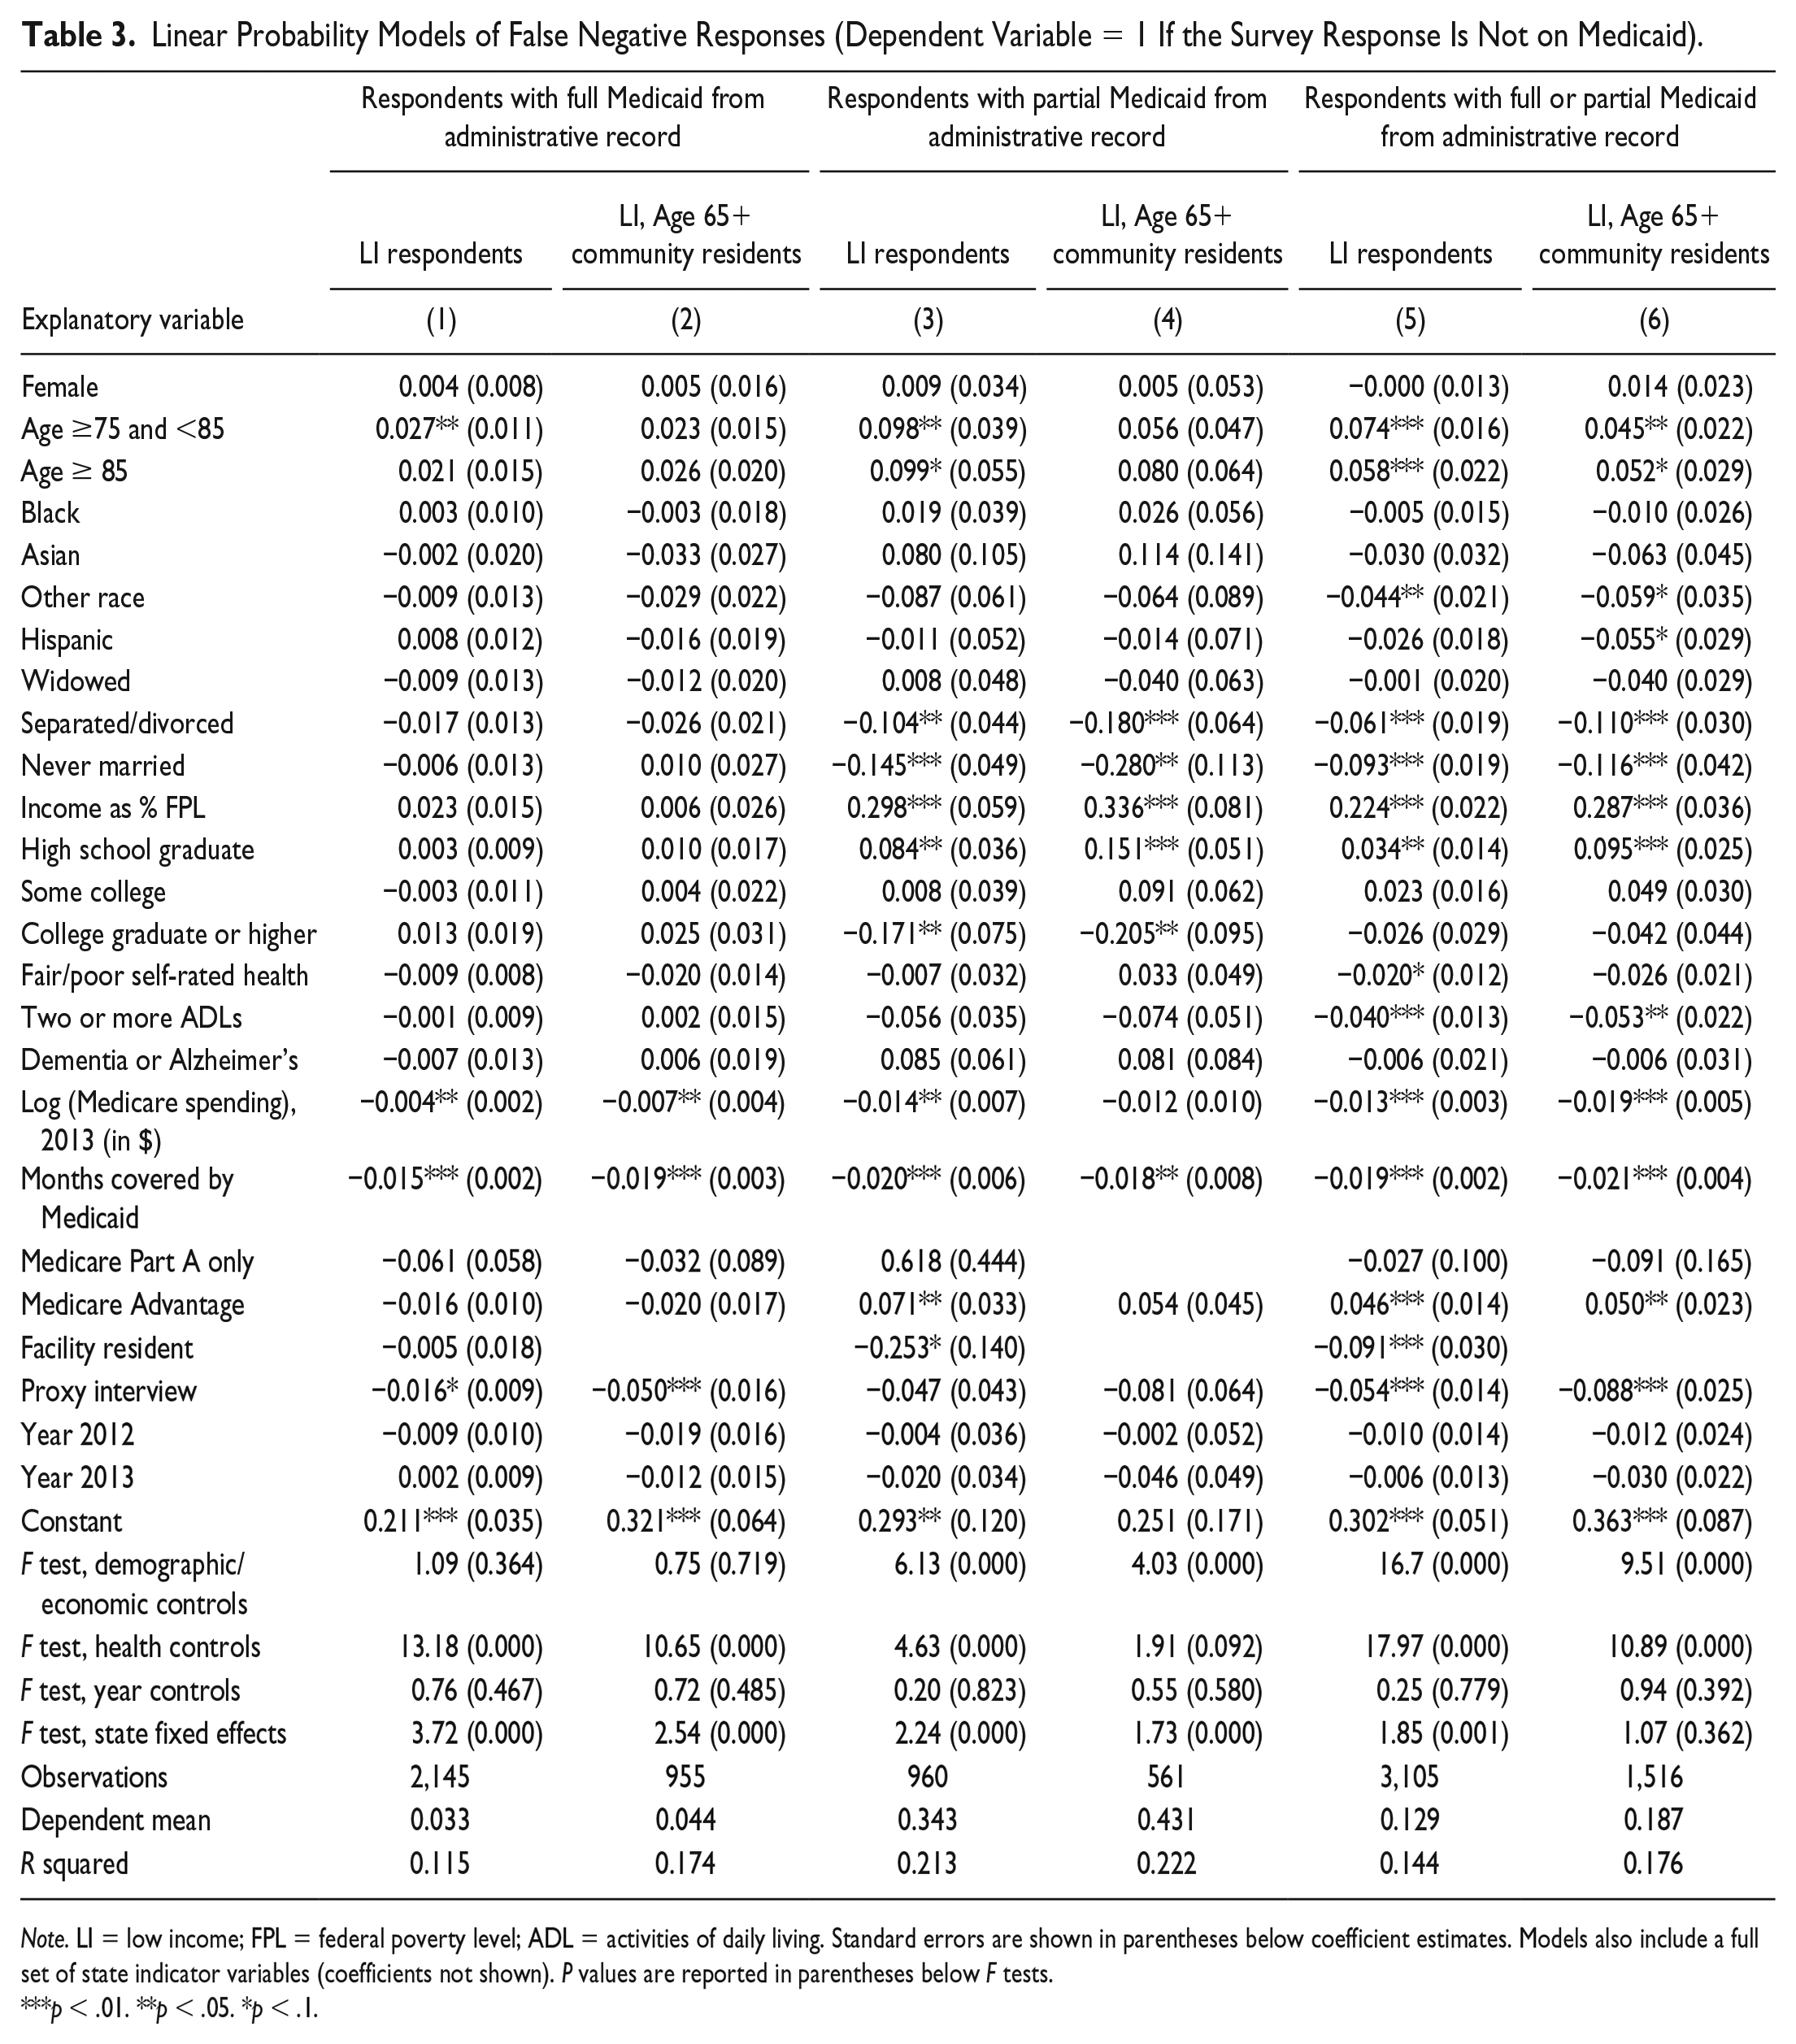
Note. LI = low income; FPL = federal poverty level; ADL = activities of daily living. Standard errors are shown in parentheses below coefficient estimates. Models also include a full set of state indicator variables (coefficients not shown). P values are reported in parentheses below F tests.
p < .01. **p < .05. *p < .1.
The coefficient estimates and F-test results reported in Table 3 provide evidence that false negative reports are associated with respondent traits. False negative error is significantly and positively associated with age, household income, and having a high school or some college education (relative to not completing high school). False negative error is significantly and negatively associated with other race and being unmarried, and with several indicators of poor health: having fair/poor self-rated health, having two or more activities of daily living limitations, having higher Medicare spending, and residing in a facility. That said, demographic and economic traits are more strongly predictive of underreporting of partial Medicaid than underreporting of full Medicaid (as shown by F statistics of 4.03 and 6.13 in partial Medicaid models compared with only 0.75-1.09 in full Medicaid models). In contrast, health characteristics are more strongly predictive of underreporting of full Medicaid than underreporting of partial Medicaid (as shown by F statistics of 10.65 and 13.18 in full Medicaid models compared with 1.91 and 4.63 in partial Medicaid models).
We also examine other potential explanations for underreporting using information on proxy interviews, a respondent’s time on Medicaid, and the type of Medicare coverage the respondent has. Proxy respondents and persons with more months of Medicaid coverage in the year were less likely to underreport Medicaid, while persons with Medicare Advantage were more likely to underreport Medicaid. We also find evidence of significant differences in underreporting across states, based on tests of the joint significance of state dummy variables in the models (where p values are .001 or lower in five of the six models).
Does the Researcher’s Interpretation of the Survey Response Affect Bias?
We next use the MCBS data to calculate the bias arising from using mismeasured survey data to estimate models of Medicaid take-up. Specifically, we investigate a choice available to researchers: If the survey has one self-report of Medicaid coverage, is it better to interpret the survey response as full Medicaid or as either full or partial Medicaid?
We first calculate the bias from interpreting the survey question as pertaining to the looser definition of an administrative report of either full or partial Medicaid. We use our low-income sample to estimate a linear probability model of Medicaid participation where the dependent variable is equal to 1 if the respondent reported Medicaid coverage on the survey; estimated coefficients are shown in Table 4, column 1. We also estimate a linear probability model where the dependent variable is equal to 1 if the respondent had either full or partial Medicaid according to the administrative records; estimated coefficients are shown in Table 4, column 2. For each coefficient, column 3 reports the bias in the survey as a percentage of the unbiased coefficient (i.e., the coefficient estimate from the model of the administrative Medicaid measure less the coefficient estimate from model of the survey response divided by the administrative [true] coefficient estimate). We report results from chi-square tests of the hypothesis that the two coefficients are equal to each other (column 4). We then repeat the above steps where the stricter administrative measure of full Medicaid yields the true coefficients; results are reported in columns 1 and 5-7 of Table 4. Explanatory variable means are reported in Appendix D.
Linear Probability Models of Medicaid Participation and Estimated Bias From Survey Data Misclassification, Low-Income Respondent Sample.
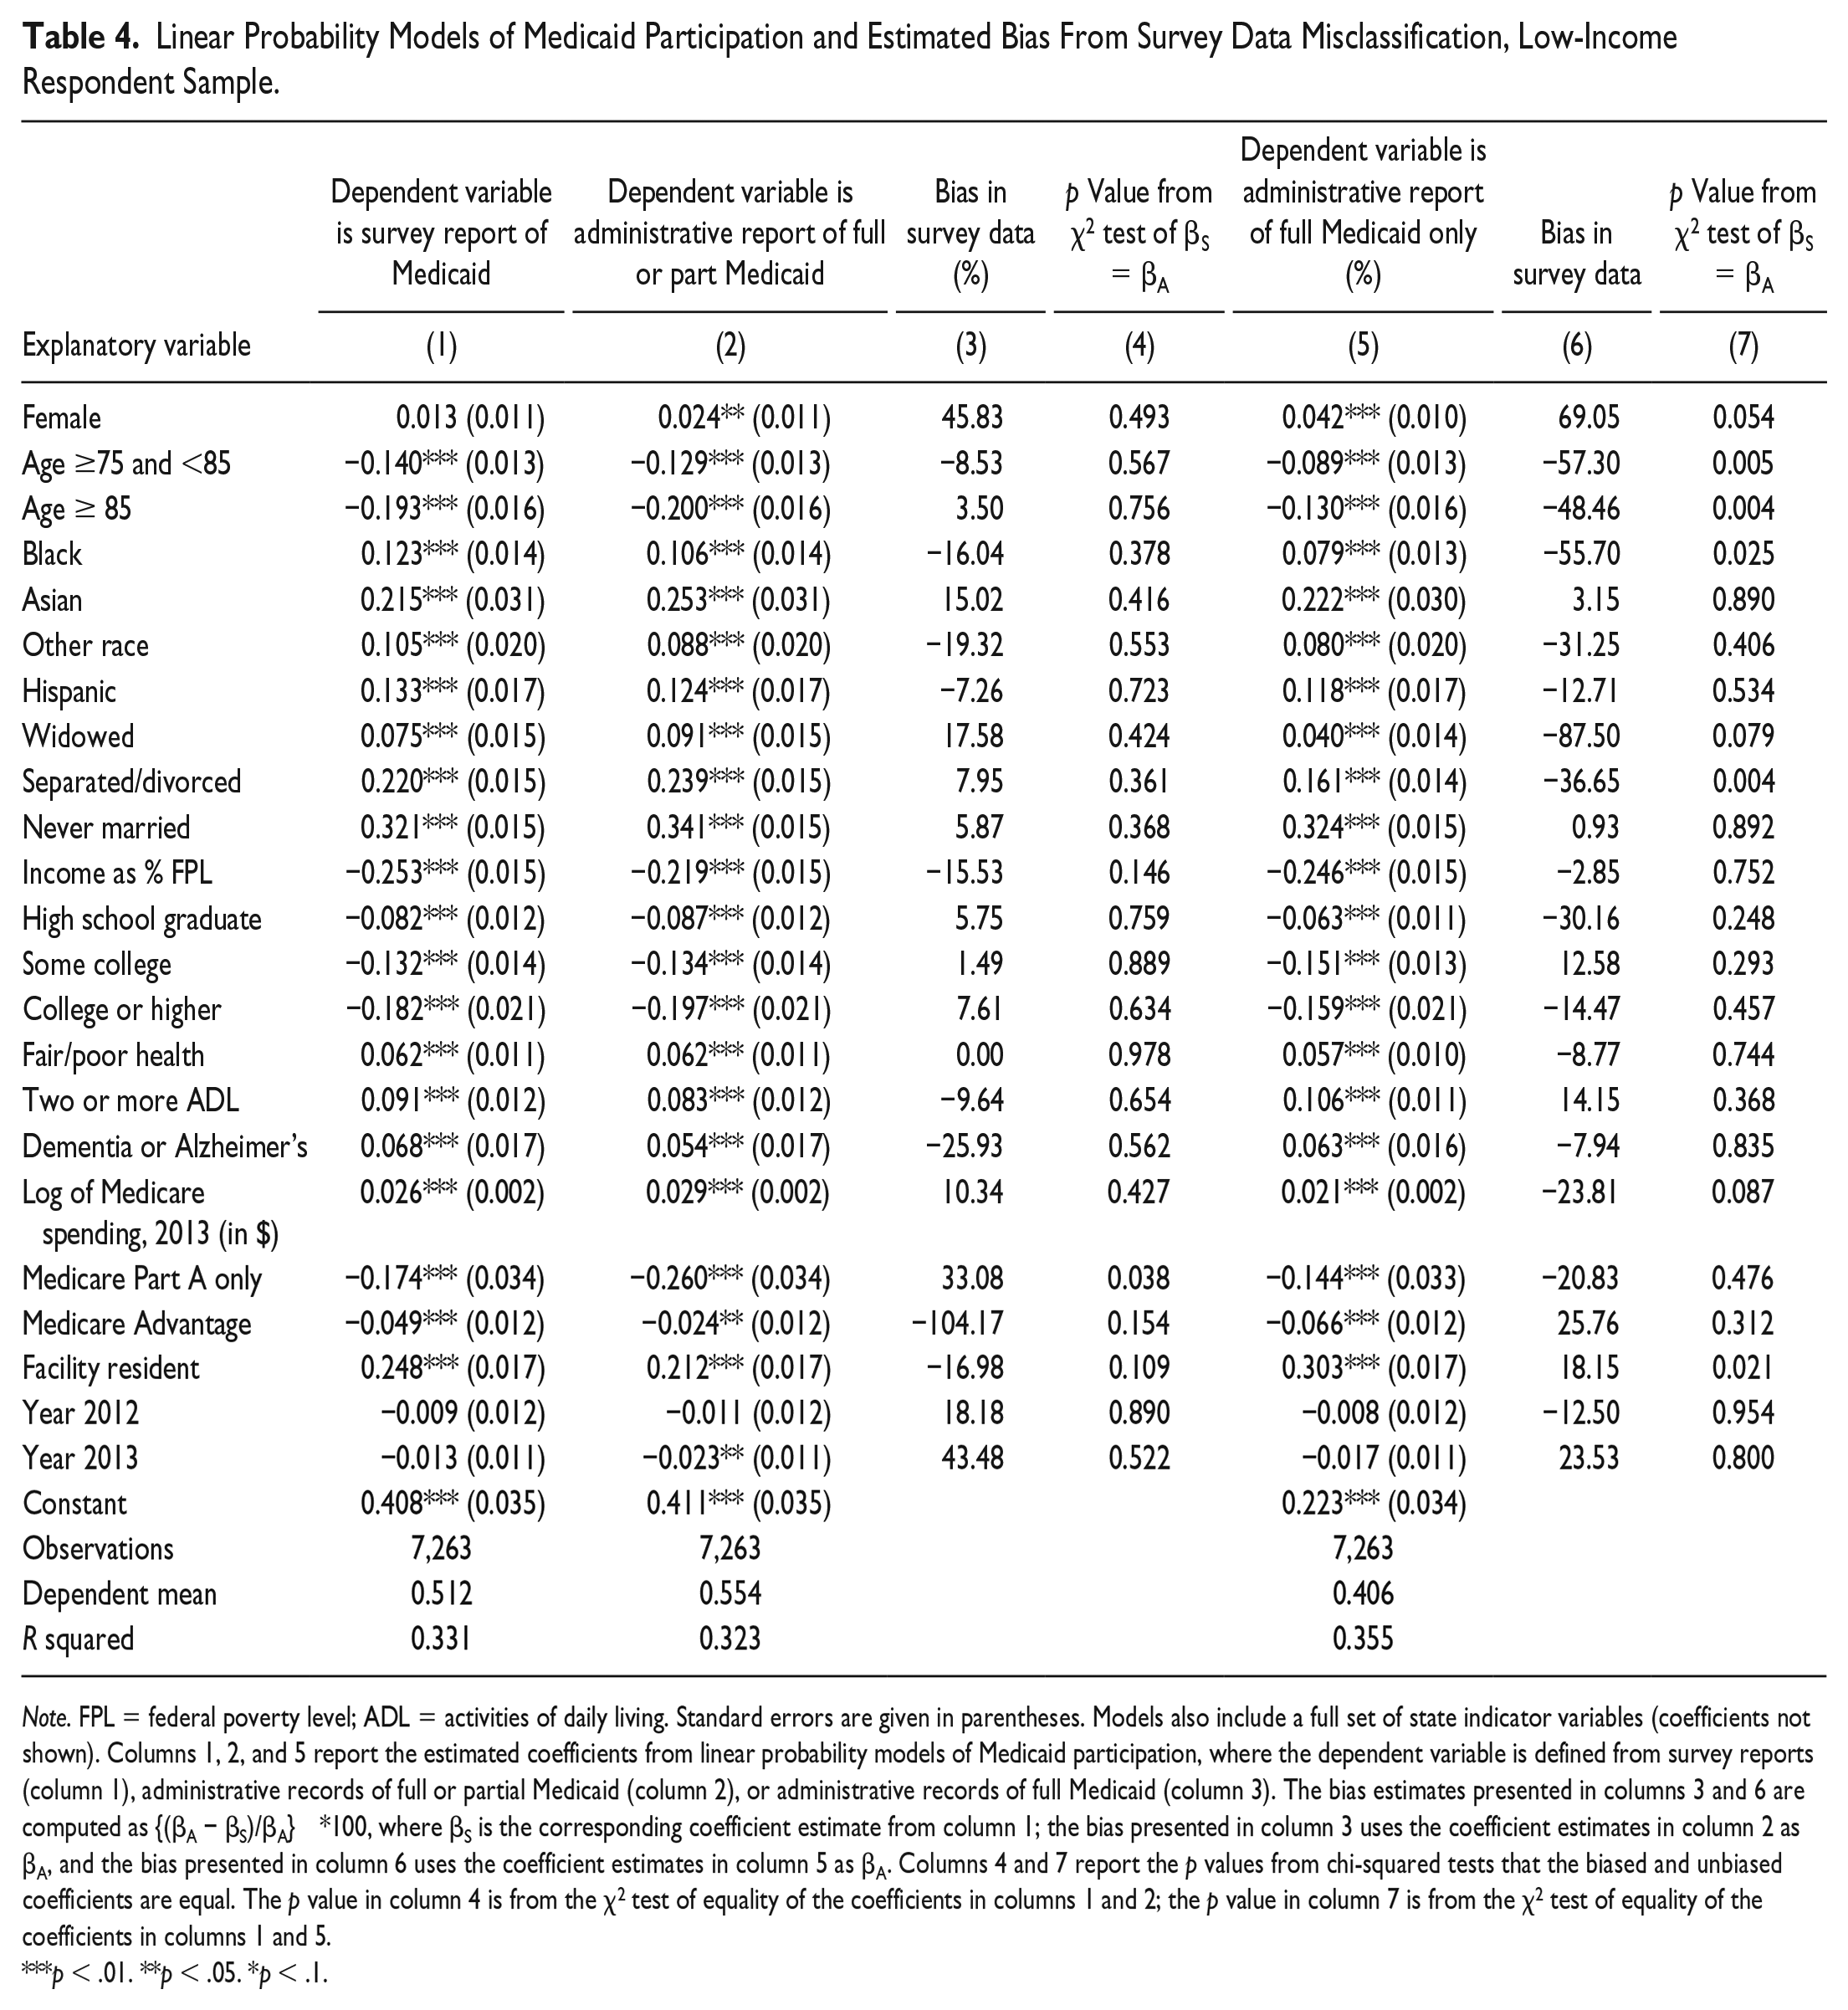
Note. FPL = federal poverty level; ADL = activities of daily living. Standard errors are given in parentheses. Models also include a full set of state indicator variables (coefficients not shown). Columns 1, 2, and 5 report the estimated coefficients from linear probability models of Medicaid participation, where the dependent variable is defined from survey reports (column 1), administrative records of full or partial Medicaid (column 2), or administrative records of full Medicaid (column 3). The bias estimates presented in columns 3 and 6 are computed as {(βA − βS)/βA} *100, where βS is the corresponding coefficient estimate from column 1; the bias presented in column 3 uses the coefficient estimates in column 2 as βA, and the bias presented in column 6 uses the coefficient estimates in column 5 as βA. Columns 4 and 7 report the p values from chi-squared tests that the biased and unbiased coefficients are equal. The p value in column 4 is from the χ2 test of equality of the coefficients in columns 1 and 2; the p value in column 7 is from the χ2 test of equality of the coefficients in columns 1 and 5.
p < .01. **p < .05. *p < .1.
As expected, the results provide evidence that the survey-based coefficients are biased, sometimes to a sizable extent. Furthermore, given the nonrandom nature of the misclassification error, the survey coefficients are not always attenuated. For example, column 3 reports the bias from using survey data to estimate models of full/partial Medicaid participation. The survey data biases the estimated effect of Part A only coverage on full/partial Medicaid take-up so that it is 33% less than the true effect (column 3) but biases the estimated effect of income upward, making it 15.5% larger than the true effect. The former difference is statistically significant. Column 6 reports the bias from using survey data to estimate models of full Medicaid participation; some coefficients are biased upward while others are biased downward, and in several cases, the bias is significantly different from zero.
We next compare the size and impact of the bias in survey data when the administrative measure is the looser definition—reflecting full or partial Medicaid—with the size/impact of the bias under the stricter definition of full Medicaid. A comparison of columns 4 and 7 shows that when interpreting the survey as indicative of full Medicaid coverage, the bias in the survey data yields coefficient estimates that are significantly different from the true coefficients more often than when the researcher interprets the survey as indicative of either full or partial Medicaid coverage. A comparison of columns 3 and 6 shows that, in those instances, the bias is also larger in absolute value when interpreting the survey as indicative of full Medicaid coverage. This suggests that there is less potential for bias from misclassification when the survey question is interpreted as either full or partial Medicaid coverage and not interpreted strictly as full Medicaid. 4
Does Measurement Error in the Survey Response Exhibit State-by-Year Variation?
Finally, we estimate linear probability models where the dependent variable is either false negative or false positive error to test whether there is evidence of state-by-year variation in measurement error. The results are summarized in Table 5, which reports the results from an F test of the joint significance of a set of interaction terms between a full set of state dummy variables and both a year 2012 dummy and a year 2013 dummy (full results on request). The restricted and unrestricted models include state dummies and year dummies and control for respondent demographic, economic, and health traits. We report F tests from eight models of each outcome, varying the sample and the administrative measure of Medicaid. In most models, the state-by-year coefficient estimates are not jointly significant, but in one of the eight specifications, we are able to reject the null hypothesis that there is no state-by-year variation in survey measurement error of Medicaid (i.e., when estimating false negative reports among low-income individuals who are 65 years of age and older who reside in the community). 5 It is possible that the small sample sizes contribute to the insignificant F statistics; however, our samples sizes are able to identify significant persistent state-specific differences in measurement error. That is, in 10 of 16 models, the state coefficient estimates themselves are jointly significant.
Tests of State-by-Year Variation in Survey Measurement Error.
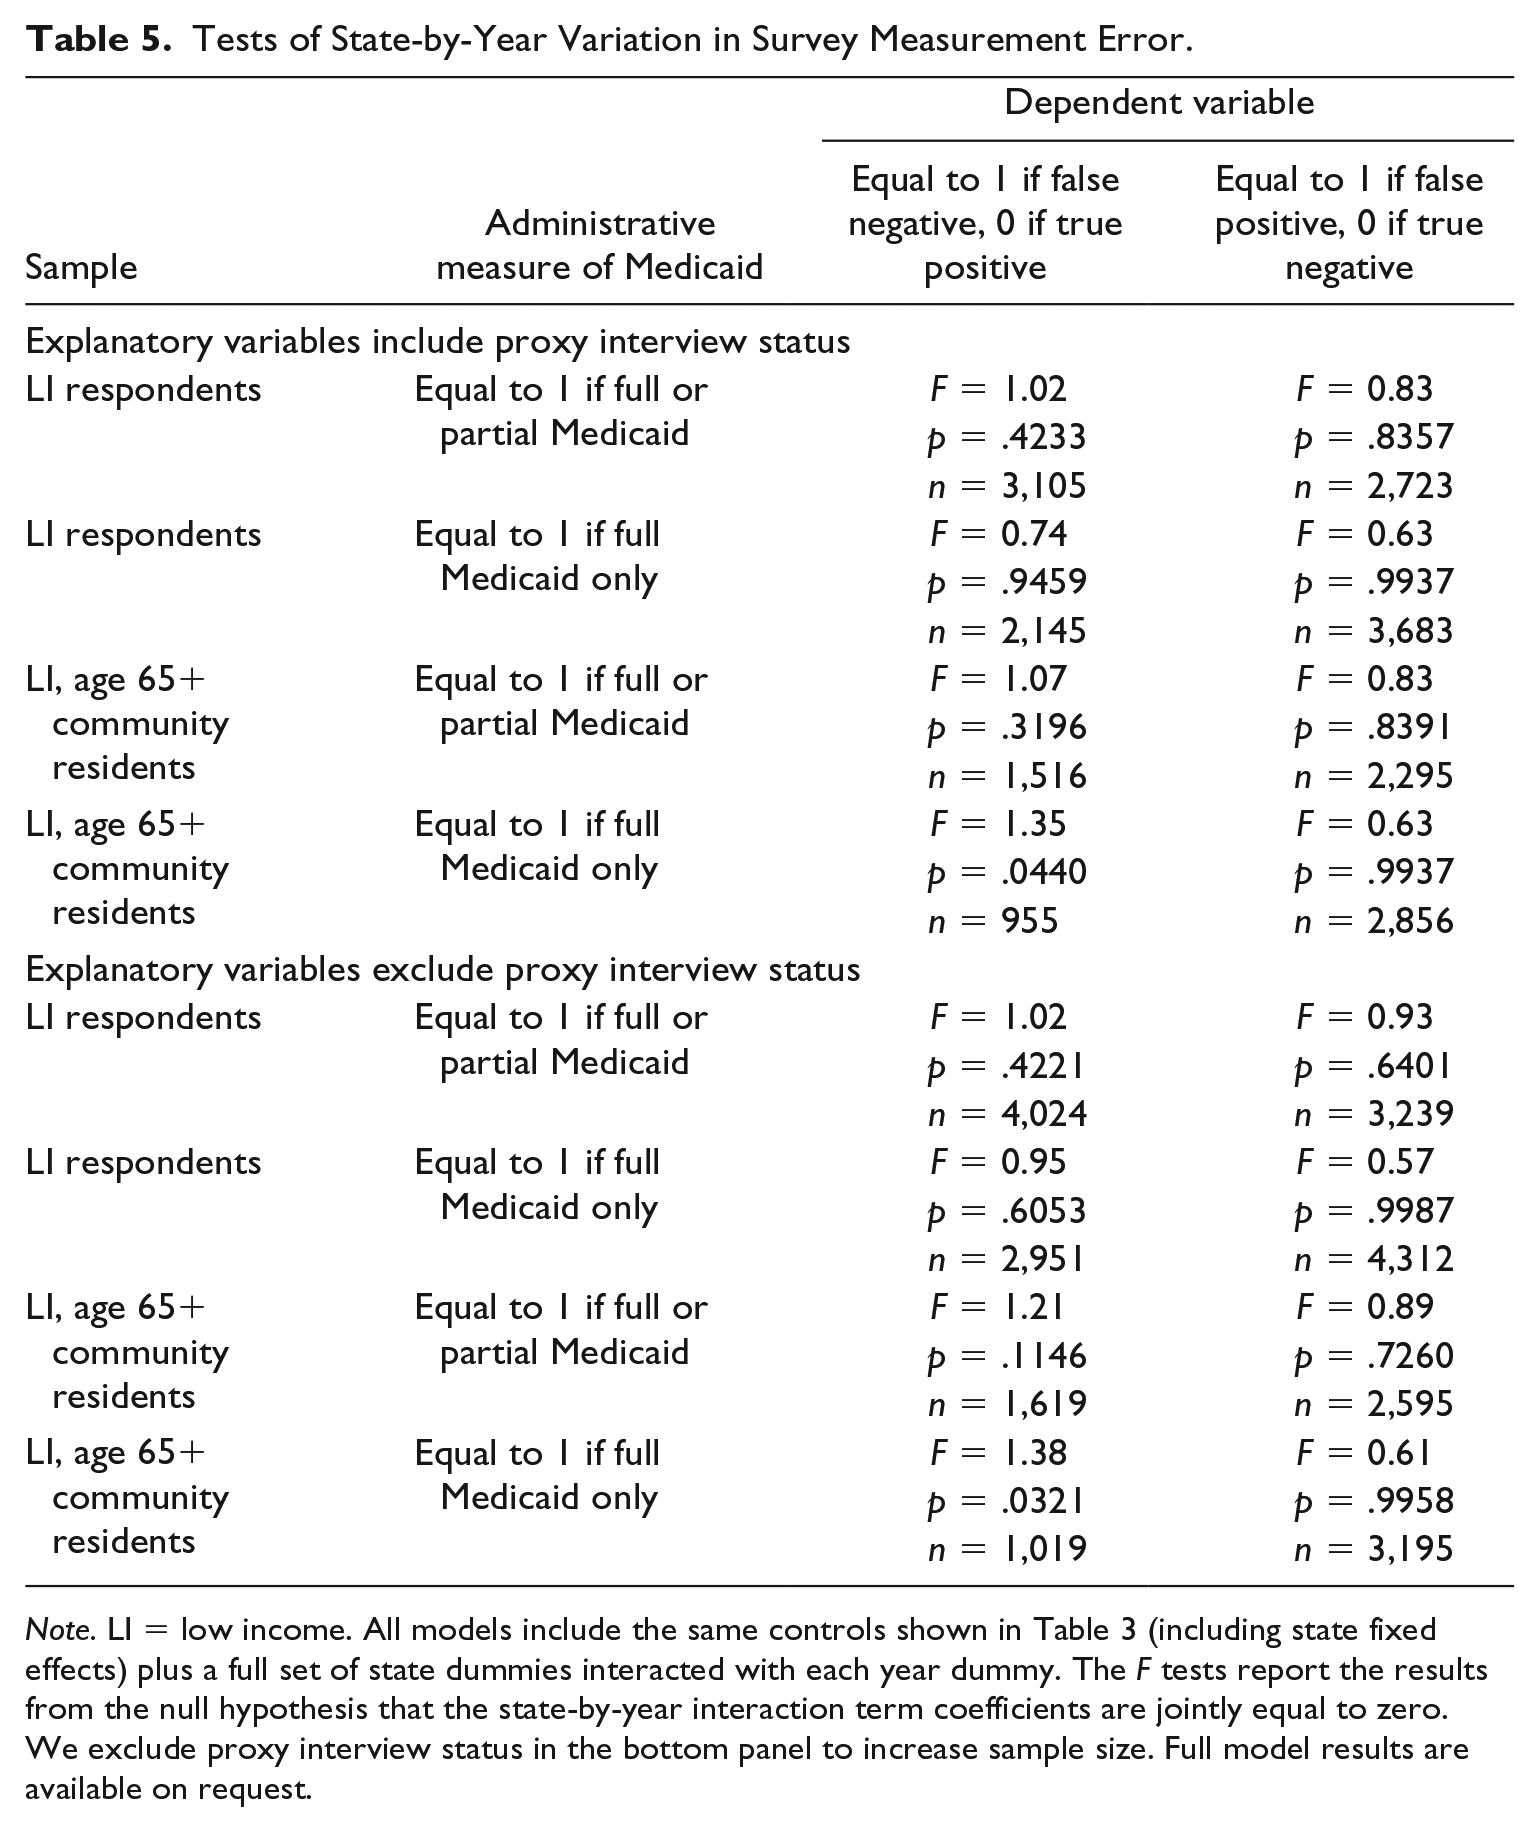
Note. LI = low income. All models include the same controls shown in Table 3 (including state fixed effects) plus a full set of state dummies interacted with each year dummy. The F tests report the results from the null hypothesis that the state-by-year interaction term coefficients are jointly equal to zero. We exclude proxy interview status in the bottom panel to increase sample size. Full model results are available on request.
Conclusion
We examine the extent to which survey responses of Medicaid participation are misclassified for individuals also covered by Medicare, a population that has not been examined before in the literature on measurement error in survey data on program participation and a population of significant policy interest. We highlight four specific findings and their implications for researchers.
First, misclassification errors are considerably less common in our study context—dual eligibles surveyed in the MCBS—than in other settings. We estimate false negative rates of 3.7% to 11.5% among all low-income MCBS respondents, with the lower value applying to known full Medicaid participants and the higher value pertaining to known full and partial participants. Prior studies report false negative rates of 15% in the 1990-1993 Survey of Income and Program Participation (Card et al., 2004), 21.6% in the 2009 American Community Survey (ACS; Boudreaux et al., 2015), 30% in the 2001 National Health Interview Survey (Lynch, 2008), and 40% in the 2006-2011 Current Population Survey [CPS] Annual Social and Economic Supplement (Noon et al., 2016). 6 Although false positive rates are reported far less often in the literature, our estimates of 5% to 20% false positive rates in the low-income population are on the low-end of the 20% to 40% range reported in the ACS (Noon et al., 2016; SNACC Phase V, 2010). As a result, a relatively small fraction of total observations in our various samples are misclassified.
Second, although enumerators and researchers may intend for survey questions to pertain to full Medicaid coverage only, we find that the survey question in the MCBS is picking up many partial-benefit duals. Our results are the first to demonstrate this and do so in several ways: (1) nearly two thirds of MCBS respondents with confirmed partial Medicaid only (i.e., not full Medicaid) report having Medicaid, (2) the share of misclassified observations is significantly lower when we define true Medicaid coverage to be either full or partial coverage than when we use a stricter definition of only full coverage, and (3) the bias that results from using survey data is more pronounced when the researcher interprets the survey response as pertaining to full Medicaid, as opposed to either full or partial Medicaid. This suggests that researchers should use caution when interpreting survey data. If full Medicaid coverage is the outcome of interest, researchers may wish to use administrative data in lieu of survey data or consider the bias corrections or robustness checks described in the econometrics literature. In the long run, researchers wishing to use survey data to study full (or partial) coverage exclusively would benefit from the development of separate items on existing survey instruments. Were such items developed, prompts with the names of relevant Medicaid programs could potentially improve response quality.
Third, misclassification error in survey reports of Medicaid is not independent of respondent traits. False negative error varies significantly by respondent traits such as age, race, marital status, and health conditions. The associations are present both for low-income confirmed full duals and duals with either full or partial Medicaid, and they are observed in one of the most commonly studied segments of the dual population: low-income community-dwelling persons who are 65 years of age and above. This suggests that researchers using self-reported data to model Medicaid participation cannot simply report coefficient ratios or scale-up the estimated coefficients from linear probability models. In fact, doing so would exaggerate the bias when misclassification error is not random. Instead, researchers may wish to use the corrections described by Meyer and Mittag (2017). As they also show, when validation data or parameter estimates are not available from the same survey, using data obtained from a similar setting may be worthwhile. For that reason, we provide some of the necessary data for such corrections in Appendix E. Interested readers can use these data in conjunction with Section 2.1 from Meyer and Mittag.
Fourth, the MCBS data suggest that one type of misclassification error—false negative reports—exhibits year-to-year variation that differs across states among low-income community dwelling older adults. This is notable since many prior studies on the effects of state policies on duals’ Medicaid participation use difference-in-difference models that rely on the common trends assumption or the assumption that preperiod patterns in Medicaid participation are similar in states that experience policy interventions and states that do not (Gardner & Gilleskie, 2012; McInerney et al., 2017; Pezzin & Kasper, 2002; Ungaro & Federman, 2009). While many factors could lead this assumption to be violated, one factor could be the presence of differential trends in misclassification across states; our results suggest that factor may be a concern in some populations, at least in our data set and time period (2011-2013).
There are limitations to our study. While we add to the literature by using a survey for which the sampling frame is all Medicare enrollees, all of whom have administrative information on coverage, we cannot assess the accuracy and completeness of the administrative data directly. Another limitation is that our results are derived from the MCBS and may not necessarily generalize to other studies. While the design of the question in the MCBS is similar to some other surveys that include specific state Medicaid program names (e.g., the National Health Interview Survey, the Medical Expenditure Panel Study, the Health and Retirement Study), this is not the case in other surveys (e.g., ACS, CPS, Survey of Income and Program Participation). That said, the MCBS is used frequently in studies of Medicaid participation, and researchers using MCBS data prior to the 2011 adoption of improved administrative data may find our work especially informative. Finally, we focus only on the consequences of measurement error when Medicaid participation is used as a dependent variable; we note that other econometric considerations arise when mismeasured Medicaid participation is used as an explanatory variable (e.g., Almada, McCarthy, & Tchernis, 2016; Kreider, Pepper, Gundersen, & Jolliffe, 2012; Nguimkeu, Denteh, & Tchernis, 2019).
Dual Medicare–Medicaid enrollees represent a costly and vulnerable population. Research studies on duals—including studies on dual Medicaid enrollment and how it is affected by policy changes (Borella et al., 2018; Ettner, 1997; Gardner & Gilleskie, 2012; McInerney et al., 2017; Pezzin & Kasper, 2002; Ungaro & Federman, 2009), studies on the association between dual enrollment and health care utilization (Moon & Shin, 2006; Rahman, Tyler, Thomas, Grabowski, & Mor, 2015), or studies of health, disability, and service use within the dual-eligible population (Reichard & Fox, 2013)—can offer important lessons for public policy and public health. Investigations of these issues based on survey data will benefit from careful attention to the potential for misclassification of Medicaid participation and ways to address the bias arising from it.
Supplemental Material
Appendices_5_16_19 – Supplemental material for Misclassification of Medicaid Participation by Dual Eligibles: Evidence From the Medicare Current Beneficiary Survey
Supplemental material, Appendices_5_16_19 for Misclassification of Medicaid Participation by Dual Eligibles: Evidence From the Medicare Current Beneficiary Survey by Jennifer M. Mellor, Melissa McInerney and Lindsay M. Sabik in Medical Care Research and Review
Footnotes
Acknowledgements
We thank Corina Mommaerts and participants at the 2018 American Society of Health Economists annual meeting and the 2018 AcademyHealth research meeting for helpful suggestions.
Declaration of Conflicting Interests
The author(s) declared no potential conflicts of interest with respect to the research, authorship, and/or publication of this article.
Funding
The author(s) disclosed receipt of the following financial support for the research, authorship, and/or publication of this article: This project was supported by Grant Number R01HS025422 from the Agency for Healthcare Research and Quality. The content is solely the responsibility of the authors and does not necessarily represent the official views of the Agency for Healthcare Research and Quality.
Supplemental Material
Supplemental material for this article is available online.
Notes
References
Supplementary Material
Please find the following supplemental material available below.
For Open Access articles published under a Creative Commons License, all supplemental material carries the same license as the article it is associated with.
For non-Open Access articles published, all supplemental material carries a non-exclusive license, and permission requests for re-use of supplemental material or any part of supplemental material shall be sent directly to the copyright owner as specified in the copyright notice associated with the article.