
Abstract
Many of the most tangible and immediate political conflicts in Americans’ lives occur at the local level. Yet, we lack large-scale evidence on how, why, and where conflict occurs in local governments. In this article, we present a new dataset of nearly 100,000 videos of school board meetings, and use them to create a new measure of local political conflict. We validate this new approach using sentiment analysis and structural topic modeling. We then document consistent results: conflict in school board meetings occurs at some point for most boards and has become more common since 2020, but the most intense conflicts are concentrated in a small number of districts; this conflict often centers cultural issues like racial diversity and gender identity. We then show that conflict, particularly cultural conflict, is most likely to occur in larger school districts in cities and suburbs and in places with more White students.
Keywords
Conflict Is Central to Politics, but Hard to Study
Local governments like city councils and school districts play a central role in American democracy by overseeing the most tangible and immediate experiences that most individuals have with their governments. Unlike many federal decisions which can be removed from Americans’ lives, friction on local government issues like the size and scope of policing, construction of housing, school desegregation, or public health (Einstein, Palmer, and Glick 2019; Nelsen 2023; Sharp 1996; Trounstine 2023) are often immediately consequential for the lives of community members. Disagreements in local politics are particularly important for quality of life and local democratic deliberation. Understanding the origins and location of local conflict is thus crucial for understanding how Americans experience political conflict more broadly (Busbridge and Chou 2022; Sharp 2007). Despite the centrality of local political conflict, scholars still lack ways to assess how much conflict occurs in local politics, identify the common issues that drive disputes, and understand where and when disagreements happen at scale.
In this article, we focus on conflict in school board meetings. These “hubs for participatory democracy” (Collins 2021a, 790) represent the largest and most common democratic mechanism in the United States (Hamel 2025). News and academic research on school boards suggest two very different stories about the level and scope of local conflict. On one hand, extreme conflict over issues like school reopenings during COVID (Hartney and Finger 2022; Kitchens, Harris, and Miller 2024), teaching materials relating to diversity and racism (Shah, Weinschenk, and Yiannias 2024), and policies concerning LGBTQ+ youth and gender issues (Chatfield 2025) is discussed as widespread, with heightened emotions that divide communities. However, scholars often note extraordinarily low levels of involvement with local government in general, and with deliberative structures such as school board meetings in particular (McComas 2001). While school board meetings have been documented as a central feature of local democracy (Collins 2021a, 2021b; Deckman 2004), a lack of centralized data on local policy-making has hindered our ability to compare engagement and conflict across school boards at scale. As a result, most studies of school boards feature rich analysis of single case studies, surveys of school board members, or observations of a select group of local bodies (Collins 2021b; Ford and Ihrke 2017; Kitchens, Harris, and Miller 2024; Tracy and Durfy 2007), but cannot observe behavior across boards and over time.
We offer two solutions to these data and measurement problems by (1) introducing a new dataset of nearly 100,000 school board meetings and (2) providing a process for identifying conflict in meeting transcripts. We start by creating a broad new dataset of school board policy-making. DistrictView provides full transcripts, audio, video, and metadata for nearly 100,000 school board meetings from 2010 to 2023. We use a five-step process to identify videos posted to school district YouTube channels, validate that each channel contains school board meetings, scrape all available board meetings, and merge transcripts to district-level metadata. The result is a dataset of 98,097 complete school board meetings from 1,594 school district YouTube channels across 48 states. We validate the dataset in a variety of ways and create propensity weights so our results generalize to the full population of U.S. school districts.
While the size and scope of this dataset provides exciting opportunities for scholars seeking to understand broad patterns in public meetings, it also makes identifying conflict challenging from a practical standpoint; the dataset contains more than 150,000 h of video and 1.4 billion words of meeting transcripts. We tackle this challenge by engaging in a novel procedure for identifying conflictual language in local government policy-making. Drawing on literature on conflict in political conversations (Albertson and White 2022; Johnson-Laird and Oatley 1989; Proksch et al. 2019; Tracy and Durfy 2007), we develop a dictionary of “conflictual” language. We then use word embeddings (Muller and Proksch 2024; Rodriguez and Spirling 2022) to expand that manually created dictionary into a broader set of words that captures a semantic, contextual understanding of conflict. An advantage of our approach is that we can use conflictual language to identity when conflict occurs without prespecifying the topics of that conflict in advance, which allows researchers to use this approach to study a wide set of forms of conflict efficiently and effectively. We validate this measure by comparing characterizations of the conflict within meetings to the sentiment of the text (both across entire meetings and within segments of meetings). We also show that conflict varies as expected across topics obtained from structural topic modeling (Roberts et al. 2014).
We use our new data and measure to fill four empirical gaps in scholarship on school board meetings as a site of local democracy. First, we show that conflict occurs regularly in school board meetings and has increased since 2020. Second, while almost all school boards experience some conflict at some point, the most intense conflicts occur in a small number of high-conflict districts. While we identify many school districts where conflict has spiked in the last several years, the median district in our sample sees little to no conflict in most of their meetings. Third, the most intense conflicts in our data are most often (but not always) over cultural issues relating to race and gender identity. Finally, we show that conflict, particularly over cultural issues, is much more likely to occur in large school districts, in districts with fewer students of color, and in places with higher per-pupil expenditures. We also find that cultural conflict is much more common in urban and suburban school districts, as compared to towns and rural school districts.
Our results contribute to a set of recent efforts to expand the scope and scale of work on local politics by leveraging new sources of data (Barari and Simko 2023; de Benedictis-Kessner et al. 2023; Einstein, Palmer, and Glick 2019; Sumner, Farris, and Holman 2020). DistrictView is a new public resource that scholars can use to study local politics without pursuing their own costly collection efforts. Further, our data collection approach—focused exclusively on public data—can be continued in the future to automatically collect new local government meetings as they happen, which can drastically expand the scale of the dataset over time (Barari and Simko 2023, 2024). Finally, we also offer our new measure of conflict, which is designed to detect conflict about any issue, not just those issues that attract national or media attention. Throughout, we demonstrate how scholars could adapt our approach to study conflict on specific issues of interest. Our work allows us to understand the scope and frequency of conflict across local governments and time, contributing to our understanding of the form and function of local democracy.
Conflict in (Local) Politics
Conflict is core to the behavior of political bodies, particularly adversarial democratic institutions (Mansbridge 1983). While scholars have long focused on conflict in American politics (e.g., Schattschneider 1960), research often focuses on national conflict between political parties or branches of the federal government (Williamson and Sievert 2024). Yet, conflict in politics is often most salient to Americans at the local level (Chou and Busbridge 2020; Sharp 1996, 2007). Those studying local conflict often point to the central role that fraught deliberations play in communities. These tense discussions—which often take place in local government meetings—shape a broad range of issues like where and whether housing is built (Einstein, Palmer, and Glick 2019; Einstein, Glick, and Palmer 2019; Sahn 2024), how public goods are provided and distributed (Trexler and Mullin 2024; Trounstine 2016), how schools should respond to the COVID-19 pandemic (Kitchens and Goldberg 2024), and decisions about morality and inclusion (Chou and Busbridge 2020; Sharp 1996). One central yet unresolved challenge to studying local conflict in the United States is that it is notoriously difficult to research local politics over time and across geographic space due to a lack of centralized data on local policy-making (Barari and Simko 2024; de Benedictis-Kessner et al. 2023; Sumner, Farris, and Holman 2020; Trounstine 2009). For example, Bryan (2010, 18) notes in his study of town meetings in Vermont that comparative information about local conflict “has never been collected” by scholars.
Consequently, studies of local conflict engage in a diverse set of methodological approaches. One group observes the behavior of local residents and elected leaders (Bryan 2010; Hoang 2021; Holman 2016; Mansbridge 1983; Tracy and Durfy 2007), while others code agendas and meeting minutes (Busbridge and Chou 2022; Einstein, Glick, and Palmer 2019; Holman 2014). Scholars also survey and interview members of city councils and school boards (Deckman 2007; Ford and Ihrke 2017; Holman 2014; Kitchens, Harris, and Miller 2024). These studies point to the importance of a shifting set of issues that drive conflict locally. 1 While these approaches illuminate particular instances of conflict or perceptions of disagreement from school board members, the inability to observe a large set of meetings across locations and over time has stymied our ability to study conflict broadly. Further, the tools that have been developed to study political conflict at the national level—or even internationally by comparing countries—are not directly amenable to studying how conflict occurs in American local politics: parties vary enormously in their power, issues emerge and submerge in their importance, and groups leverage power over which topics get attention (Anzia 2019; Benjamin 2017a, 2017b).
In the next section, we offer a new dataset and approach to provide scholars with tools to examine when and where and how conflict occurs in local politics.
DistrictView: A Dataset of School Board Meetings
Local education policy-making has long featured conflict alongside broader social patterns. Discord has emerged on issues like racism, class, and gender equity policy (Clotfelter et al. 2023; Diem, Frankenberg and Cleary 2015; Morel 2018; Simko and Siegel-Hawley 2025). For example, Shah, Weinschenk, and Yiannias (2024) find that national debates filtered down into Wisconsin school district elections from “the conflict campaign,” an effort to attack school curriculum relating to diversity, racism, and gender studies. Targeted efforts to bring national conflict to the local level are not new: in 1996, Christian Coalition director Ralph Reed noted that “I would rather have a thousand school board members than one president and no school board members” (Zimmerman 2021, 1). Debates throughout and even before the 20th century featured issues like human evolution, communism, sexual education, and school integration (McGirr 2015; McRae 2018). Conflict in education also occurs around hyperlocal issues such as funding (Rugh and Trounstine 2011), school closures (Nuamah 2022), and the structures of union contracts (Anzia 2011, 2019). Thus, one barrier to understanding when and where conflict occurs is the variation in sources of local disagreements.
We use school board meetings to examine local conflict. In the United States, more than 95% of schools are governed by elected school boards. Although these boards vary in their size, election rules, and authority, the most typical board is a small set (under 10) of volunteers, elected via at-large nonpartisan elections (Ford and Ihrke 2020). Public meetings are the primary policy-making venue for school boards. Open public meetings laws in all 50 states require school boards to hold public meetings, discuss agenda items, and take votes. These meetings also provide key opportunities for members of the public to participate (Barari and Simko 2024; Collins 2021b), which can serve as a major forum for conflict (Castro et al. 2022; Tracy and Durfy 2007). Thus, the sheer scale of local education politics is a second barrier to studying conflict; directly observing more than 12,000 school boards with more than 90,000 members is simply infeasible.
A third barrier to identifying conflict across units and time is the lack of easily accessible data on local policy-making. For studying conflict, we ideally would observe the actual policymaking processes of local governments. However, scholars of U.S. local politics know how difficult it is to collect comparative data on subnational governments and representatives; as Barari and Simko (2023, 135) note, “local policy-making remains difficult and expensive to study at scale due to a lack of centralized data.” Instead, scholars examining conflict often rely on precollected “trackers” of high-profile incidents created by third-party organizations like the Cato Institute (Shah, Weinschenk, and Yiannias 2024) or study conflicts over specific issues (Chou and Busbridge 2020). These sources are often focused in scope (e.g., examining particular time periods or states) and generally rely on media reports of contentious meetings or case studies. Consequently, these sources likely undercount conflict in districts with less media attention and may overlook conflict about hyperlocal issues.
We address this data challenge by developing DistrictView, the largest existing dataset of school board meetings of which we are aware. DistrictView contains meetings across space (from over a thousand school boards) and time (from regular meetings over nearly 15 years). Two policy patterns allow us to develop this dataset: first, state-level “Sunshine” laws in all 50 states require that governments distribute public records of their meetings. Traditionally, governments complied with these rules by releasing meeting “minutes” (summarized accounts of meeting actions), which scholars have used to understand the course and content of local policy-making (Einstein, Palmer, and Glick 2019; Holman 2014; Sahn 2024). Second, over the last decade, governments have begun uploading full video recordings of their meetings to a variety of platforms, but particularly to YouTube as it is free and well-known (see SI Section 2) (Barari and Simko 2023, 2024; Einstein et al. 2023).
While videos represent a revolution in how local governments provide information about policy-making, they remain frustratingly inaccessible for scholars. We address this problem by adapting a data-collection procedure devised by Barari and Simko (2023), which began with the universe of Census Bureau Places to collect data largely focused on entities like city councils and county commissions. We instead begin with the universe of regularly operating U.S. school districts to collect school board meetings. We use a five-step data collection, cleaning, and validation process described below to build DistrictView. More information on all steps is available in SI Section 2.
We began with the Common Core Data roster of school districts in all school years between 2014–2015 and 2021–2022 from the National Center for Education Statistics. Our total population is 12,616 active school districts.
We then queried the YouTube Data API for each school district by name (i.e., Los Angeles Unified School District). We used these search results to build a set of potential channels for each district. At this stage, a single “candidate channel” could be a potential match to multiple districts (many school districts have identical or similar names) or none at all.
Next, we used manual validation to narrow down the “candidate matches” to unique matches between channels and school districts. A team of four research assistants manually verified the channel status of each of the 12,616 districts in our universe by using channel metadata, websites, and other linked social media accounts. This resulted in an initial sample of 5,991 channels that had a valid match to a single school district and were identified as an official district YouTube channel. The top panel of Figure 1 shows an example channel: Beach Park Community Consolidated School District #3 includes the full district name in their channel header and a state name (Illinois) in the channel description.
2
Research assistants also manually verified if the channel posted videos of school board meetings. Thirty-five percent of school district YouTube channels (2,114 out of our 5,991) are used to upload school board meeting videos. Many channels are used to post nonmeeting content like superintendent updates and school athletic events.
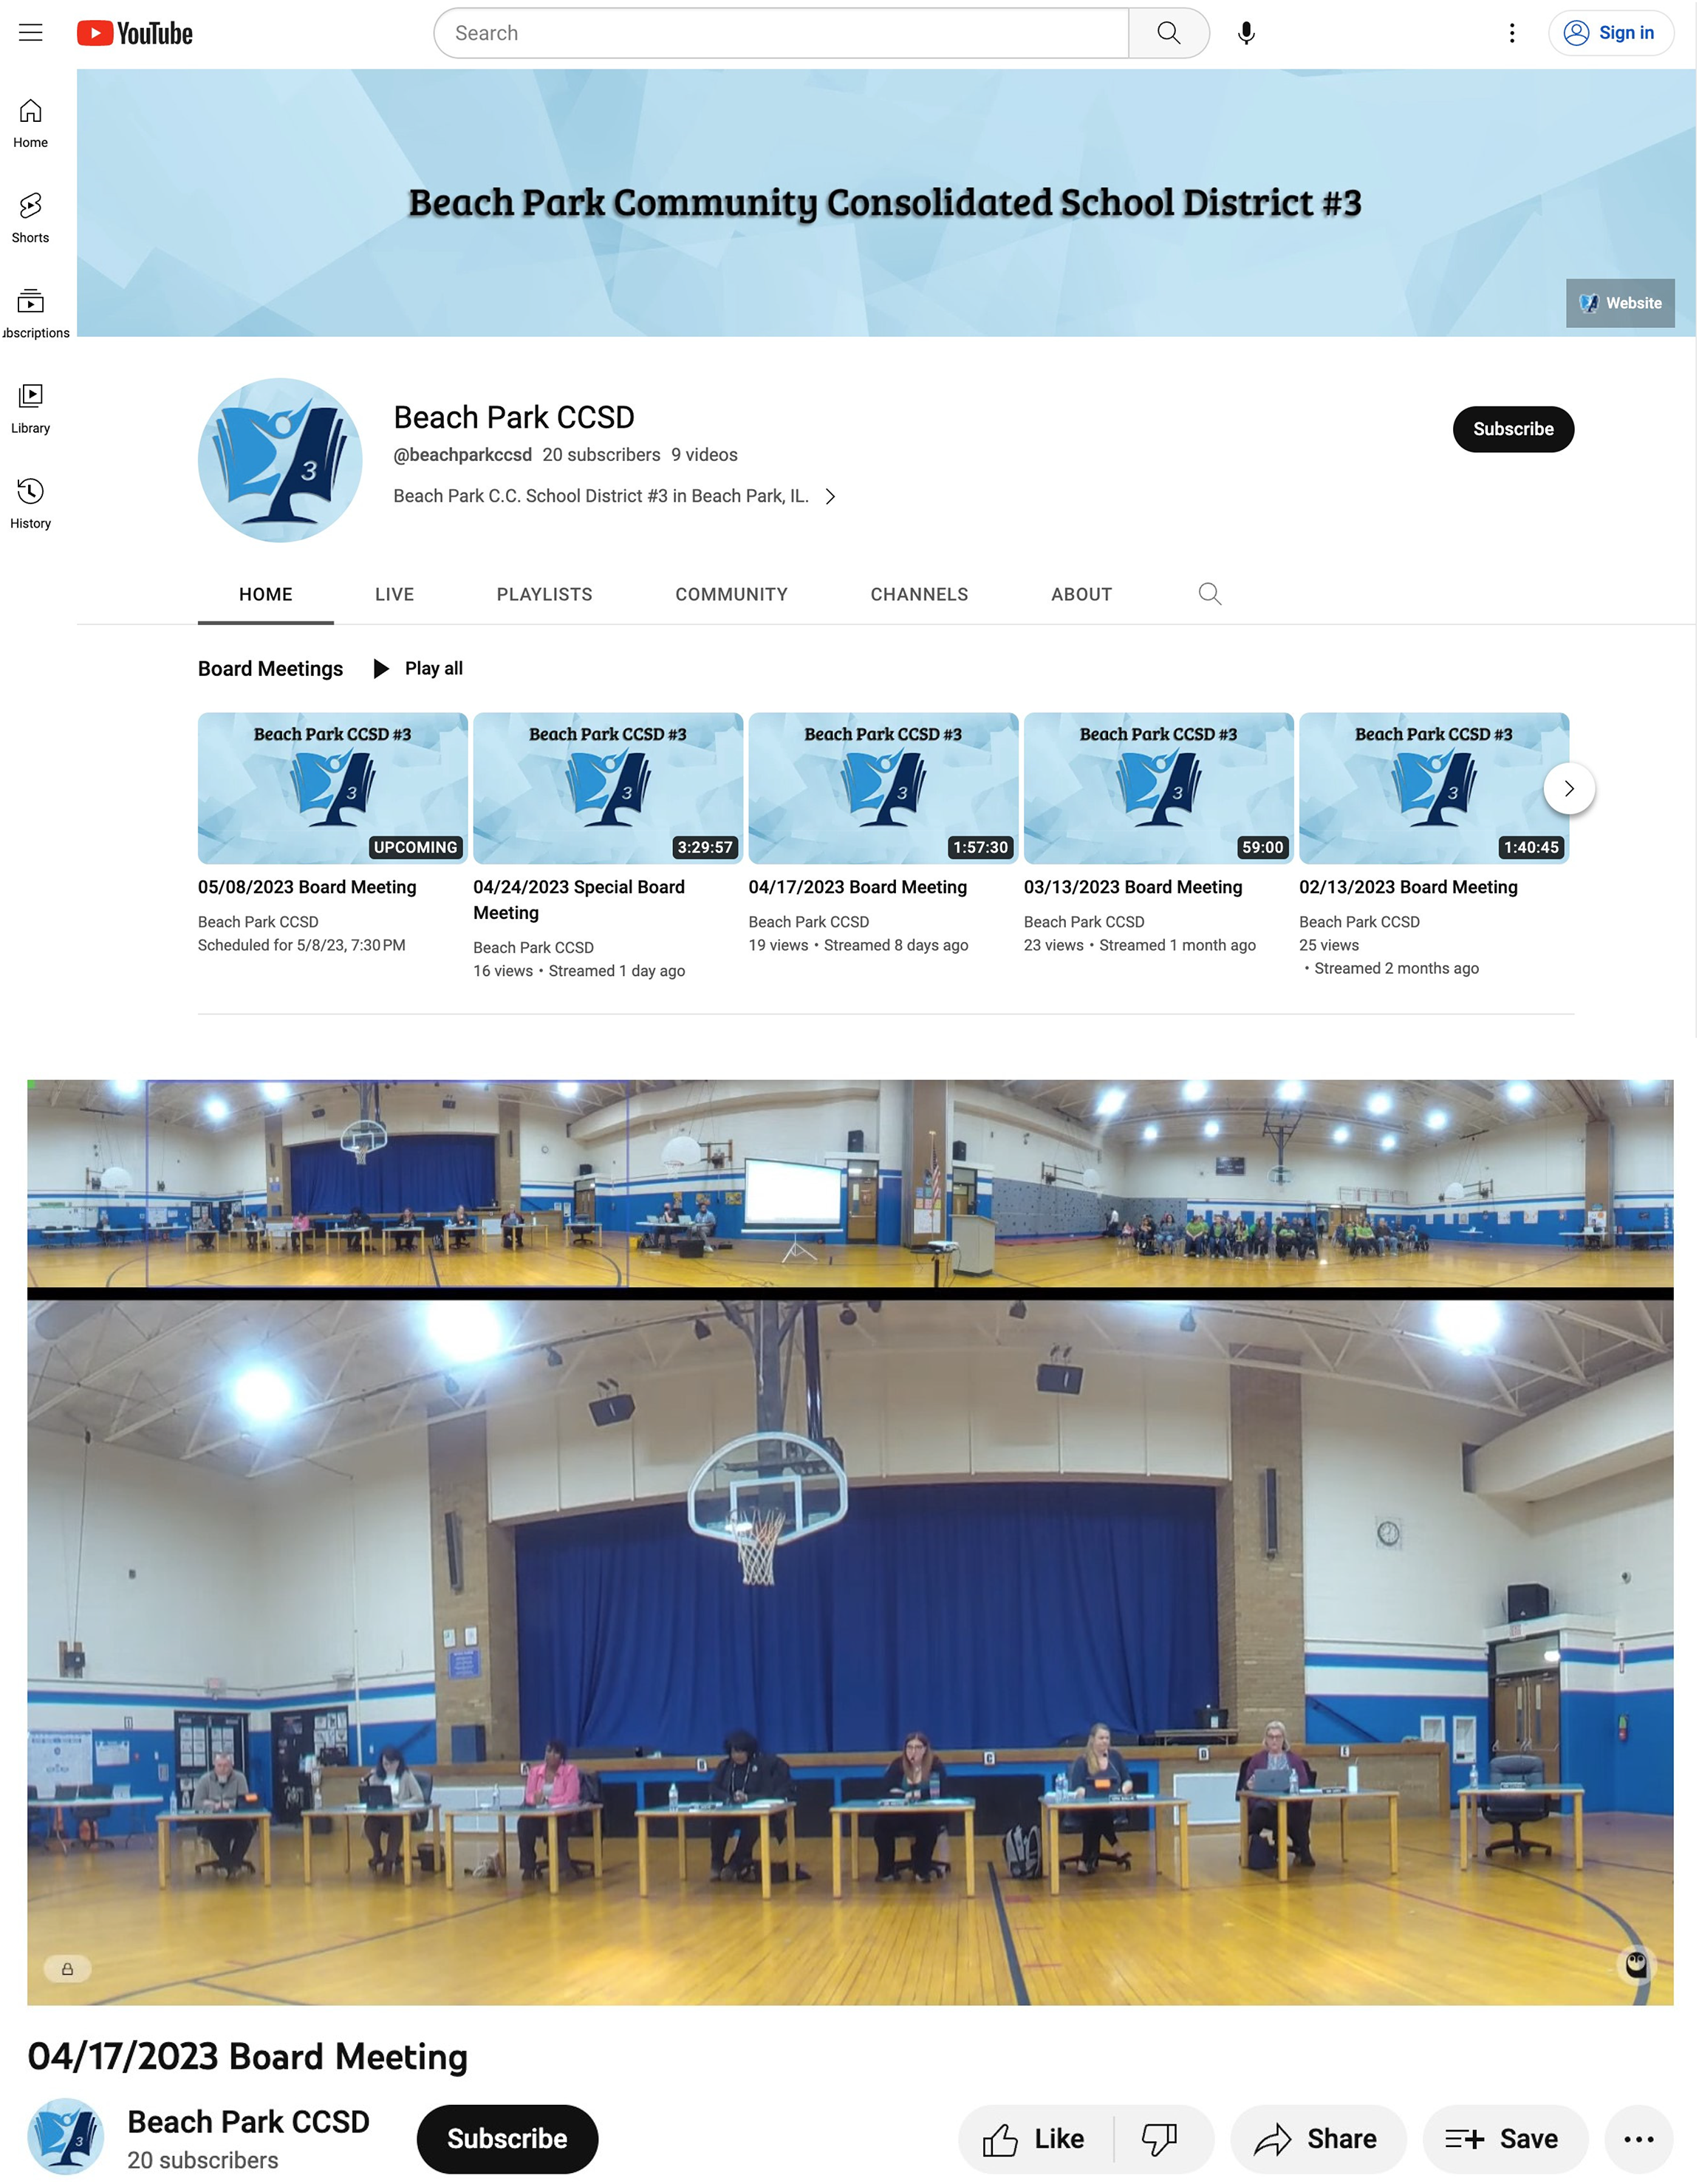
Example DistrictView channel and videos. The top panel shows the channel landing page (as identified in Step 3) for Beach Park C.C. School District #3 in Illinois. The bottom panel shows a screenshot from a school board meeting video as identified by our search procedure (as identified in Step 4).
For each validated channel, we then downloaded information on all uploaded videos (nearly 200,000 in total). We then searched for common terms among their uploaded videos that likely indicated school board meetings (e.g., “school board meeting,” “board of education meeting,” “BOE,” etc.). We differentiated likely meeting videos from other uploaded videos on validated channels by using regular expressions on the video title and description. This process identifies meeting videos like the example shown in the bottom panel of Figure 1.
For each meeting video, we use the YouTube Transcript API to scrape the automatically generated transcripts, which previous work has validated as generally high-quality and accurate (Bokhove and Downey 2018; Liao et al. 2013). At this stage, DistrictView contains transcripts from all school board meetings from identified distinct channels. One advantage of our approach is that the last two steps of our process (identifying meeting videos and downloading transcripts) can be re-run in the future to download new meetings from both existing channels and newly created channels.
DistrictView Covers a Large Share of U.S. School Districts
Our five-step procedure produces a sample of 98,097 videos across 1,594 districts, covering approximately one-in-eight of the 13,000 school districts in the United States. Districts in our sample represent nearly 13 million students (nearly 30% of all public school students). This disparity is driven by a long right tail in school district enrollment: 30% of regular U.S. school districts enroll fewer than 500 students, while nearly 50% enroll less than 1,000 students. As we show in SI Section 1, our sample includes a wide range of school districts with slight overrepresentation of large and nonrural districts. We develop a propensity weighting procedure (see SI Section 1) and use these weights in later regression analyses. These weights improve balance and the sample's representativeness of the target population.
DistrictView is geographically dispersed across the United States. As shown in Figure 2, our sample includes school districts from every state, except Hawaii and Vermont. 3 The states with the most representation in our sample closely map onto states with the most school districts overall, like New York, California, Texas, Ohio, and Illinois. Our sample also includes videos from over a decade, with a large jump around 2020 when many meetings were moved online to platforms like Zoom during the COVID-19 pandemic. 4
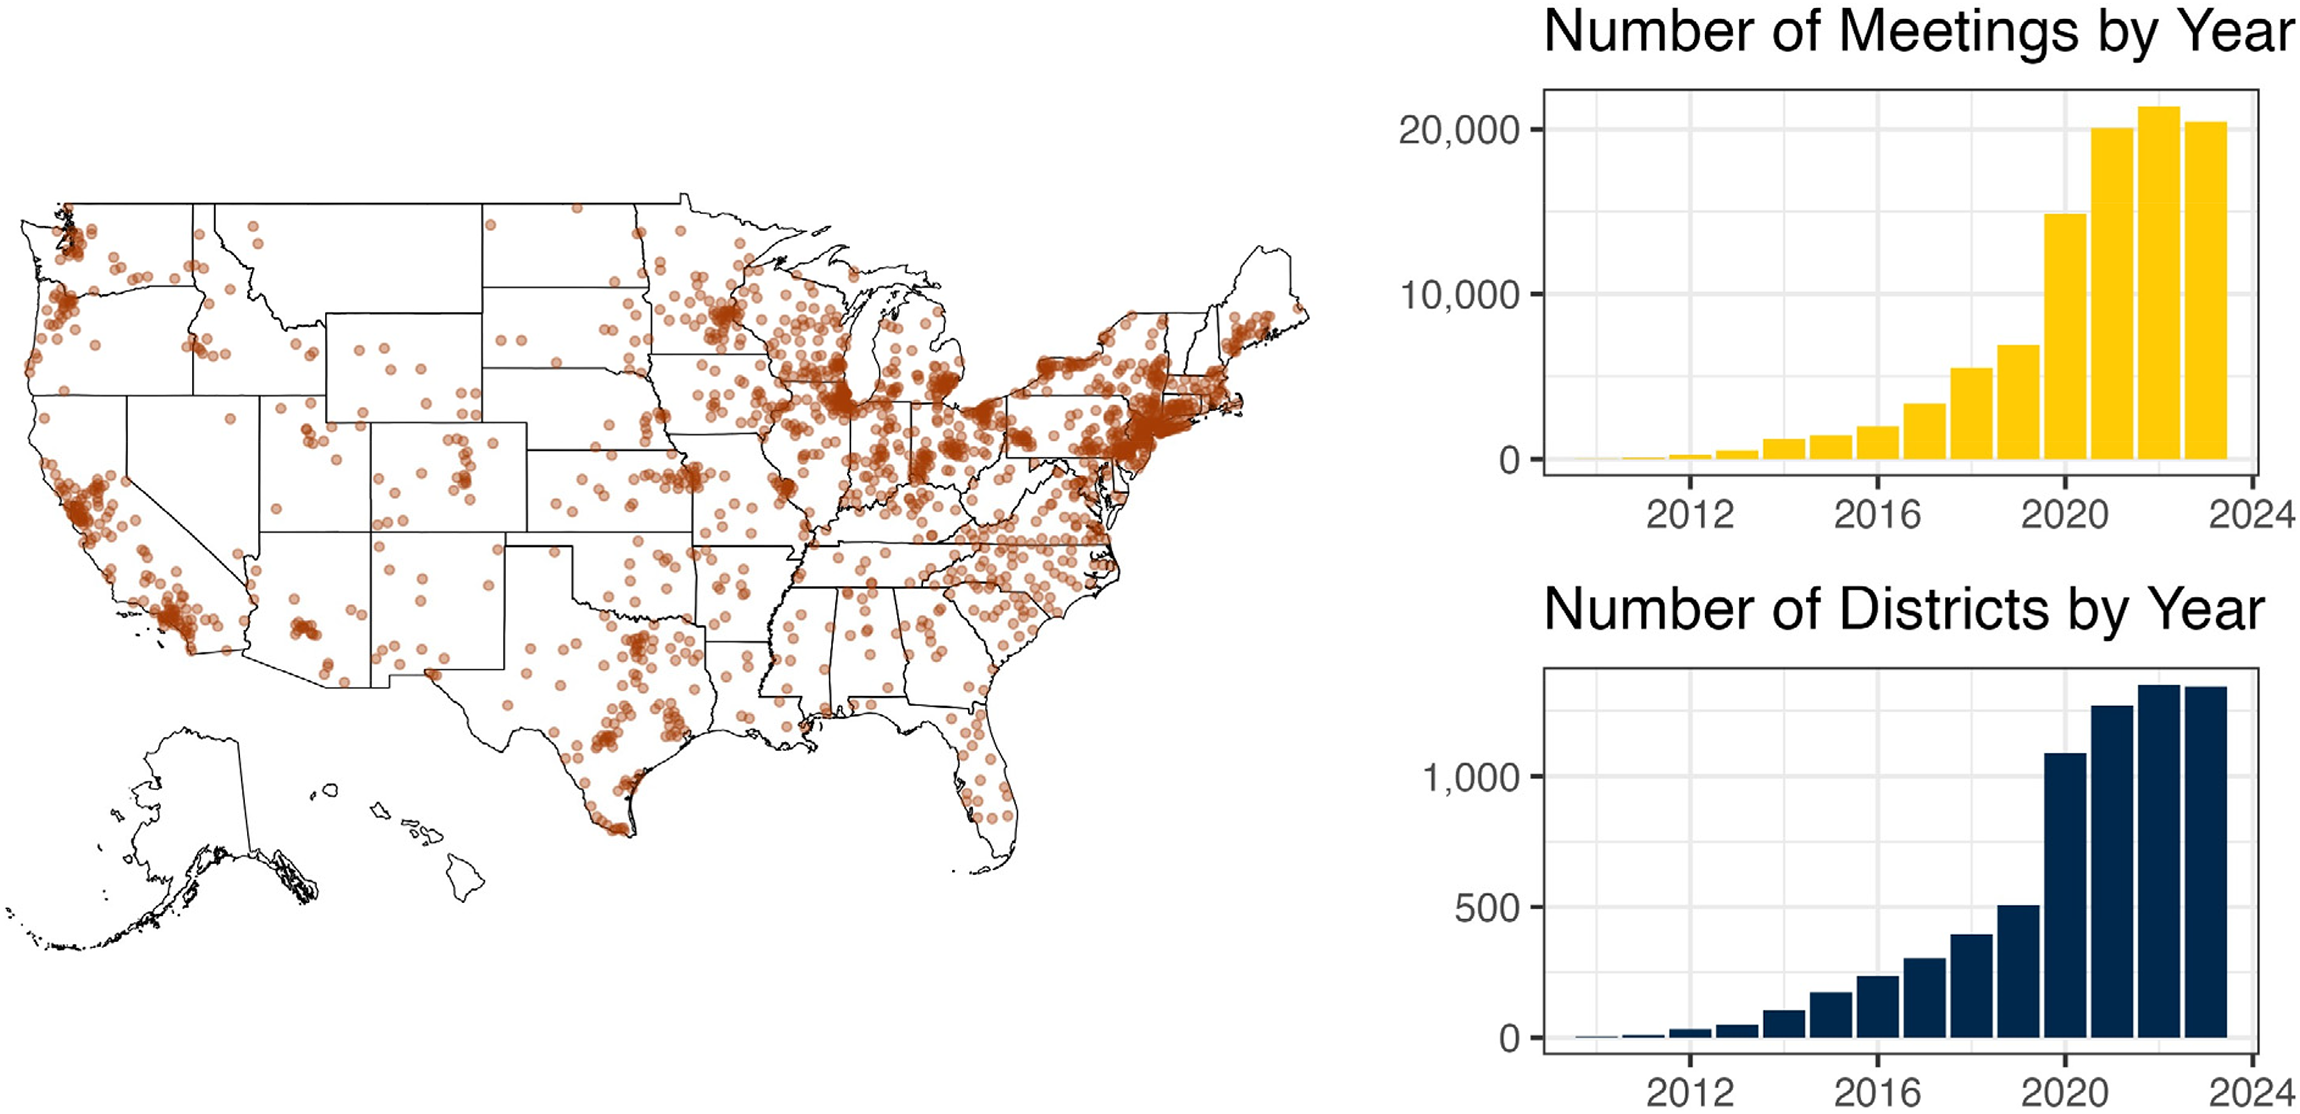
Sample coverage and growth over time. Our sample is large, includes districts from 48 states (except Hawaii and Vermont), and covers over a decade of school board meetings. The left plot shows a map of the 1,594 districts (points) in DistrictView. The right plots show the growth in our sample by the number of meeting videos (top) and districts with any meetings (bottom) in each year.
Much of the existing cross-sectional research on the processes and internal debates of local governing bodies relies on meeting agendas (Tepper 2004) or minutes (Einstein, Palmer, and Glick 2019; Sahn 2024). Although these documents provide information on the decisions of political bodies (such as items on the agenda or votes), they offer highly summarized accounts of the meeting. Using minutes or agenda items to study local conflict would lead to underreporting because these documents do not generally transcribe the actual events that took place in the meeting, nor do they record the tenor of the meeting. Minutes also rarely provide detail on the stances that members of the board or community take on any issue or whether there are differences in preferences among meeting attendees.
For example, Table 1 shows an excerpt from the minutes (left pane) from a meeting of the Vermillion School District in South Dakota. Item #7-1522, introduced a new policy on Gender, Equity, and Access to amend district policy on students’ rights to express their gender identity, including the district recognizing preferred pronouns and allowing students to use preferred restrooms. The meeting minutes suggest there may have been some conflict over Item 7: “approximately 120 members of the public were in attendance and 45 addressed the School Board.” 5 But at three pages long, the minutes provide no additional detail on speaker identities or what commenters said about the policy.
Comparing Minutes and Meeting Video Transcripts.
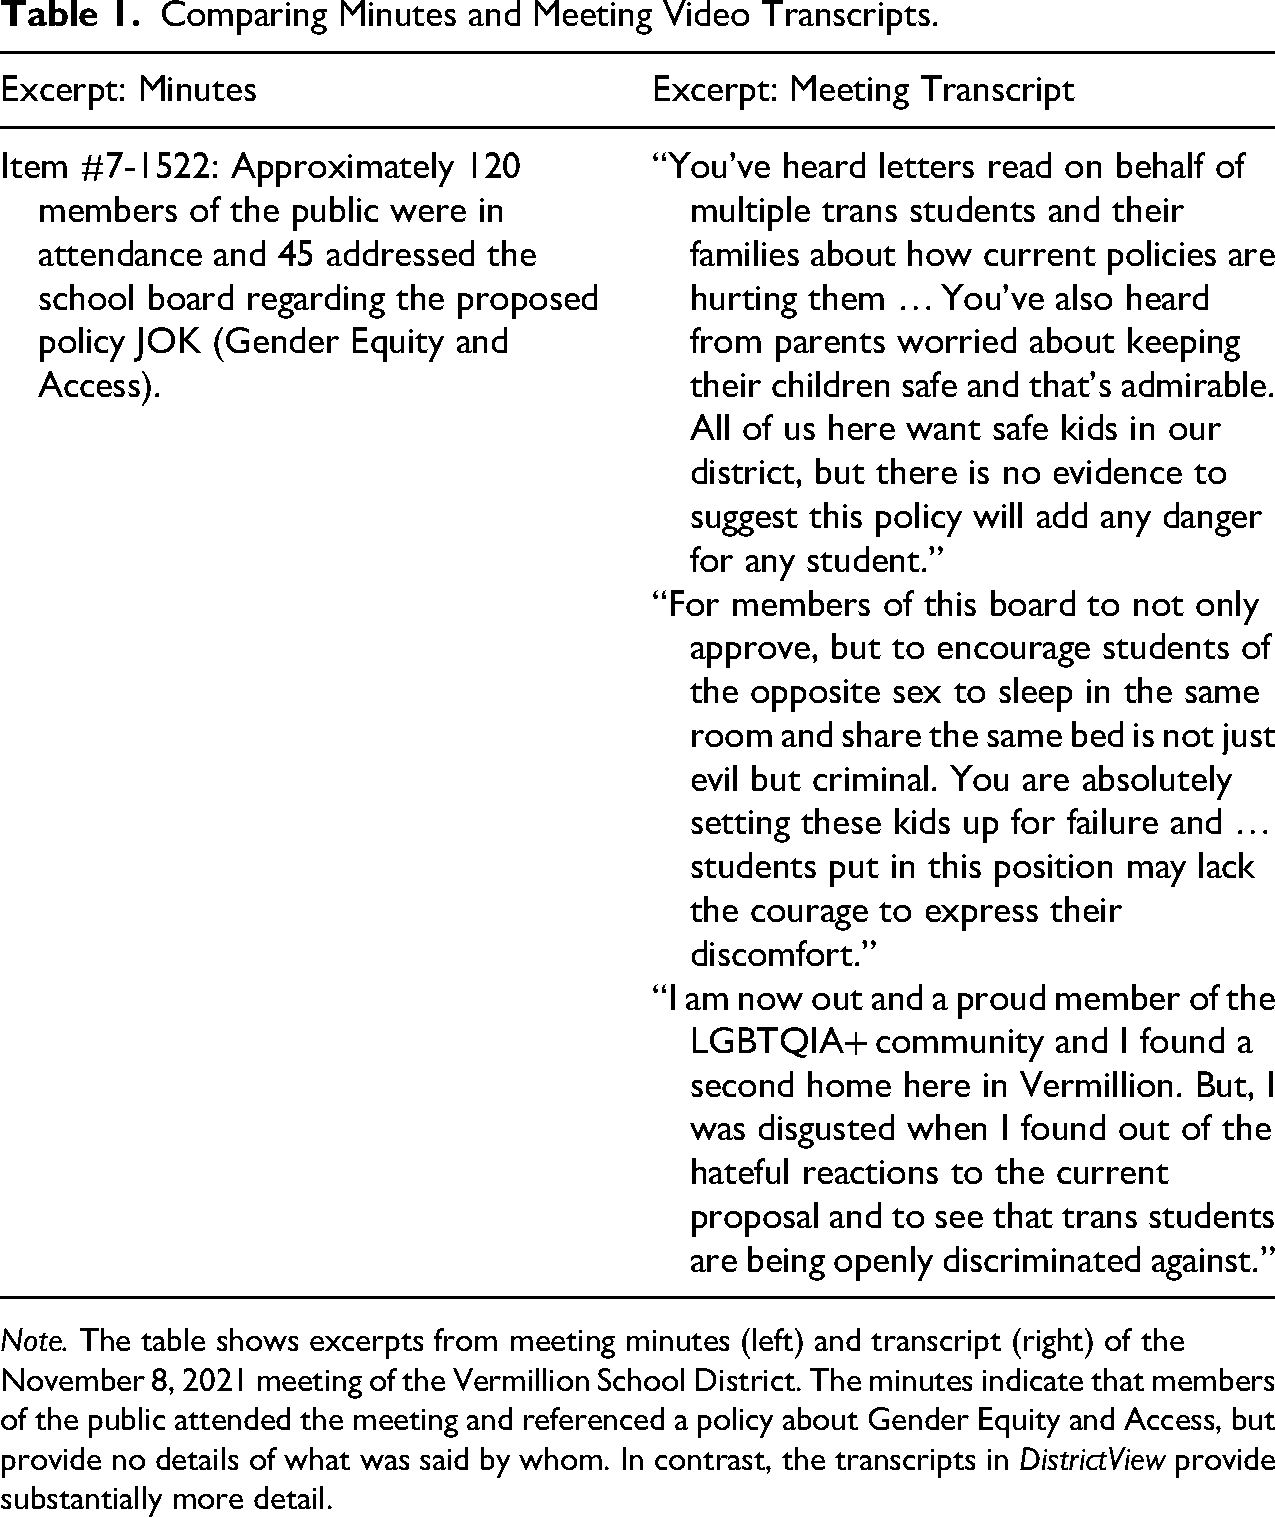
Note. The table shows excerpts from meeting minutes (left) and transcript (right) of the November 8, 2021 meeting of the Vermillion School District. The minutes indicate that members of the public attended the meeting and referenced a policy about Gender Equity and Access, but provide no details of what was said by whom. In contrast, the transcripts in DistrictView provide substantially more detail.
In contrast, the video and transcript from DistrictView tell a much more complex story. This meeting was 4 h and 15 min long, with over three hours of public comment from more than 100 community members on Item #7-1522. The right column of Table 1 shows three excerpts from public comments. We argue these full transcripts provide far greater context and potential to understand the interpersonal dynamics of meetings than minutes. DistrictView provides scholars with the opportunity to understand not just the topics of discussion across school boards, but also the tenor, direction (both for and against policies), and emphasis of those discussions.
DistrictView dramatically expands both the scale and granularity of data currently available for scholars studying policy-making and conflict in local politics. But, the detail provided in our transcripts also presents a challenge: the size of DistrictView makes manual evaluations of patterns infeasible (our data contains 156,416 h of material). Next, we discuss an approach to identifying conflict that combines a dictionary method with a word embedding extension process.
Measuring Conflict
We aim to identify language that broadly predicts conflict (Albertson and White 2022; Boussalis et al. 2021; Johnson-Laird and Oatley 1989) and not just conflict associated with specific issues, points in time, or places. Existing work has often focused on the spread of nationally contentious issues (Shah, Weinschenk, and Yiannias 2024) or highly localized conflicts (Nuamah and Ogorzalek 2021). But, to study conflict more generally in a corpus of this size, we needed to develop an innovative methodological approach. Below, we describe our approach, which could be adapted for use on other political bodies, time periods, and country settings (Proksch et al. 2019).
We start by defining conflict as interpersonal, hostile interactions between local residents that feature negative emotions like ridicule and outrage; this allows for us to seek out conflict more generally, rather than issue-specific conflict. We draw on literature on the concept of interpersonal conflict in public spaces to develop a dictionary of words and word embeddings to operationalize that conflict. We then use computational text methods to identify when these “conflict terms” occur within our corpus. Finally, we validate the measure by comparing it to sentiment analysis and structural topic modeling.
We use DistrictView to identify conflict by examining the content of school board meeting transcripts. We subset our data to 69,218 “regular” (i.e., public, noncommittee) meetings that have captions and are at least 10 min long (see SI Section 2.1 for further details on sample selection). We pre-process the transcripts by removing punctuation, numbers, non-alphanumeric symbols, a list of common English stopwords (e.g., me, does, would, etc.) provided by Benoit et al. (2018), and stemming all words. Finally, we remove words that appear in less than 1% of meetings (to remove, e.g., names of board members and specific schools) and more than 75% of meetings (to remove uninformative words like “school” and “meeting”). This cleaning procedure results in a dictionary of 7,991 unique words.
We then follow the process outlined in Muller and Proksch (2024)'s study of nostalgia to identify conflict in our corpus. We start with a small keyword dictionary of “seed words” that we expand into a larger dictionary using word embeddings related to this initial hand-picked set. We define this initial dictionary based on research of interpersonal conflict (Albertson and White 2022; Phoenix 2019; Stapleton and Dawkins 2022), particularly conflict in local politics (Ford and Ihrke 2017; Tracy and Durfy 2007). We start with terms directly identified in the literature and then expand to “nearest neighbors” or associated terms 6 to identify 19 seed words: disgusted, shame, abuse, ridiculous, evil, surprised, concerned, angry, hurt, harm, miserable, worried, upset, furious, nervous, frightened, scared, distressed, and ashamed, which are used 275,970 times across our corpus. These words appear often, but generally comprise a small portion of each meeting: seed words appear three times in the median meeting (mean = 3.99), which has over 1,800 processed non-stopwords. Some meetings feature highly concentrated usage of these seed words. While the median meeting features three seed words, the 95th percentile has 13 and the 99th percentile has 23 instances of the seed words.
Next, we follow best practices for identifying a specific concept in a large corpus and expand our seed dictionary using word embeddings to include words that are closely associated with seed words, but we may have missed in our manual exploration (Muller and Proksch 2024). The goal of this expansion is to ensure that our dictionary captures a broad, contextually informed understanding of conflict and is not driven by idiosyncrasies in our own chosen terms. Word embeddings are numeric word representations that capture contextual meanings by estimating that words are “closer” together in multi-dimensional space when they tend to appear together in real text. Here, we use 50-dimensional GloVe embeddings (Pennington, Socher, and Manning 2014), which represent individual words as 50-dimensional numeric vectors.
We identify words closely related to those in our seed dictionary by calculating the cosine similarity between the word embedding vector for each of our seed words and all other 400,000 words in the GloVe corpus. The numeric word embedding representations are created such that words that are more contextually similar will have higher cosine similarity (Rodriguez and Spirling 2022). These “nearest neighbors” capture the intuition that a word like dog is semantically very similar to words like cat (similarity = 0.92) and puppy (0.78), but very distinct from words like kazoo (0.07) and drywall (0.00177).
For each seed word, we identify a set of highly related words by taking the five nearest neighbors with the highest cosine similarity. These similar words have high face validity: the most similar words to ridiculous in our embeddings include absurd (similarity = 0.937), ludicrous (0.920), and outrageous (0.909). We collect the five nearest neighbors from each seed word and subset to words that appear more than once. This process creates six additional words that are nearest neighbors to at least two of our seed words: trouble, anger, appalled, embarrassed, felt, and sorry. 7 All three comments from the Vermillion School District meeting shown in Table 1 include words from this dictionary and would be identified as conflictual using our approach.
Our conflict measure also identifies—as we expected—meetings where contentious issues are not a reflection of national conversations. While the Vermillion example represents conflict over the kind of cultural issues that often receive national attention, our approach also identifies local, idiosyncratic conflict over more regular school district business. For example, the meeting of the Wall Township Board of Education in New Jersey on May 16th, 2023 featured a long discussion of whether the district should cut the ROTC program (a pre-military extracurricular program) budget. In response, a variety of community members spoke at a meeting that ran to 4 h and 34 min. After one community member was turned away, the next commenter said: [03:37:58] Hi I’m [name] … What I don’t understand is why wouldn’t you let her speak? Because you don’t have another public comment, you have a staff member here she wants to talk. So obviously you should let her talk. It's ridiculous. On the ROTC, I agree with [name] it should all be a no tonight. Otherwise, you need to table it. Completely, just completely thrown off guard with this whole thing. You don’t have it anywhere in the minutes, you’ve never talked about it. I’ve been coming to meetings, I look at the minutes. So let us know tonight, when did you discuss it? When and where did you discuss it? To put it on an agenda tonight and cut him down to, uh, it's 0.6 of his pay. You, you had no intention of letting the people know, it was to just hide it in there. Meanwhile, we’ve got [name] he must be down for 10 jobs tonight. It's ridiculous. Get your house in order. Get the comptroller's office in here and figure out where all the money's going because it's ridiculous to think that you don’t have the money for 40 grand for a guy working himself to the bone. That you couldn’t find forty thousand dollars? That I mean, that just sounds ridiculous, like we’re complete idiots.
8
Our measure can also identify issues that are common across school districts that only sometimes draw conflict, such as school construction, contracts, mascots, and taxation. Each of these topics is common (even mundane) in school board meetings, but only occasionally generate high levels of conflict. While our issue-agnostic approach identifies these conflicts alongside other more commonly contentious issues, researchers exclusively interested in issue-specific conflict could use a combination of our measure and issue-related key word searches. Researchers could also adapt our approach by editing the initial seed dictionary (to, e.g., account for different conceptual understandings of conflict). Further examples of high-conflict meetings are shown in SI Section 5. We use this dictionary to identify conflict in the next section.
Identifying High-Conflict School Board Meetings
We use this dictionary in two ways: first, we calculate a Meeting Conflict Score, which we use alone and to identify which meetings had High and Low levels of conflict. The Meeting Conflict Score is the total number of conflict words used in a given meeting. For certain analyses, we group meetings into high and low conflict by defining two thresholds thigh, tlow. A meeting is classified as high-conflict if the number of conflict words used is greater than thigh, and low-conflict if the number of conflict words used is less than tlow. Here, we define high-conflict meetings as meetings above our 75th percentile for the number of conflict words used (eight words, for a total of 16,502 meetings), and low-conflict as below the 25th percentile for conflict word usage (two words, for a total of 15,829 meetings). We choose quartiles to create similar sample sizes in each group, but see SI Section 3 for evidence our results are robust to this choice.
We use these groups to calculate a Word Conflict Score for all other words in our corpus. These scores identify which other words are associated with conflict without pre-specifying certain issues as conflictual (e.g., nationally divisive cultural issues). To do so, we compare usage rates for every word in our corpus between high and low conflict meetings; see SI Section 4 for a more formal discussion of this process. We use this frequency measure to compare how much more often words are used in “high conflict” meetings compared to “low conflict” meetings by calculating the raw difference in the word's average usage between high conflict and low conflict meetings. Finally, we adjust this measure to account for word frequency by dividing by each word's “base rate” use in low-conflict meetings.
This Word Conflict Score Cw represents how much more often a word is used in high-conflict meetings compared to low-conflict meetings. For example, we anticipate a high Cw for the word pronoun, a term associated with conflict over gender studies, attacks on trans students, and with bathroom bans (MacDonald 2022). We calculate the conflict score for pronoun as Cpronoun = 24.13. This score means that the term pronoun is used much more often on average in high-conflict meetings (for an average usage of 0.238 times per high-conflict meeting) compared to low conflict meetings (for an average usage of 0.009 times per low-conflict meeting). Cpronoun then captures the idea that pronoun is used much more often in high-conflict meetings than low-conflict meetings (numerator = 0.238–0.009), and this difference is more than 20 times larger than the rate that word is used in low conflict meetings (
Our Word Conflict Score also captures the idea that non-contentious words should be used at similar rates in high and low-conflict meetings. For example, pledge is used in nearly 70% of our meetings, generally to indicate the Pledge of Allegiance at the beginning of a meeting. Intuitively, the low conflict score Cpledge = 0.346 recognizes that pledge does not predict conflict, as it is used at similar rates between high (1.37 times per meeting) and low conflict meetings (1.01 times per meeting). But, our approach allows for the possibility that words like pledge could be associated with conflict in other samples (Ellis 2005). Our issue-agnostic method thus allows conflictual topics to fluctuate across time and space as issues receive more or less attention in different locations.
Terms Most Associated with High Conflict
Which words are most associated with high levels of conflict? We calculate our Word Conflict Score (Cw) for every word in our corpus, and find that words with high scores closely map on to qualitative understandings of conflict in education policy in recent years (Kitchens, Harris, and Miller 2024; Pollock et al. 2022; Shah, Weinschenk, and Yiannias 2024). Table 2 shows the top 20 words in our corpus with the highest values of Cw according to the quartile thresholds (top 25% vs. bottom 25%) we use for illustration purposes.
Gender, Diversity, and COVID Terms Are Associated with High Levels of Conflict.
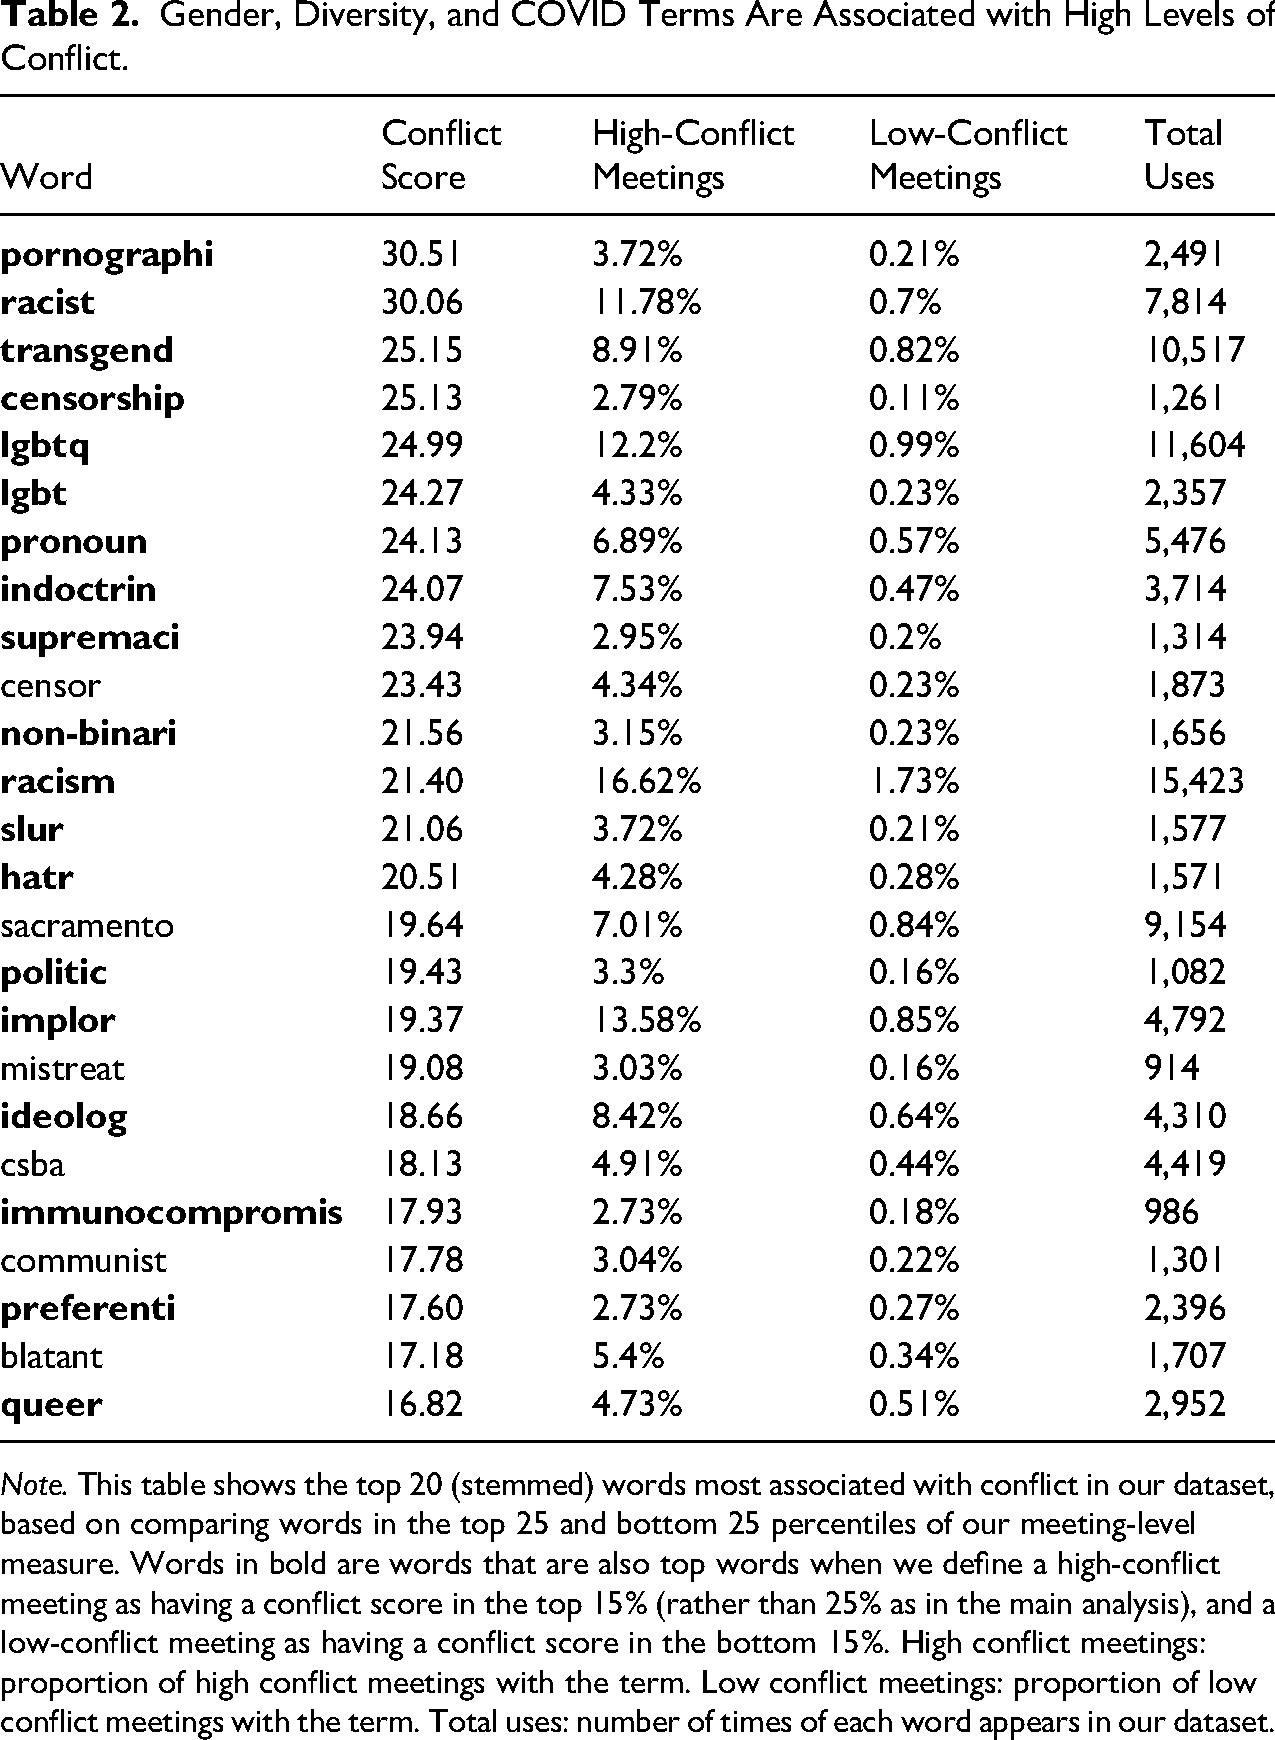
Note. This table shows the top 20 (stemmed) words most associated with conflict in our dataset, based on comparing words in the top 25 and bottom 25 percentiles of our meeting-level measure. Words in bold are words that are also top words when we define a high-conflict meeting as having a conflict score in the top 15% (rather than 25% as in the main analysis), and a low-conflict meeting as having a conflict score in the bottom 15%. High conflict meetings: proportion of high conflict meetings with the term. Low conflict meetings: proportion of low conflict meetings with the term. Total uses: number of times of each word appears in our dataset.
From a face validity perspective, the words that are much more likely to appear in high-conflict meetings are those that are immediately recognizable as being associated with nationally contentious cultural issues. We find that the terms most associated with conflict in our dataset are related to gender identity (transgend, lgbtq, non-binari sexual, queer), diversity and equity (racist, supremaci), the instruction of controversial material (censorship, pornographi, indoctrin, propaganda), and COVID policy (immunocompr). We also find these controversial terms are often concentrated in the highest conflict meetings. Figure 3 shows that these words tend to appear more often in more conflictual meetings. For example, the word LGBTQ appears in approximately 12% of meetings above the 75th percentile of conflict, but 36.2% of meetings above the 99th percentile.
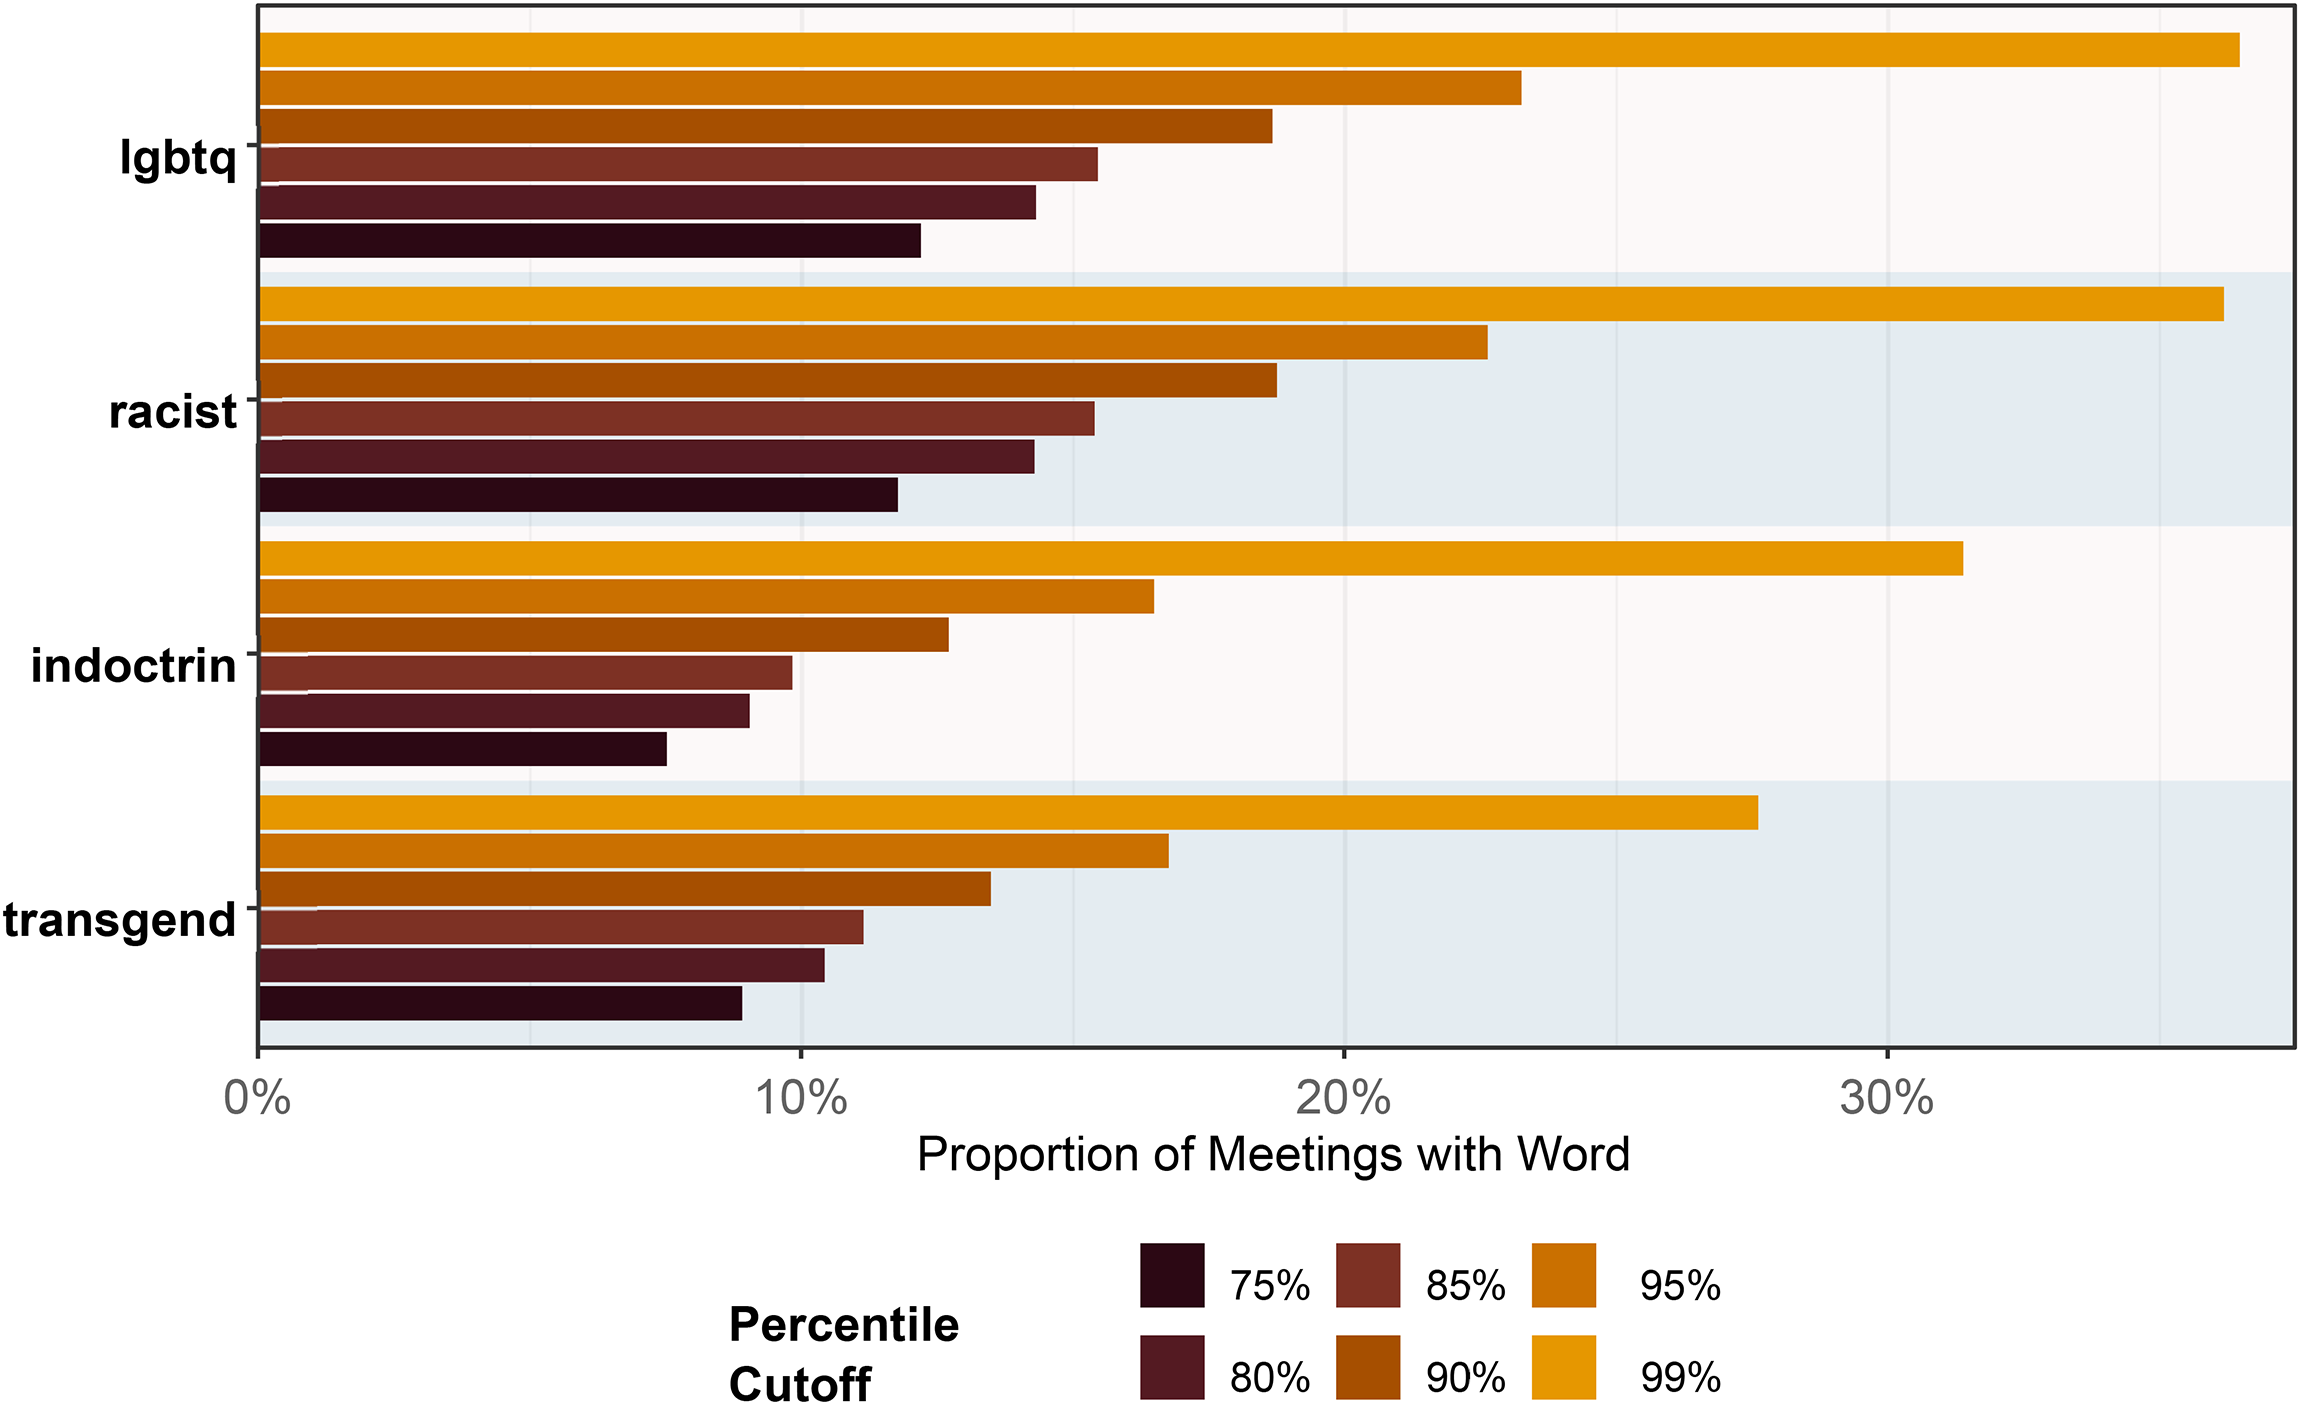
Words most strongly associated with conflict are often concentrated in high-conflict meetings. Here, we show how a few of the most contentious words from Table 2 appear more often in more contentious meetings. For each term in the plot, we recalculate the proportion of meetings with conflict scores higher than a given conflict threshold (75th-99th percentile) in which each term appears. That is, LGBTQ appears in approximately 12% of meetings above the 75th percentile of conflict, but 36.2% of meetings above the 99th percentile.
Further, this result—that the most conflictual words tend to relate to cultural issues—is robust to a series of other specifications. If we raise the threshold from quintiles of conflictual meetings (75% most conflictual vs. 25% least conflictual) to a higher threshold (85% to 15%), we see similar validity (see SI Figure 9 for the correlation in Cw scores across all words). Similarly, SI Table 7 shows this approach provides similar results as when we compare TF-IDF scores, another commonly used measure of text “importance,” between high and low conflict meetings.
Validating Our Conflict Measure
Sentiment Analysis: We validate that our approach identifies high-conflict discussions by demonstrating a strong correlation between our meeting conflict score and the sentiment of the transcript (Pang and Lee 2008). We use sentiment as a means of validation for two intuitive reasons: across meetings, low-conflict meetings should have more positive sentiment than high-conflict meetings, and within the same meeting, lower conflict meeting segments should have more positive sentiment than higher conflict segments. We use AFINN, a sentiment lexicon that scores each word along a valence of −5 (most negative) to +5 (most positive) (Koto and Adriani 2015; Nielsen 2011). We create a meeting-level sentiment score across transcripts by aggregating each word's count multiplied by its sentiment valence, then dividing by the total number of scored words. We regress the meeting-level sentiment score on a categorical variable indicating a high (75th percentile or above), mid (25th-75th percentile), or low (25th percentile) conflict meeting identified by our measure (see SI Table 4). We calculate a segment-level sentiment score by calculating the sentiment within a small window (50 words before and 50 words after) of each appearance of a word in our conflict dictionary, excluding the conflict word itself, for a random sample of high conflict meetings. 9 We then regress segment-level sentiment scores on our conflict score (see SI Table 5).
We find that both (1) high-conflict meetings and (2) high-conflict segments within meetings have significantly less positive sentiment than low-conflict comparisons. Both models estimate positive and significant coefficients, indicating that high-conflict meetings and meeting segments have significantly lower sentiment than low-conflict comparisons. We interpret this result as one source of evidence that our measure accurately identifies contentious (sections of) meetings.
Topic Modeling: Another alternative approach to identify high-conflict discussions could be to search for discussions of specific conflictual topics. Researchers are often interested in studying the political dynamics of policy areas such as school diversity and desegregation (e.g., Bullock and Rodgers Jr 1976; Castro et al. 2022; Parcel and Taylor 2015; Siegel-Hawley, Bridges, and Shields 2017; Simko and Siegel-Hawley 2025) or bonds and funding (Hamel 2025; Rugh and Trounstine 2011). Researchers interested in issue-specific conflict—say, COVID reopening plans—might use a topic model to identify a subset of meetings that discuss COVID to analyze. If our measure successfully identifies contentious meetings, we would expect meetings that feature discussions of traditionally contentious topics to have higher conflict than other meetings.
We use the issues discussed within meetings to show that our measure identifies topics prone to conflict. We fit a structural topic model (STM) with 20 topics on our analytic sample of meetings (e.g., Gilardi, Shipan, and Wuest 2021; Roberts et al. 2014). 10 These topics (see SI Figure 12 and Table 6) reflect the content of typical business in school board meetings. For each meeting, we then identify the topic with the highest estimated proportion of content in that meeting. Finally, for each topic we calculate the distribution of conflict among meetings that the STM identified as being primarily about that topic. Our results, visualized in Figure 4, show that high conflict meetings are more common when discussing certain issues, especially what scholars might call “moral” conflict issues (Kreitzer, Kane, and Mooney 2019; Sharp 1996) like diversity and COVID. However, conflict also regularly occurs across issues like athletics and a procedural discussions of leadership.
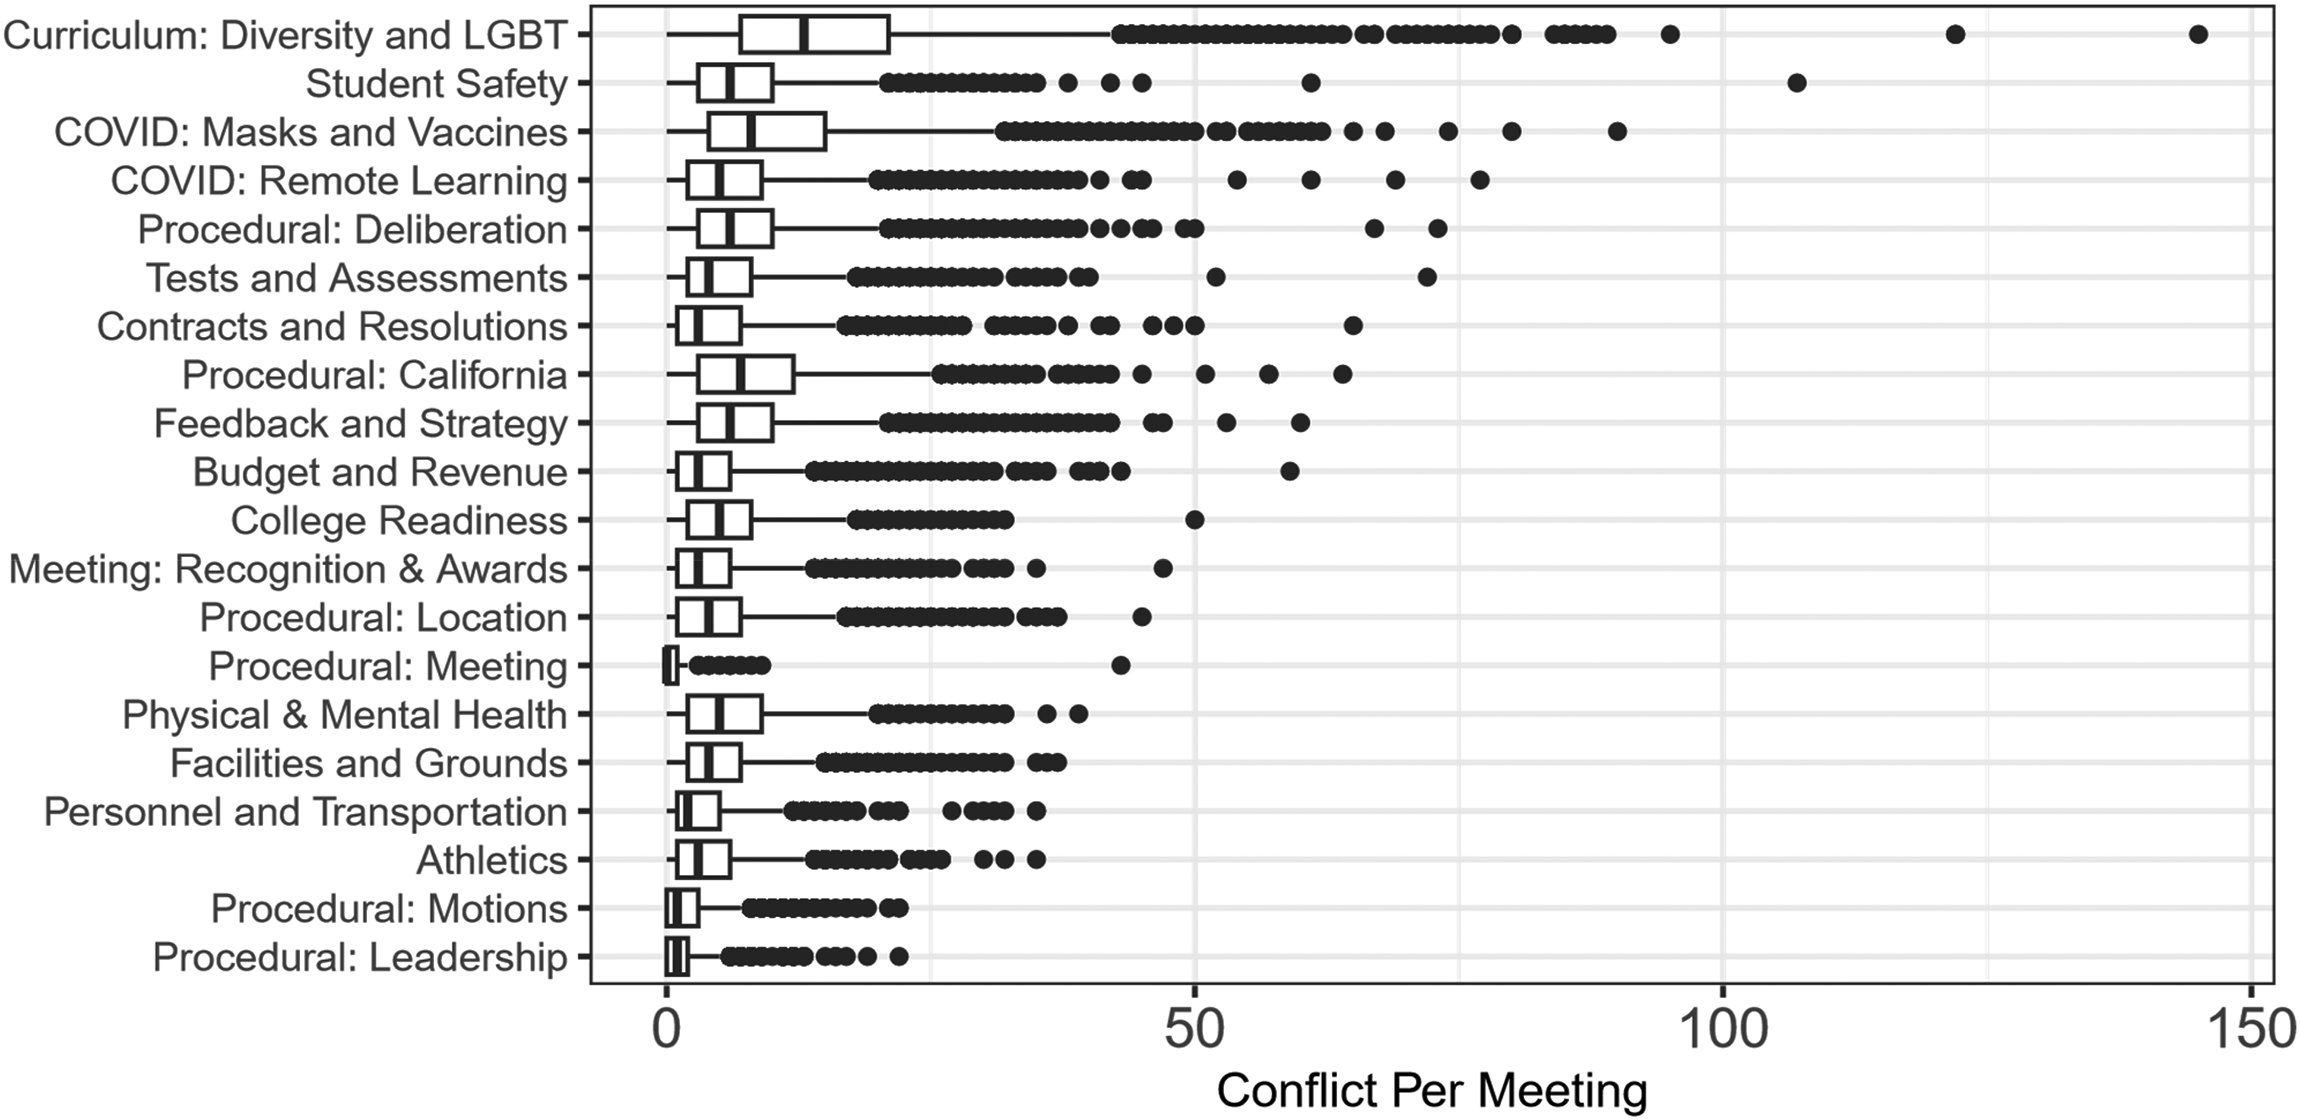
Our approach assigns higher conflict scores to meetings with more contentious topics. Here, the x-axis shows the conflict score for each meeting in our dataset. The meetings are grouped into one of 20 topics (identified by STM) as the topic with the highest estimated proportion of content in that meeting. We provide the topic labels based on readings of the highest probability and highest FREX words estimated by STM, as reported in SI Figure 12 and Table 6.
We take this as further evidence of the validity of our measure of conflict, in that it varies across issues in ways that we would expect. Beyond validation, SI Section 6 demonstrates how our approach also offers advantages for identifying conflict over sentiment analysis and topic modeling. Sentiment measures are noisy when calculated at the meeting-level because of procedural language and isolated conflicts. Similarly, we show how using topics to identify conflict can overreport conflict, as not all discussions of contentious topics (like COVID) are conflictual. SI Section 5 shows examples of high and low conflict meetings on topics like COVID-19, racial/ethnic diversity, and gender identity.
Conflict Fluctuates in Expected Patterns, Increases Over Time
As a final validity check, we examine if our conflict measure accurately captures patterns of conflictual issues over time. If we have successfully identified conflictual meetings across our sample period, our measure should vary temporally in correspondence with salient national events, such as the COVID pandemic, the anti-CRT “conflict campaign,” and backlash against gender studies.
We first document that conflict in school board meetings fluctuates over time (see the left plot of Figure 5). Terms in our conflict dictionary appear an average of six times per meeting (median = 4), but with temporal variation that is highly responsive to national events (Pierson 2000). For example, our measure identifies the summer of 2020 (when school boards debated COVID policy) as a time of particularly high conflict. Similarly, the second half of 2021 is the highest period of conflict for school boards in our sample, which aligns with national attention to a “conflict campaign,” which encouraged individuals to lobby their school boards to ban critical race theory and gender studies (Pollock et al. 2022; Shah, Weinschenk, and Yiannias 2024). Before 2020, conflict also peaks in early 2016, when states like North Carolina passed “bathroom” bills targeting transgender students (Chatfield 2025).
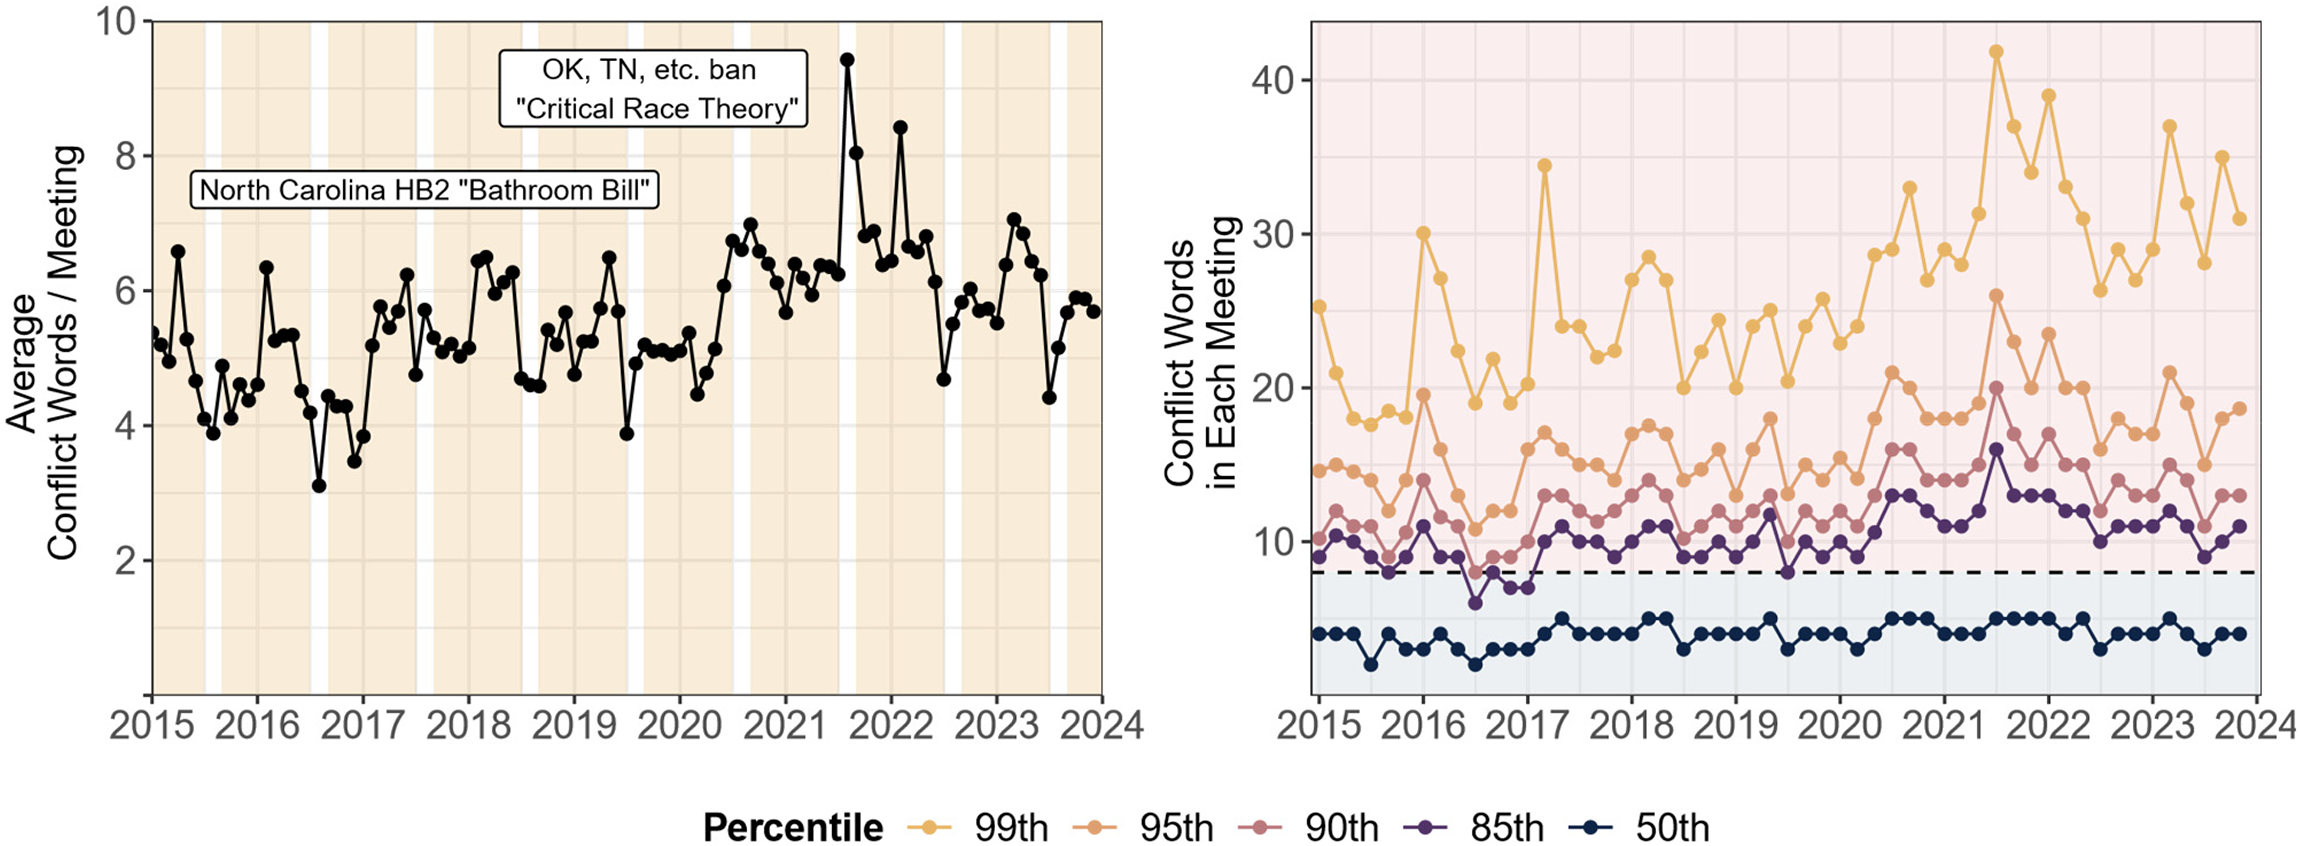
Conflict in school board meetings over time. The left figure shows the average number of words in our expanded conflict dictionary used per meeting in monthly bins. This figure shows marked increases in conflict during intuitive periods. Peaks occur in 2016 during debates about state “bathroom bills,” in 2020 during the height of conflict around COVID-related school openings and closures, and 2021 during the debates over critical race theory. Yellow rectangles indicate a typical academic year (September 1st–June 30th, while the white background shows a typical summer. The right figure shows various percentiles (50th, 85th, 90th, 95th, 99th) of the total number of conflict words used across individual meetings in two months bins. The dotted line separates the overall 75th percentile of conflict during our sample period, our “high conflict” threshold.
Our results also show a level-shift in overall school board conflict during 2020 and 2021. When ranking the 25 most conflictual months in school board politics since 2015, 21 of the top 25 have occurred since January 2020. Two of these exceptions occur in early 2018, which overlaps with a wave of unprecedented teacher strikes in 11 states including Oklahoma, Arizona, West Virginia, and Colorado. This overall increase in conflict seems to be declining back to baseline levels for many districts, though we show this average masks large heterogeneity in districts in the next section. We take these temporal patterns as additional evidence of the validity of our measurement of conflict. While conflict varies across time, the peaks in the time series correspond with the times when we would expect to see elevated conflict.
Results: Which Places Experience Conflict?
The 2010s and early 2020s saw a wide range of conflictual issues in school board politics, including the anti-CRT movement, gender identity policy, book bans, and responses to COVID-19 like school reopenings, masking policy, and vaccine requirements (Chatfield 2025; Farris and Mohamed 2022; Pollock et al. 2022; Shah, Weinschenk, and Yiannias 2024). These conflicts are related to the cultural debates in local politics highlighted by Sharp (1996) and others (Chou and Busbridge 2020; Chou, Busbridge, and Rutledge-Prior 2025). Existing scholarship and media coverage suggest that many school districts routinely experience conflict. Yet, scholars regularly demonstrate very low levels of public engagement with school boards (Ford and Ihrke 2020); as one summary noted “One finding endorsed by all is the ineffectiveness, and often alienating effect, of communication and involvement” in public hearings like school board meetings (Kasperson 1986). We offer the first opportunity to understand the frequency and topics of conflict in school boards at scale.
How common is conflict across school districts and time? In the right subplot of Figure 5, we plot our meeting-level Conflict Score averaged in two-month bins separately by the 50th (darker line), 85th, 90th, 95th, and 99th (lighter line) percentiles for that time period. We also provide a line at the overall 75th percentile (eight terms), as that is the default threshold for “high conflict” meetings that we use.
While much attention was paid to increased conflict in 2020 over COVID and 2021 over CRT, our results suggest that—in some respects—these time periods were not all that different from other points in our time trend. Across the last decade, local conflict was largely driven by a small number of high-intensity school districts. Separating the conflict by percentiles shows that a small number of our sample districts experienced large increases in conflict in the early 2020s. For example, during the most intense periods of the COVID and CRT debates of 2020 and 2021, the 99th percentile of our conflict measure nearly doubled, but the conflict in our median meeting barely changed (see the 50th percentile line near the bottom of Figure 5). Together, we find increases in conflict intensity after 2020, but a relatively consistent baseline of low conflict in most meetings.
We also assess the distribution of conflict across places by visualizing the share of meetings over the “High Conflict” threshold in each school district. 11 Figure 6 shows that this place-level measure of conflict is right-skewed: only 6% of districts never experience any high conflict meetings, but a majority of districts experience high conflict in less than a quarter of their meetings. However, a long “right-tail” of school districts in our sample experience high conflict in half or more of their meetings. Fairfax County, Virginia, one of the highest conflict districts in our sample, has had conflictual school board discussions about CRT, gender-affirming policies, foreign investment, COVID policy, and more. For example, a 2023 Washington Post article on the district noted that several new board members were sworn in on banned books to demonstrate their stance on the controversial issue (Elwood 2023).
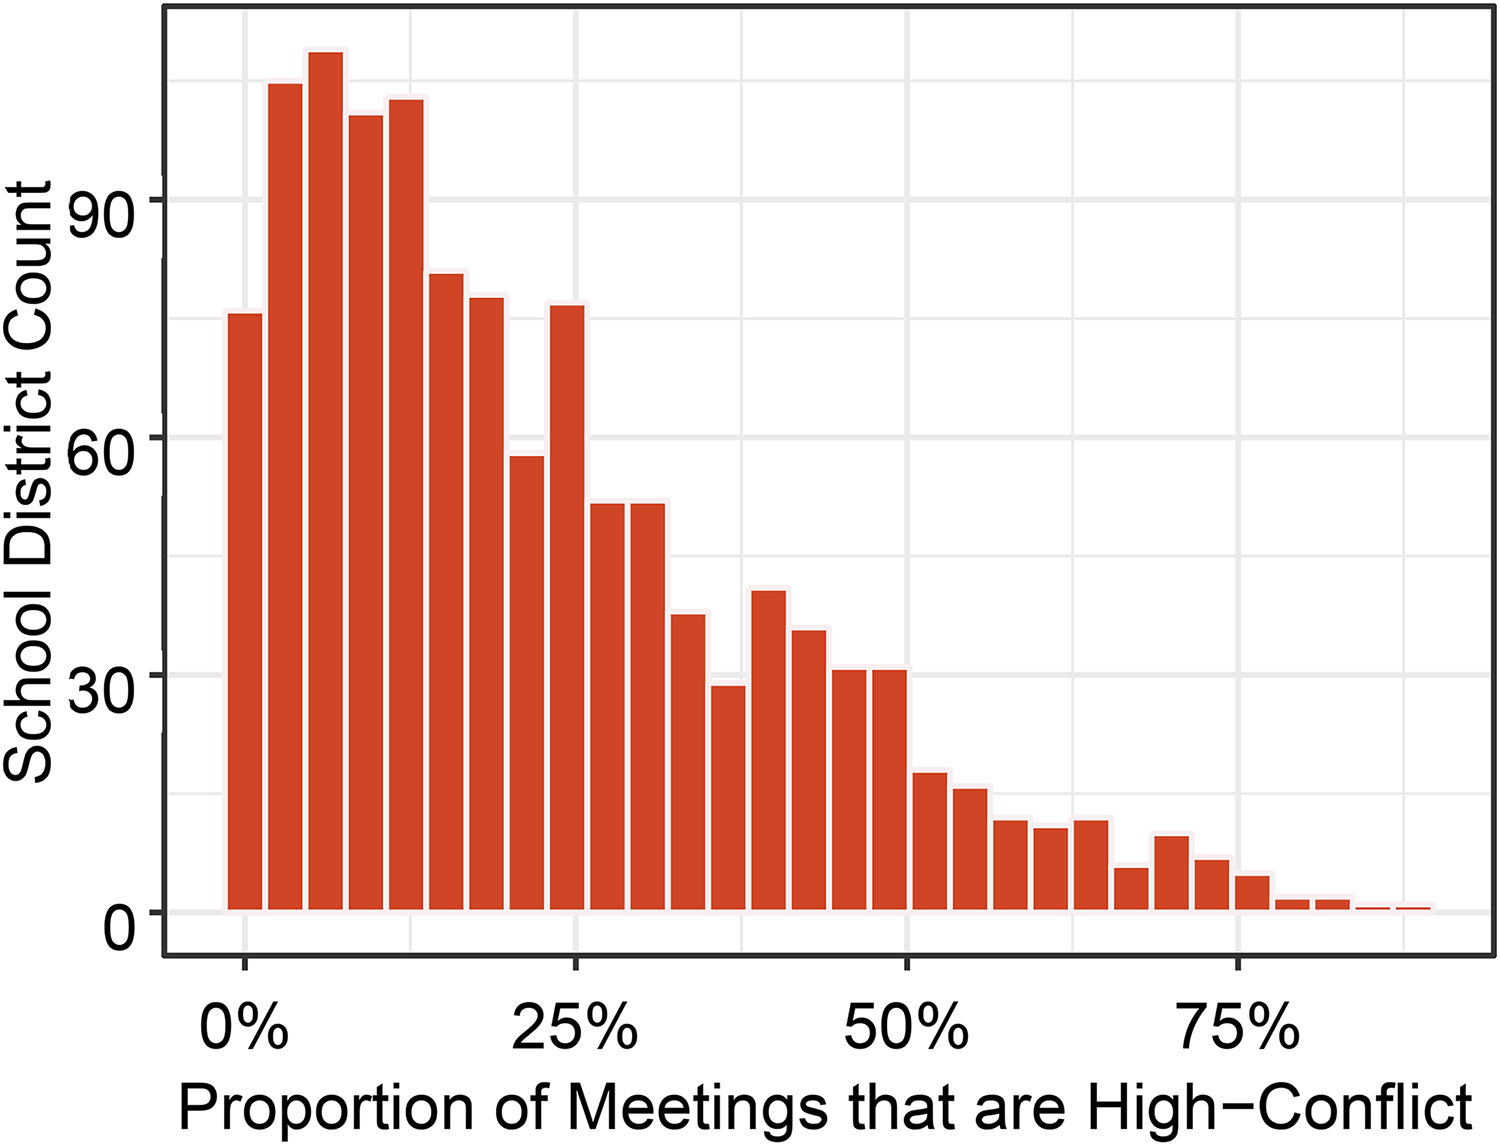
Districts vary in frequency of high-conflict meetings. The histogram shows the proportion of meetings for each district with conflict scores above the 75th percentile. A few districts have no conflict, most occasionally have some conflictual meetings, and a long left right tail of districts regularly have highly contentious meetings.
The distribution of high conflict meetings within districts suggests that conflict should be more likely to appear in districts with particular characteristics. We might expect, for example, that student population or per-pupil expenditures are positively correlated with conflict, as larger student enrollments and more spending could mean more opportunities for conflict due to a broader range of views and issues to discuss (e.g., Dahl and Tufte 1973; Post and Kuipers 2023). Ford and Ihrke (2017, 110) survey board members and find that more urban districts experience more conflict, which they attribute to diversity of viewpoints, conflict around how to solve “persistent racial and socioeconomic gaps,” greater media scrutiny, and more organized interests. The level of state oversight of urban areas is also higher, which may drive conflict (Burns 2003; Lay and Bauman 2019; Morel 2018). Small communities may also stifle conflict because of the intertwined nature of social networks (Mansbridge 1983). The centrality of race in urban political conflicts (Kitchens 2021; Trounstine 2016, 2018) also suggests that conflict may be more likely to occur in less White locations, although much of the popular narrative around conflict in school board members identifies White parents as the source of disagreements. School board conflict may partially spill over from broader political conflict in the community (Shah, Weinschenk, and Yiannias 2024), and thus relate to the level of political competition and political preferences of the community. We evaluate the degree to which conflict occurs across these covariates, finding high levels of correlation with suburban districts, per pupil expenditures, and democratic vote share, but especially with the length of the meeting; these results are visualized in SI Section 7.2.
We assess the correlates of conflict using OLS and Poisson regression models to predict two different meeting-level dependent variables: (1) we use the Conflict Score to represent the overall amount of conflict in a given meeting, and (2) we use words from Table 2 to build a Cultural Conflict measure from a dictionary related to cultural conflict issues, including diversity, racism, gender identity, and LGBT+ policy (see SI Section 7.1 for the exact dictionary). Further, SI Section 7.2 shows several unadjusted descriptive statistics for our overall conflict measure across a series of binned covariates like enrollment, per-pupil expenditures, and the proportion of students who are White.
We include covariates in our models that capture characteristics of the school district (logged student population, the proportion of students who are non-White, the change in non-White student proportion between 2011 and 2021, and 2018 per-pupil expenditures), the geographic location (a categorical variable for urbanicity created by the National Center for Education Statistics), and politics (the 2020 presidential democratic vote share, and an indicator for whether the 2020 presidential election was competitive). Finally, we control for the logged duration of the meeting in seconds, and include fixed effects for year and state. We include propensity score stabilization weights and cluster standard errors at the district level (see SI Section 7.1).
Conflict generally and cultural conflict, in particular, are more likely in large, liberal, White districts, during longer meetings. In Table 3, we present results from two Poisson regression models (OLS results are available in SI Table 8, and results from length-normalized measures of conflict are shown in SI Table 9). As expected, a district's student enrollment is positively associated with conflict and cultural conflict across all models.
Estimating Conflict with District and Meeting Characteristics.
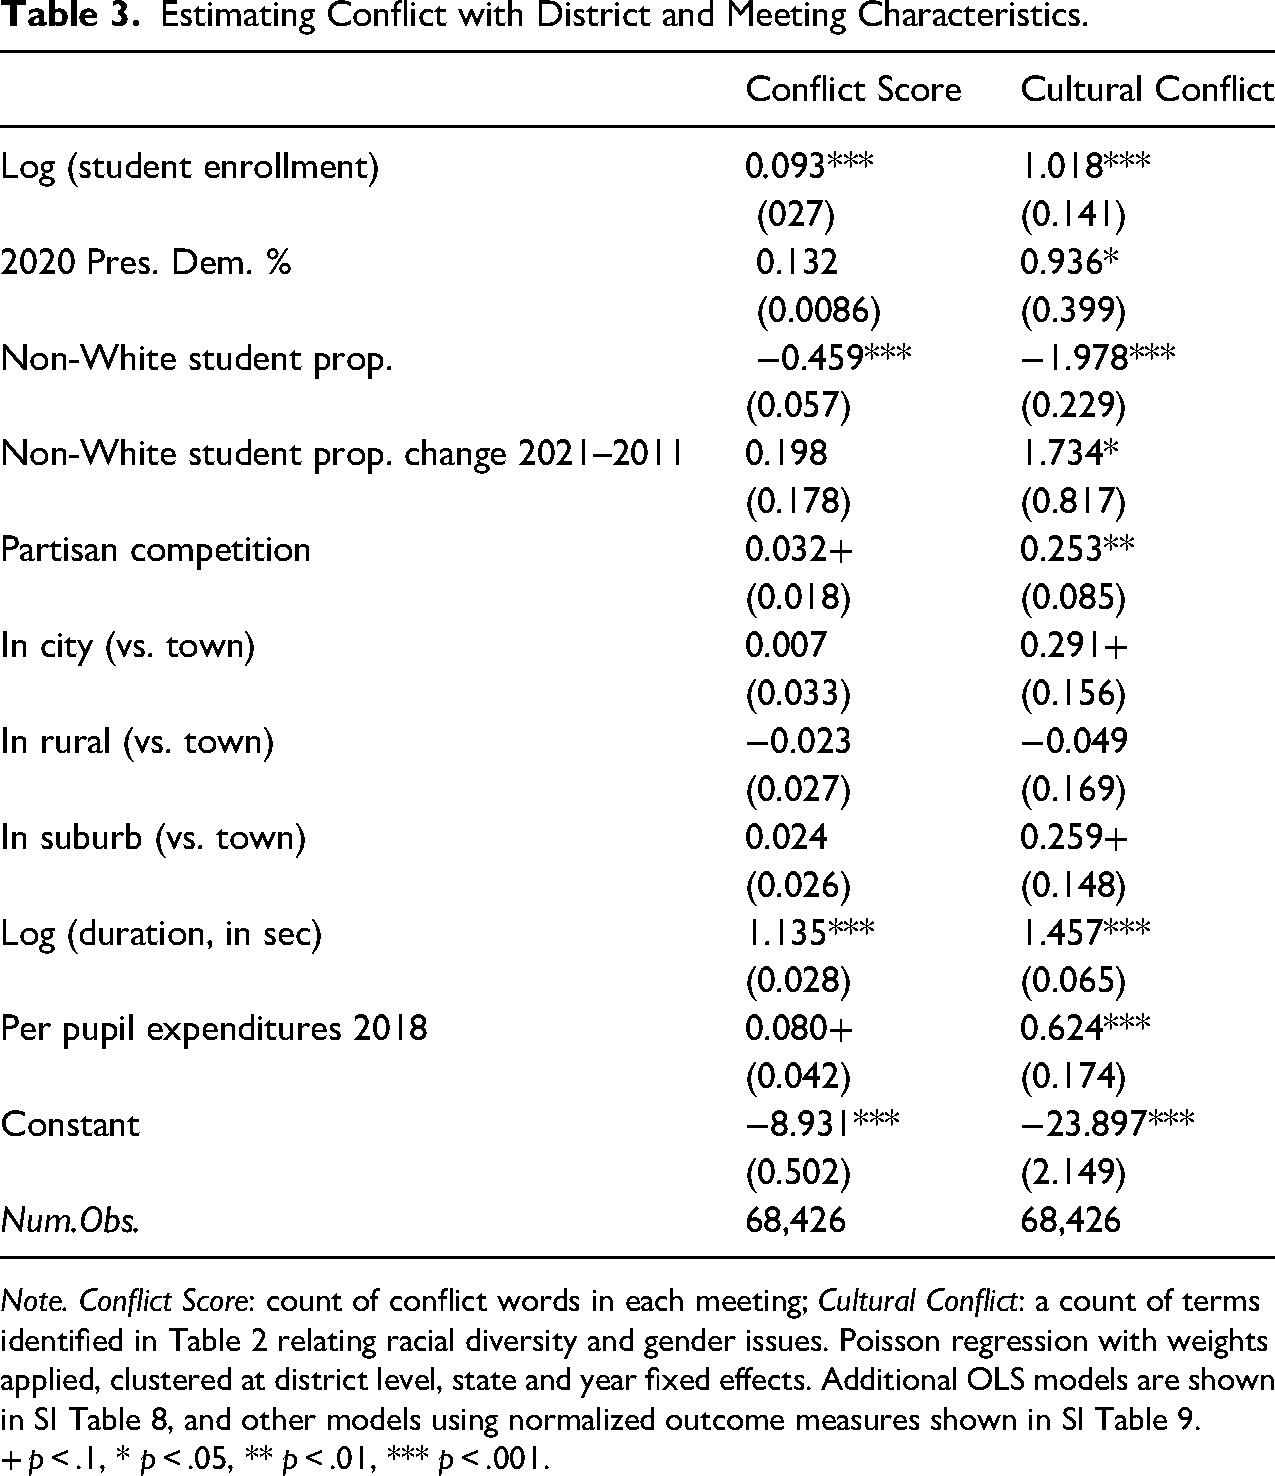
Note. Conflict Score: count of conflict words in each meeting; Cultural Conflict: a count of terms identified in Table 2 relating racial diversity and gender issues. Poisson regression with weights applied, clustered at district level, state and year fixed effects. Additional OLS models are shown in SI Table 8, and other models using normalized outcome measures shown in SI Table 9.
+ p < .1, * p < .05, ** p < .01, *** p < .001.
Larger districts that serve more students, families, and staff experience much more conflict overall; see the left subplot of Figure 7 for the substantive effects. We also find a positive relationship between per pupil spending and conflict, suggesting that more resourced districts experience more conflict, which may be driven by conflict over resources or the correlation between political engagement and resources. Similarly, meetings in more liberal areas and in districts with higher proportions of White students are all also associated with more conflict overall and more cultural conflict (see the right subplot of Figure 7). The relationship between White students and conflict is particularly interesting and important, given the stereotypes about race and emotions (Francis and Wright-Rigueur 2021; Phoenix 2019).
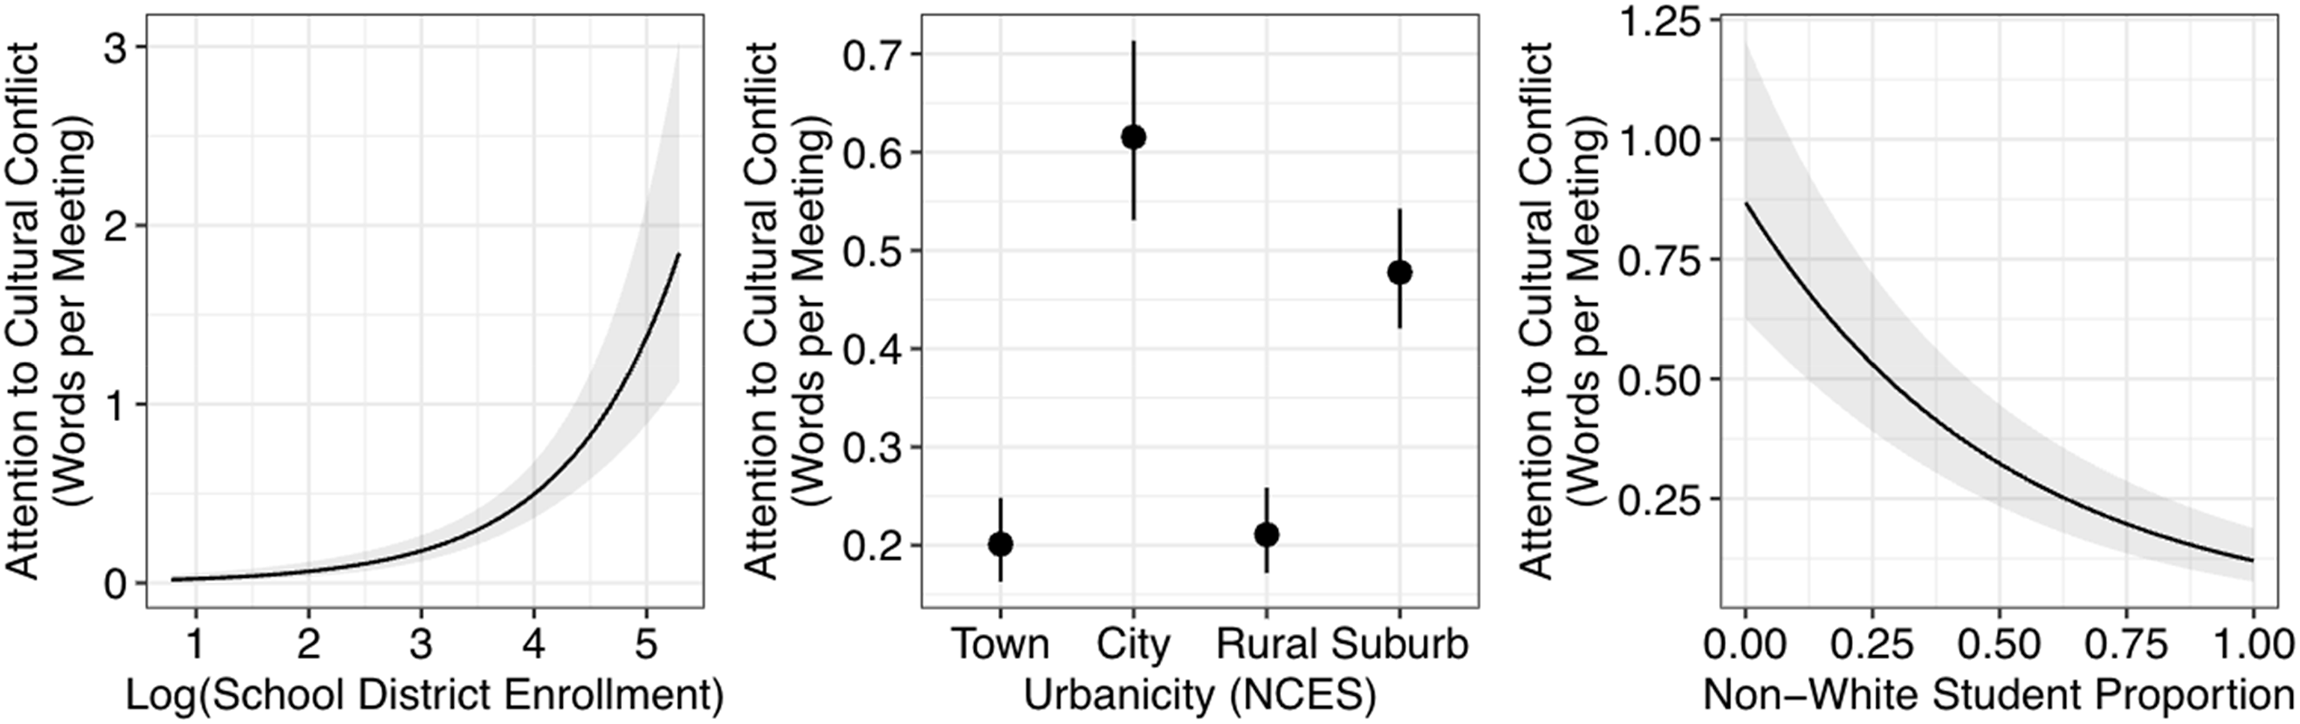
Predicting discussions of cultural conflict. Marginal effects graphs predicting our Cultural Conflict outcome, which measures discussions of race and racism, gender identity, and LGBT+ issues using keywords from Table 3 (see SI Section 7.1). Urbanicity predictions are averaged by group value. Full results reported in Model 2 in Table 3.
We find some additional evidence that cultural conflict is most likely to appear in cities and suburbs, as compared to smaller towns and rural areas (see the middle subplot of Figure 7, though statistical significance depends on model specification, see SI Tables 8 and 9). The estimated relationship between urbanicity and cultural conflict is substantively large (and present in unadjusted estimates, see SI Table 13): the average meeting in our sample has only a Cultural Conflict measure of 0.934, and our model estimates that moving from a town to a suburb or city increases cultural conflict by nearly 30% (p < .001). Intuitively, we find a strong relationship between meeting length and both conflict measures (as extended conflict between community members or officials is often what leads meetings to be unusually long).
Conclusion and Extensions
We introduce a new dataset—DistrictView—and a new approach to identifying conflict in local politics. Our data and methodology offer the opportunity to examine the content of local education policy-making, how and where political conflict emerges, and the consequences of conflict on local democracy at a larger scale than ever before. We also provide evidence that helps distinguish between two contrasting views of local education politics. Are contemporary school boards overrun with widespread conflict over nationalized issues, or are most meetings characterized by low engagement and procedural discussions?
Conflict is a regular occurrence in some school board meetings. Severe conflict tends to be concentrated in a small number of school districts. Yet, a marked increase in conflict occurred in the post-2020 period, driven by debates over COVID and cultural issues. However, this shift was not universal: despite intense conflict in some districts, many others experienced largely procedural, low-intensity meetings. The most contentious conflicts, including those over cultural issues, are most prevalent in long meetings of large, Whiter suburban and urban school districts. The “national” nature of these conflicts aligns with broader evaluations of the nationalization of local politics across elections and offices (Hopkins 2018; Williamson and Sievert 2024).
This increase in nationalized conflict does not mean that conflict over highly localized issues does not occur. School board meetings feature disagreement over issues as distinct as firing football coaches, defunding ROTC programs, and idiosyncratic personal disputes. Our approach to identifying these conflicts, agnostic to issue, allows researchers to further investigate the causes and consequences of these patterns alone or in combination with methods like process tracing, interviews, or advanced statistical methods. In particular, researchers could use our data and approach to evaluate the temporal nature of conflict, the longevity of it, and the ways that national conflict might beget local conflict and vice versa. For example, in additional analyses we find that conflict predicts future conflict at meetings for more than a year.
Collectively, our results suggest that issues of national concern are often brought into school board meetings, but the story is not simply one of national “puppet masters” directing angry parents into their children's school boards. Scholars of local politics in the United States have long debated what the “core” conflicts are about in the arena (Hajnal and Trounstine 2014). Do conflicts around race, gender, or class drive local politics (Einstein, Palmer, and Glick 2019; Trounstine 2016, 2018)? Or do ideology and partisanship dominate local politics (de Benedictis-Kessner and Warshaw 2016)? We find a complex pattern of conflict covering many places and many issues. Examinations of high conflict meetings reveals a diversity in views represented on issues of race, gender, class, ideology, and partisanship. Contemporary conflict in local education politics is not defined solely by parents representing one direction of a view before the school board, but individuals from wide ranging positions.
We find that school boards in communities with more White students and those who spend more money per student experience more conflict. Both of these findings could provide an opportunity for scholars interested in the role of funding and taxation or race in local politics (Abott and Magazinnik 2020; Benjamin 2017b). Future research might consider how these factors interact, with some groups better able to express and experience conflict (Phoenix 2019) and how money and race might either accelerate or limit the occurrence, topic, or longevity of conflict. Scholars could also consider how board resources and capacity like staff, board member salaries, and campaign contributions predict conflict (Reckhow et al. 2017). Further, the election of minority school board members (Shah 2019) or debates over race-conscious student assignment policies (Castro et al. 2024; Simko 2024) could introduce conflict. We hope future scholars consider investigating these and related questions.
Further, we hope that a wide range of scholars interested in questions of politics and policy-making will find the data and methods contained here to be useful. Our measure of conflict is flexible and can be applied to a broad set of corpora, including other sets of local, state, or national text data (Barari and Simko 2023; Muller and Proksch 2024; Vannoni, Ash, and Morelli 2021). Further, scholars could use the corresponding video and audio files from DistrictView meetings to answer any number of substantive questions (Barari and Simko 2024; Boussalis et al. 2021). We have argued that one key advantage of our issue-agnostic approach is that it allows scholars to identify how conflict appears (or does not appear) around specific topics of interest. Scholars interested in the dynamics of particular issues, such as school safety or curricular debates, can use our data and approach to identify when, where, and how such issues are discussed. Further, our approach to building DistrictView relies entirely on public data, and can be adapted by scholars of local government and conflict outside the United States.
Our work also provides a starting point for those interested in the role of deliberation and debate in shaping experiences with the democratic state (e.g., Collins 2021b). Research suggests that conflict in governing bodies generally and school boards specifically is associated with negative outcomes (Ford and Ihrke 2017). Conflict can also influence institutional procedures, such as the deployment of tools of agenda control (Holman and Simko 2025). Future work might use our data to examine the relationship between conflict and school district outcomes like school performance, school board turnover, or the morale of school board members and staff.
At the same time, however, the practice of local conflict is a powerful motivating force to get people involved in political life (Collins 2021a; Nuamah and Ogorzalek 2021). While local conflicts can be unrepresentative or even exclusionary (e.g., Einstein, Glick, and Palmer 2019), residents can also respond to local events by organizing neighbors (Scott, Michelson, and DeMora 2022) into groups like tenant organizations (Michener 2020), immigrant hometown associations (Ramakrishnan and Viramontes 2010), or against localized changes like school closures (Nuamah 2022). Contentious school board meetings may also teach parents, students, and community members about the tools of political engagement (Collins 2018). Scholars of democratic theory have long asserted that free and reasoned consent of the public is a necessary condition for the thriving of democracy (Mansbridge 1983). This might be particularly true for communities who have been marginalized; as Michener (2020) shows, participation in collective action helps “subjugated communities [have a] pivotal influence over urban policy.” Future research might explore the ways that conflict in school boards is associated with other forms of democratic engagement in communities, including protests aimed at racial justice and accountability for police violence (Hoang and Benjamin 2024) or participation in community organizations (Anzia 2019; Benjamin 2017a). We hope DistrictView will be useful in this future work.
Supplemental Material
sj-pdf-1-uar-10.1177_10780874251355893 - Supplemental material for Measuring Conflict in Local Politics
Supplemental material, sj-pdf-1-uar-10.1177_10780874251355893 for Measuring Conflict in Local Politics by Mirya Holman, Rebecca Johnson and Tyler Simko in Urban Affairs Review
Footnotes
Declaration of Conflicting Interests
The authors declared no potential conflicts of interest with respect to the research, authorship, and/or publication of this article.
Funding
The authors disclosed receipt of the following financial support for the research, authorship, and/or publication of this article: This work was supported by the NAEd/Spencer Postdoctoral Fellowship, McCourt School of Public Policy's Tech & Public Policy Program.
Supplemental Material
Supplemental material for this article is available online.
Notes
Author Biographies
References
Supplementary Material
Please find the following supplemental material available below.
For Open Access articles published under a Creative Commons License, all supplemental material carries the same license as the article it is associated with.
For non-Open Access articles published, all supplemental material carries a non-exclusive license, and permission requests for re-use of supplemental material or any part of supplemental material shall be sent directly to the copyright owner as specified in the copyright notice associated with the article.