
Abstract
Obesity continues to be a growing epidemic in the United States. Guidelines published by American Society of Clinical Oncology in 2012 recommend dosing chemotherapy using actual body weight. However, the guidelines do not provide guidance for patients with hematologic malignancies. The objective of this study was to evaluate outcomes in obese patients undergoing induction chemotherapy for acute leukemia versus nonobese patients using actual body weight dosing. This single center retrospective chart review from November 2012 to August 2016 evaluated newly diagnosed leukemia patients who received induction chemotherapy dosed on actual body weight. The primary outcome was rate of complete remission following induction chemotherapy between obese patients versus nonobese patients. Secondary outcomes included time to absolute neutrophil count and platelet recovery, incidence of febrile neutropenia, clinical or microbiological infections, early (0–15 days) and in-hospital mortality, and overall survival at six months. Obese patients had similar rates of complete remission versus nonobese patients with acute myeloid leukemia (60% vs. 61.9%; p = 0.86) and acute lymphoblastic leukemia (87.5% vs. 92.8%; p = 0.31). Obese patients with acute myeloid leukemia were more likely to receive re-induction chemotherapy following 14-day bone marrow biopsy vs. nonobese patients (53.3% vs. 23.2%; p = 0.019). There were no significant differences in secondary outcomes in either group when comparing obese versus nonobese patients. Obese patients have similar rates of complete remission compared to nonobese patients following induction chemotherapy in acute leukemia. Continued research is needed to determine optimal dosing and long-term outcomes in this patient population.
Introduction
Obesity continues to be a growing epidemic in the United States. The most recent numbers demonstrate that 36.5% of the adult population are considered obese, equating to a body mass index (BMI) ≥ 30.0. 1 For most chemotherapy agents, body surface area (BSA) is the standard method used to determine doses. With obese patients having higher BSAs, excessive toxicity is a concern and some clinicians may reduce chemotherapy doses by using an adjusted body weight (AdjBW), ideal body weight (IBW), or a BSA cap at 2 m2.2,3
Several studies have demonstrated that dosing by actual body weight (ABW) does not lead to excessive toxicity. In a study by Meyerhardt et al. dosing by ABW in obese patients with rectal cancer resulted in less Grade III/IV toxicities (70%, 75.4%; p = 0.05) and similar five-year overall survival (OS) rates (62.5%, 65%; p = 0.9) compared to nonobese patients. 4 Georgiadis and colleagues found no significant correlation between increased BMI and increased toxicity when chemotherapy was dosed by ABW in the treatment of small cell lung cancer. 5 Additionally, Colleoni et al. found that breast cancer patients treated with ≥85% of protocol dosing did not have higher rates of toxicity compared to those who received <85% of protocol dosing (p = 0.62). 6
In 2012, the American Society of Clinical Oncology (ASCO) published guidelines recommending use of ABW in overweight and obese patients. 7 However, studies used to support these recommendations excluded patients with hematologic malignancies. The National Comprehensive Cancer Network (NCCN) does not address which dosing weight to use when calculating chemotherapy doses in obese patients with solid tumors or hematologic malignancies. In studies that have looked at dosing in obese patients with leukemia, dosing of obese patients was either not consistent or there was no comparison to nonobese patients in determining rates of remission.8–10
Currently, our institution doses all cytotoxic agents using ABW regardless of the patient’s BMI status and underlying tumor type. Due to scarcity of data, it is unknown whether ABW is the most appropriate dosing weight for obese patients with hematologic malignancies. The purpose of this study was to review the clinical outcomes in obese patients with leukemia receiving induction chemotherapy dosed based on their ABW.
Methods
Study design
This was a single center, retrospective chart review conducted from November 2012 to August 2016 in an 833-bed community teaching hospital. The study was approved by the local Institutional Review Board. Data were collected using an electronic medical record and a pharmacy database.
Patients
Patients included in this study were 18 years of age or older with a confirmed diagnosis of acute myeloid leukemia (AML) or acute lymphoblastic leukemia (ALL). Patients’ height and weight were recorded on admission and weights were taken daily during hospitalization. Patients with AML received induction chemotherapy with seven days of cytarabine (100–200 mg/m2) and three days of an anthracycline (idarubicin 12 mg/m2 or daunorubicin 60 mg/m2). Patients with ALL received induction chemotherapy with hyper-CVAD cycle A (cyclophosphamide 600 mg/m2/day and mesna 600 mg/m2/day on days 1–3, doxorubicin 50 mg/m2 on day 4, vincristine 2 mg on days 4 and 11, and dexamethasone 40 mg on days 1–4 and days 11–14) or augmented hyper-CVAD cycle A (cyclophosphamide 600 mg/m2/day and mesna 600 mg/m2/day on days 1–3, doxorubicin 50 mg/m2 on day 4, vincristine 2 mg on days 1, 8, and 15, dexamethasone 80 mg on days 1–4 and 15–18, and pegasparaginase 2500 units/m2 on day 1). Patients were excluded if they had relapsed/refractory leukemia, acute promyelocytic leukemia (APL), or chronic myelogenous leukemia (CML) in blast crisis. Patients who required dose modifications during induction or were unable to complete full course of treatment were also excluded from the study. Data collected included patients’ age, sex, BMI, BSA, comorbidities, baseline laboratory values, de novo or secondary leukemia, and percent blasts at initial presentation (bone marrow or peripheral if bone marrow unavailable), day 14, and at the time of bone marrow recovery. Cytogenetic and molecular data were collected and used for risk stratification per NCCN guidelines. Obesity in this study was defined as a BMI ≥ 30.
Outcomes
The primary outcome was stated or documented complete remission (CR) or CR with incomplete recovery (CRi) rates after induction chemotherapy. CR was defined as a recovery bone marrow biopsy containing <5% blasts, ANC > 1000 cell/mm3, and platelets >100,000 cell/mcL. CRi was defined as recovery bone marrow biopsy containing <5% blasts but with ANC < 1000 cell/mm3 and/or platelets < 100,000 cell/mcL. Secondary outcomes included time to ANC recovery (ANC > 500 cell/mm3 and > 1000/mm3), time to platelet recovery (platelets >50,000 cell/mcL and >100,000 cell/mcL), incidence of febrile neutropenia, clinical or microbiological infections, OS at six months, early (0–15 days) and in-hospital mortality, and cause of death. Statistical and clinical differences in primary and secondary outcomes comparing obese versus nonobese groups were calculated using descriptive statistics, chi squared, Fisher’s Exact Test, and Student’s t-test.
Results
Baseline characteristics
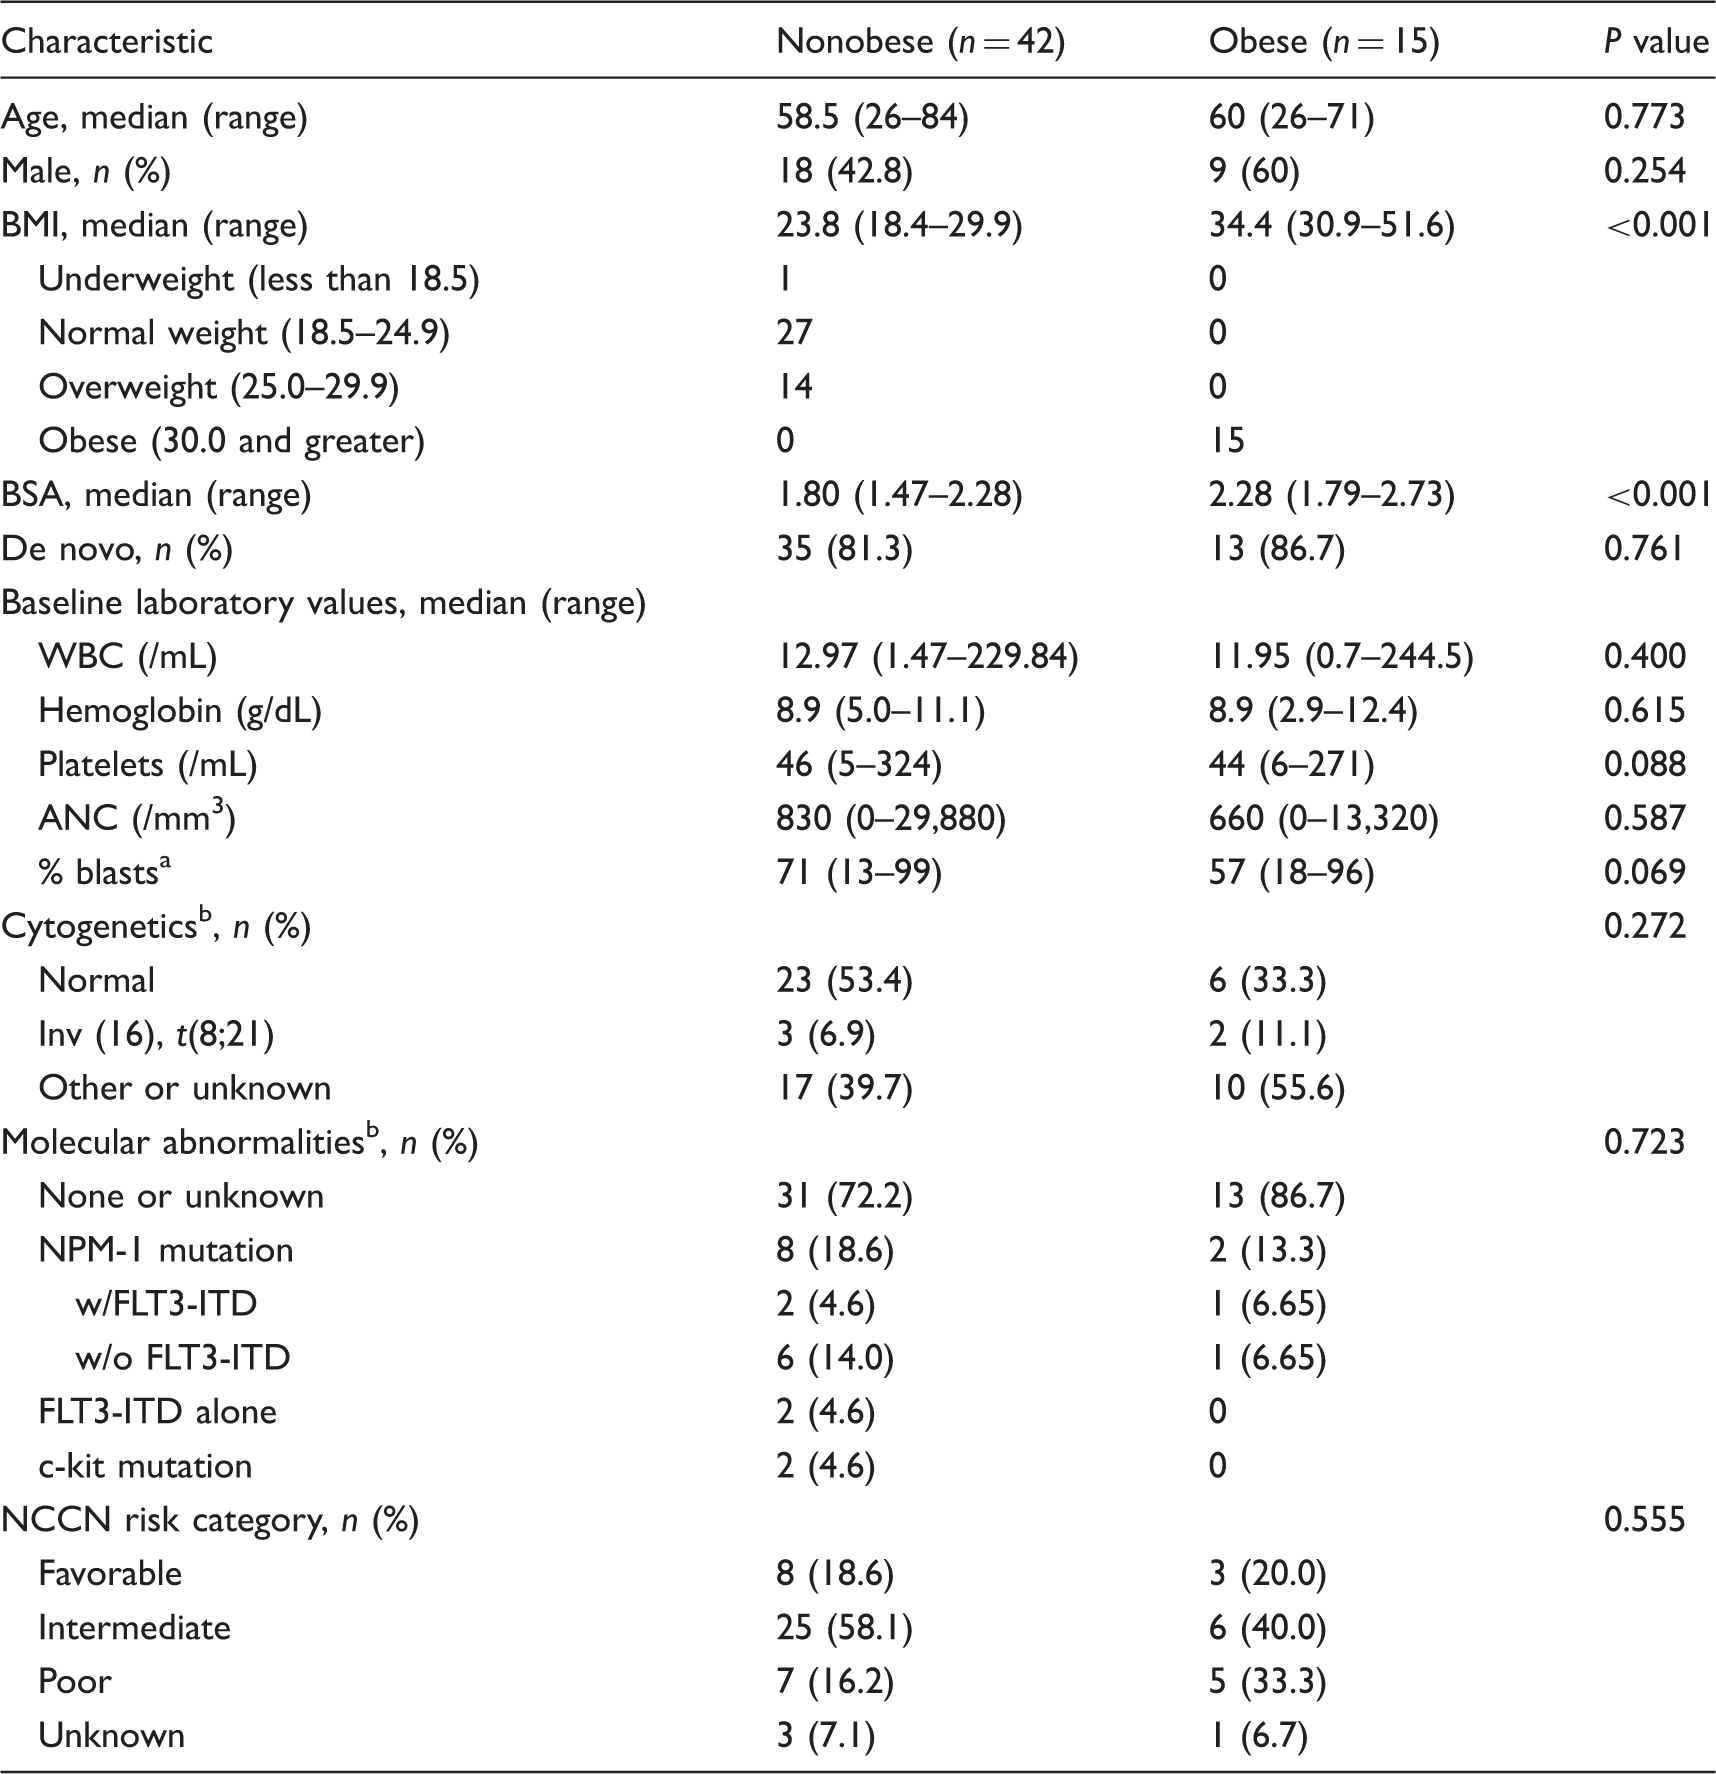
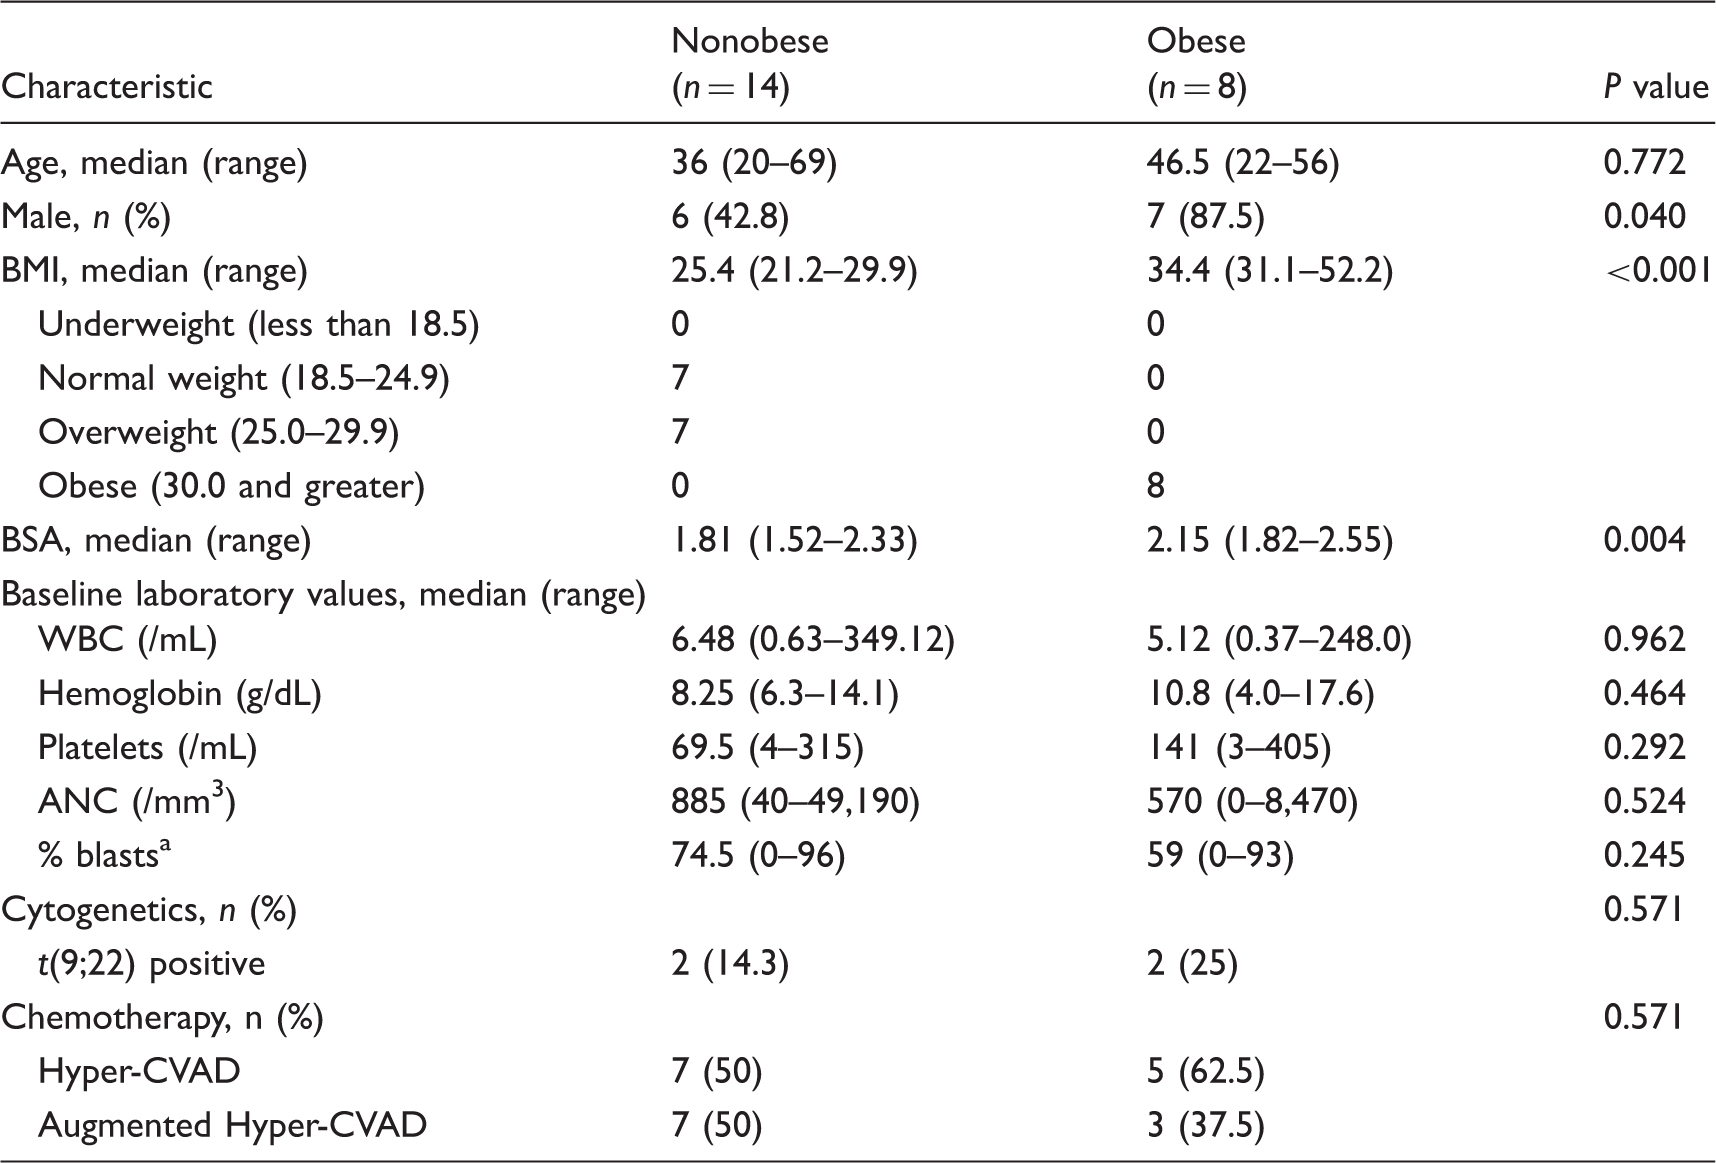
A total of 222 patients were initially screened, of which 57 AML patients and 22 ALL patients were eligible for inclusion (Figure 1). Baseline characteristics are summarized in Tables 1 and 2. The median age of the AML cohort was 59 years, 47.3% were male, and 15 (26.3%) were obese. The obese AML group had a median BSA of 2.28 (range 1.79–2.73) and a BMI of 34.4 (range 30.9–51.6). The median age of the ALL cohort was 39.5 years, 59% were male, and 8 (36.3%) were obese. The obese ALL group had a median BSA of 2.15 (range 1.82–2.55) and a BMI of 34.4 (range 31.1–52.2). In both cohorts, baseline characteristics were similar between obese and nonobese patients. Obese patients presented with lower median initial blast count when compared nonobese patients (AML 57% vs. 71%; ALL 54% vs. 74.5%) but this difference was not statistically significant (AML p = 0.069; ALL p = 0.245). There was no significant difference in NCCN risk category stratification between obese patients and nonobese patients with AML (p = 0.555). Philadelphia chromosome-positive (Ph+) ALL was identified in 25% of obese patients and 14% of nonobese patients (p = 0.531). All AML patients received idarubicin as the anthracycline for induction chemotherapy. Twelve ALL patients received hyper-CVAD, while 10 received augmented hyper-CVAD for induction therapy. There was no significant difference in percentage of ALL obese patients who received augmented hyper-CVAD therapy compared with nonobese patients who received the same therapy (nonobese (37.5%, 50%; p = 0.571).
Inclusion/exclusion criteria for study. Baseline characteristics for acute myeloid leukemia (AML) patients. BMI: body mass index; BSA: body surface area; WBC: white blood cell; ANC: absolute neutrophil count; NCCN: National Comprehensive Cancer Network. Blasts were recorded from peripheral blood in those where initial bone marrow biopsy was unavailable. Patients may have >1 abnormality. Baseline characteristics for acute lymphoblastic leukemia (ALL) patients. BMI: body mass index; BSA: body surface area; WBC: white blood cell; ANC: absolute neutrophil count. Blasts were recorded from peripheral blood in those where initial bone marrow biopsy was unavailable.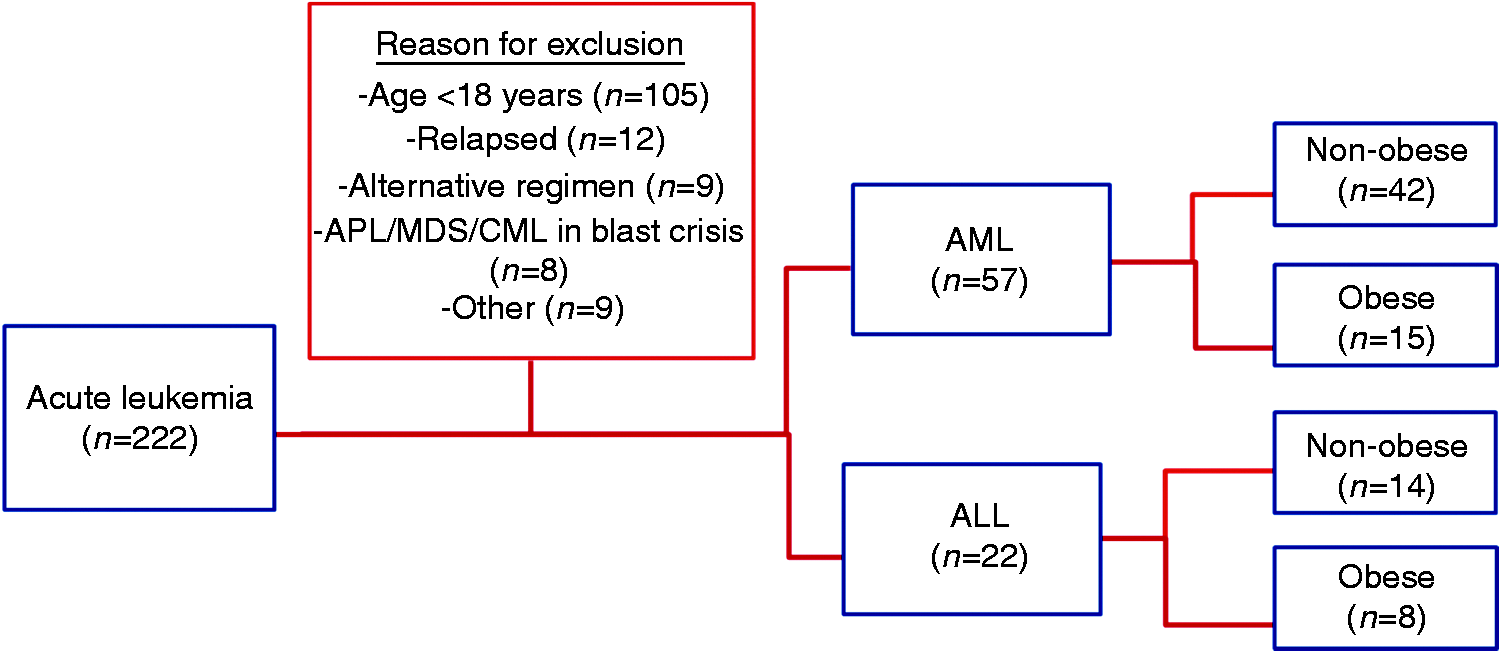
AML outcomes
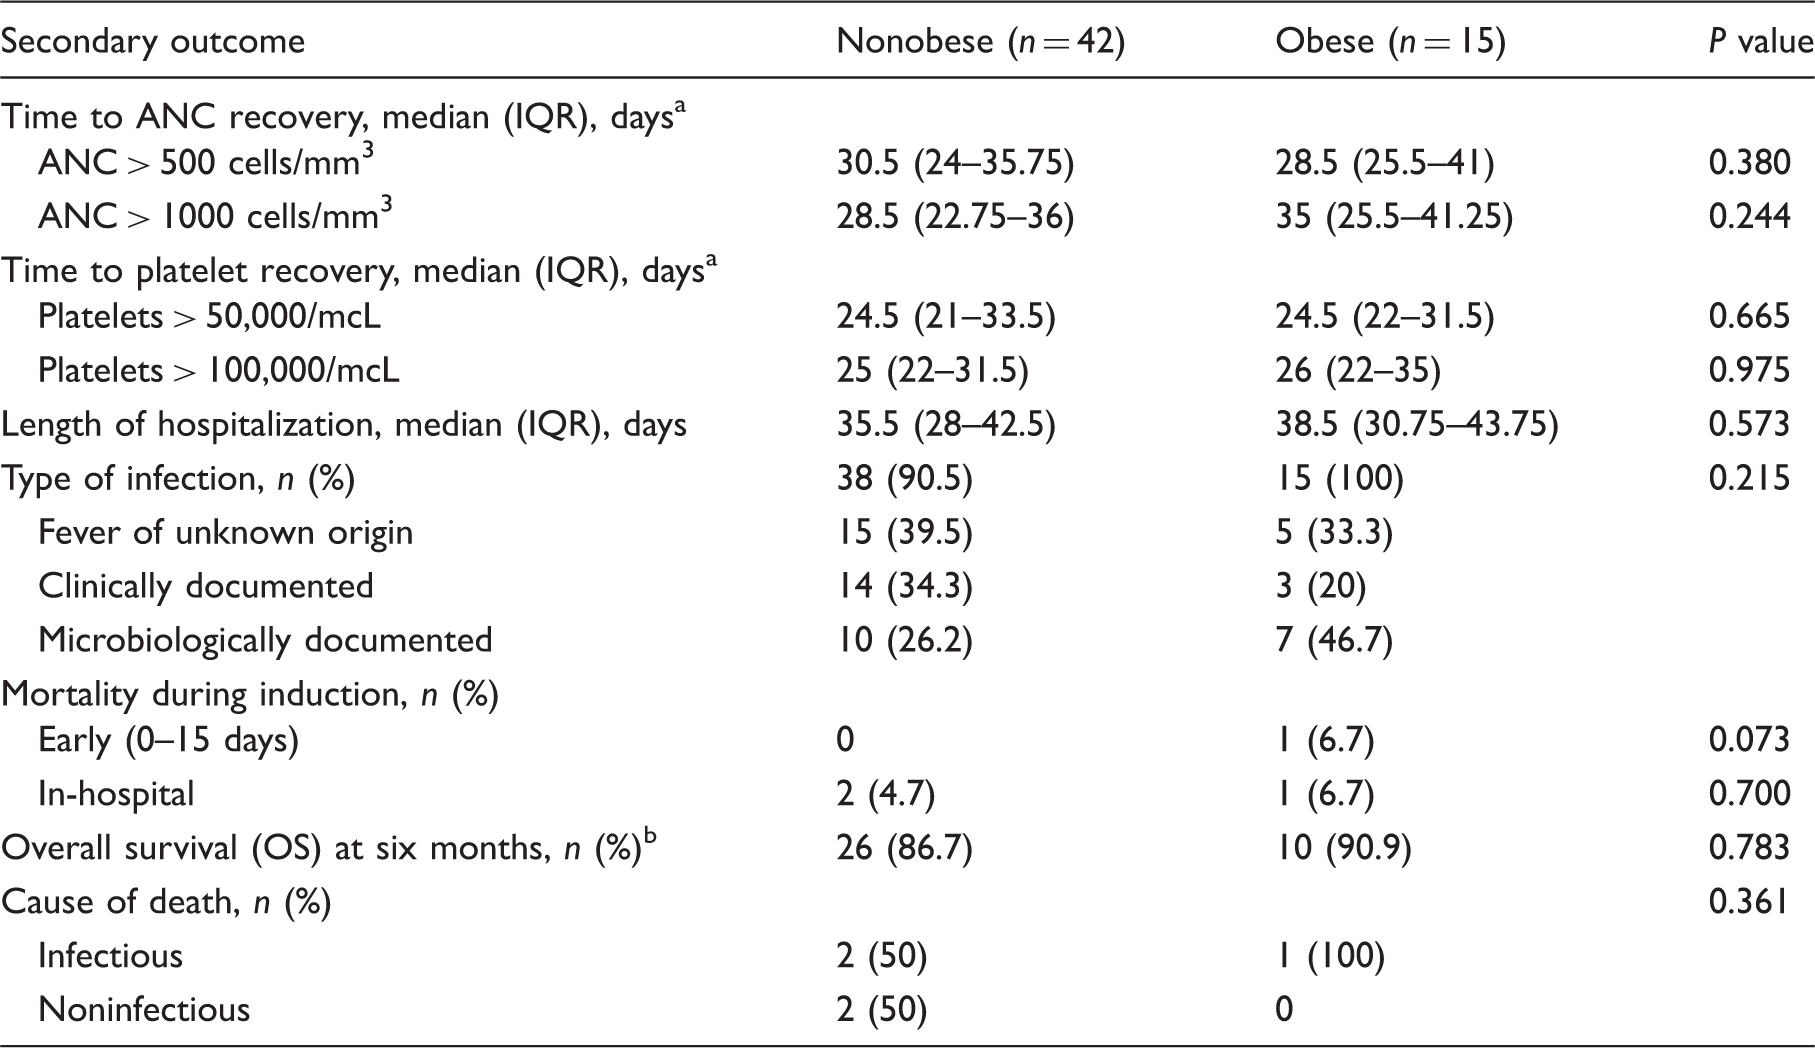
The obese group achieved similar rates of CR following induction chemotherapy compared to the nonobese group (60.0%, 61.9%; p = 0.861) (Figure 2). A significantly higher percentage of obese patients required re-induction chemotherapy after day 14 bone marrow biopsy (53.3%, 26.2%; p = 0.019). Median time to ANC recovery above 500 cells/mm3 was 28.5 days in the nonobese group and 30.5 days in the obese group (p = 0.380). Obese patients took longer to reach an ANC of 1000 cells/mm3 or higher (35 days vs. 28.5 days), but the difference was not statistically significant (p = 0.244). Median time to achieve platelets >50,000/mcL was 24.5 days for both groups (p = 0.665). Median recovery time to platelets > 100,000/mcL was 26 days for obese patients and 25 days for nonobese patients (p = 0.975). Length of hospitalization did not differ between the two groups. (38.5 days, 35.5 days; p = 0.573). All but four patients had an episode of febrile neutropenia during the course of induction chemotherapy. A higher incidence of microbiologically documented infections occurred in the obese group (46.7% vs. 26.2%) but this was not statistically significant (p = 0.215). There were three deaths during induction therapy, one obese patient (6.7%) who died from septic shock and two nonobese patients (4.7%) who died from septic shock and cardiac arrest. At six months, both obese and nonobese patients had similar OS (90.9%, 86.7%; p = 0.783) (Table 3). A regression analysis comparing primary and secondary outcomes to BSA and BMI yielded no statistically significant results.
Rates of complete remission (CR) in AML following induction chemotherapy. *<5% blasts, ANC <1000/mm3, or platelets <100,000/mcL. Secondary outcomes in acute myeloid leukemia (AML) patients. ANC: absolute neutrophil count; IQR= interquartile range. Assessed in patients who achieved recovery point. Assessed in 30 nonobese patients and 11 obese patients.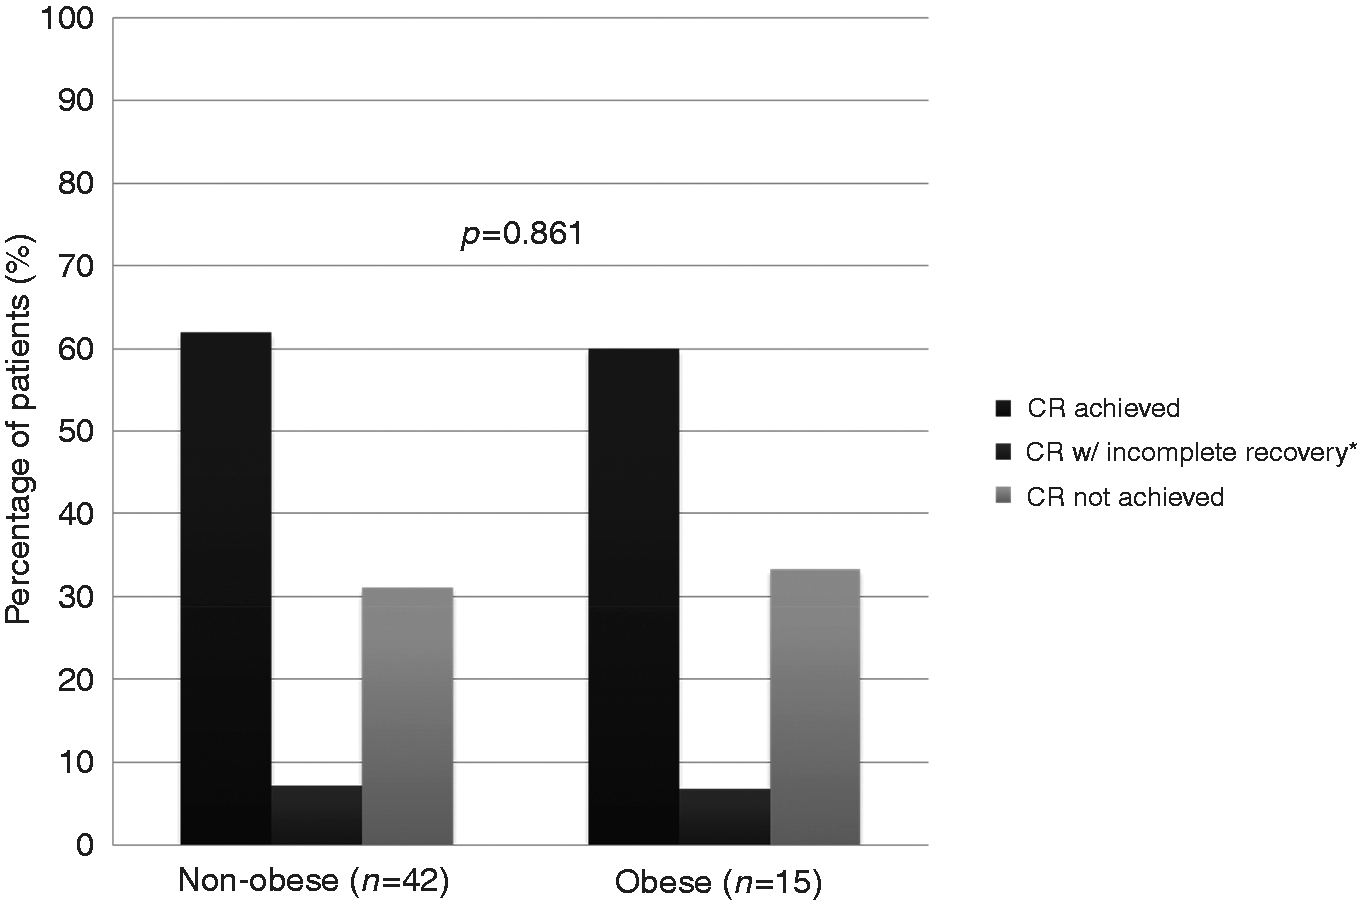
ALL outcomes
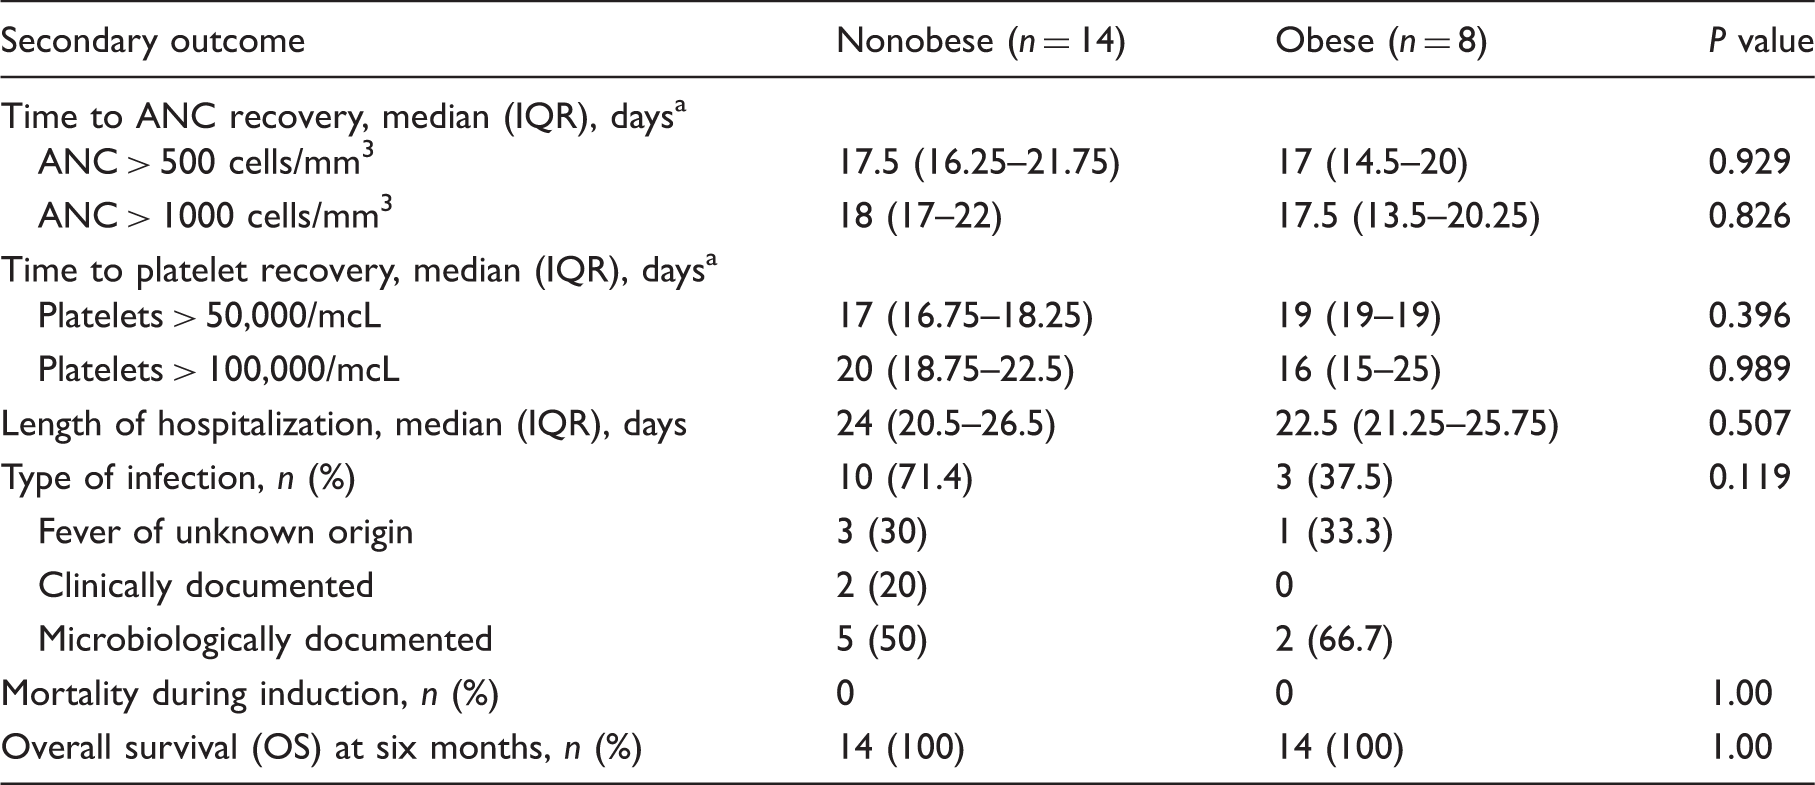
The obese group achieved similar rates of CR following induction chemotherapy when compared to the nonobese group (87.5%, 92.8%; p = 0.311) (Figure 3). Median time to ANC above 500 cells/mm3 was 17.5 days in nonobese patients and 17 days in obese patients (p = 0.929). Median time to ANC > 1000 cells/mm3 did not differ between the two groups (p = 0.826). Median days to platelet recovery >50,000/mcL for nonobese and obese patients were 17 days 19 days, respectively (p = 0.396). Median recovery time to platelets above 100,000/mcL was 16 days for obese patients and 20 days for nonobese patients (p = 0.989). The obese patients experienced a similar length of hospitalization compared to nonobese patients (22.5 days, 24 days; p = 0.507). The obese patients experienced a lower incidence of febrile neutropenia (37.5%, 71.4%) but the difference was statistically significant (p = 0.119). A slightly higher incidence of microbiologically documented infections occurred in the obese group (66.7% vs. 50%). There were no deaths in either group during induction, and all patients were alive at six months (Table 4). A regression analysis comparing primary and secondary outcomes to BSA and BMI yielded no statistically significant results.
Rates of complete remission (CR) in ALL following induction chemotherapy. *<5% blasts, ANC <1000/mm3, or platelets <100,000/mcL. Secondary outcomes in acute lymphoblastic leukemia (ALL) patients. ANC: absolute neutrophil count; IQR= interquartile range. Assessed in patients who achieved recovery point.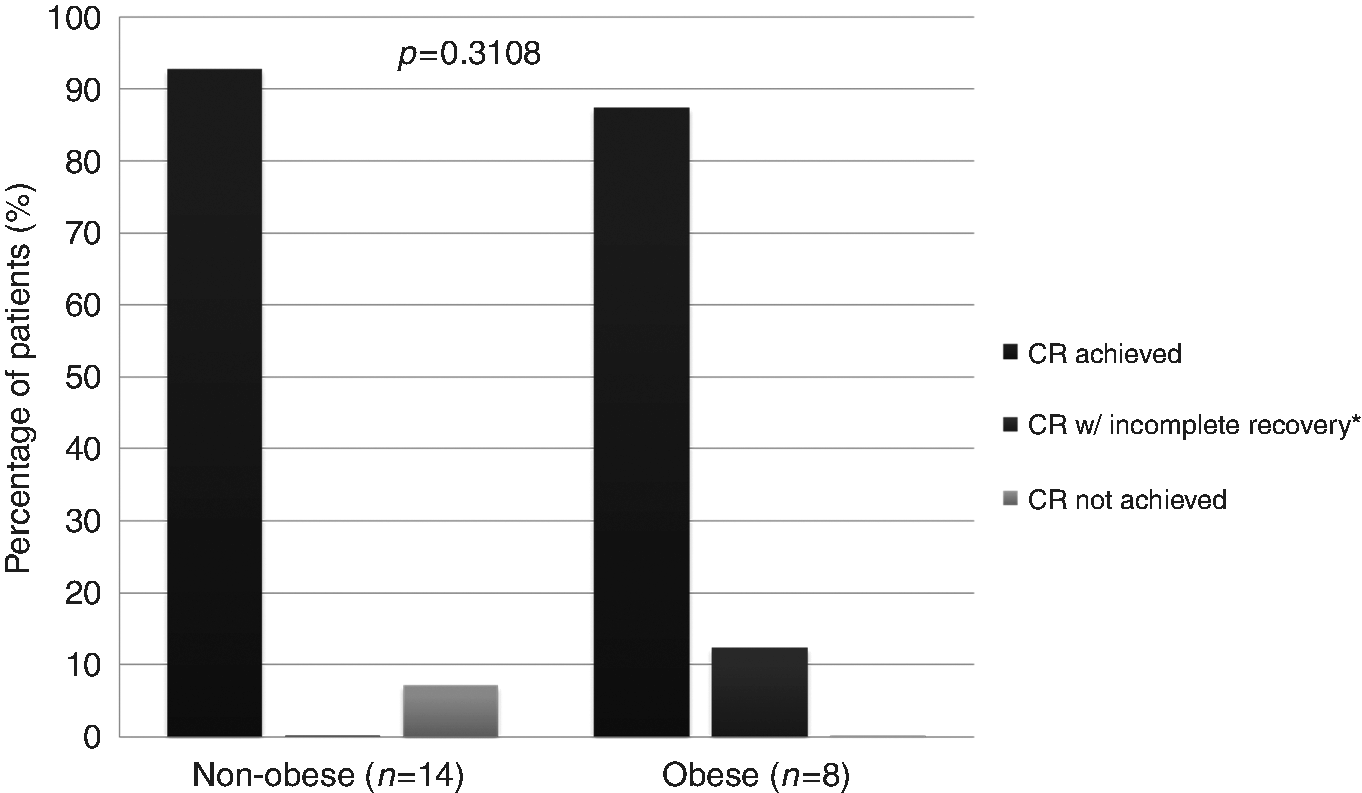
Discussion
Most cytotoxic drugs are dosed based on BSA. However, BSA does not take into account variations such as proportion of body fat and differences in hepatic and renal function. Because of the increased dosing due to higher BSA in obese patients, some clinicians use IBW or AdjBW over concerns for excessive toxicities. A survey by Field and colleagues demonstrated that only 6.1% of respondents dosed chemotherapy based on ABW with 50% of respondents capping the BSA at 2m2. 2 Several studies have demonstrated that dose-reducing chemotherapy in obese patients leads to poorer outcomes. In a study by Rosner et al., obese patients with Stage II breast cancer who had their chemotherapy doses calculated based on ABW had a lower rate of failure when compared to patients who were dosed based on AdjBW or IBW (0.73; 95% confidence interval [CI] 0.53–1.00). 11 Lin et al. retrospectively reviewed 63 AML patients receiving induction chemotherapy, in which 21 were considered obese (≥130% of IBW). Of the 21 patients, 7 received dose reductions for induction therapy, using AdjBW to calculate BSA. The CR rates for obese patients who received a dose reduction were lower compared to obese patients who did not receive a dose reduction (66.7%, 85.7%). 8
Our study demonstrated that obese patients with acute leukemia treated with standard regimens dosed based on ABW achieved similar rates of CR compared with nonobese patients. These findings were similar to those reported by Wenzell and colleagues who found that CR rates among obese and normal weight patients were similar when chemotherapy was dosed based on ABW. 12 Unlike the Wenzell study, a greater proportion of our obese AML patients required re-induction chemotherapy after day 14 bone marrow biopsy. No precipitating factor such as a higher initial blast count or poor risk category could explain the disparity. Despite the need for additional chemotherapy, obese patients achieved similar rates of CR at the end of the induction phase.
Days to ANC and platelet recovery in obese AML patients were similar to that of nonobese patients. There were no statistically significant differences in rates of febrile neutropenia, type of infections induction mortality, and OS at six months. This demonstrates that obese patients did not experience excessive toxicities when ABW dosing was used.
To our knowledge, this is the first study to look at ABW dosing for adult ALL patients undergoing induction chemotherapy. Studies have shown that obesity in pediatric ALL leads to higher incidence of minimal residual disease (MRD) and poorer OS.13–15 It is unknown if adult obese patients follow a similar trend as the pediatric population. Our study demonstrates ABW dosing for induction chemotherapy leads to similar rates of CR for obese and nonobese patients. Days to ANC and platelet recovery in obese ALL patients were similar to that of nonobese patients. This demonstrates that obese patients receiving chemotherapy based on ABW did not experience excessive toxicities. All patients were alive at six months signifying that short-term survival did not differ between the two groups.
There were several limitations to this study. It was a single-center retrospective analysis of a small number of patients with acute leukemia. In addition, part of our definition for the primary outcome measure included stated CR since documentation was not available in all patients. Lack of full access to flow cytometry and pathology reports led to difficulty in validating CR rates in our patients. Finally, because of the retrospective nature of this study, there was reliance on documentation and due to variability between physicians; documentation was not always uniform among patients.
Conclusion
This study demonstrates that the current practice of dosing chemotherapy by ABW in AML and ALL patients leads to similar rates of CR and toxicity in obese patients. Continued research is needed to determine optimal dosing strategies and long-term outcomes in this population group.
Footnotes
Declaration of Conflicting Interests
The author(s) declared no potential conflicts of interest with respect to the research, authorship, and/or publication of this article.
Funding
The author(s) received no financial support for the research, authorship, and/or publication of this article.