
Abstract
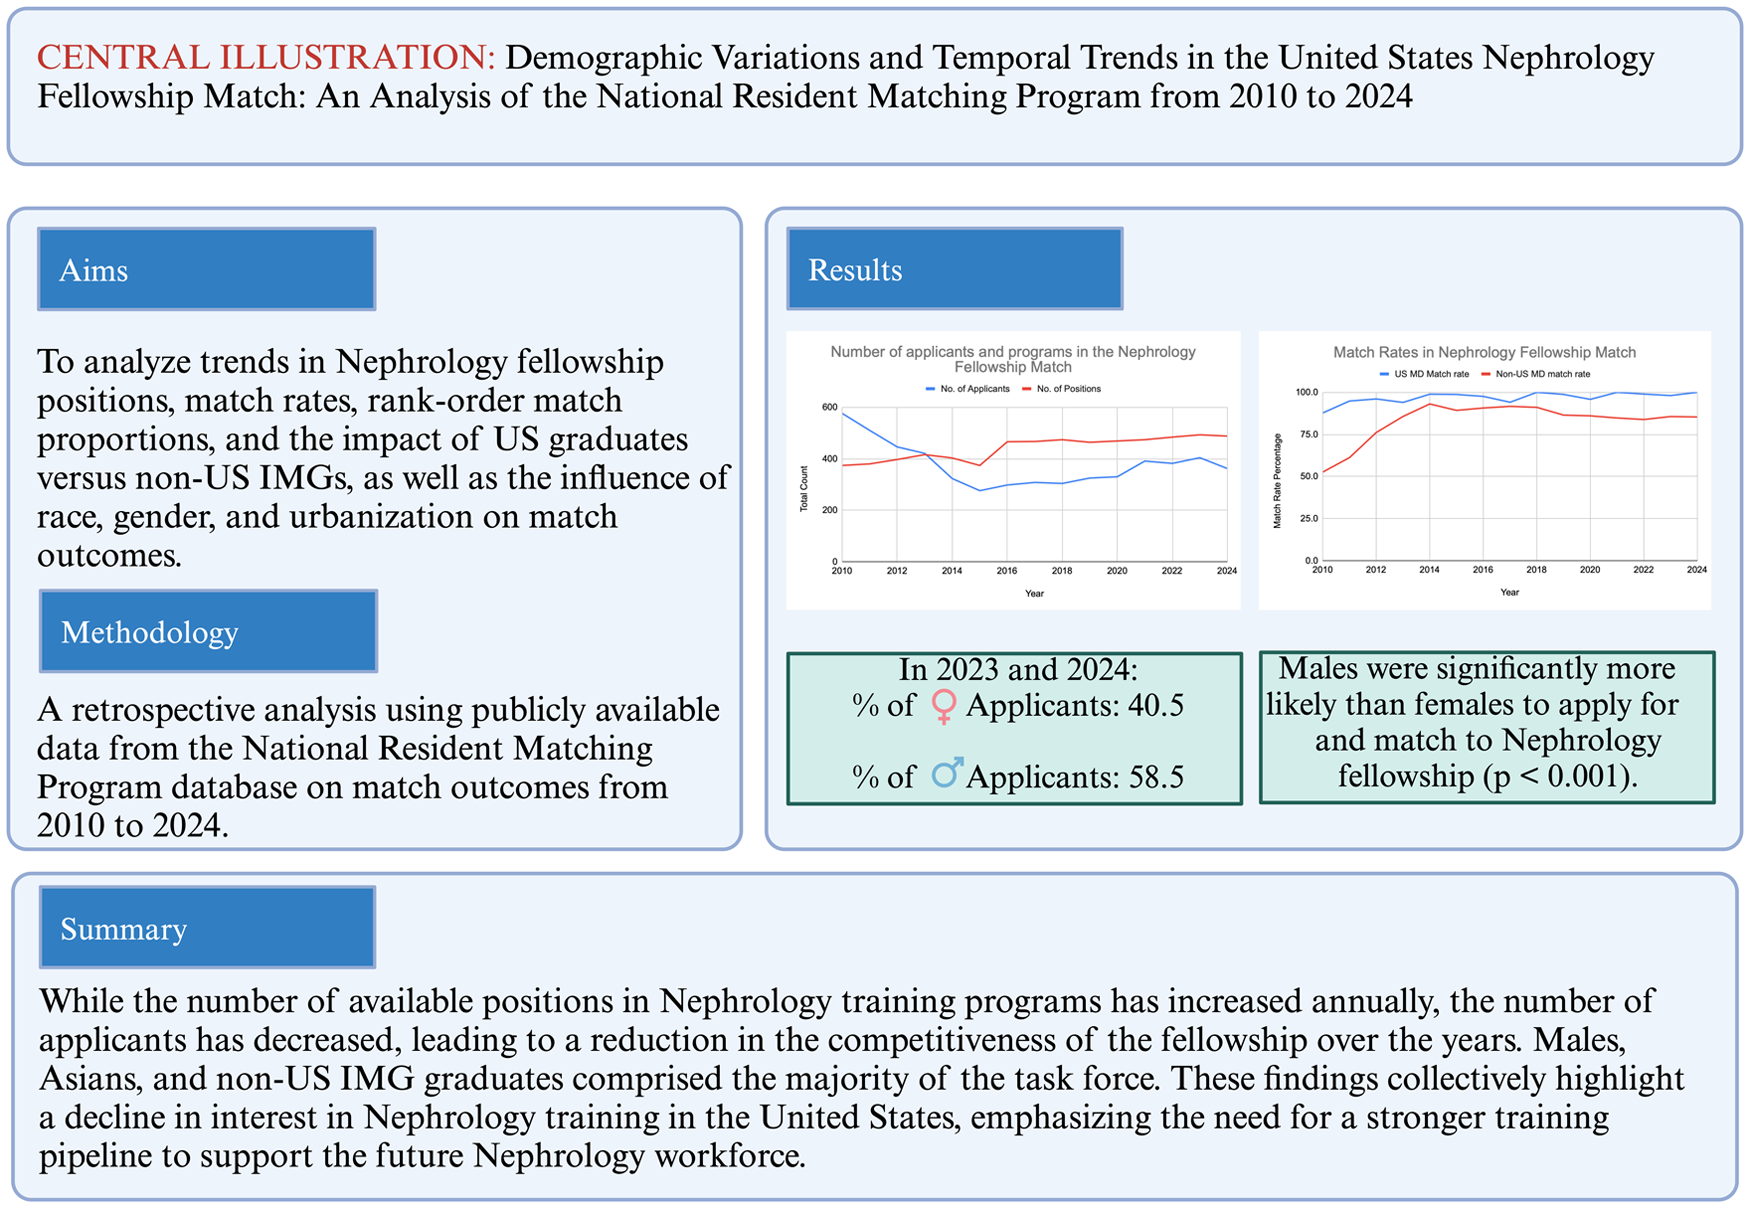
Each year, the National Resident Matching Program (NRMP) releases match outcomes data, highlighting trends, match rates, and competitiveness for each specialty. However, research on the demographics, temporal trends, and disparities among Nephrology applicants remains limited. This retrospective study analyzed data from the NRMP for Nephrology fellowships from 2016 to 2024, including applicant demographics and match outcomes. Chi-square tests were used to assess differences and temporal trends were evaluated with Mann-Kendall tests, and statistical significance was set at p < 0.05. Although the total number of training programs (p < 0.001) and fellowship positions (p < 0.001) increased from 2010 to 2024, the percentage of filled positions significantly declined from 94.1% in 2010 to 65.8% in 2024 (p = 0.047). Females were less likely to apply for Nephrology compared to other fellowships (p = 0.002) and had a lower match rate (p< 0.001). White applicants were less likely to apply for Nephrology than for other fellowships (p < 0.001). US MD graduates had a significantly higher match rate than non-US MD graduates over the study period (p < 0.001). In conclusion, despite the annual increase in Nephrology training positions, declining applicant numbers have reduced fellowship competitiveness. Males, Asians, and non-US international medical graduates comprised the majority of trainees. Addressing pay, job opportunities, and gender disparities is crucial to sustaining the future Nephrology workforce in the United States.
Introduction
Nephrology fellowships are subspecialty programs within internal medicine, accredited by the Accreditation Council for Graduate Medical Education (ACGME). 1 The first Nephrology fellowship training programs in the United States began in the 1950s. 2 Since the ACGME’s establishment in 1980, there are now over 150 adult Nephrology fellowship programs operating in the United States. 3
Each year, the National Resident Matching Program (NRMP) releases match outcomes data, illustrating trends, match rates, and competitiveness for each specialty. 4 Over recent decades, NRMP data have shown a steady decline in applicants for Nephrology fellowships. 5 The applicant-to-position ratio for Nephrology fellowships has dropped from 1.6 applicants per position in 2009 to 0.7 in 2020, 6 making Nephrology fellowships among the least competitive internal medicine subspecialties. 7
Despite these trends, more research is needed on the demographic backgrounds of nephrology applicants, particularly regarding variations between US medical graduates and international medical graduates (IMGs). In addition, trends in match rates and changes over time by applicant type have yet to be thoroughly examined. This 15-year retrospective study seeks to analyze trends in Nephrology fellowship positions, match rates, rank-order match proportions, and the effects of US medical graduates vs non-US IMGs on match rates. We hypothesized that while the total number of positions has increased, the number of applicants has declined, and that significant trends exist among applicants based on race, gender, and US-MD or non-US IMG status.
Methodology
This retrospective study utilized publicly available NRMP database data on match outcomes from 2010 to 2024.8,9 Previous studies have examined match outcomes across specialties using this database.10–12 Institutional review board approval was not required, as the data was publicly accessible and devoid of identifiable individual information.
For 15-year trend analysis, we retrieved annual data on the number of Nephrology applicants, matches, ranked positions, and filled positions. The dataset included figures for US allopathic (MD) graduates in these categories, enabling the calculation of values for non-US allopathic (MD) graduates. The category of non-US MD graduates encompasses US osteopathic (DO) graduates, US IMGs, non-US IMGs, fifth pathway graduates, and Canadian medical graduates, allowing for the determination of match rates for both groups. In addition to trend analysis, a two-tailed Chi-square test assessed whether significant differences existed in match rates between US MD and non-US MD graduates over the study period. The dataset also included matched allopathic, osteopathic, US IMGs, and non-US IMGs, reported as percentages of all matriculating Nephrology fellows. Furthermore, data on applicants matching their first, second, third, and third or greater choice of Nephrology program was analyzed. Temporal trends were assessed using the Mann-Kendall trend test, with Kendall’s Tau indicating trend strength and direction, and a p-value determining statistical significance.
Demographic data was obtained for the 2023 and 2024 application years, as the NRMP began publicly reporting demographic information in 2023. Collected demographics included sex, race, ethnicity, urbanity, and first-generation college/medical school status for Nephrology applicants, matched Nephrology applicants, all fellowship applicants, and all matched fellowship applicants. Match rates were calculated and stratified by these demographic factors for Nephrology applicants. Potential disparities between applicants and matched applicants were assessed using a two-tailed Chi-square test. Nephrology applicant demographics were compared with those of all fellowship applicants for 2023 and 2024, and similarly, matched Nephrology applicant demographics were compared with all matched fellowship applicants. Significant demographic differences between Nephrology and all fellowship applicants, as well as between matched Nephrology and all matched fellowship applicants, were evaluated using a two-tailed Chi-square test. A p-value below 0.05 was considered statistically significant, and all analyses were performed using XLSTAT software (RRID:SCR_016299, Lumivero, Denver, CO, USA).
Results
Number of programs, positions, applicants, and percentage of positions filled
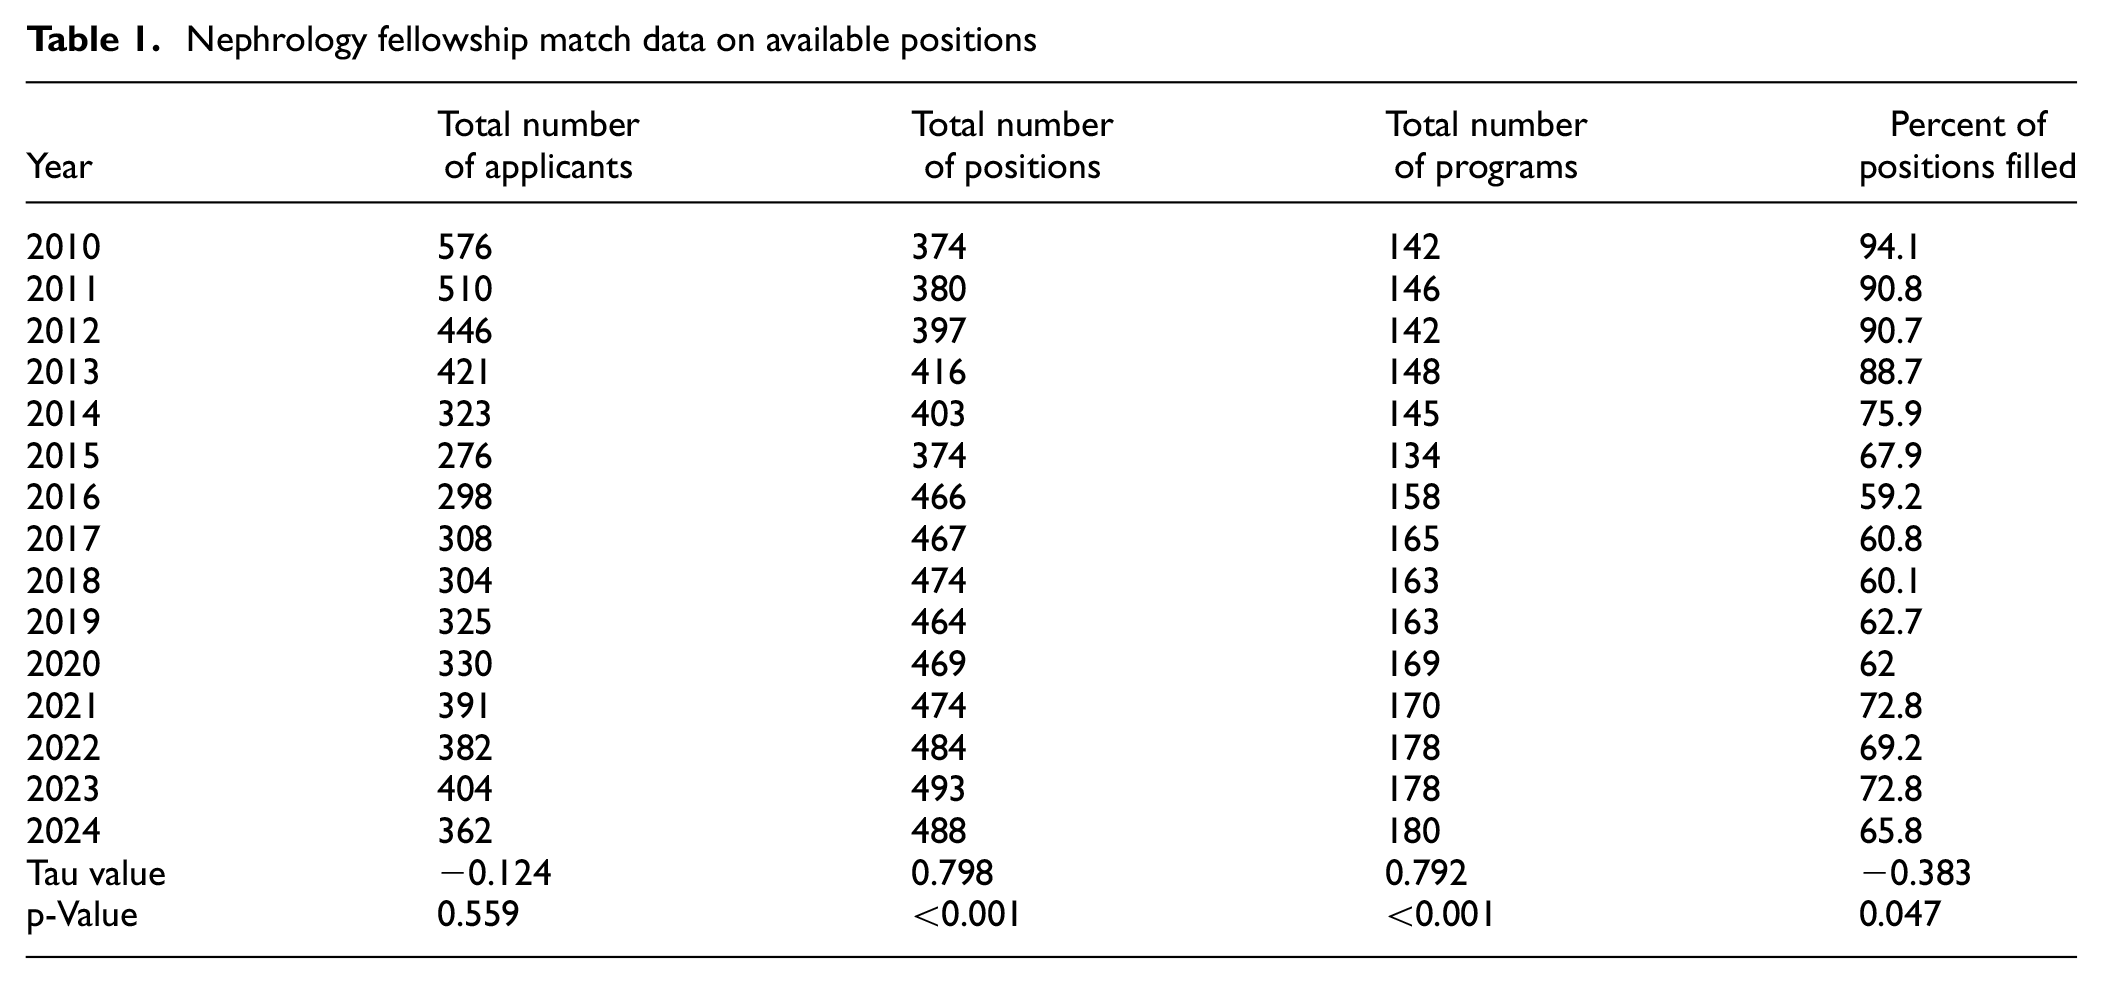
The total number of training programs rose from 142 in 2010 to 180 in 2024, a 26.8% increase (τ = 0.792, p < 0.001), with available fellowship positions also increasing from 374 to 488 (30.5% increase, τ = 0.798, p < 0.001). Conversely, the number of fellowship applicants declined from 576 in 2010 to 362 in 2024, though this 37.2% decrease was not statistically significant (p = 0.559). There was, however, a significant decrease in the percentage of filled positions, dropping from 94.1% in 2010 to 65.8% in 2024 (28.3% decrease, τ = −0.383, p = 0.047) (Table 1 and Figure 1).
Nephrology fellowship match data on available positions
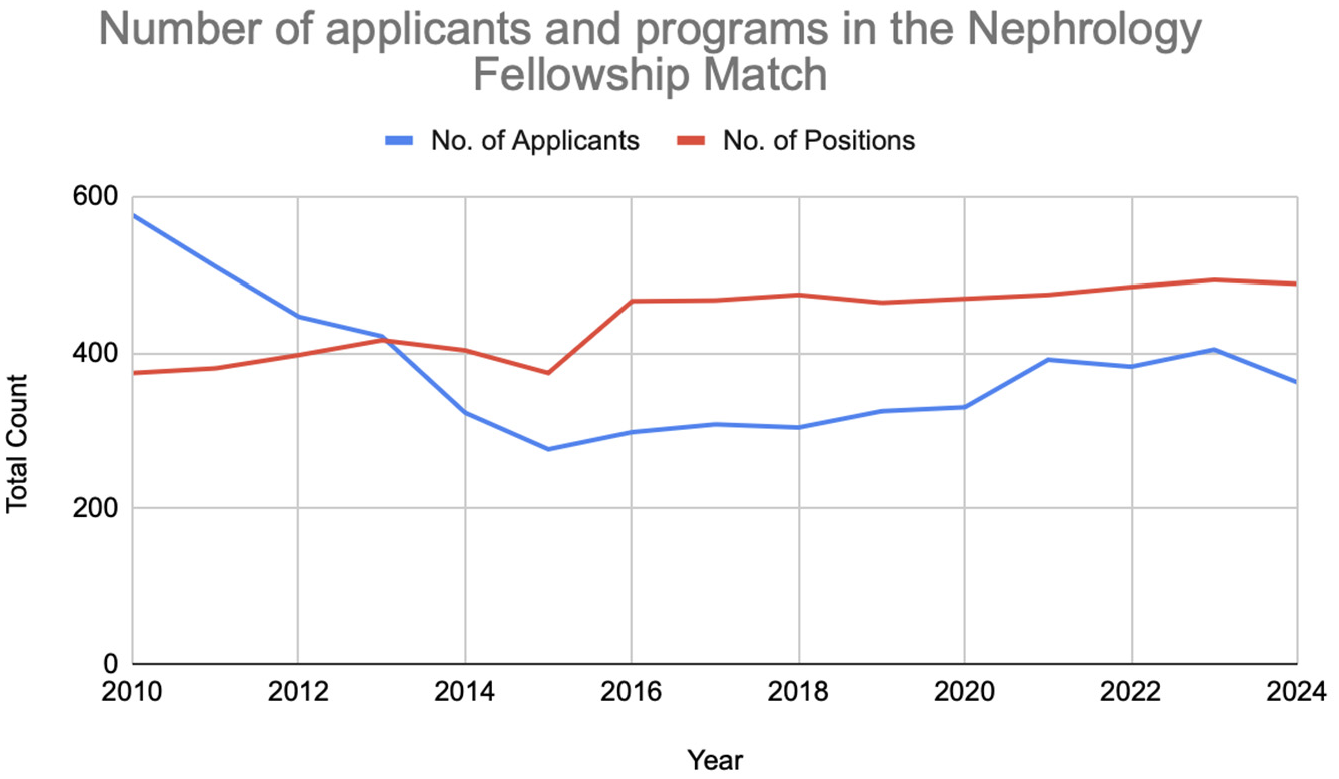
Temporal trends in the number of nephrology positions and applicants.
SUMMARY
WHAT IS ALREADY KNOWN ABOUT THIS SUBJECT?
In recent years, an increasing number of Nephrology fellowship positions have gone unfilled, raising concerns about declining interest in the specialty.
WHAT ARE THE NEW FINDINGS?
Declining Competitiveness in Nephrology Fellowships: Despite a rise in available training positions, the percentage of filled Nephrology fellowship spots has significantly declined over time.
Gender and Racial Disparities in Applications: Female physicians and White applicants were significantly less likely to apply for Nephrology compared to other subspecialties. These findings highlight ongoing disparities in specialty choice, emphasizing the need for targeted mentorship, recruitment efforts, and career incentives to diversify the field.
Higher Match Rates for US MD Graduates: US MD graduates consistently had higher match rates than non-US MDs, suggesting differences in selection criteria and potential systemic barriers for international medical graduates (IMGs). Improving IMG support and integration may help address workforce gaps and enhance diversity.
HOW MIGHT IT IMPACT CLINICAL PRACTICE IN THE FORESEEABLE FUTURE?
These findings highlight the urgent need for initiatives aimed at improving the appeal of Nephrology as a career choice. Addressing persisting disparities in recruitment, expanding mentorship programs during residency, and ensuring equitable opportunities across demographics may be key to securing a sustainable, diverse, and representative Nephrology workforce in the years ahead.
Demographic and urbanization status variations
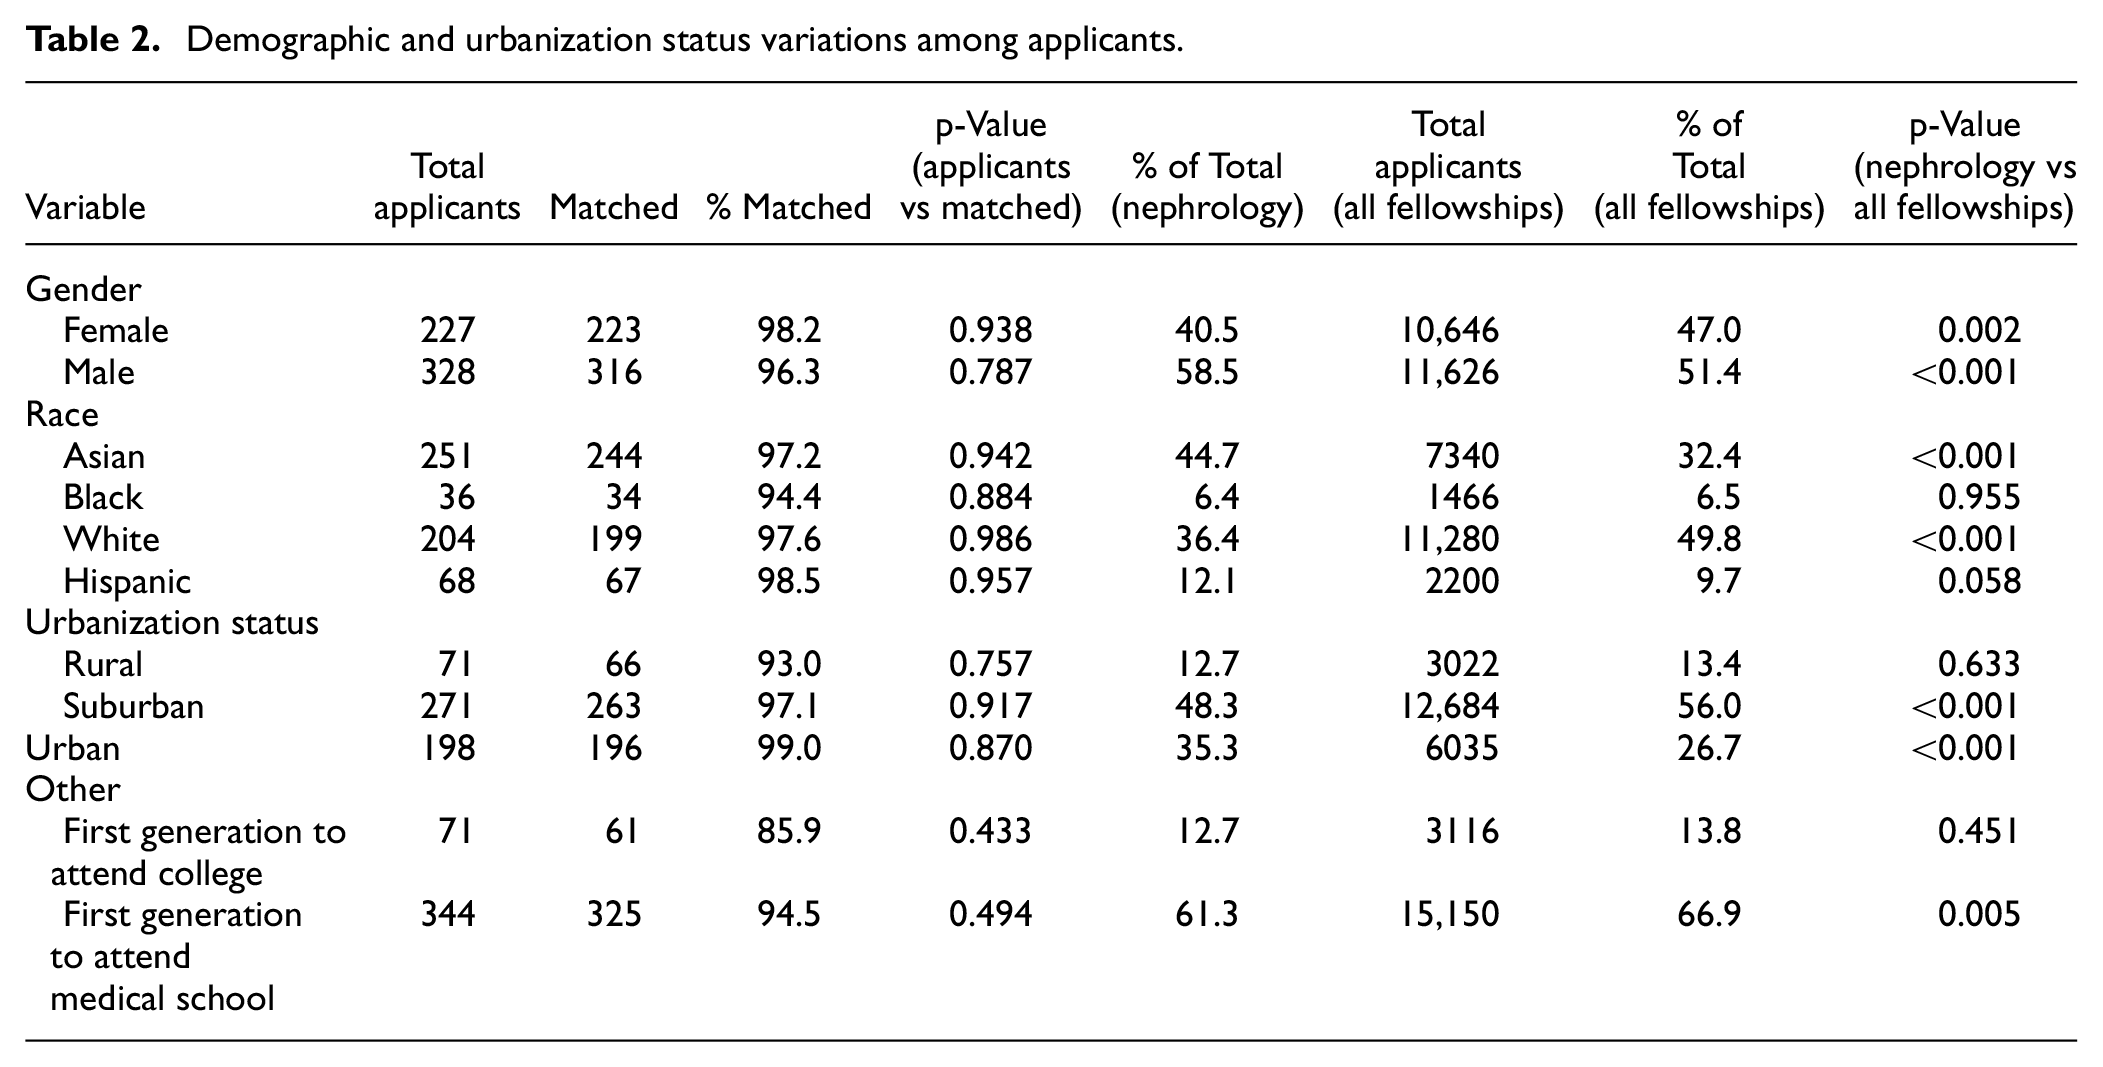
In 2023 and 2024, two hundred twenty-seven female applicants (40.5%) and 328 male applicants (58.5%) applied for the Nephrology fellowship, with the remainder not identifying as male or female, or preferring not to answer. Females were less likely to apply for Nephrology compared to other fellowships (40.5% vs 47.0%, p = 0.002) and had a lower match rate in Nephrology than in other fellowships (40.7% vs 48.7%, p < 0.001). Conversely, males were more likely to apply to Nephrology (58.5% vs 51.4%, p < 0.001) (Table 2) and had a higher match rate in Nephrology compared to all fellowship match rates for males (57.7% vs 49.8%, p < 0.001) (Table 3). Males were also significantly more likely to apply and match to the Nephrology fellowship than females of the same category (p < 0.001 for both comparisons).
Demographic and urbanization status variations among applicants.
Demographic and urbanization status variations among those who matched.
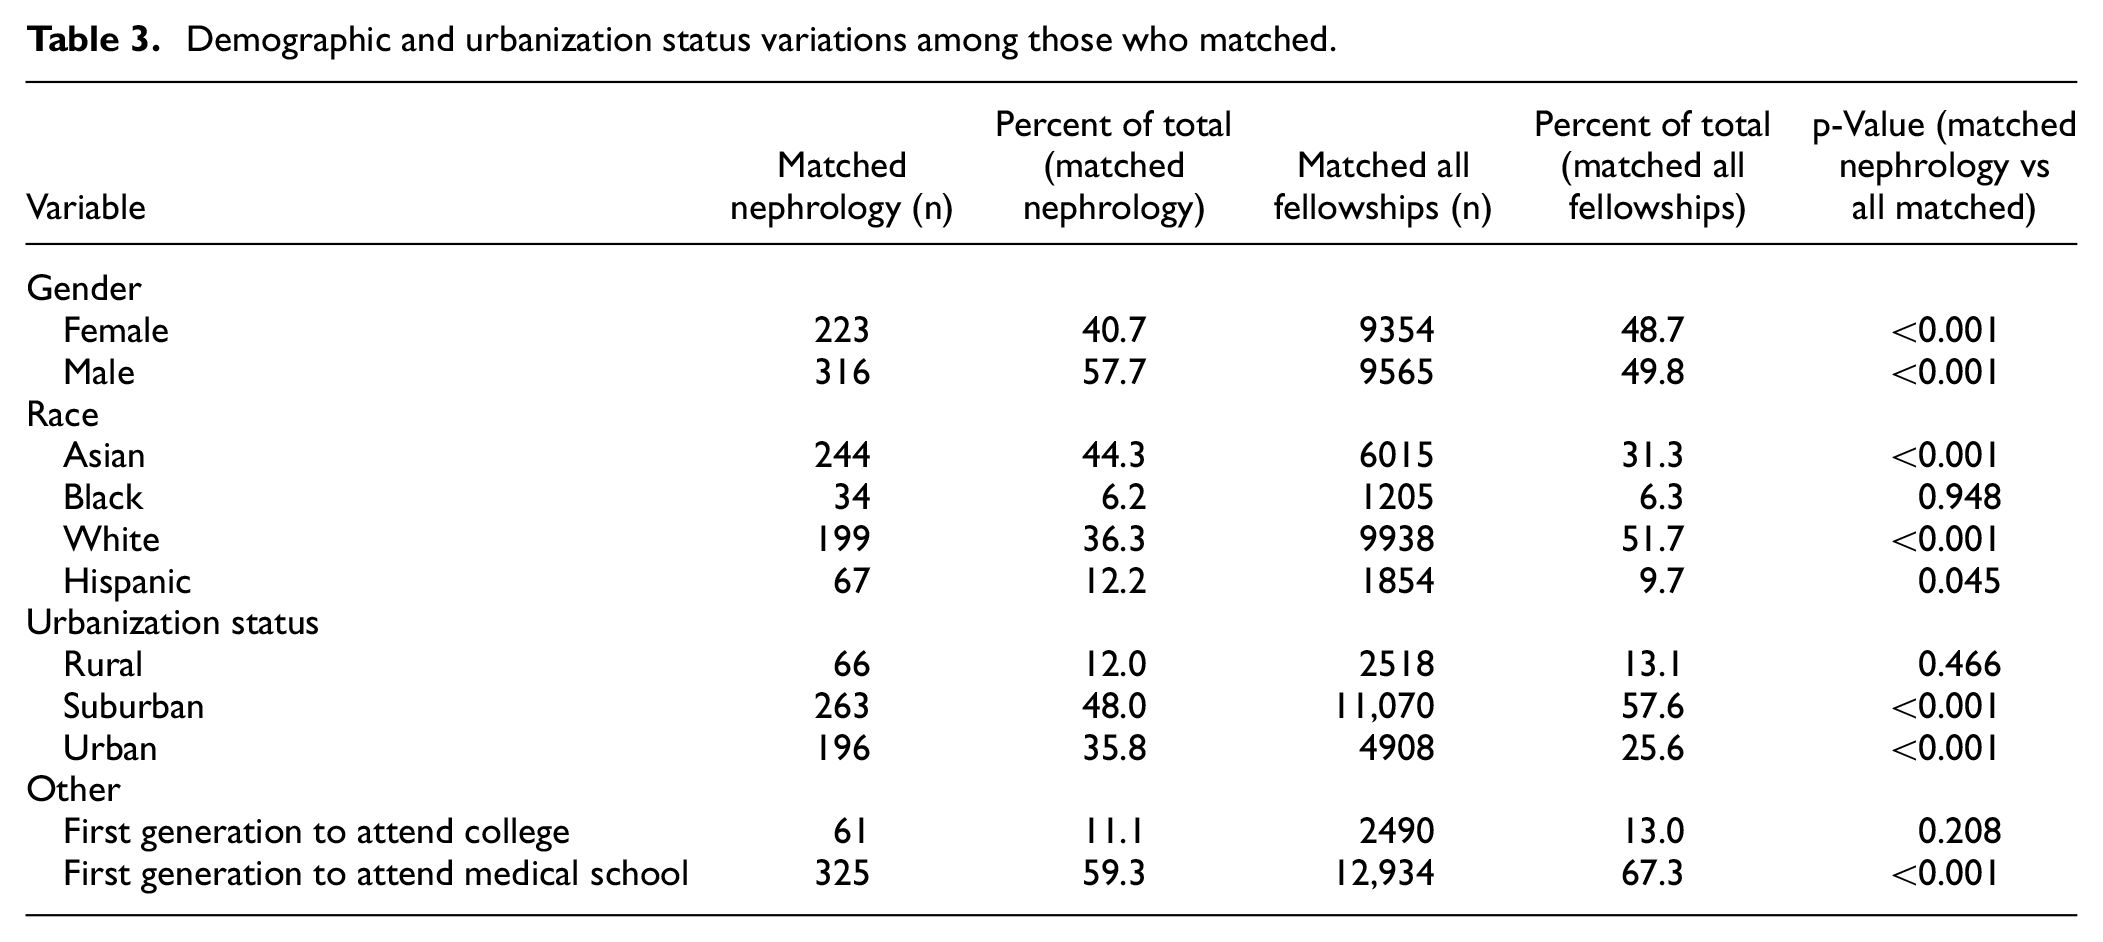
Asian applicants were more likely to apply to Nephrology than to other fellowships (44.7% vs 32.4%, p < 0.001), while White applicants were less likely to apply to Nephrology than to other fellowships (36.4% vs 49.8%, p < 0.001) (Table 2), with similar trends observed among those who matched (Asian applicants: 44.5% vs 31.3%, p < 0.001; White applicants: 36.3% vs 51.7%, p < 0.001) (Table 3).
Applicants from rural areas were slightly less likely to apply to Nephrology than other fellowships, though this was not statistically significant (12.7% vs 13.4%, p = 0.63). In contrast, applicants from urban areas were significantly more likely to apply to Nephrology than other fellowships (35.3% vs 26.7%, p < 0.001) (Table 2). Similar trends were observed among those from rural (12.0% vs 13.1%, p = 0.466) vs urban (35.8% vs 25.6%, p < 0.001) areas who matched (Table 3).
When comparing the demographics of Nephrology applicants who applied vs those who matched, we found no statistically significant disparities for any of the collected demographic categories (p > 0.05 for all comparisons), showing that isolated sex, race, ethnicity, urbanity, or first-generation college/medical school status are not correlated with a significant difference in the Nephrology match rate (Table 2).
Match rates of US MD vs non-US MD graduates
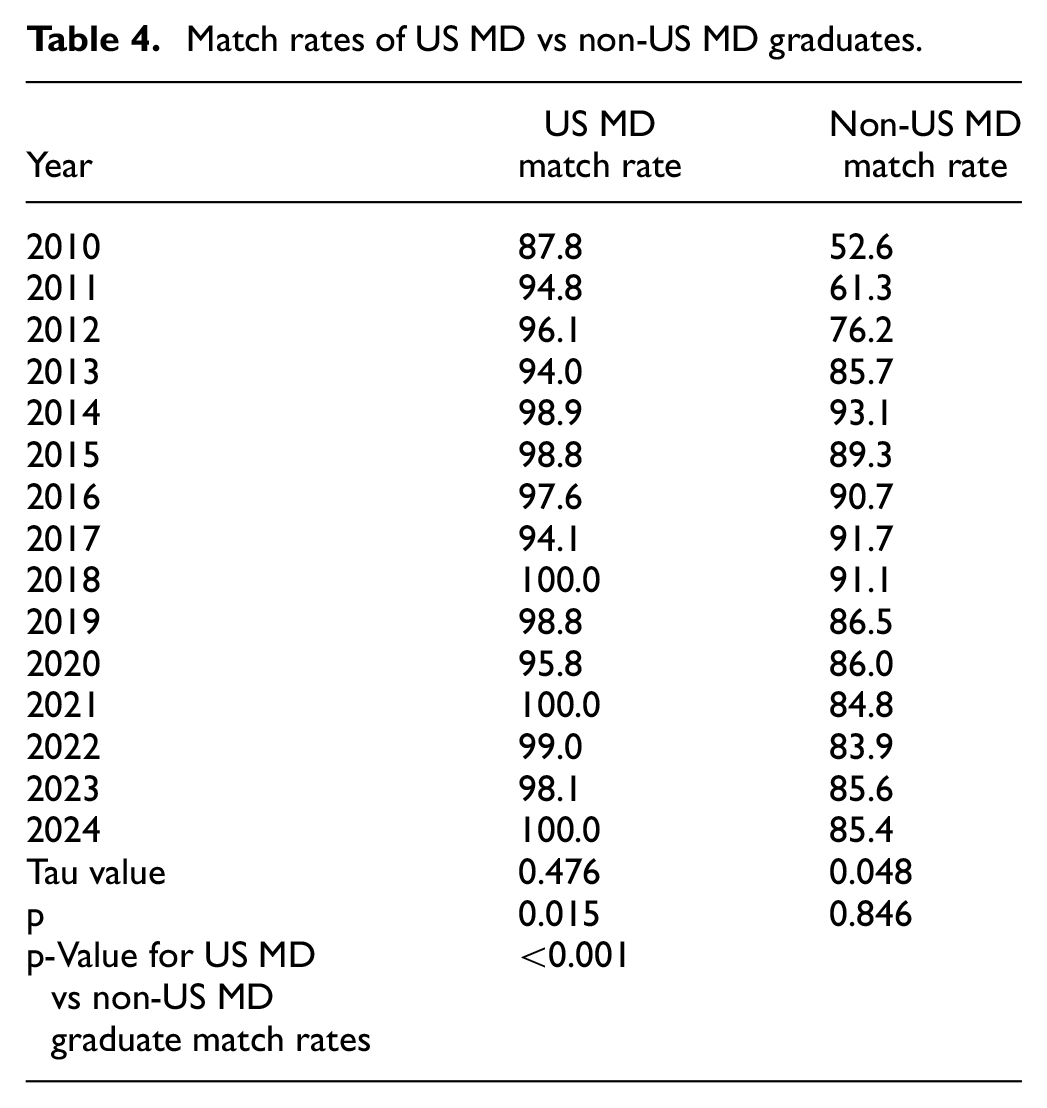
US MD graduates had a significantly higher match rate than non-US MD graduates over the study period (p < 0.001), although this disparity narrowed over time. In 2010, there was nearly a 1.7-fold difference in match rates between US MD graduates and non-US MD graduates (87.8% vs 52.6%), which decreased to a nearly 1.2-fold difference in 2024 (100.0% vs 85.4%). Over time, there was a significant increase in the annual match rate for US MD graduates (87.8% in 2020 to 100.0% in 2024, τ = 0.476, p = 0.015), while the increase for non-US MD graduates (52.6% to 85.4%) was not statistically significant (τ = 0.048, p = 0.846) (Table 4 and Figure 2).
Match rates of US MD vs non-US MD graduates.
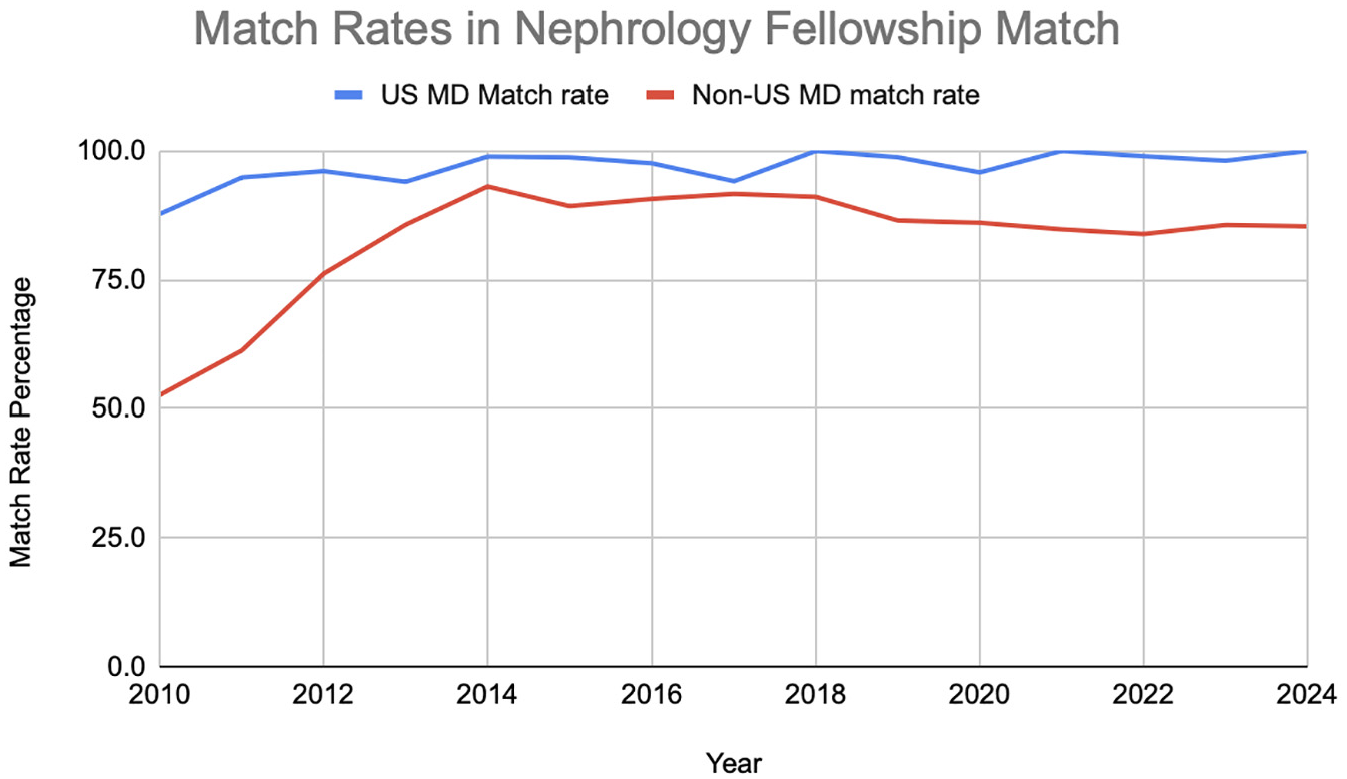
Temporal trends in match rates between US MD and non-US MD graduates.
Variations in the percentage of US MD, US DO, US IMG, and non-US IMG graduates
The number of US MD graduates in Nephrology fellowship decreased from 34.7% to 25.5%, though this change was not statistically significant (τ = −0.183, p = 0.346). Similarly, for non-US IMGs, the percentage of applicants in fellowship showed a significant decrease from 50.0% to 36.4% (τ = −0.657, p < 0.001). In contrast, for US IMGs, the percentage in Nephrology fellowship increased from 13.1% to 21.5% (τ = 0.632, p = 0.001), and for US DOs, the percentage also increased from 2.3% to 16.5% (τ = 0.867, p < 0.001) (Table 5 and Figure 3).
Variations among US MD, US DO, US IMG, and non-US IMG graduates.
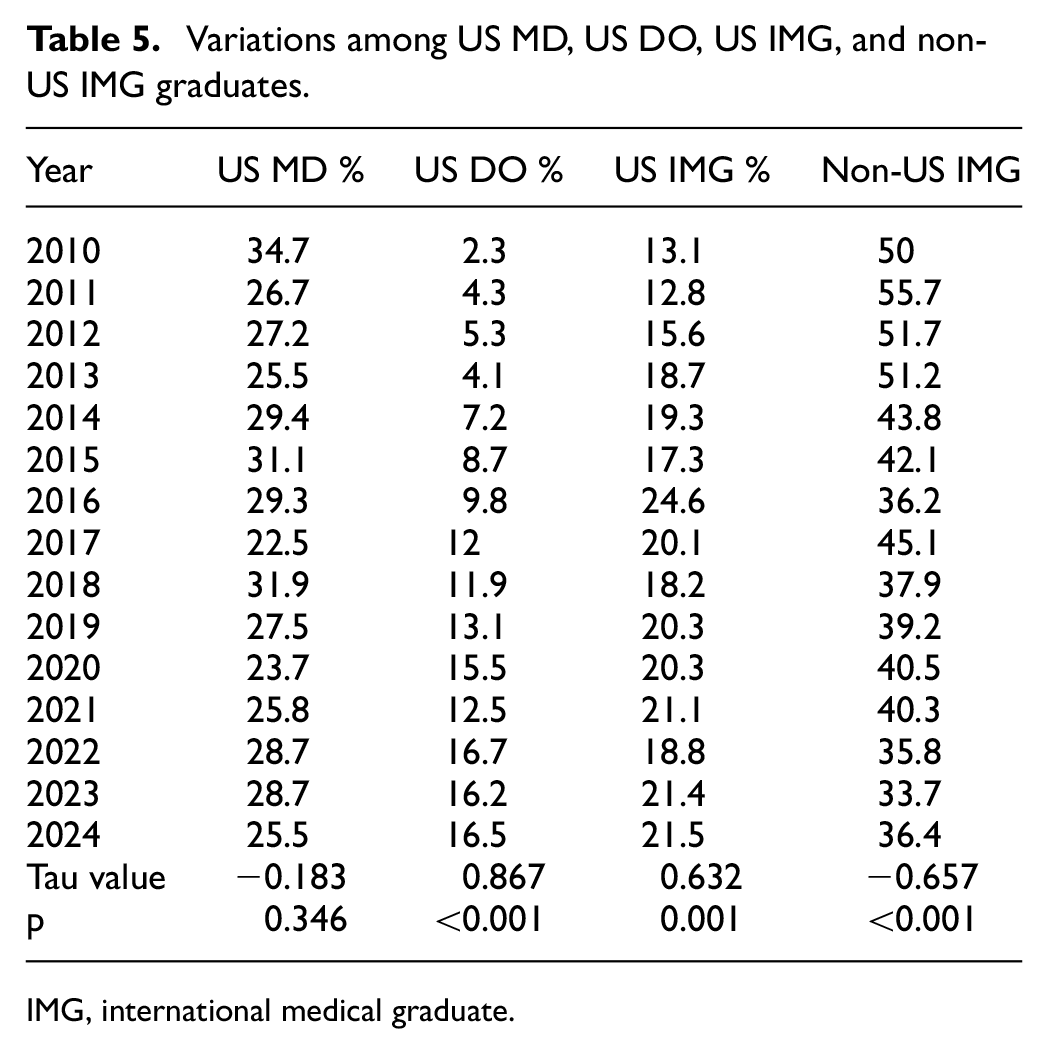
IMG, international medical graduate.

Temporal trends in demographics of matriculating match candidates.
Applicant match data by choice of program
Over the 15-year study period, the percentage of applicants matching their first choice of program increased from 33.5% in 2010 to 59.9% in 2024; however, this change was not statistically significant (τ = 0.162, p = 0.435). In addition, there was an insignificant decreasing trend in the percentage of applicants matching their second choice (τ = −0.038, p = 0.843), and an insignificant increase in applicants matching their third choice (τ = 0.107, p = 0.584). No trend was observed in the percentage of applicants matching their fourth or lower choice (τ = 0.000, p = 1.000) (Supplemental Table 1).
Unmatched applicants
The percentage of unmatched applicants decreased from 35.6% in 2010 to 6.4% in 2024 (τ = −0.306, p = 0.113), indicating a decreasing trend in the number of unmatched positions, although the difference was not statistically significant (Supplemental Table 2).
Discussion
This is the first study to investigate demographic variations and temporal trends in Nephrology fellowship match data from the NRMP. Overall, the results show that, despite a significant increase in the number of Nephrology fellowship training programs and positions offered, the total number of applicants applying to Nephrology has decreased since 2010, though this trend did not reach statistical significance. In addition, there was a significant decline in the percentage of filled Nephrology fellowship positions. Males were more likely to apply to Nephrology fellowships, both compared to females and to all males applying to any fellowship. Conversely, females were less likely to apply to Nephrology compared to all female applicants to any fellowship. Asian applicants were more likely to apply and match into Nephrology, while the opposite trend was observed for White applicants. Applicants residing in urban areas were also more likely to apply to and match into Nephrology fellowships. US MD graduates consistently matched at a higher rate than non-US MD graduates, though this disparity narrowed over time. However, the percentage of US MD graduates and non-US IMG graduates in Nephrology fellowship has been decreasing since 2010, while the percentage of all Nephrology fellows who are US DO graduates or US IMG graduates has been increasing (all trends are significant except for that of US MD graduates). The number of unmatched applicants for Nephrology has decreased over the past 15 years, although this trend did not reach statistical significance. Hence, our results demonstrate a consistent decline in the competitiveness of Nephrology fellowships.
The decrease in individuals choosing Nephrology as a career has been well-documented over the past decades.13,14 Similarly, pediatric Nephrology has also seen a concerning reduction in interest. 15 At the same time, the global need for nephrologists has grown, driven by the increasing prevalence of end-stage kidney disease. 16 The decline in desirability of Nephrology as a fellowship choice can be explained by several factors. Surveys conducted by the American Society of Nephrology (ASN) have highlighted issues such as low compensation compared to other internal medicine specialties, poor work-life balance, and difficulties in securing job positions in desirable locations. 17 Compensation is particularly significant for US medical graduates, who typically graduate with an average debt of $200,000. Furthermore, the starting salary for a Nephrology fellow is often between $200,000 and $250,000, which is lower than in other subspecialties.13,18 This may help explain the decline in the number of US MD graduates matching into Nephrology from 2010 to 2024 in our study. In addition, burnout is a significant concern among nephrologists; a 2020 Medscape survey reported that 51% of nephrologists felt burned out or depressed, while only 23% reported feeling happy. 19 Surveys of medical students also indicate a lack of exposure to Nephrology as a subspecialty, which may further contribute to the lower number of applicants choosing Nephrology each year. 20
Our results also demonstrate that US MD graduates had higher match rates than non-US MD graduates, with this disparity narrowing over time. This aligns with findings from other studies using the NRMP database to analyze fellowship match rates in specialties such as Cardiovascular Disease 10 and Hematology and Oncology. 12 Non-US IMG graduates have faced disproportionately higher difficulty in finding satisfactory jobs compared to their US MD graduate counterparts, as suggested by a survey of Nephrology fellows by the ASN. 18 Contributing factors include a higher number of fellows unable to secure jobs that meet their visa requirements and offer employment services for their spouse or partner. 18
Our results also highlight the disproportionate number of women in Nephrology. Studies have shown an increase in the proportion of women choosing Nephrology fellowship programs, from 23.9% to 36%. 15 A cross-sectional study conducted by the ASN from 2011 to 2019 analyzed the presence of women among its members, revealing a rising proportion of women fellows. 16 However, well-documented gender bias continues to exacerbate the gender gap, with a $30,000–60,000 difference in compensation between men and women, with men earning an average of $304,000 and women earning $244,000 as full-time workers. 18 Although the percentage of women nephrologists has increased over the past two decades, significant improvement is still needed to eliminate gender disparities.2,19 Imposter syndrome, a lack of mentorship opportunities, gender prejudice in recognition and promotion, and the need for improved work-life balance are just a few of the challenges faced by women in Nephrology. 21 The creation of organizations devoted to the advancement and recognition of female nephrologists, including specialized mentorship programs, support for fair representation in scientific society executive committees and councils, and equal opportunities to present at academic conferences, are some of the successful initiatives explored thus far. 21 However, significant gaps remain in terms of facilitating a seamless transition to parenthood and incorporating this life-altering event into a woman’s profession without jeopardizing her career goals. A more diverse, representative, productive, and efficient workforce will result in more scientific innovation, benefiting all nephrologists by alleviating the barriers many women face in pursuing their professional aspirations.
Despite these findings, the 2023 Nephrology Fellows Survey by ASN revealed that 9 out of 10 fellows would recommend nephrology to medical students and residents, with 96% of US MD graduates and 89% of IMGs endorsing the specialty. This strong endorsement offers an optimistic outlook for the future of Nephrology.
Limitations
We acknowledge several limitations in our study. First, while we provide an overview of match results from 2010 to 2021, these trends should be interpreted as reflective of past patterns rather than predictive of future outcomes. Second, we did not have access to data regarding the number of fellowship program applications and interview invitations, and race and demographic information were only available for the years 2023 and 2024. Third, future research should explore which candidate achievements are most strongly associated with favorable match outcomes in Nephrology. In addition, the influence of residency program rank and other training factors on match success remains unclear. Lastly, there are numerous confounding variables that impact match rates to highly ranked programs (e.g., geography and personal preferences) and match rates by training background (i.e., allopathic graduate), which should be further explored in future studies.
Conclusions
In conclusion, while the number of available positions in Nephrology training programs has increased annually, the number of applicants has decreased, leading to a reduction in the competitiveness of the fellowship over the years. Males, Asians, and non-US IMG graduates comprised the majority of the task force. These findings collectively highlight a decline in interest in Nephrology training in the United States, emphasizing the need for a stronger training pipeline to support the future Nephrology workforce. In addition, there is a growing need for initiatives that address issues such as pay, job opportunities, and gender disparities among nephrologists in the United States.
Supplemental Material
sj-docx-1-imj-10.1177_10815589251348912 – Supplemental material for Demographic variations and temporal trends in the United States nephrology fellowship match: An analysis of the National Resident Matching Program from 2010 to 2024
Supplemental material, sj-docx-1-imj-10.1177_10815589251348912 for Demographic variations and temporal trends in the United States nephrology fellowship match: An analysis of the National Resident Matching Program from 2010 to 2024 by Aman Goyal, Samuel L Flesner, Mah I Kan Changez, Viraj Shah, Gauranga Mahalwar and Andrei Brateanu in Journal of Investigative Medicine
Footnotes
Declaration of conflicting interests
The author(s) declared no potential conflicts of interest with respect to the research, authorship, and/or publication of this article.
Funding
The author(s) received no financial support for the research, authorship, and/or publication of this article.
Supplemental Material
Supplemental material for this article is available online.
References
Supplementary Material
Please find the following supplemental material available below.
For Open Access articles published under a Creative Commons License, all supplemental material carries the same license as the article it is associated with.
For non-Open Access articles published, all supplemental material carries a non-exclusive license, and permission requests for re-use of supplemental material or any part of supplemental material shall be sent directly to the copyright owner as specified in the copyright notice associated with the article.