
Abstract
The aim of this work was the evaluation of the breadmaking potential of spelt flour when combined with wheat flour in various proportions, both in freshly baked and frozen form, and determine the optimal ratio for products with satisfactory quality characteristics. Freshly baked samples were prepared using different spelt–wheat flour mixtures ranging from 0 to 100% spelt at 10% intervals, while batches containing 0, 30, 50, 80, and 100% spelt were prepared in the case of frozen dough samples. The characteristics of the final baked products (dough volume expansion, specific volume, crust and crumb color, hardness, and water activity) were evaluated. Results showed that spelt flour proportions up to 20% provide bread with quality and sensory characteristics similar to wheat, while proportions higher than 70% lead to products with inferior properties. Therefore, samples with spelt content between 30 and 60%, although slightly degraded, remained highly acceptable.
Introduction
A strong interest in new flour sources has arisen during the last decades in order to satisfy consumers’ needs for bakery products with enhanced nutritional properties (Gosine and McSweeney, 2019; Pasqualone et al., 2011). Spelt flour seems to be an appealing choice, as it has similar bakery potential with common wheat flour while its nutritional value is higher due to its protein content. Spelt (Triticum aestivum var. spelta) is one of the several species of common wheat. It is an ancient crop native to the Mediterranean region and southwest Asia (Gosine and McSweeney, 2019), able to grow in harsh ecological conditions without the use of pesticides (Filipčev et al., 2017, 2013). The protein content of spelt wheat may be higher (Frakolaki et al., 2018), but the resulting gluten network is less consistent and flexible (Bojňanská and Frančáková, 2002). Spelt flour differs, also, significantly from wheat flour in the content and type of prolamins contained. This may be the reason why several people who suffer from gluten intolerance can tolerate products made from spelt flour. Thus, the incorporation of this certain flour type in bakery products is an upcoming challenge (Filipčev et al., 2013). Moreover, whole meal spelt flour exhibits higher percentage of dietary fibers than wheat flour (Bonafaccia et al., 2000; Zieliński et al., 2008).
In a previous study, the composition of spelt and wheat flour has been extensively examined and their differences have been confirmed. Spelt dough is less stable and elastic than common wheat dough and presents higher extensibility (Frakolaki et al., 2018). Due to its increased softness and stickiness after kneading, its handling becomes more difficult (Kohajdová and Karovicová, 2008). The final products have generally lower loaf volume and they exhibit a quite open grain and coarse texture compared to common wheat bread (Pruska-Kedzior et al., 2008; Ranhotra et al., 1995). However, the addition of spelt flour in bread recipes provides final products with a strong bread smell, excellent taste, as well as freshness and softness for a longer period (Bojňanská and Frančáková, 2002). In order to address the quality problems associated with spelt flour, it is proposed to be used in mixtures with wheat flour (Filipčev et al., 2013). Moreover, a combination of flours for the production of bakery products provides various advantages, such as enhanced nutritional value and greater variety of final products (Filipčev et al., 2017).
During the last decades, bakery products are widely distributed in frozen form due to their high convenience and retainability. Although frozen storage can significantly extend the shelf life of dough products, it has a negative impact on their physicochemical and sensorial characteristics (Giannou and Tzia, 2007). The most important of these deteriorations is related to the reduction or loss of yeast’s viability and dough’s strength. Changes in yeast’s viability affect gassing power, fermentation time, and loaf volume that are crucial for consumers’ acceptability. Moreover, dough’s strength affects the stability of the gluten network, the gas retention ability, and the total quality of bread (Anon et al., 2004; Giannou and Tzia, 2008; Le Bail et al., 2012).
The aim of this study was to further investigate the breadmaking potential of spelt flour when combined with wheat flour in various proportions, both in freshly baked and frozen form and determine the optimal ratio that will lead to products with satisfactory sensory characteristics and higher nutritional value than the respective wheat products.
Materials and methods
Raw materials
In this study, two types of flour were utilized: white wheat flour T.70% (as milling yield) and whole-wheat spelt flour T.90%, kindly donated by “Helios” pasta company (Metamorphosis, Greece). The chemical composition and properties of the above flours were determined in a previous study (Frakolaki et al., 2018). The remaining ingredients used to prepare dough samples, such as sugar, salt, and instant dry yeast, have been obtained from the local market.
Dough formulation
The essential dough mixture comprised of flour, water (60% on flour base), sugar (4% on flour base), dry yeast (2% on flour base), and salt (2% on flour base).
Dough/bread preparation
Fresh samples
Dough mixing was performed using a “Kenwood Chef KM400” (Kenwood, Havant, UK) blender and round-shaped samples of 80 g were prepared (Frakolaki et al., 2018). These were proofed for 30 min (at 40 ℃) in a “SanyoMIR-153” incubation chamber (SANYO Electric Co., Gunma, Japan). Proofed dough samples were subjected to texture examination and the remaining were baked at 180 ℃ (for 25 min) in a “Thermawatt TG103” laboratory oven under air circulation (Thermawatt, Athens, Greece) and allowed to cool (for 45 min) at room temperature (28–30 ℃). Experiments with different spelt–wheat flour mixtures, ranging from 0 to 100% spelt flour at 10% intervals, were carried out in duplicate.
Frozen samples
For the preparation of the frozen dough samples, the same basic dough formula was applied and the above described procedure (“Fresh samples” subsection) was followed. After molding, samples were packed in suitable cardboard baking pans, wrapped with transparent polymer film and stored under freezing (Whirlpool AFG 543-C/H) at −18 ℃ for an overall period of almost three months.
Batches containing 0, 30, 50, 80, and 100% spelt flour were prepared in the case of frozen dough samples. Sampling was more frequent during the first days of storage as the rate of the quality degradation is initially higher (Giannou and Tzia, 2007). Subsequently, sampling was done once a month for a total storage period of three months.
The samples were withdrawn from the freezer for testing or baking. They were thawed and proofed in an incubation chamber (Sanyo MIR-153; SANYO Electric Co., Gunma, Japan) set at 40 ℃ for 75 min. Baking was performed at 180 ℃ (for 25 min) and bread samples were allowed to cool (for 45 min) at room temperature (28–30 ℃), as described above in the case of the fresh samples.
Determination of physicochemical and quality parameters
Bread samples (after baking and cooling) were weighed in order to determine weight loss as the percentage of weight lost during baking. Specific volume was measured according to AACC 10-05.01 (rapeseeds displacement method). The crust and crumb color of the samples was measured with a Minolta CR/200 chromatometer (Minolta Company; Chuo-ku, Osaka, Japan), according to the CIELAB color measurement system, using the following equation (MacDougall, 2002)

Texture analysis was performed with a TA-XT2i (Stable Micro Systems; Godalming, Surrey, UK) texture analyzer. A two-cycle compression test was used for dough samples with a SMS P/45 C cone probe (test speed 3 mm/s, penetration distance 15 mm), while a cut test with a TA-45 craft knife (test speed 3 mm/s, penetration distance 15 mm) was performed in the case of the baked samples (crust and crumb). The water activity of the samples was measured with an Aqualab 4TEV device (Decagon Devices Inc.; Pullman, WA, USA) by placing 3 g of crumb into the clean and dry container of the device. Finally, the dough volume expansion prior to baking, expressed as the difference between the height of each dough sample before and after proofing, as well as the maximum height and width of each sample, were also measured with a caliper.
All measurements were performed in triplicate and their mean values were calculated. Sensory evaluation was also applied to baked samples using a trained panel (Frakolaki et al., 2018).
Statistical analysis
Statistical evaluation of the data, with one-way (freshly baked samples) or two-way (frozen samples) ANOVA, was performed using Statistica 7.0 (StatSoft, Inc., Tulsa, OK). Differences at the level of p < 0.05 were considered significant. In this case, comparisons of the samples were performed using a Duncan’s test. Finally, principal component analysis (PCA) was applied to analyze the contribution of all the parameters examined in the overall quality of the samples.
Results and discussion
Breadmaking potential—Freshly baked samples
The main attributes studied in freshly baked samples
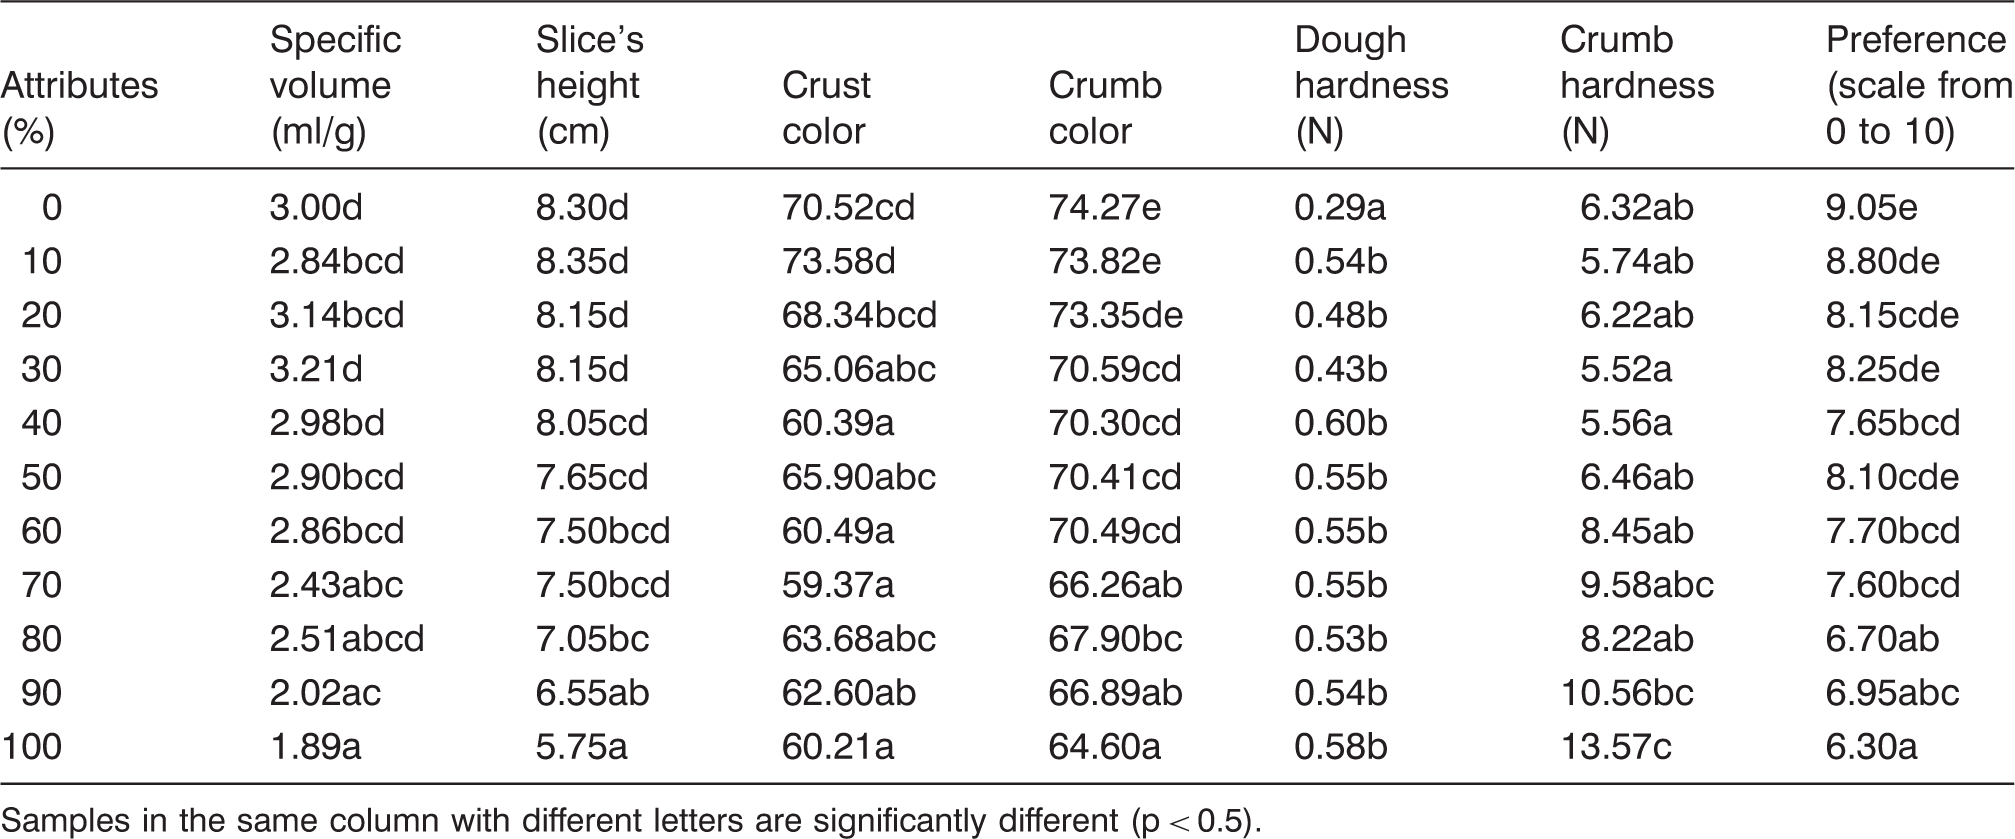
Samples in the same column with different letters are significantly different (p < 0.5).
More specifically, results presented in Table 1 show that the addition of spelt flour significantly increases dough’s hardness irrespectively of the rate of the addition. Although spelt flour exhibits higher protein content (15.17% versus 11.58% for wheat) than wheat flour, their mixtures have inferior breadmaking quality and provide harder, stickier, and less elastic dough, as confirmed in a previous study (Frakolaki et al., 2018). As a result, final products possess less porous and denser structure.
From the results of this study, it is concluded that an increase in the percentage of spelt flour leads to the progressive significant decrease (p < 0.05) of the final product’s specific volume. More specifically, samples with 70–100% spelt flour exhibited the lowest volume. Thus, by using spelt flour at a substitution level not exceeding 60%, breads with satisfactory volume expansion can be produced. At higher proportions, spelt gluten, being weaker, predominates and forms a less resistant and elastic network. As a result, less gas will be retained in the dough’s network and the final volume will be lower. These findings are confirmed by several researchers who observed that bread made only from spelt flour exhibits lower volume than common wheat bread (Bojňanská and Frančáková, 2002; Bonafaccia et al., 2000; Pruska-Kedzior et al., 2008; Schober et al., 2002; Zanetti et al., 2001). Kohajdová and Karovicová (2008) also found that an increase in the proportion of spelt causes a progressive decrease in bread’s specific volume, respectively.
Slices’ width is not significantly changed as spelt flour’s percentage increases, while height progressively decreases. More specifically, the impact of spelt flour on samples’ height, which becomes perceptible when added at proportions over 40% and even more intense at the highest proportions (90–100%), may be attributed to the differences in the gluten quality between the two flours (Frakolaki et al., 2018).
Crust color also progressively acquires darker brown shades as spelt flour is added to the formula at proportions above 30%. At the level of 70% and above, these changes are clearly evident so that the existence of spelt is apparent. The darker color is mainly attributed to the whole meal spelt flour that is darker by nature in color and exhibits higher fiber and bran content, unlike wheat flour, that is white. Additionally, it contains more easily hydrolyzed starch resulting in high sugar production that can participate in Maillard reactions or can be caramelized during baking, providing a characteristic brown color at the sample’s crust (Purlis, 2010). Crumb color is influenced in the same manner as crust color, as the spelt flour proportion is increased. Abdel-Aal et al. (1997), reported that spelt bread has darker crumb and crust color than common wheat bread, and Kohajdová and Karovičová (2007) claimed, as well, that an increase in the spelt flour ratio makes both crust and crumb color darker.
Samples’ sensory characteristics are affected by spelt flour’s percentage in the recipe, likewise; more specifically, assessors prefer samples with low to intermediate proportions (0–50%) of this flour. It appears that they like samples with sensory characteristics similar to those of common wheat bread. Abdel-Aal et al. (1997) evaluated the sensory characteristics of spelt bread with moderate scores, while Bojňanská and Frančáková (2002) showed that the acceptability of spelt breads in the sensory test was satisfying.
Water activity does not exhibit important variations; all aw values are similar and above 0.92. Dough volume expansion, weight loss during baking, and bread crust hardness did not show any significant changes among the different proportions.
The PCA was performed in order to comprehensively examine the contribution of all the parameters investigated. In the current study, two components were selected to describe the breadmaking process, as they explain 77.5% of the total variance. According to the loadings plot for components 1 and 2 (Figure 1), the most important parameters influencing the performance of freshly baked samples were slice’s height, specific volume, crumb color, and preference (positively) and crumb hardness (negatively).
PCA loading and cases plot for components 1 and 2 in freshly baked samples. Parameters coding is as follows: W. loss for weight loss, Spec. vol. for specific volume, Cst color for crust color, Cmb color for crumb color, W. act. for water activity, D. exp. for dough volume expansion, Pref for preference, S.W. for slice’s width, S.H. for slice’s height, D. Hard for dough hardness, Cst Hard for crust hardness, and Cmb hard for crumb hardness. The percentage in the samples refers to spelt flour ratio.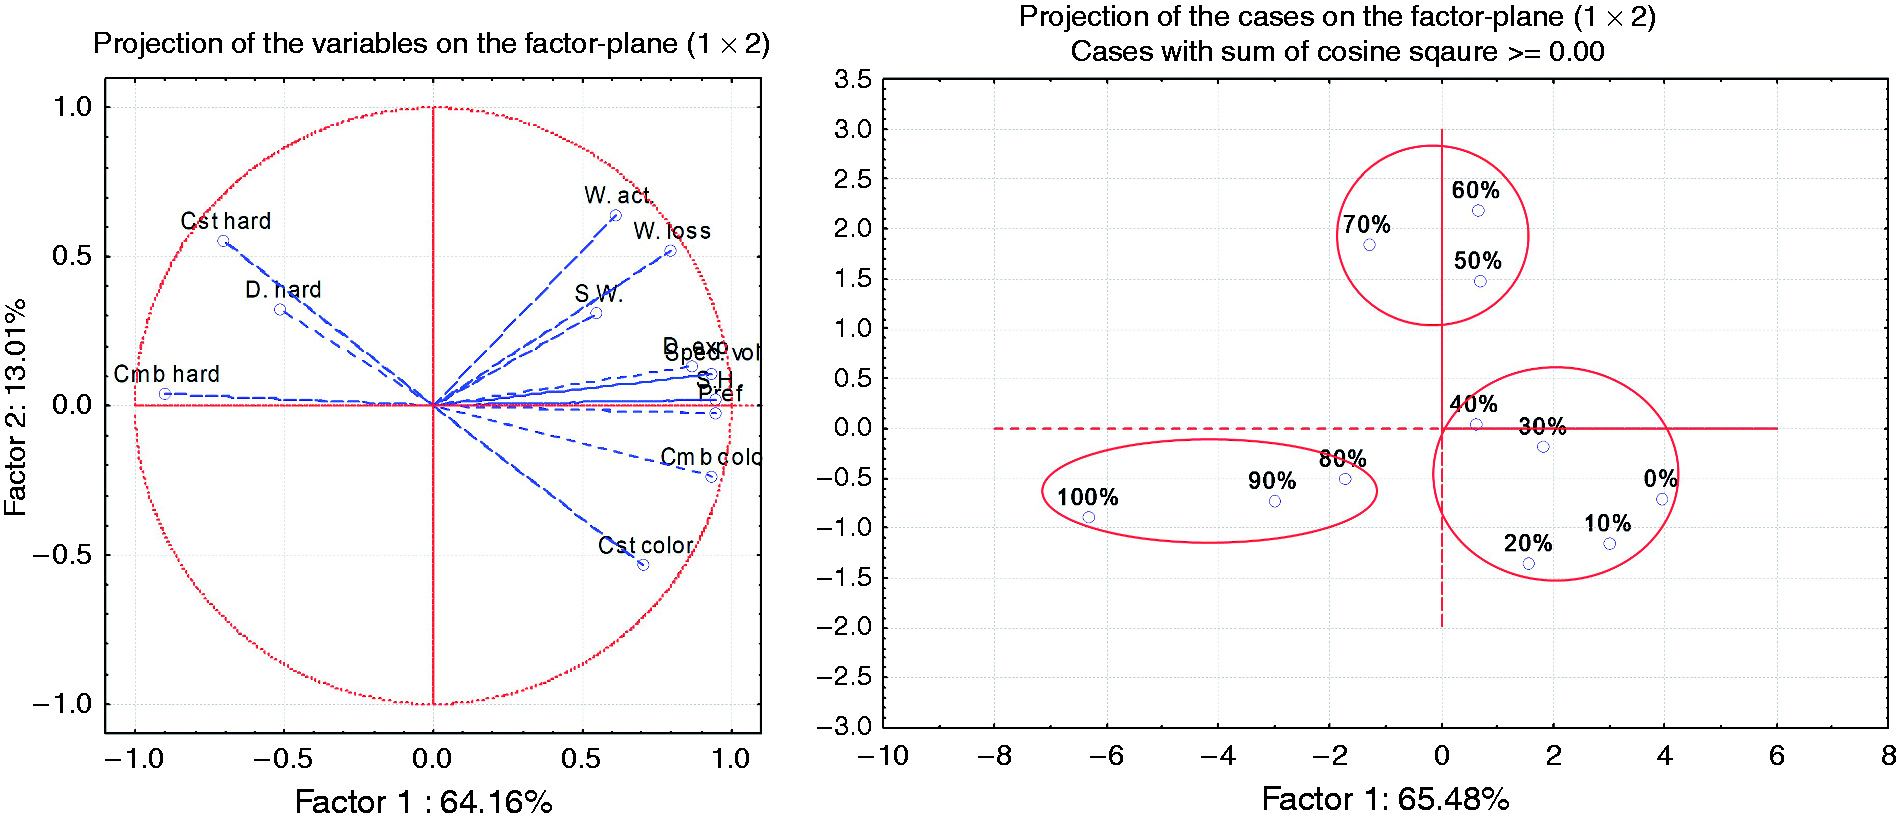
In the cases plot (Figure 1), samples in the first group (a) have the lowest spelt flour ratio (0, 10, and 20%, followed by samples with 30 and 40%) and exhibit similar properties, such as higher bread volume expansion, lighter crumb color, softer crumb texture, and superior sensory characteristics.The second group (b) consists of samples with moderate spelt flour ratios (50, 60, and 70%). These present intermediate crumb hardness, as well as specific volume, slice’s height, and preference values. The presence of spelt flour is evident in these samples and, thus, they exhibit decreased acceptance. They also present higher weight loss during baking. The last group (c) consists of samples with high spelt flour proportions, namely 80, 90, and 100%, which present the highest crumb hardness and lowest specific volume expansion, slice’s height, and preference values. This may be due to their high fiber content and their restricted volume expansion. These samples were also significantly darker in color and gathered the lowest scores during the sensory evaluation.
Breadmaking potential—Frozen samples
The main attributes studied on frozen samples
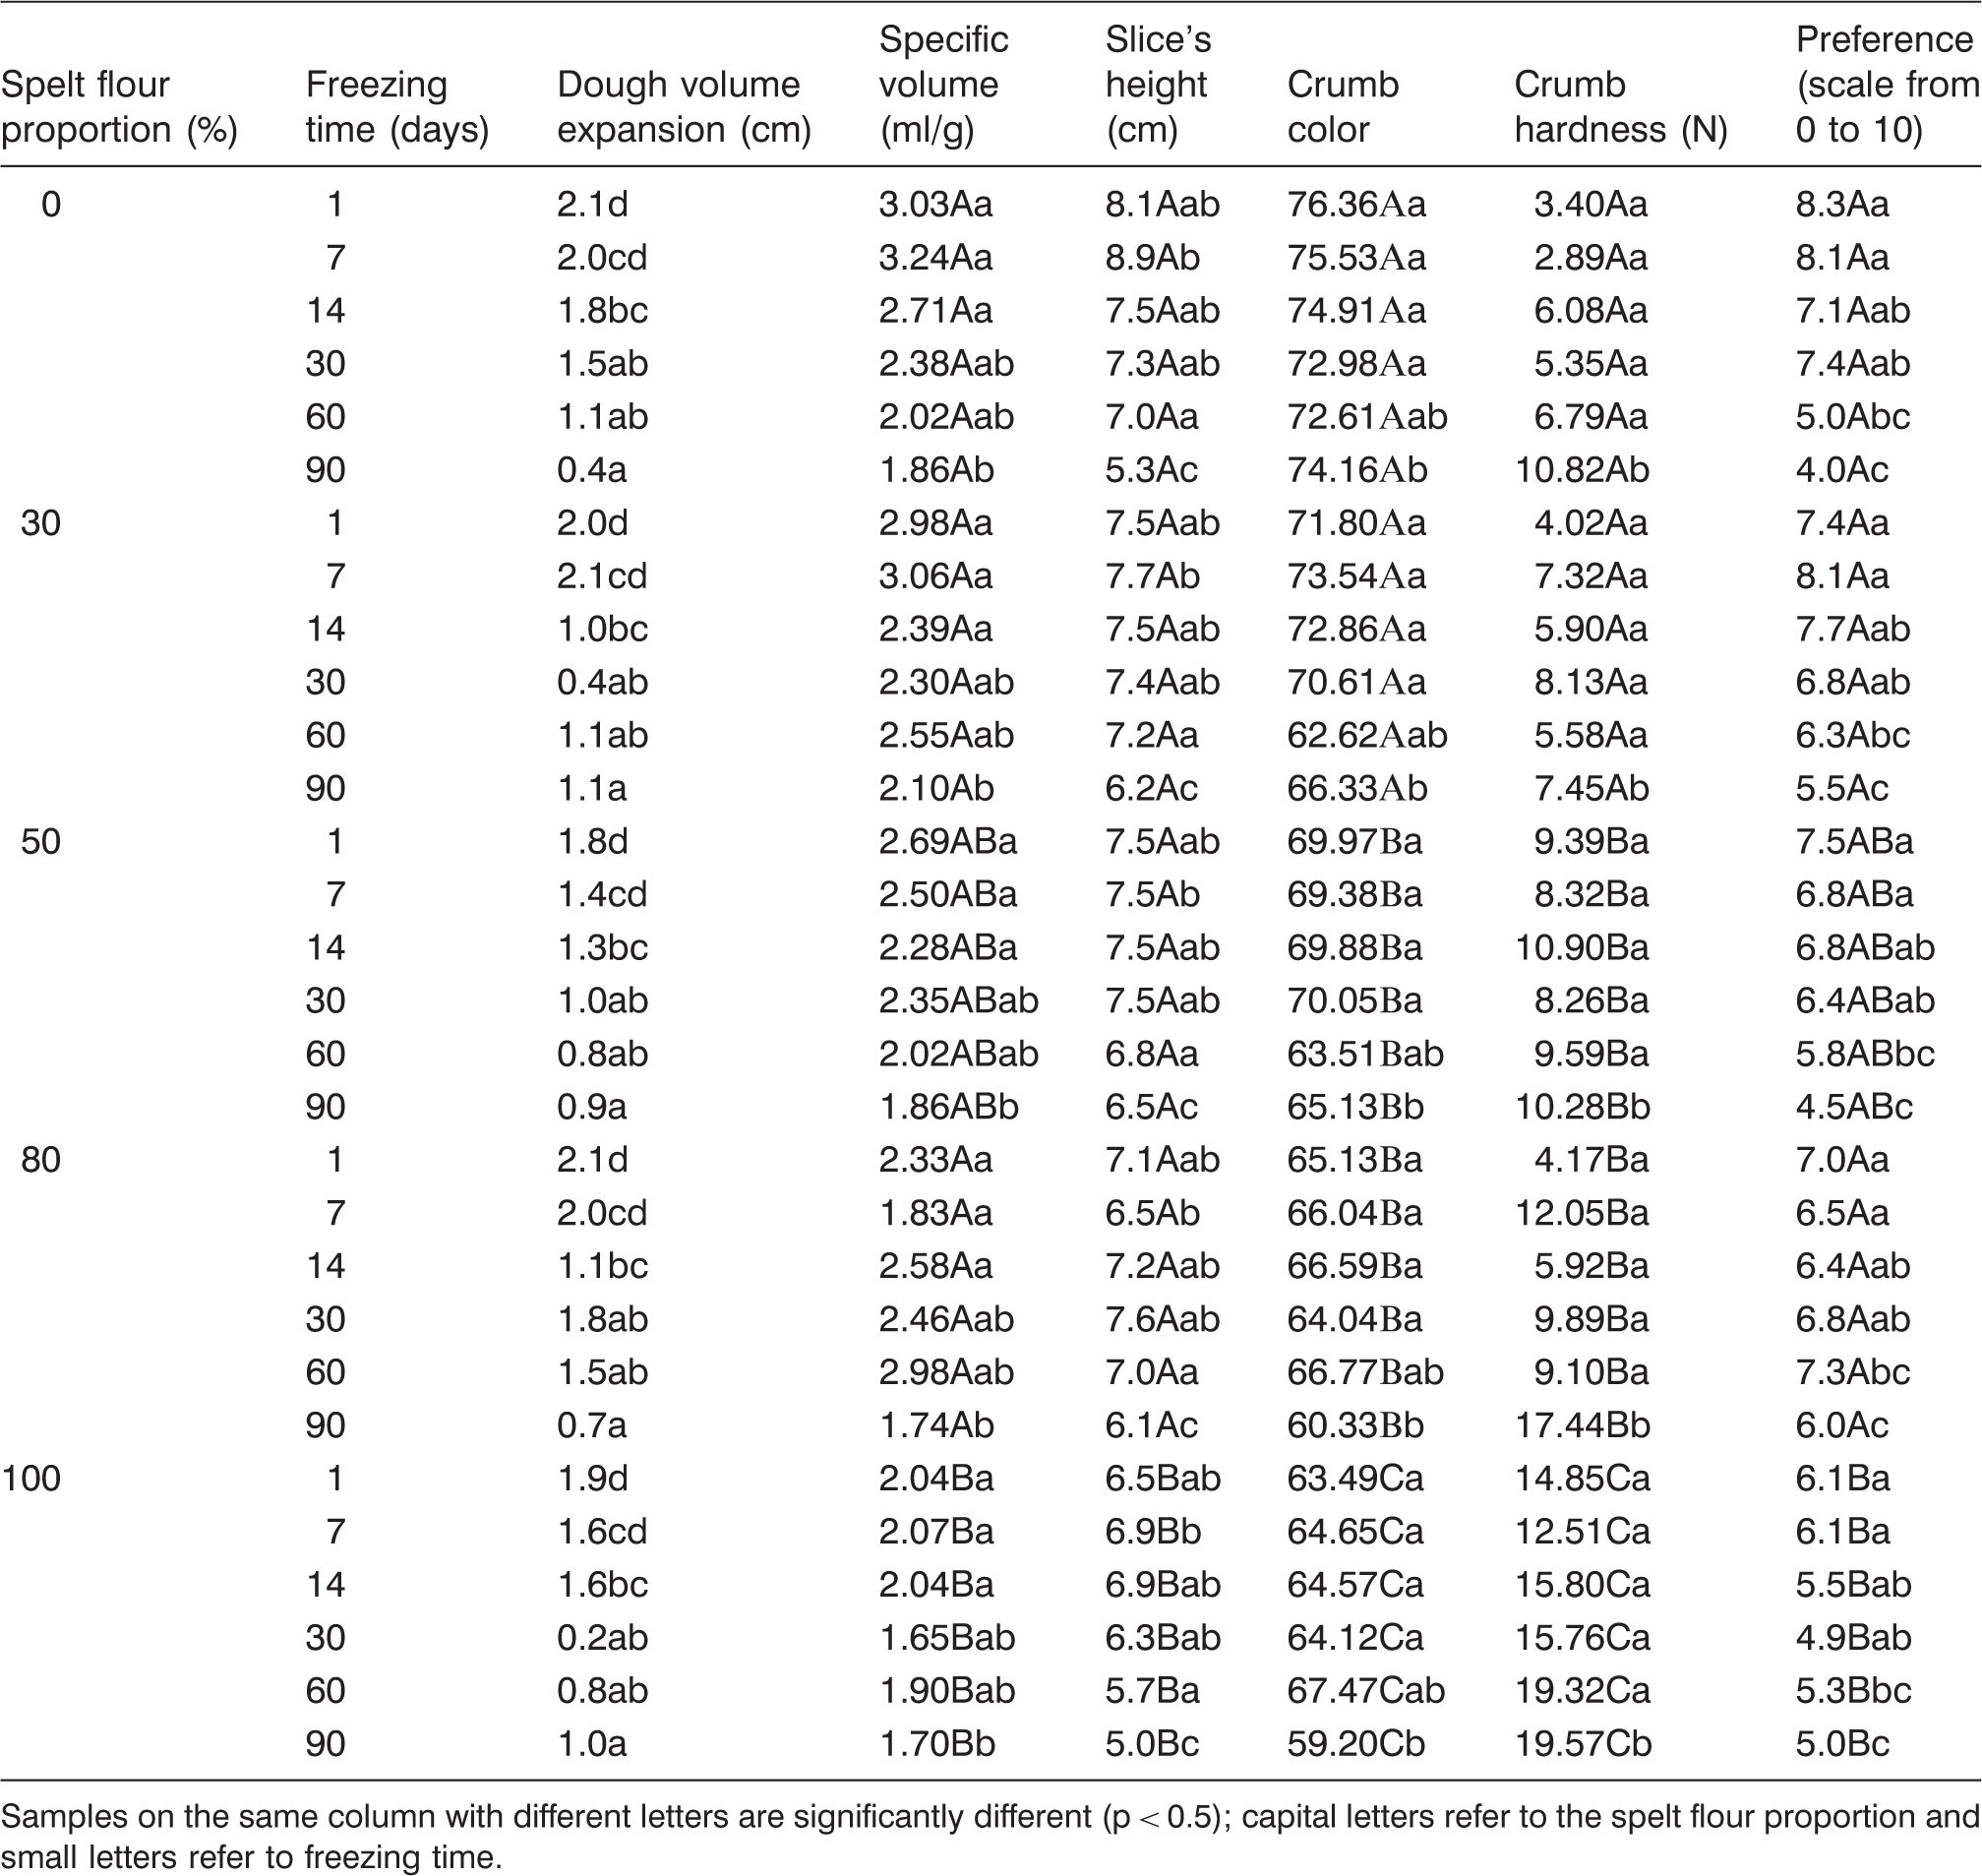
Samples on the same column with different letters are significantly different (p < 0.5); capital letters refer to the spelt flour proportion and small letters refer to freezing time.
Moreover, bakery products made exclusively from wheat flour exhibit the highest decrease rates (80.95% for dough volume expansion and 38.61% for bread volume expansion), while samples made exclusively from spelt flour show the lowest decrease rates (47.37% for dough volume expansion and 16.67% for bread volume expansion) from all the samples as well as smaller differences in specific volume among the various proportions. Bread slices exhibit variances in their height during frozen storage, in contrast to their width. As the frozen storage time and the spelt proportion increase, the height is progressively decreased (p < 0.05). Samples with 100% spelt flour exhibit significantly lower height than other samples, while no meaningful discrepancies exist among the rest samples. Significant decrease in slice’s height in samples stored under freezing for three months is also observed.
Unlike crust color, crumb color is significantly affected by both frozen storage time and spelt flour proportion (p < 0.05). Color differences are higher after the first month of frozen storage. Moreover, bakery products with 100% wheat have the lighter color and differ considerably from the other products that progressively get darker, as it was also observed in fresh samples.
As far as the crumb hardness is concerned, it was increased during frozen storage, as well as with spelt flour addition (p < 0.05). Frozen storage time had a significant effect on samples’ hardness within the three months of storage that may be due to water loss during storage, leading to drier final products (Bárcenas and Rosell, 2006; Eckardt et al., 2013).
With regard to sensory evaluation, prolonged frozen storage leads to lower preference levels of products by assessors. Additionally, taking into account that samples with 100% spelt flour exhibited significantly lower scores than the rest, it can be concluded that bakery products with high spelt content, especially when stored under freezing for a prolonged period, are not particularly acceptable as they present inferior quality and sensory characteristics.
Among the parameters examined, as also observed in fresh samples, water activity did not show significant variations while all the values recorded were comparable and above 0.92. The same trend was observed during frozen storage for dough and crust hardness, weight loss during baking, slice’s width, and crust hardness and color.
The PCA was also performed in the case of frozen stored samples. As shown in Figure 2, the most important parameters affecting their performance were specific volume, slice’s height, preference (positively), and crumb hardness (negatively). As shown in the cases plot (Figure 2), samples with the minimum spelt ratio (0 and 30%) which were frozen stored for one or seven days exhibit the highest specific volume, slice’s height, and preference as well as lightest crumb color. These characteristics are both attributed to their scarce spelt content and the short frozen storage period. In this case, phenomena such as denaturation of glutenin molecules or release of reducing substances that weaken the dough are still limited (Giannou and Tzia, 2007). Wheat samples (0%) stored for 14 and 30 days also present high values in the above-mentioned parameters.
PCA loading and cases plot for components 1 and 2 in frozen samples. Parameters’ codes are as follows: W. loss for weight loss, Spec. vol. for specific volume, Cst color for crust color, Cmb color for crumb color, W. act. for water activity, D. exp. for dough volume expansion, Pref. for preference, S.W. for slice’s width, S.H. for slice’s height, D. Hard for dough hardness, Cst Hard for crust hardness, and Cmb hard for crumb hardness. The percentage in the samples refers to spelt flour percentage and “d” to days of storage under freezing.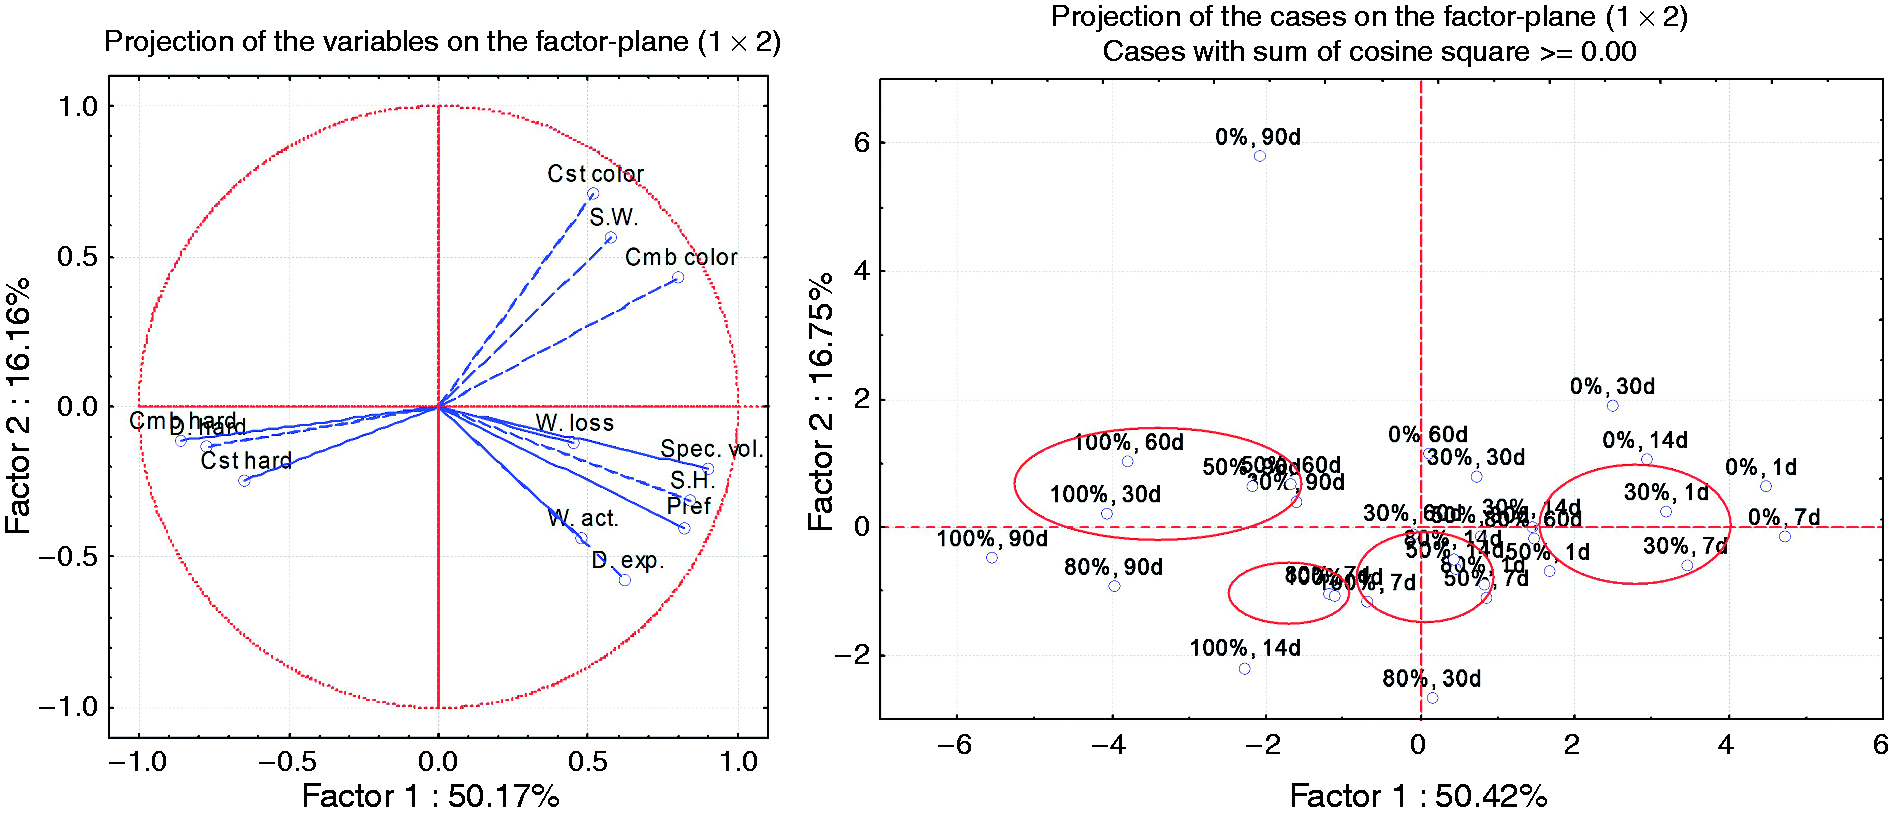
On the contrary, samples containing 100% spelt flour and samples with 80% spelt, stored under freezing for a prolonged time, are characterized by limited volume expansion ability, significantly decreased expansion and higher dough, crumb and crust hardness compared to the rest. Finally, samples with 30% spelt stored for more than two weeks under freezing, samples with 50% spelt, and samples with 80% spelt stored up to two months present intermediate values for almost all parameters examined. More specifically, they present moderate specific volume, slice’s height, and crumb hardness and mediocre preference.
Conclusions
In conclusion, bakery products with spelt flour proportion up to 20% exhibit quality and sensory characteristics similar to common wheat bakery products and are particularly acceptable by consumers. Products with spelt flour proportion between 30 and 60% appear slightly degraded, still remaining highly acceptable, while the presence of spelt flour in proportions greater than 70% leads to products with inferior quality and sensory features. In order to prolong their shelf life, dough samples can be stored under freezing conditions for up to three months without significant alterations in their qualitative characteristics.
Footnotes
Declaration of conflicting interests
The author(s) declared no potential conflicts of interest with respect to the research, authorship, and/or publication of this article.
Funding
The author(s) received no financial support for the research, authorship, and/or publication of this article.