
Abstract
The goal of this study is to advance the teaching and learning of uncertainty in conceptual design. The central research question is: Can a data-driven conceptual design course improve students’ ability to reason about aleatory and epistemic uncertainty? To investigate this, two aims were pursued: (1) constructing a data-driven conceptual design course with implementation and evaluation strategies, and (2) designing an educational flow that supports students’ engagement with uncertainty through structured tasks. Nine frameworks, grouped into five categories and supported by three discipline-based education research fields, were defined to ground the study and provide a foundation for addressing the research question. Using the backward design, a comprehensive conceptual design course was proposed, aligned with relevant ABET competencies and complemented by an educational flow and an educator's guide containing theoretical preparation materials, implementation tools, recommended programming libraries, and guidance for undergraduate and graduate-level instruction. A case study, based on bicycle frame design, demonstrated practical implementation through image preprocessing, dimensionality reduction, and clustering. The course was further contextualized to illustrate the applicability across multiple STEM fields, including mechanical, electrical/computer, and biomedical engineering. Overall, this study contributes a generalizable teaching-learning-assessment construct for supporting uncertainty reasoning in advanced engineering design courses.
Introduction
Background
The conceptual design phase is crucial in engineering as it shapes foundational system attributes and determines their potential success. Decisions during this early stage inherently involve considerable uncertainty due to incomplete information about future operational contexts, technological interactions, and evolving stakeholder requirements (Phillips et al., 2025). Recent studies show the need to integrate uncertainty management into the conceptual design process. For instance, Ruiz-Pastor et al. (2022) emphasized novelty and circularity assessments but notably omitted uncertainty considerations. In contrast, data-driven and simulation-based methods have emerged to systematically tackle uncertainty, as seen in Bertoni (2023), who introduced discrete event simulations to create mathematically derived merit functions, thereby replacing subjective evaluations with quantifiable, scenario-based insights. Data-driven techniques that incorporate uncertainty enable users to move beyond subjective decisions (such as intuition) and make their design-related selections more explainable and interpretable (Hüllermeier & Waegeman, 2021).
Uncertainty may manifest in various forms during the conceptual design phase. For example, people may perceive the same information differently, which can cause uncertainty in design communication (Zeng, 2016). Ekwaro-Osire et al. (2016) indicated that although sketches are useful communication tools during the conceptual design phase, the lack of information and clarity may increase the uncertainty associated with them. Their paper calculated the probability of importance first and then used Shannon's entropy to quantify and handle the uncertainty with the help of the previously acquired probability-based metric. While this study primarily focused on sketches of a helicopter, Cruz-Lozano et al. (2017) implemented a similar approach on bicycle sketches. Although uncertainty is embedded in methods such as entropy and Wasserstein distance, the existing studies typically do not use it as a criterion (explicitly) in conceptual design selection. Incorporating uncertainties into this process can open an avenue to express the limits of the results obtained, making them comparable and, thus, placing them into perspective (Phillips et al., 2025).
In today's world, where data is constantly changing in form and access, engineers play a dual role of both producers and consumers (Fielding et al., 2025). Data is now beyond being simply numbers, which are categorically classified (e.g., labeled and unlabeled), and stored in static spreadsheets. Although the continual collection of data lends it a dynamic characteristic, this also brings the risk of data measured from different sources (e.g., text, images, and audio) being imprecise, incomplete, or erroneous (Gafny et al., 2025). In this context, students should learn how to handle this messy and unstructured data for critical judgment. For example, both textual information (dimensions) and images can be utilized to describe the same engineering design. However, not every data may be as important as another in decision-making (Mueller et al., 2024). This opens an avenue to address the uncertainty surrounding the data (and the final design) as each source of data has varying degrees of reliability (Matthews, 2011). Therefore, this new era regarding dynamic data requires a change in curricula and pedagogical strategies so that students can understand how to approach, make sense of, and utilize data (Fielding et al., 2025). A new term, data-ing, has been introduced to address this issue (Gafny et al., 2025). Data-ing is the process of preparing (or preprocessing) the relevant data for analysis and decision-making by organizing it, extracting useful information (i.e., features or variables) from unstructured data, and visualizing it effectively. Ultimately, teaching the concepts of data and data-ing can give students a better understanding of data and better prepare them for real-life scenarios where they may face more complex (and non-routine) problems than in college.
Uncertainty is ubiquitous in the engineering design practice (Zeng, 2016). Still, the current curricula center on a deterministic point of view in design-related courses based on the assumption that everything can be modeled perfectly with utter precision (Du, 2014). Although educators highly value providing the correct answer (proven to be true) to their students, uncertainty is obscured in engineering design itself (Gafny & Ben-Zvi, 2023). For example, (1) the randomness in operational conditions, (2) piece-to-piece alterations in dimensions and materials, (3) lack of knowledge (assumptions), and (4) manufacturing imprecision are primary sources of uncertainty in design (Du, 2014; Osmond & Tovey, 2015). Engineering education should reflect this uncertain nature, allowing students to understand a non-deterministic (e.g., probabilistic) perspective that enables them to handle uncertainties in practice. Overlooking the probability concept may result in overly conservative or risky designs, leading to catastrophic consequences in safety-critical applications (Redström, 2020). Therefore, bridging the gap between probability theory and real-world engineering problems is paramount. Du (2014) emphasized the significance of teaching uncertainty in higher education. The study also highlighted barriers in the current curriculum, including the lack of teaching materials and the missing connection between classroom teaching and industrial practices. In the context of a data-driven course, introducing both epistemic (model-related) and aleatory (data-related) uncertainty is significant in developing a more mature and balanced perception of uncertainty. Improving the students’ ability to reason about uncertainties will prepare them for real-life problems, as real life is stochastic, not deterministic (Hüllermeier & Waegeman, 2021).
Students trained in transdisciplinary problem-solving may be able to tackle society's significant challenges (Bammer et al., 2023). In earlier literature, transdisciplinary problem-solving has also been referred to as convergence, team science, integration and implementation sciences, and interdisciplinary. Three universities have integrated the expertise in transdisciplinary problem-solving into the undergraduate curriculum, namely, (1) Leuphana University in Lüneburg, Germany, (2) the University of Technology in Sydney, Australia, and (3) the Australian National University in Canberra, Australia. The latter university defined and utilized six characteristics of transdisciplinary problem-solving, namely, integrative, interactive, change-oriented, systemic, pluralistic, and context-based. Bammer et al. (2023) proposed three learning outcomes for each of the six characteristics. For example, one of the three learning outcomes for pluralism was: upon successful completion of the course, students will have acquired the skill and knowledge to communicate the epistemological differences of disciplines used to solve a societal problem.
Research Thrust
The conceptual phase of engineering design has a significant influence on the final product's performance, yet it often relies on intuition and subjective qualitative judgment. Beyond the perspective that more data leads to better results, students should learn how to draw a meaningful conclusion from the data (Fielding et al., 2025). Still, the current curriculum documents are unable to meet this requirement (Gafny et al., 2025). Through a developed course, learning how to make sense of data (data-ing) and to utilize data-driven methods will equip students to solve non-routine problems, which is essential for future engineers (Northcutt et al., 2021). Supporting the theoretical background with data-driven implementations is crucial, as most programs prioritize deliverables more than skill development (Huang et al., 2024). Proposing an uncertainty-based conceptual design course will enable students to learn about the appropriate data types for design, process them to derive meaningful information (i.e., data-ing), and create designs with awareness of epistemic and aleatory uncertainties.
The way practitioners balance uncertainty and certainty defines the engineering design process. The key reason for this is that values and knowledge are not always identical in the real world (Phillips et al., 2025). Uncertainty associated with knowledge encompasses a wide range of possible interpretations, including unknown (maybe unknowable) or unpredictable (Hall, 2010). Keeping this in mind, the current educational system desires to teach knowledge, which has proven true (certain) (Gafny & Ben-Zvi, 2023). Although classes on uncertainty have been offered in a promising number of engineering programs, a significant gap still exists between engineering classrooms and reality (Du, 2014). Teaching design classes from a deterministic perspective creates the illusion in students that, in real life, there will always be a deterministic output for a given deterministic input. However, incorporating uncertainty while selecting the best possible conceptual design can create room for making the decision-making process comparable and putting it into perspective (Regenwetter et al., 2023). The lack of an educational flow that supports students’ engagement with uncertainty through course tasks motivates the present study to fill this gap and enhance the current mainstream in teaching uncertainty (Kok, 2022) in conceptual engineering design.
The goal of this study is to advance the teaching and learning of uncertainty in conceptual design. To this end, the following research question was formulated: “Can a data-driven conceptual design course improve students’ ability to reason about aleatory and epistemic uncertainty?” The following two specific aims were pursued to answer this question: (1) construct a data-driven conceptual design course with implementation and evaluation strategies, and (2) design an educational flow that supports students’ engagement with uncertainty through course tasks.
This paper presented the development of 1) a data-driven conceptual design course aimed at equipping engineering students with the skills to apply data-driven techniques in conceptual design under uncertainty and 2) an educational flow which was designed to support student engagement by first establishing foundations for data-driven design, then addressing uncertainty, incorporating data analytics, and concluding with methods for interpreting and drawing conclusions from results. This results in an advanced design course defined with clear learning outcomes, and followed by a structured case study that supports its implementation. It is integrated into the broader engineering curriculum to align with existing design education goals, and assessment and evaluation methods are applied to measure student performance and learning effectiveness. To reinforce the connection between theory and practice, a case study was included to demonstrate how the proposed course structure and skills can be applied to a real-world engineering design problem, highlighting both practical outcomes and student learning experiences.
The structure of the rest of the paper is as follows: Section 2, Methodology; Section 3, Results and Discussions; and Section 4, Case Study.
Frameworks
Frameworks were used to define, frame, and ground this study (Magana, 2022), and they furthermore provided the foundation for the research question. This informed the two specific aims, namely, the design of the course and the educational flow. The five categories of frameworks used in this study are illustrated in Figure 1, which includes the theoretical framework, conceptual framework, methodological framework, pedagogical framework, and evaluation framework.
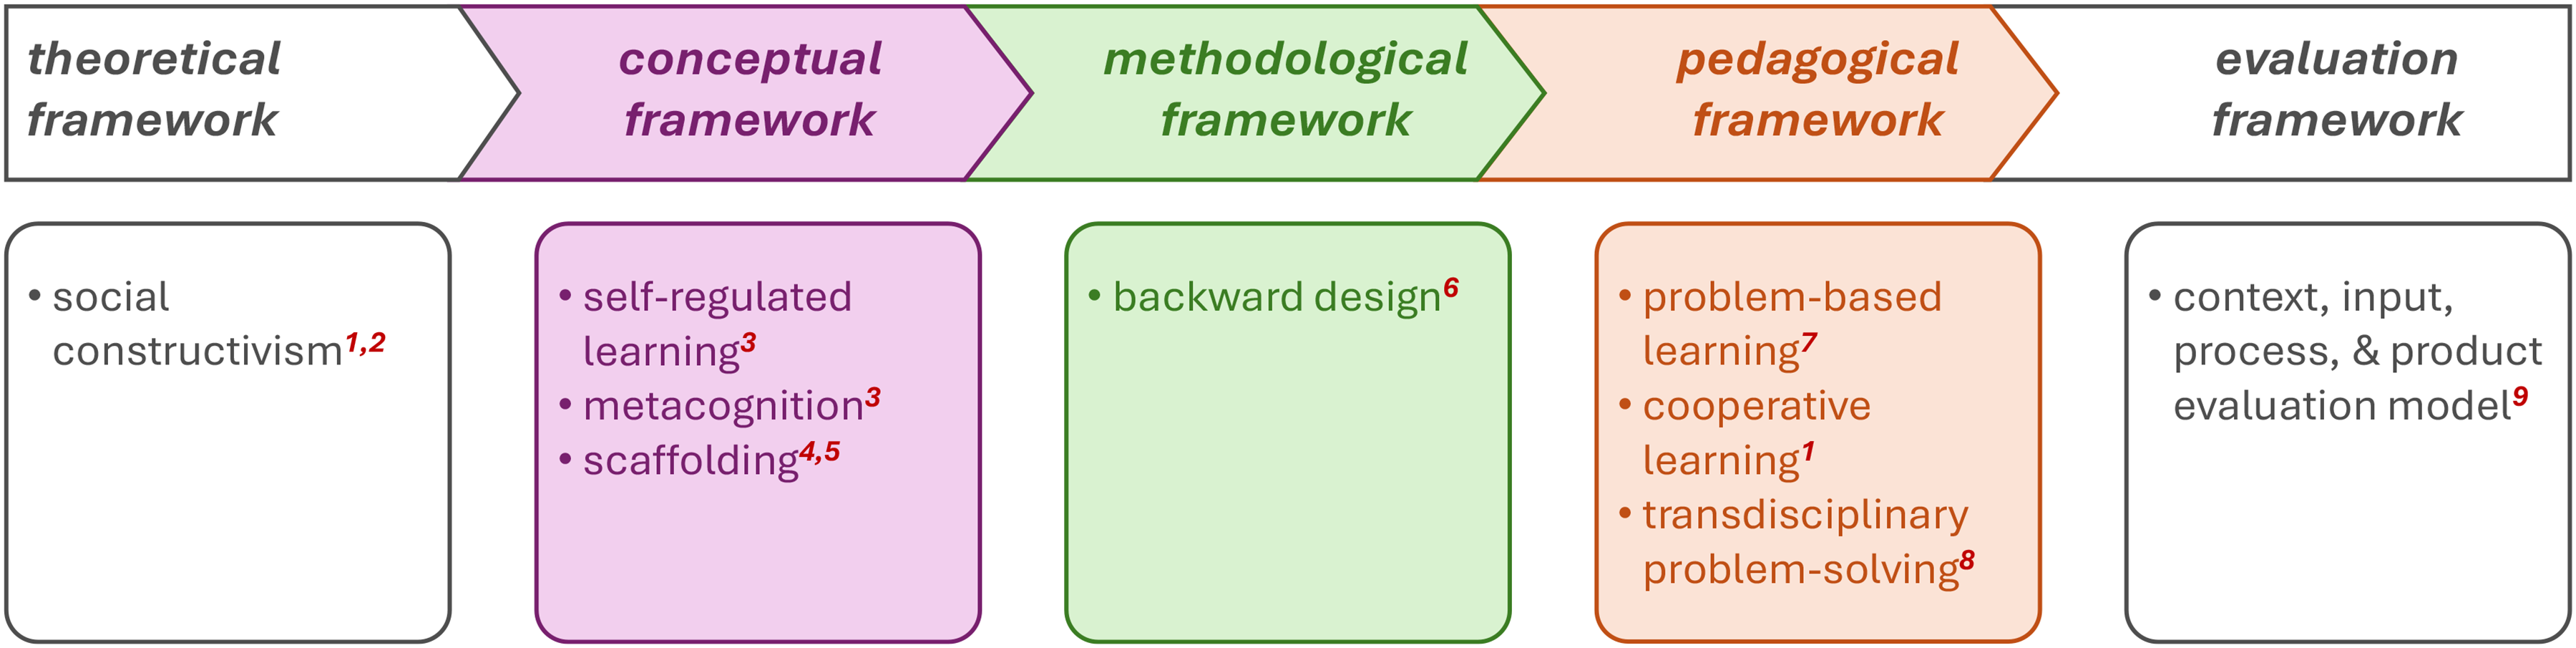
The theoretical, conceptual, methodological, pedagogical, and evaluation frameworks employed in this study. Notes: 1Magana et al., 2022; 2Rodriguez et al., 2023; 3Sabel et al., 2017; 4Magana et al., 2024; 5Zhang et al., 2025; 6Liao & Ringler, 2023; 7Chen et al., 2021; 8Bammer et al., 2023; and 9Magana, 2022.
Based on situated learning theory, the process of learning occurs when individuals interact in a (socially) collaborative context and utilize their skills and knowledge to solve a problem while working together (Magana et al., 2022). With this perspective, this study adopts social constructivism as its theoretical framework, considering that it proposes a team-based design course on the data-ing and uncertainty that requires transdisciplinary problem-solving. Social constructivism is a theoretical framework in which knowledge is actively and continuously shaped through collective observations (Rodriguez et al., 2023).
Building on it, a conceptual framework composed of three core frameworks, namely, (1) self-regulated learning, (2) metacognition, and (3) scaffolding (Sabel et al., 2017). In this respect, self-regulated learning refers to the situations where students actively control their own learning by monitoring themselves and providing self-feedback to adjust their learning strategies. Metacognition, on the other hand, involves a student's awareness of their own learning process (Sabel et al., 2017). Finally, scaffolding refers to a strategy where an educator initially (temporarily) helps students learn a new skill and then withdraws this support, allowing students to become more independent (Magana et al., 2024). Within this conceptual framework, students start their learning process with a pre-existing idea and progress to a revised one or completely new ideas through the support they receive from both internal (e.g., self-reflection) and external (e.g., attention to prior ideas) factors (Sabel et al., 2017; Zhang et al., 2025).
The backward design constituted the methodological framework of this study's Specific Aim #1. Briefly, it introduces an idea where the educator plans a course by primarily focusing on the learning outcomes (i.e., knowledge, skills, and behaviors that students will acquire at the end of that course) (Liao & Ringler, 2023). In this respect, methodological frameworks provide guidelines on how to apply a method (Magana, 2022). Pedagogical frameworks, on the other hand, are crucial for the design and delivery of instruction. The present study employed a pedagogical framework that consisted of (1) problem-based learning (Chen et al., 2021), (2) cooperative learning (Magana et al., 2022), and (3) transdisciplinary problem-solving (Bammer et al., 2023) to improve students’ learning. Project-based learning has been employed in engineering education for decades, with its benefits in improving students’ transferable skills and academic achievements (Chen et al., 2021). Cooperative learning refers to a scenario where the students work together to achieve a common goal (Magana et al., 2022). Then, transdisciplinary problem-solving is the final component of the pedagogical frameworks used in this study. It is fundamental in equipping students with the skills and knowledge necessary to communicate the epistemological differences between disciplines (Bammer et al., 2023). These three frames, constituting the pedagogical framework, were selected for teaching and enhancing student learning, as the present study proposes a team-based design course where the students from different engineering disciplines team to solve a common problem through a given capstone project. For student assessment, a “context, input, process, and product evaluation model,” as suggested by Magana (2022), was adopted as the evaluation framework.
Methodologies
Data-Driven Conceptual Design Course
The present study employed the backward design to develop a data-driven course on uncertainty. In this regard, (1) learning outcomes (skills students should have at the end of the course) were identified first, (2) assessment and evaluation schemes were identified based on learning outcomes, (3) then assessment instruments were developed, (4) frameworks and discipline-based education research fields to be used in the course were selected, and (5) a roadmap, that integrated some of the educational frameworks and data-driven design, was developed. This approach is fundamental in achieving the shift from subject-centered to student-centered pedagogies, thereby facilitating students’ learning (Fielding et al., 2025; Gafny et al., 2025). Integrating uncertainty into the engineering education model helps enhance the classical pedagogical approaches (Liao & Ringler, 2023), contribute to teaching methodologies, and prepare the students for today's transdisciplinary world.
Educational Flow That Supports Students’ Engagement
The methodology for creating an educational flow that supports students’ engagement was broken down into a structured sequence that balances the progressive development of student skills with meaningful deliverables, as recommended in the literature. According to Fazelpour et al. (2025), effective design education must ensure that students not only acquire theoretical knowledge but also demonstrate their learning through applied outcomes. This balance was central in structuring the educational flow into four stages or skillsets: (1) foundations for data-driven conceptual design, (2) uncertainty, (3) data analytics, and (4) results and conclusions. Each stage progressively builds students’ capabilities, moving from conceptual understanding to applied problem-solving, while ensuring that learning outcomes are linked to concrete deliverables such as case studies, analyses, and design proposals.
The selection of topics within each stage reflects both established practices in engineering design education and the growing role of data in modern design contexts. Du (2014) highlights the core concepts traditionally emphasized in design courses across top U.S. universities, such as conceptual design, problem-based learning, and transdisciplinary problem-solving. These elements form the foundation of the first stage, ensuring students understand the context and challenges of design. The subsequent stages build upon these foundations by incorporating data-driven perspectives, guided by Reddy's (2011) instructional work on applied data analysis. This reference provided the methodological grounding for integrating topics such as data preprocessing, feature engineering, dimensionality reduction, and probabilistic modeling, which are essential for equipping students to address uncertainty in real-world design problems.
Case Study
To illustrate the proposed concept of data-driven conceptual design in relation to the four-stage educational flow, this study presented a generalized roadmap for classifying and evaluating the uncertainty of conceptual design selections, using bicycle frames. Frame designs were categorized into four types based on geometry/application, guided by engineering principles related to structural performance.
The proposed method involved preprocessing of bicycle frame images, reducing dimensionality with a variational autoencoder (VAE) and a principal component analysis (PCA), and applying Gaussian mixture models (GMM) for probabilistic clustering. Uncertainty was quantified using log-likelihood values obtained from the clusters’ GMMs. Furthermore, a sensitivity analysis was performed to determine the optimal size of the training dataset. This was done by calculating the entropy metric used to assess classification confidence. This approach enabled conceptual design analysis and uncertainty estimation that can be applied to other symmetric or image-representable engineering components.
Results and Discussions
Data-Driven Conceptual Design Course
The resulting data-driven conceptual design course is depicted in Figure 2, anchored in (1) frameworks and discipline-based education research fields, (2) case study, (3) adoption level, (4) design education units, (5) learning outcomes, and (6) assessment and evaluation.
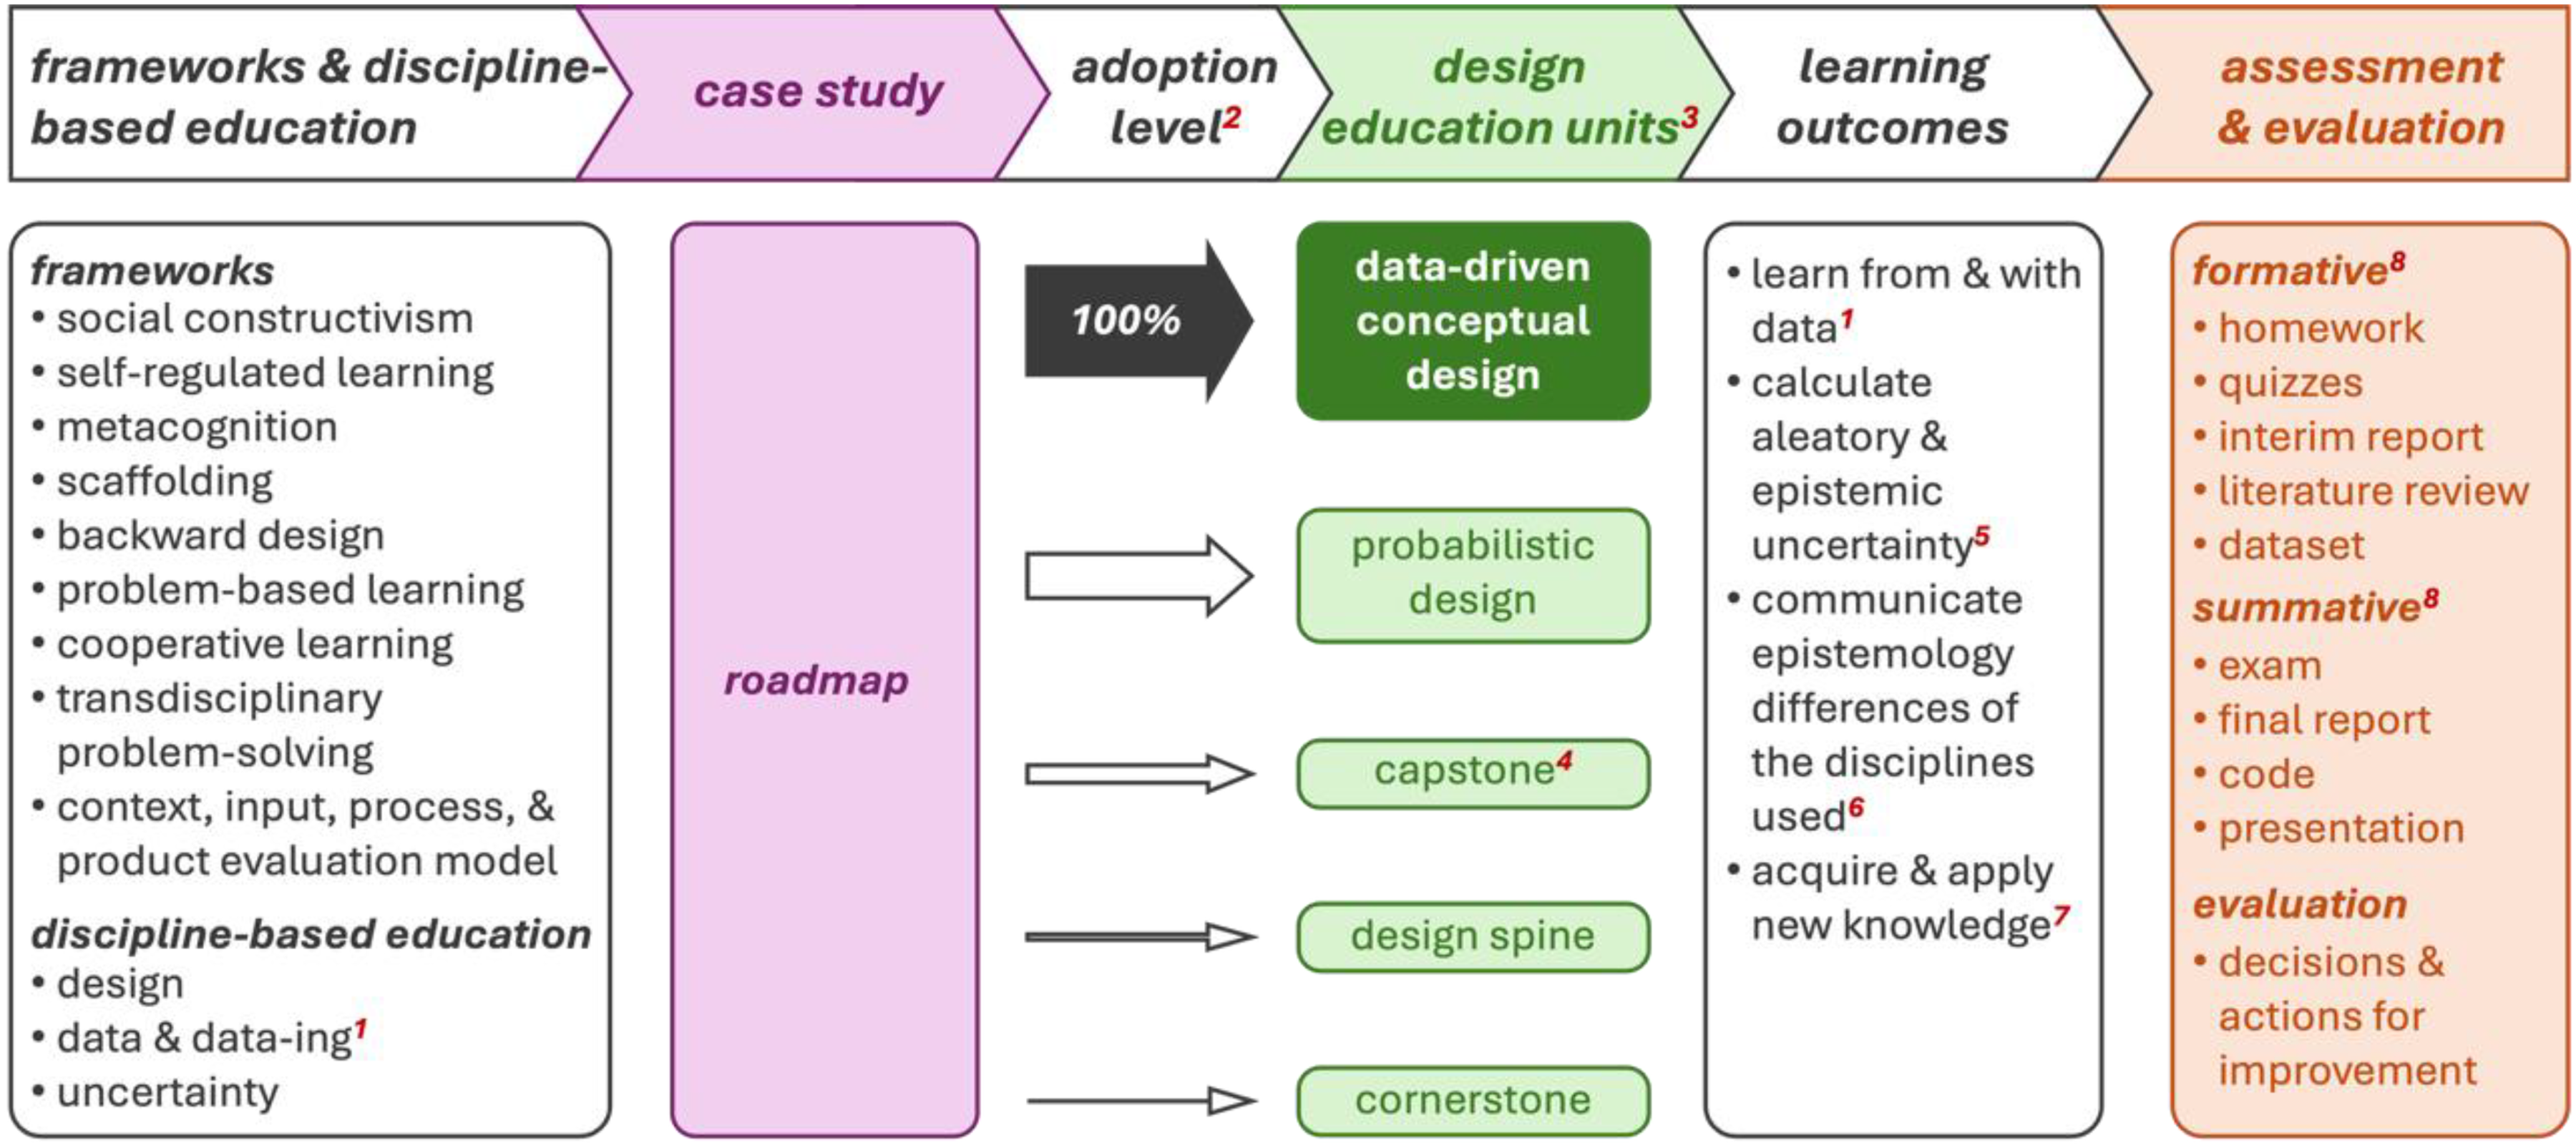
Data-driven conceptual design course. Notes: 1Fielding et al., 2025; 2Level of content adopted; 3Data-driven conceptual design (second graduate-level); probabilistic design (first graduate-level); capstone (culminating design experience); design spine (Mid-program); cornerstone (first year of program); 4Four of the seven ABET outcomes Met (Rees Lewis et al., 2023); 5Hüllermeier & Waegeman, 2021; 6Bammer et al., 2023; 7ABET Outcome #7 (ABET, 2024); 8(Fazelpour et al., 2025).
Four learning outcomes were established:
learn from and with data: Students learn from and with data by working directly with real-world design datasets, gaining experience in preprocessing, feature extraction, and interpreting data-driven structure to inform conceptual design decisions (Fielding et al., 2025). calculate aleatory and epistemic uncertainty: They calculate aleatory and epistemic uncertainty through hands-on modeling tasks that require computing likelihoods, entropy metrics, and uncertainty estimates, enabling them to distinguish how randomness and knowledge gaps influence design confidence (Hüllermeier & Waegeman, 2021). communicate epistemology differences of the disciplines used: Students communicate and justify their modeling choices in reports and discussions, comparing how fields such as engineering design, mathematics, and computer science define and interpret uncertainty results (Bammer et al., 2023) acquire and apply new knowledge: This is ABET's Outcome #7 acquired by navigating open-ended design tasks, selecting tools, exploring literature, and adapting methods, thus developing the independent adaptive learning skills expected of modern engineering graduates (ABET, 2024).
To tie these outcomes back explicitly to ABET competencies—as shown in Figure 2, these four learning outcomes are in addition to the four of the seven ABET outcomes acquired from the capstone education unit (Rees Lewis et al., 2023).
The nine frameworks that guided the development of the course, including teaching and learning, as well as the assessment and evaluation of learning outcomes, are described in Section 1.3, Frameworks. The three discipline-based education research fields used in this study were:
engineering design education (Fazelpour et al., 2025), uncertainty education (Biehler & Pratt, 2012) (also referred to as probability education (Batanero & Álvarez-Arroyo, 2024), and data and data-ing (Fielding et al., 2025) (also referred to as statistics education (Zhang et al., 2025)).
A roadmap was constructed to operationalize the data-driven quantification and visualization of uncertainty in conceptual designs. The roadmap supported the educational flow, scaffolding the students’ engagement with data and uncertainty to yield the four learning outcomes. Although Gray et al. (2022) addressed a different problem, they successfully demonstrated the value of such roadmaps in supporting practitioners in making informed decisions about further assessment and evaluating the reliability of prototype designs.
Most accredited mechanical engineering programs have three kinds of design education units: cornerstone, design spine, and capstone. The capstone usually consists of two semesters of three-credit courses. In these two courses, students are exposed to risk considerations. These two courses are where students experience the culminating design experience, which is a prerequisite for accreditation by ABET (ABET, 2024). In these two courses, four of the seven ABET outcomes are met (Rees Lewis et al., 2023). In some programs, the design spine may also consist of two courses, such as Introduction to Design and Machine Elements. Using a roadmap similar to that employed in the study, one of the authors has developed and taught the graduate course “Probabilistic Design” and the undergraduate course “Mechanical Probabilistic Design” at his university for two decades. The authors’ experience in teaching various design courses is depicted in Table 1. The constructed course, Data-Driven Conceptual Design, will be the fifth graduate-level design education unit.
Authors’ Experience in Developing and Teaching Design Courses.
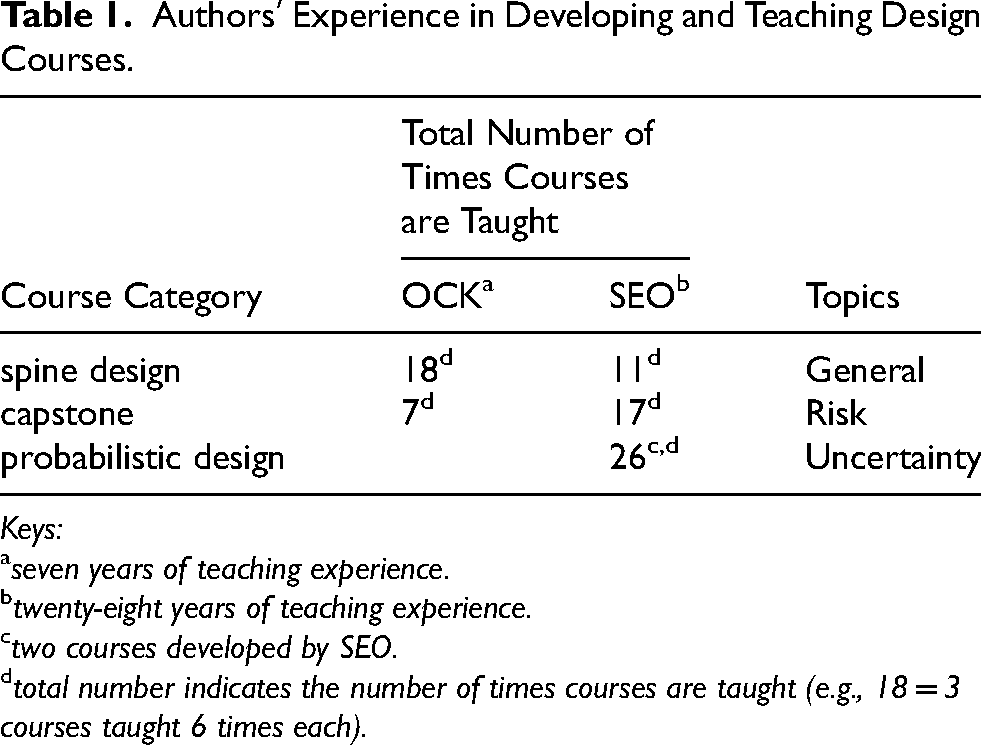
Keys:
seven years of teaching experience.
twenty-eight years of teaching experience.
two courses developed by SEO.
total number indicates the number of times courses are taught (e.g., 18 = 3 courses taught 6 times each).
The learning outcomes are assessed using:
(a) formative assessments
Homework—take-home assessments will be assigned to students to foster continued learning and practice. quizzes—to ensure knowledge is effectively communicated between the educator and the student, quizzes are assigned to the students regularly. interim report—preparing technical documentation at each milestone, ranging from the inception of the assigned project's roadmap to the results and conclusions. literature review—reviewing published journal articles and books that employ data-driven approaches for design concepts. dataset—outsourcing conceptual design datasets such as the BIKED dataset (Regenwetter, Curry et al., 2022) for experimentations and practical applications.
(b) summative assessments
exam—a final evaluation of the student's ability to grasp data learning, uncertainty calculations, and epistemology. final report—a final technical report that encapsulates the assigned project's workflow, which will include the background study, roadmap, results, discussion, and conclusions. code—the program written to execute the roadmap will be reviewed to ensure correctness in terms of the calculations, libraries, and result visualization. presentation—a presentation to summarize the assigned project's discoveries and conclusions will be given by the individual to the educator and fellow students.
Development of assessment instruments enables data collection, the establishment of performance indicators, the execution of evaluations, and the formulation of decisions and actions for improvement.
Finally, a data-driven conceptual design course was constructed with implementation and evaluation strategies. The proposed data-driven design course on uncertainty helps students to develop the knowledge and skills on (1) understanding data and drawing meaningful conclusions from it (data-ing), (2) reasoning and interpreting epistemic (model-related) and aleatory (data-related) uncertainties in the design process, (3) communicating epistemology differences of the disciplines used (Fielding et al., 2025; Hüllermeier & Waegeman, 2021), facilitating the tackling of transdisciplinary problems (Henderson et al., 2025), and (4) acquiring and applying new knowledge (ABET, 2024). The proposed course enables students to enhance their self-paced and personalized learning capabilities, while equipping them with the skills to utilize various data-driven models for design, visualize probabilities in the design space, code, and make uncertainty-informed decisions (Su et al., 2025).
Educational Flow That Supports Students’ Engagement
The resulting four-stage educational flow (depicted in Figure 3) is constituted of: (1) foundations for data-driven conceptual design, (2) uncertainty, (3) data analytics, and (4) results and conclusions. In the following sections, each of these stages is described.
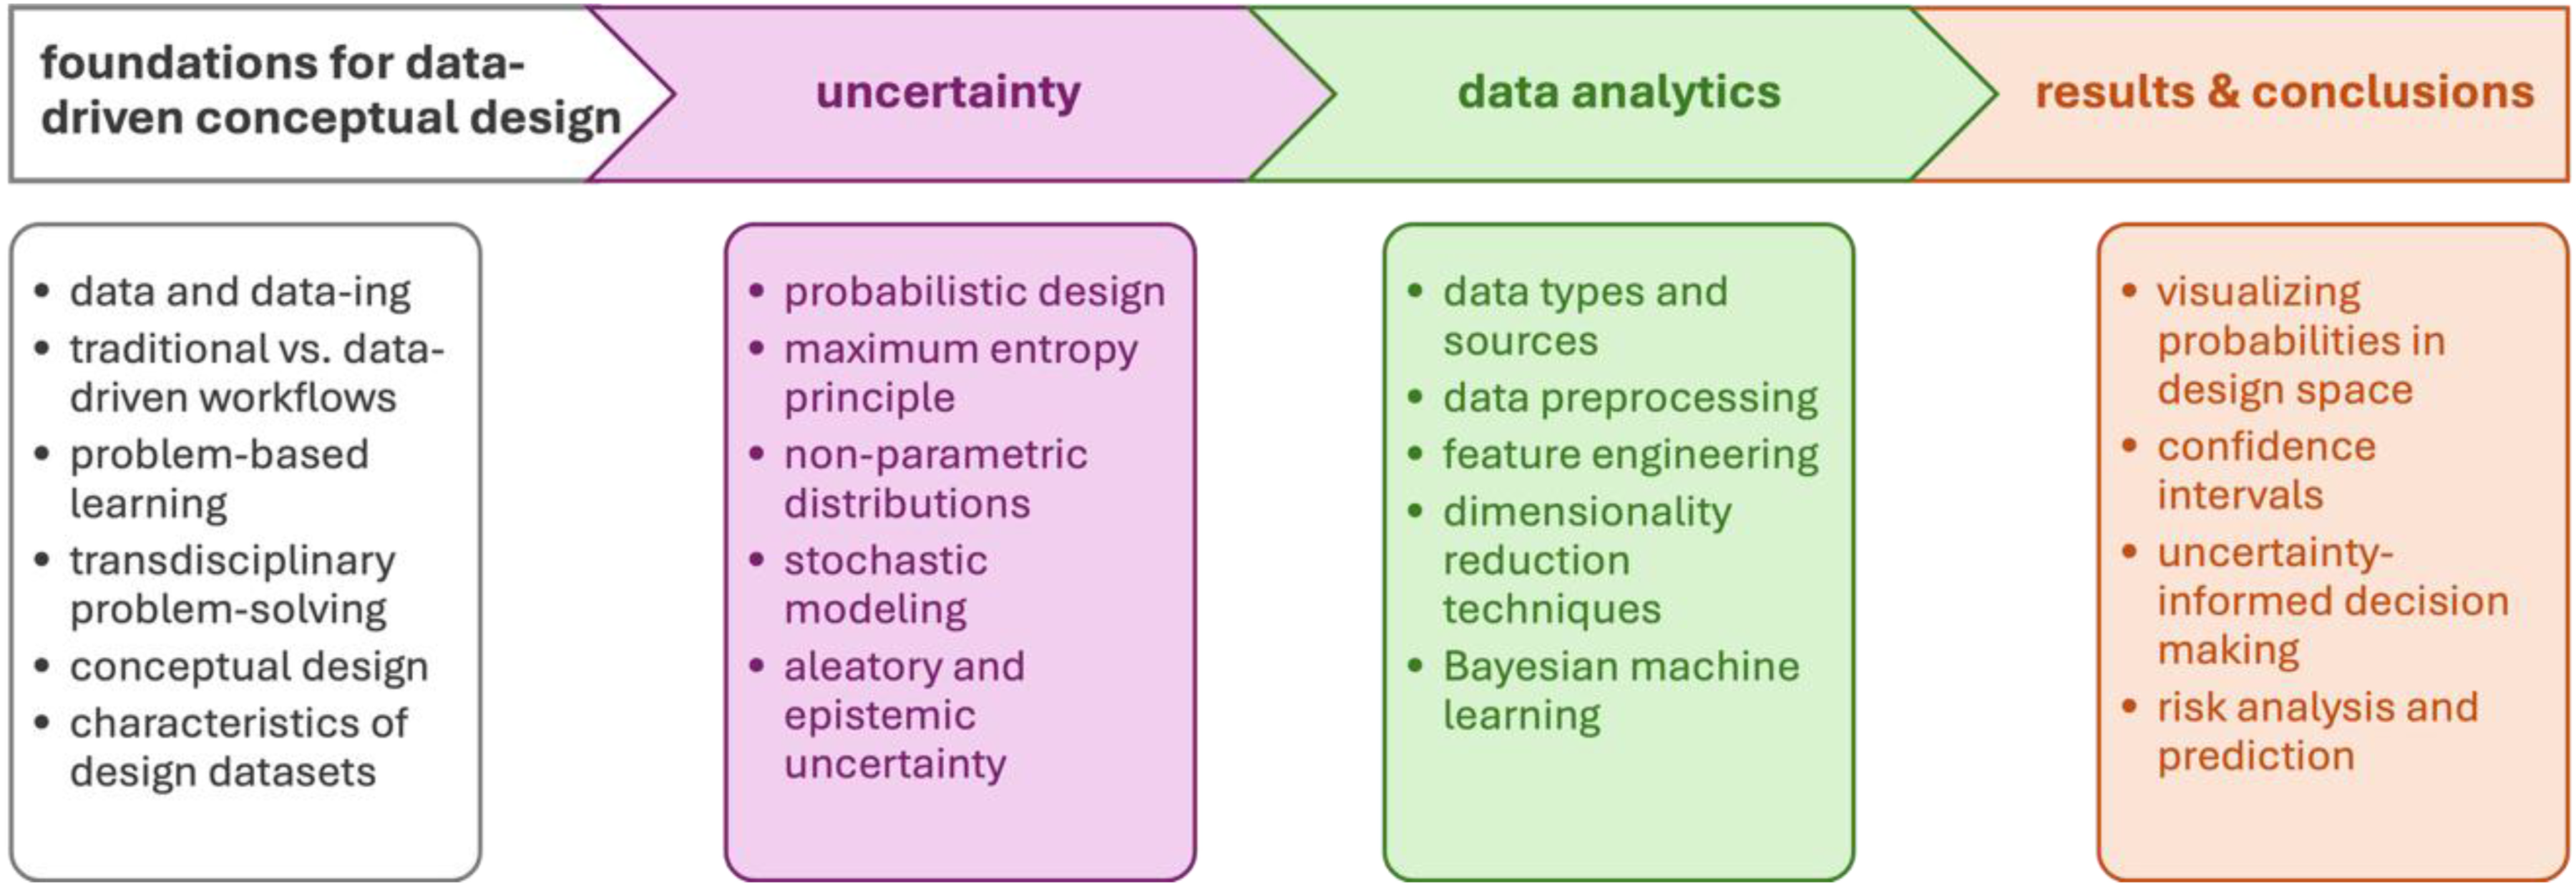
Educational flow that supports students’ engagement with uncertainty.
The foundations and theory for data-driven design were built on the recognition that data and data-ing (the processes of collecting, curating, and interpreting information) play a central role in shaping design decisions (Fielding et al., 2025). Unlike traditional workflows, which relied heavily on expert intuition and sequential processes, data-driven workflows emphasized iterative learning from diverse datasets, enabling more adaptive and evidence-based outcomes. Embedding these practices within problem-based learning frameworks fosters critical thinking by engaging students with real-world challenges, where solutions emerge through exploration and analysis. Moreover, data-driven design thrived on transdisciplinary problem-solving, integrating knowledge from engineering, computing, social sciences, and domain expertise to address complex design contexts. At the conceptual design stage, where ideas were still fluid and uncertain, data-driven methods provided valuable insights by revealing patterns, constraints, and opportunities. Ultimately, the effectiveness of these approaches depended on the characteristics of design datasets (such as their diversity, granularity, and representation), which determined the reliability and creativity of the solutions derived.
The introduction of uncertainty into engineering design naturally led to the concept of probabilistic design. For instance, in designing a cantilever beam, a probabilistic design approach would consider the beam's material properties as random variables. In contrast, in a deterministic design, these properties are treated as fixed quantities. In a probabilistic perspective, the yield strength of the beam would exhibit a distribution of values that can be characterized by a mean and standard deviation, assuming a normal distribution, for instance. At this stage, the student should possess a thorough understanding of probability concepts and be adept at identifying the applications of various probability distributions, such as uniform, normal, Poisson, and exponential distributions, among others (Reddy, 2011, p. 37). It is also crucial to apply methods such as the maximum entropy principle to provide a structured approach for selecting the appropriate probability distribution to model a random variable, while minimizing assumptions (Dias et al., 2019). Alternatively, a data-driven approach involves utilizing non-parametric distributions, which are defined by the data itself, thereby reducing or eliminating assumptions about the overall uncertainty of the design parameter (Elguebaly & Bouguila, 2012). Another key aspect of the uncertainty quantification phase was analyzing the sources of uncertainty itself. This can arise from the data itself, known as aleatory uncertainty, or from the chosen model, referred to as epistemic uncertainty (Valdenegro-Toro & Mori, 2022). By covering these topics, the student will develop a solid understanding of uncertainty in data-driven engineering design.
In this stage, students should develop an understanding of data types and sources, recognizing that design data may come from experiments, simulations, field operations, or expert input. Data can be numerical, categorical, time-dependent, or geometric, and each type carries specific uncertainties such as measurement error, simulation bias, or incomplete knowledge (Regenwetter, Nobari et al., 2022).
The course then addresses data preprocessing, the critical step of preparing raw data for analysis. Students will learn techniques for handling missing or noisy values, scaling variables, filtering signals, and balancing datasets. Proper preprocessing ensures that uncertainties are not amplified and that subsequent analyses yield reliable and interpretable outcomes.
Building on this, students will practice feature engineering, where raw data is transformed into meaningful representations that capture the essence of the design problem. Emphasis will be placed on selecting relevant variables, extracting domain-specific indicators, and generating features that reduce model uncertainty. This step provides the foundation for effective predictive modeling and design interpretation.
Given the high dimensionality of engineering datasets, students will also study dimensionality reduction techniques such as PCA, t-distribution stochastic neighbor embedding, and uniform manifold approximation and projection (Sánchez-Rico et al., 2023). These tools will be used to simplify complex data while preserving essential information, enabling the visualization of design spaces, the identification of clusters or outliers, and a more straightforward interpretation of uncertainty in conceptual design. Finally, introducing Bayesian machine learning, students will explore methods such as Gaussian processes, Bayesian regression, and Bayesian neural networks, with a focus on how these approaches quantify and propagate uncertainty (Chlaily et al., 2023; Rasmussen, 2004).
In this stage, students must learn how to interpret and communicate the outcomes of data-driven probabilistic analyses. Plotting, which involves data visualization, is an essential skill for exploratory data analysis, as it enables a more precise visualization of the trend behavior in the data compared to tabular formats (Reddy, 2011, p. 72). Visualizing probabilities in a design space equips students with techniques to represent likelihoods and uncertainties across multidimensional design variables. For example, probability density plots, contour maps of feasible regions, or scatter plots with uncertainty shading allow engineers to see not only which designs perform well, but also how confident those predictions are. This visualization supports early recognition of robust versus fragile design concepts.
Another critical skill is the exploration of confidence intervals as tools to quantify the reliability of estimated design metrics. Through examples such as presenting the 95% confidence range for fatigue life predictions or aerodynamic drag coefficients, students will practice expressing uncertainty in a way that informs stakeholders without overstating precision (Chlaily et al., 2023). Building on this, the course will introduce uncertainty-informed decision making, where multiple candidate designs are evaluated not just on average performance, but also on their variance and reliability. Case studies may include selecting between two material options where one offers higher average strength but larger variability, while the other offers lower strength with greater reliability. By familiarizing themselves with the application of the maximum payoff criterion in decision trees and Monte Carlo simulation analysis (Reddy, 2011, p. 373), students can apply risk analysis and prediction to engineering scenarios where uncertain outcomes have safety, cost, or performance implications.
Probabilistic design is a central approach that enables the introduction of uncertainty in engineering design. In data analytics, awareness of the inherent uncertainty of the phenomena in this study is fundamental for applying data-driven methods responsibly. The ability to draw conclusions that explicitly account for uncertainty and communicate probabilistic results enhances decision-making in engineering design.
Educator's Guide
To support adoption by other educators, this section provides a practical implementation guide, identifies key preparatory materials, and outlines limitations and mitigation strategies.
As shown in Figure 4, the course was designed as a modular sequence that gradually builds student competence in data handling, uncertainty reasoning, and decision-making under uncertainty, culminating in an open-ended design project known as the “capstone project.” Each module combined theoretical background, practical exercises, and design integration, allowing educators to adapt the approach to different contexts.
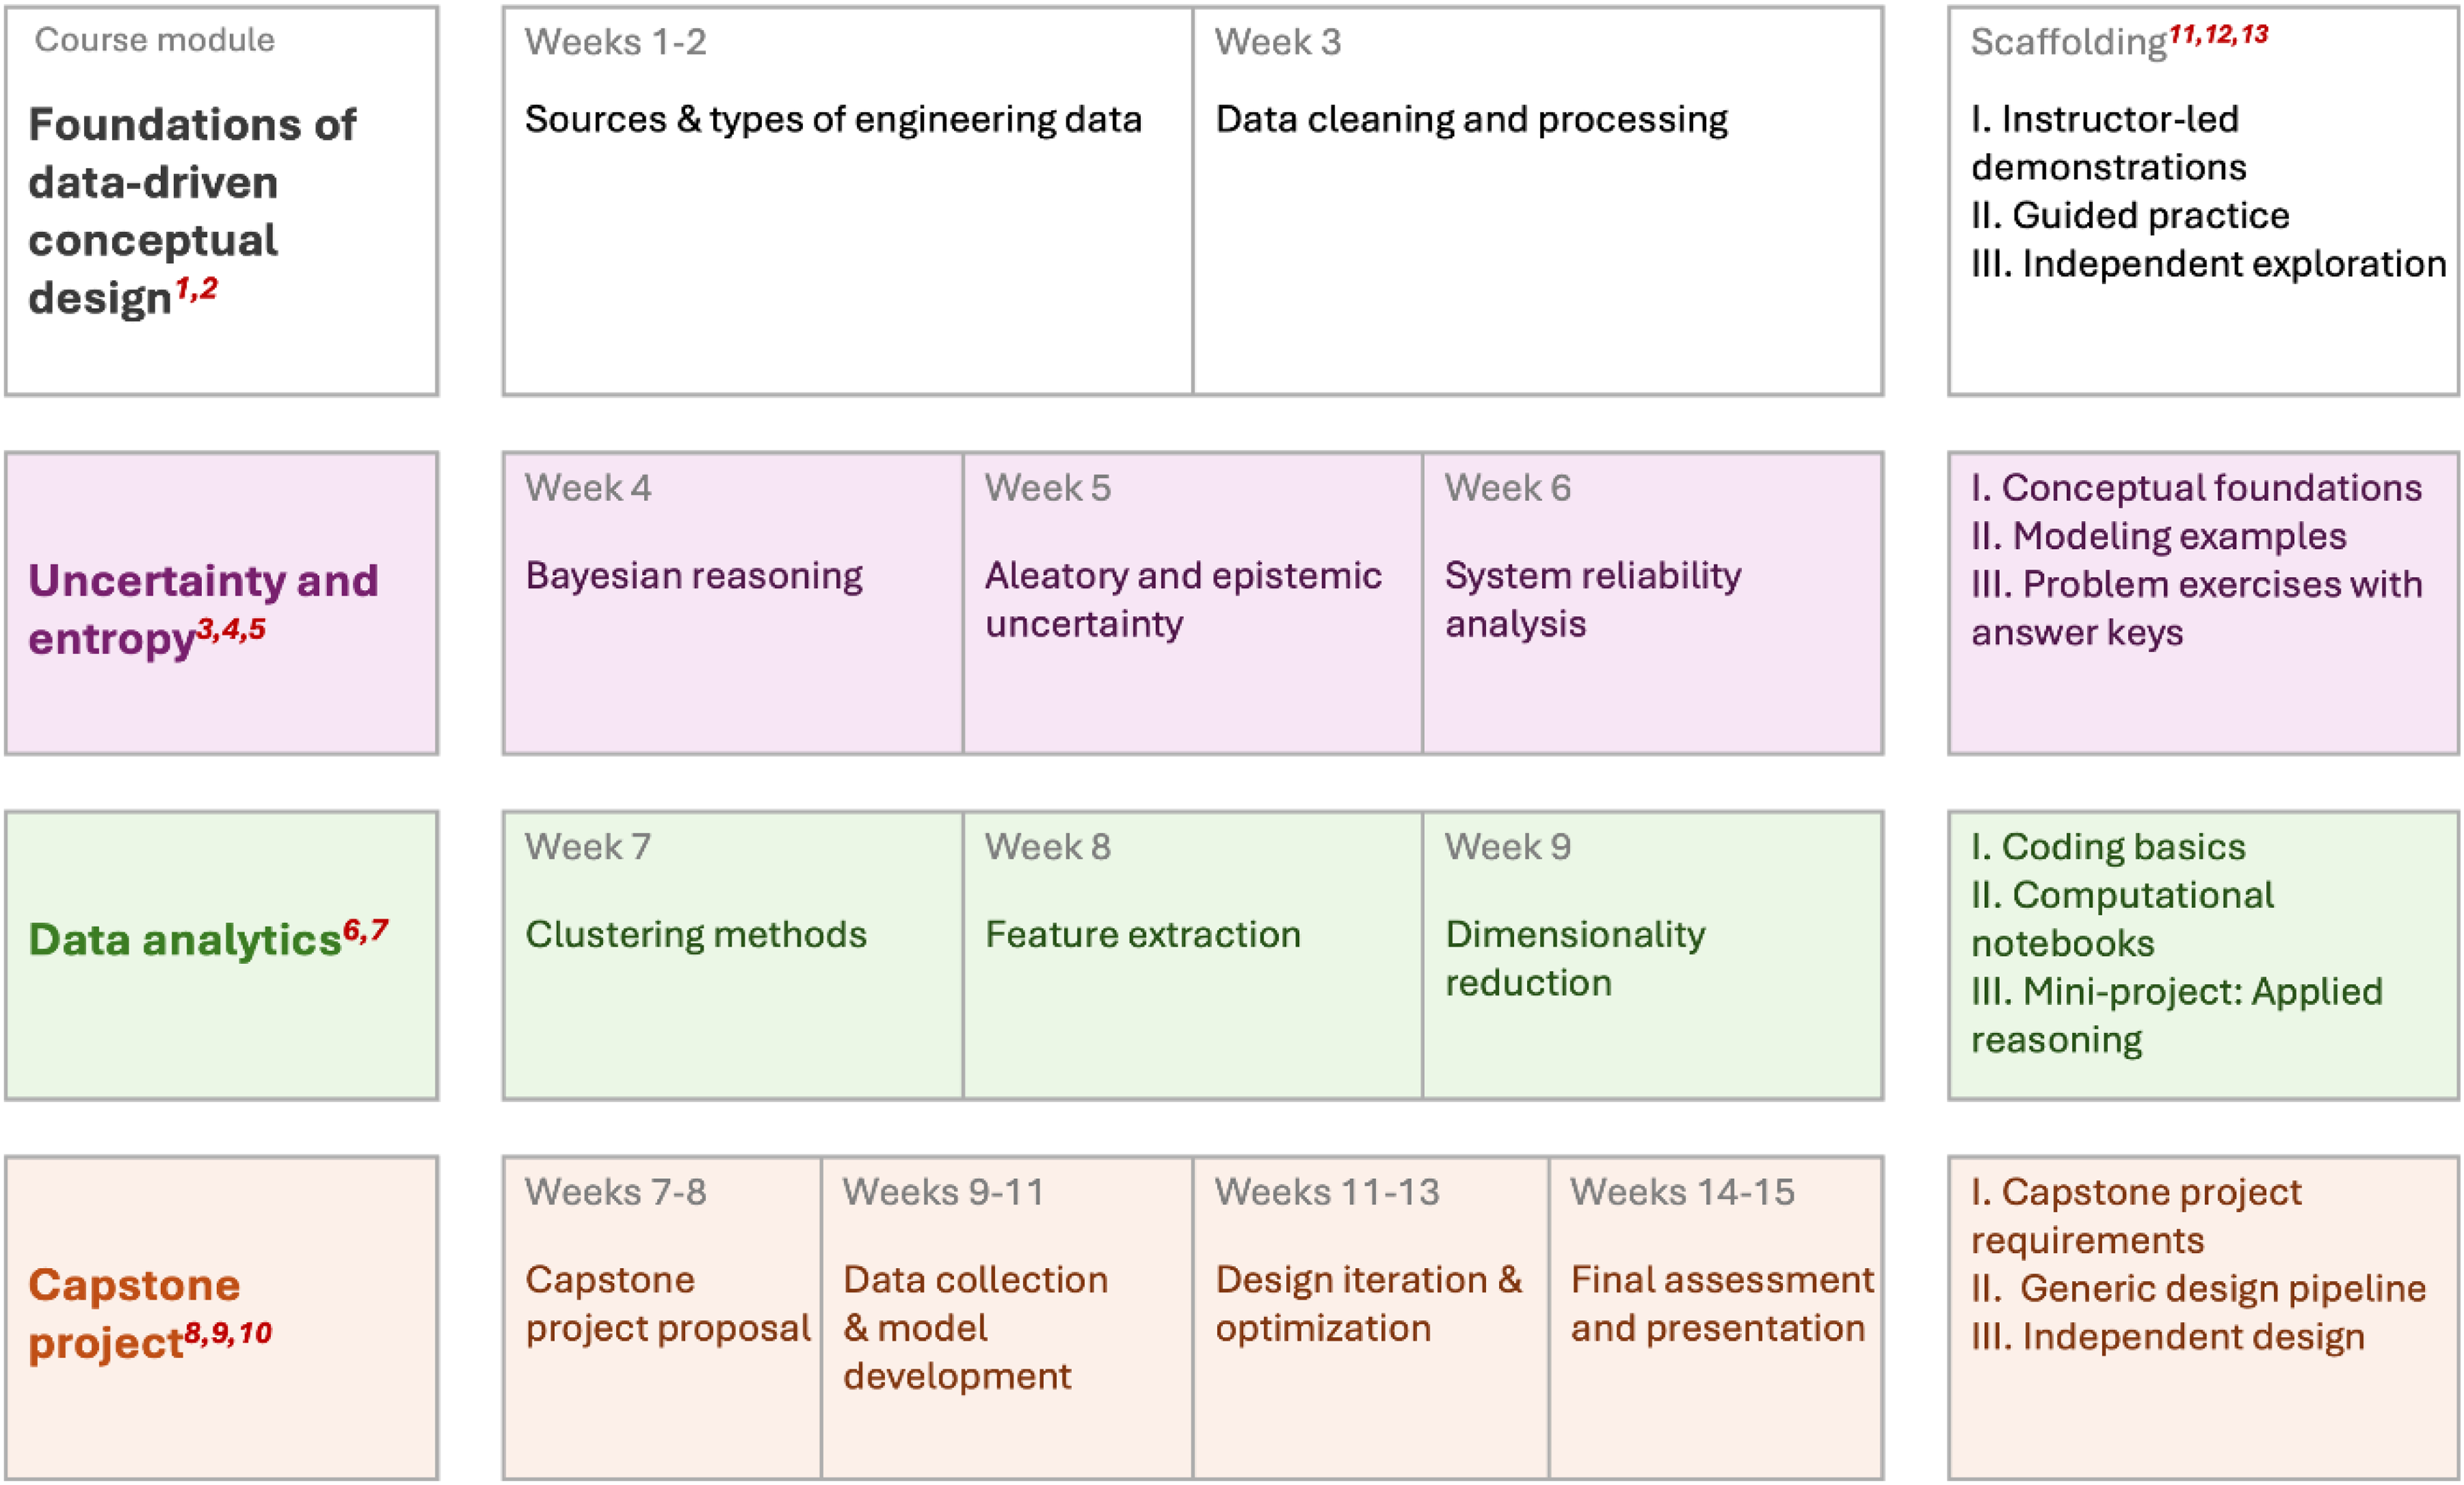
Educator's guide roadmap with scaffolding for the proposed probabilistic design course considering a 15-week semester. Notes: 1Fielding et al., 2025; 2Regenwetter, Nobari et al., 2022; 3Hüllermeier & Waegeman, 2021; 4Valdenegro-Toro & Mori, 2022; 5Batanero & Álvarez-Arroyo, 2024; 6Ling & Weiling, 2025; 7Chandana et al., 2024; 8Cruz-Lozano et al., 2017; 9Du, 2014; 10Fazelpour et al., 2025; 11Magana et al., 2024; 12MacLeod & van der Veen, 2020; 13Sheikh, 2024.
Learning outcome: Understand data provenance, structure, and quality in design contexts. Preparation material: Big data and data science education (Fielding et al., 2025); types of engineering data used in design (Regenwetter, Nobari et al., 2022). Scaffolding strategy and activities:
Educator-led demonstrations: Introduce engineering data types, sources, and visualization using curated datasets. Guided practice: Students clean and analyze open datasets, identifying issues like noise or missing values. Independent exploration: Teams select relevant data sources for their design problem and assess their reliability and limitations. Limitations: Unavailability of open-source data; data collection unfeasible; data licensing restrictions.
Recommendations: Avoid introducing data-driven techniques as “black box” tools without discussing data quality, feature meaning, and limitations of predictive models.
Learning outcome: Distinguish between aleatory and epistemic uncertainty; apply Bayesian reasoning in engineering analysis. Preparation materials: Aleatory and epistemic uncertainty (Hüllermeier & Waegeman, 2021; Valdenegro-Toro & Mori, 2022); Bayesian reasoning (Batanero & Álvarez-Arroyo, 2024); system reliability (Kiureghian & Ditlevsen, 2009). Scaffolding strategy and activities:
Conceptual foundations: Explain aleatory and epistemic uncertainty through practical engineering examples. Modeling examples: Construct simple Bayesian networks and reliability analyses to demonstrate uncertainty propagation. Problem exercises: Students classify uncertainties in design scenarios and perform basic probabilistic reasoning. Limitations: Educators unfamiliar with uncertainty quantification or data-driven design may face challenges integrating these tools. Preparation materials listed above are crucial for the educator. Recommendations: Avoid introducing uncertainty as an abstract mathematical concept without a direct connection to design problems. This can lead to disengagement and poor conceptual transfer. Framing uncertainty as an opportunity for creativity, exploration, and design robustness rather than purely negative (i.e., something to eliminate).
Learning outcomes: Apply unsupervised methods (e.g., clustering, PCA) for knowledge discovery from design data. Preparation materials: Clustering methods (Ling & Weiling, 2025); feature extraction and dimensionality reduction (Chandana et al., 2024). Scaffolding strategy and activities:
Coding basics: Introduce Python or MATLAB for clustering and dimensionality reduction using guided examples. Computational notebooks: Students explore datasets collaboratively to interpret clustering and PCA outcomes. Mini-project (applied reasoning): Apply analytics to a design problem, identifying patterns and critical variables influencing performance. Limitations: Students may have uneven programming or statistical backgrounds. Recommendations: Avoid overloading students with advanced probability theory or coding exercises before contextual background and without connection with real design problems.
Learning outcome: Incorporate uncertainty quantification in design evaluation. Preparation material: Uncertainty in design (Cruz-Lozano et al., 2017; Du, 2014); engineering design capstone project (Fazelpour et al., 2025). Scaffolding strategy and activities:
Capstone project requirements: Define project scope, uncertainty sources, and performance metrics; submit proposals. Generic design pipeline: Integrate prior modules—data processing, uncertainty modeling, and probabilistic evaluation. Independent design: Conduct final design iterations, document uncertainty-informed decisions, and present design outcomes. Limitations: Evaluating probabilistic reasoning and design creativity can be subjective. Recommendations: Avoid assessing only final design outcomes, ignoring the reasoning process that incorporates uncertainty analysis.
Educators are encouraged to use accessible computational environments such as Python (with NumPy, Pandas, Scikit-learn) or MATLAB. Templates for uncertainty propagation, clustering, and feature extraction can be pre-provided to reduce setup time.
Assessment may include reflective reports on uncertainty identification, computational notebooks (such as Jupyter/Google Colab notebooks) demonstrating analysis, and a final design justification that articulates how uncertainty-informed decisions are made. Peer review and design critiques can further reinforce understanding.
The proposed course is designed for graduate-level students with prior experience in modeling, programming, and engineering design; however, several considerations are made to implement this course as an advanced undergraduate class. First, prerequisites must be stated clearly, including modules such as linear algebra and numerical methods. Programming tasks should be guided through computational notebooks with template scripts and informational annotations, enabling students to focus on interpreting uncertainty rather than constructing full models from scratch. Undergraduate students should work with predefined datasets and selected scientific literature. In contrast, graduate-level students are expected to identify or generate appropriate datasets and conduct independent literature searches (Bammer et al., 2023).
Case Study
Theoretical Background
The algorithm of k -means is one of the most widely used unsupervised learning for clustering unlabeled data (Jabi et al., 2021; Liu et al., 2025). The goal of k -means is to partition into k clusters such that data points within the same cluster are more similar to each other than to those in different clusters.
The algorithm works in an iterative process. It begins with the initialization step, where k initial cluster centroids are selected, often randomly from the dataset. In the assignment step, each data point is assigned to the cluster whose centroid is closest, typically measured using the Euclidean distance. Once all points are assigned, the update step recalculates each centroid as the mean of all points belonging to its cluster. These assignment and update steps are repeated until convergence, which occurs when the centroids no longer change significantly or the cluster assignments stabilize.
Mathematically, k -means seeks to minimize the within-cluster sum of squared distances: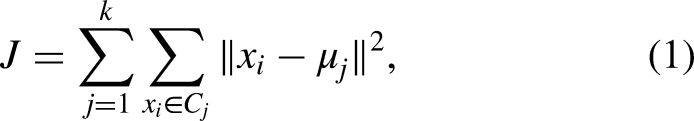
PCA is a statistical technique widely used for dimensionality reduction while preserving as much variance as possible in the original dataset (Chandana et al., 2024). It transforms the data into a new coordinate system such that the largest variance, by any data projection, lies on the first coordinate (the first principal component), the second largest variance on the second coordinate, and so on.
Formally, let 
This is equivalent to finding the eigenvectors of the empirical covariance matrix 
In this case study, PCA was selected as it is a linear, unsupervised method that is computationally efficient and interpretable. However, it has some drawbacks: 1) Poor latent representation when the number of observations is considerably lower than the number of features (
A GMM is a probabilistic model that assumes the data is generated from a mixture of several Gaussian distributions with unknown parameters. Due to its flexibility in modeling complex, multimodal data distributions, it is widely used in clustering, density estimation, and unsupervised learning.
Formally, let 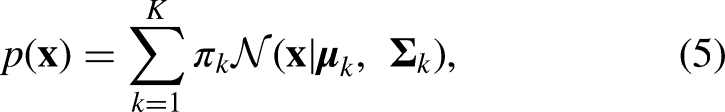
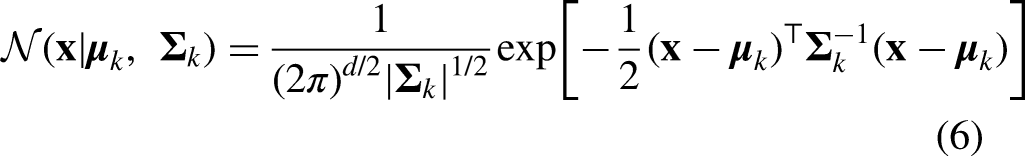
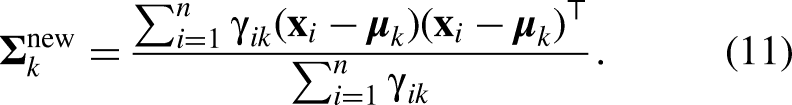
The parameters
Given a dataset 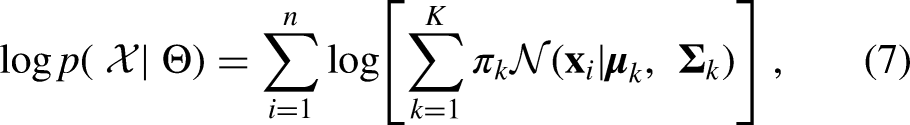
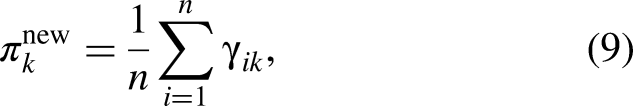
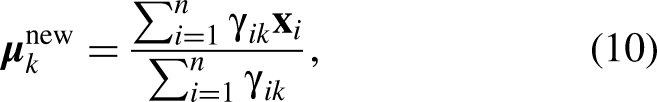
Finally, the expectation-maximization algorithm is guaranteed to increase the log-likelihood monotonically and converge to a local optimum. The expectation-maximization algorithm is broken down into the e-step and m-step, as follows:
e-step: Compute the posterior probability (responsibility) that component k generated 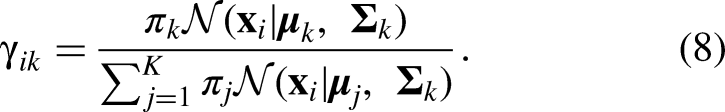
Roadmap's Methodology
The proposed roadmap for quantifying the inherent uncertainty during the conceptual design of a bicycle was applied to select the correct type of frame depending on the end-user application and desired geometry. Segmented bicycle frames were extracted from a dataset of bicycle images and parametric data known as BIKED (Regenwetter, Curry et al., 2022). BIKED's image data have been used for different applications such as bike design classification (Regenwetter, Curry et al., 2022), generating novel designs using generative adversarial networks (Nobari et al., 2021), and for completing missing data by integrating graph attention networks and tabular diffusion models (Zhou et al., 2024).
In this study, the conceptual design selection roadmap, referred to as the “roadmap,” integrates engineering insights, dimensionality reduction, probabilistic clustering, and uncertainty quantification to enable a detailed and robust analysis of bicycle frame designs based on image data. Each step of the roadmap, as seen in Figure 5, was directly related to a stage in the educational flow described in Section 2.2, Educational flow that supports students’ engagement, providing a practical application of the proposed educational approach in the context of data-driven design.
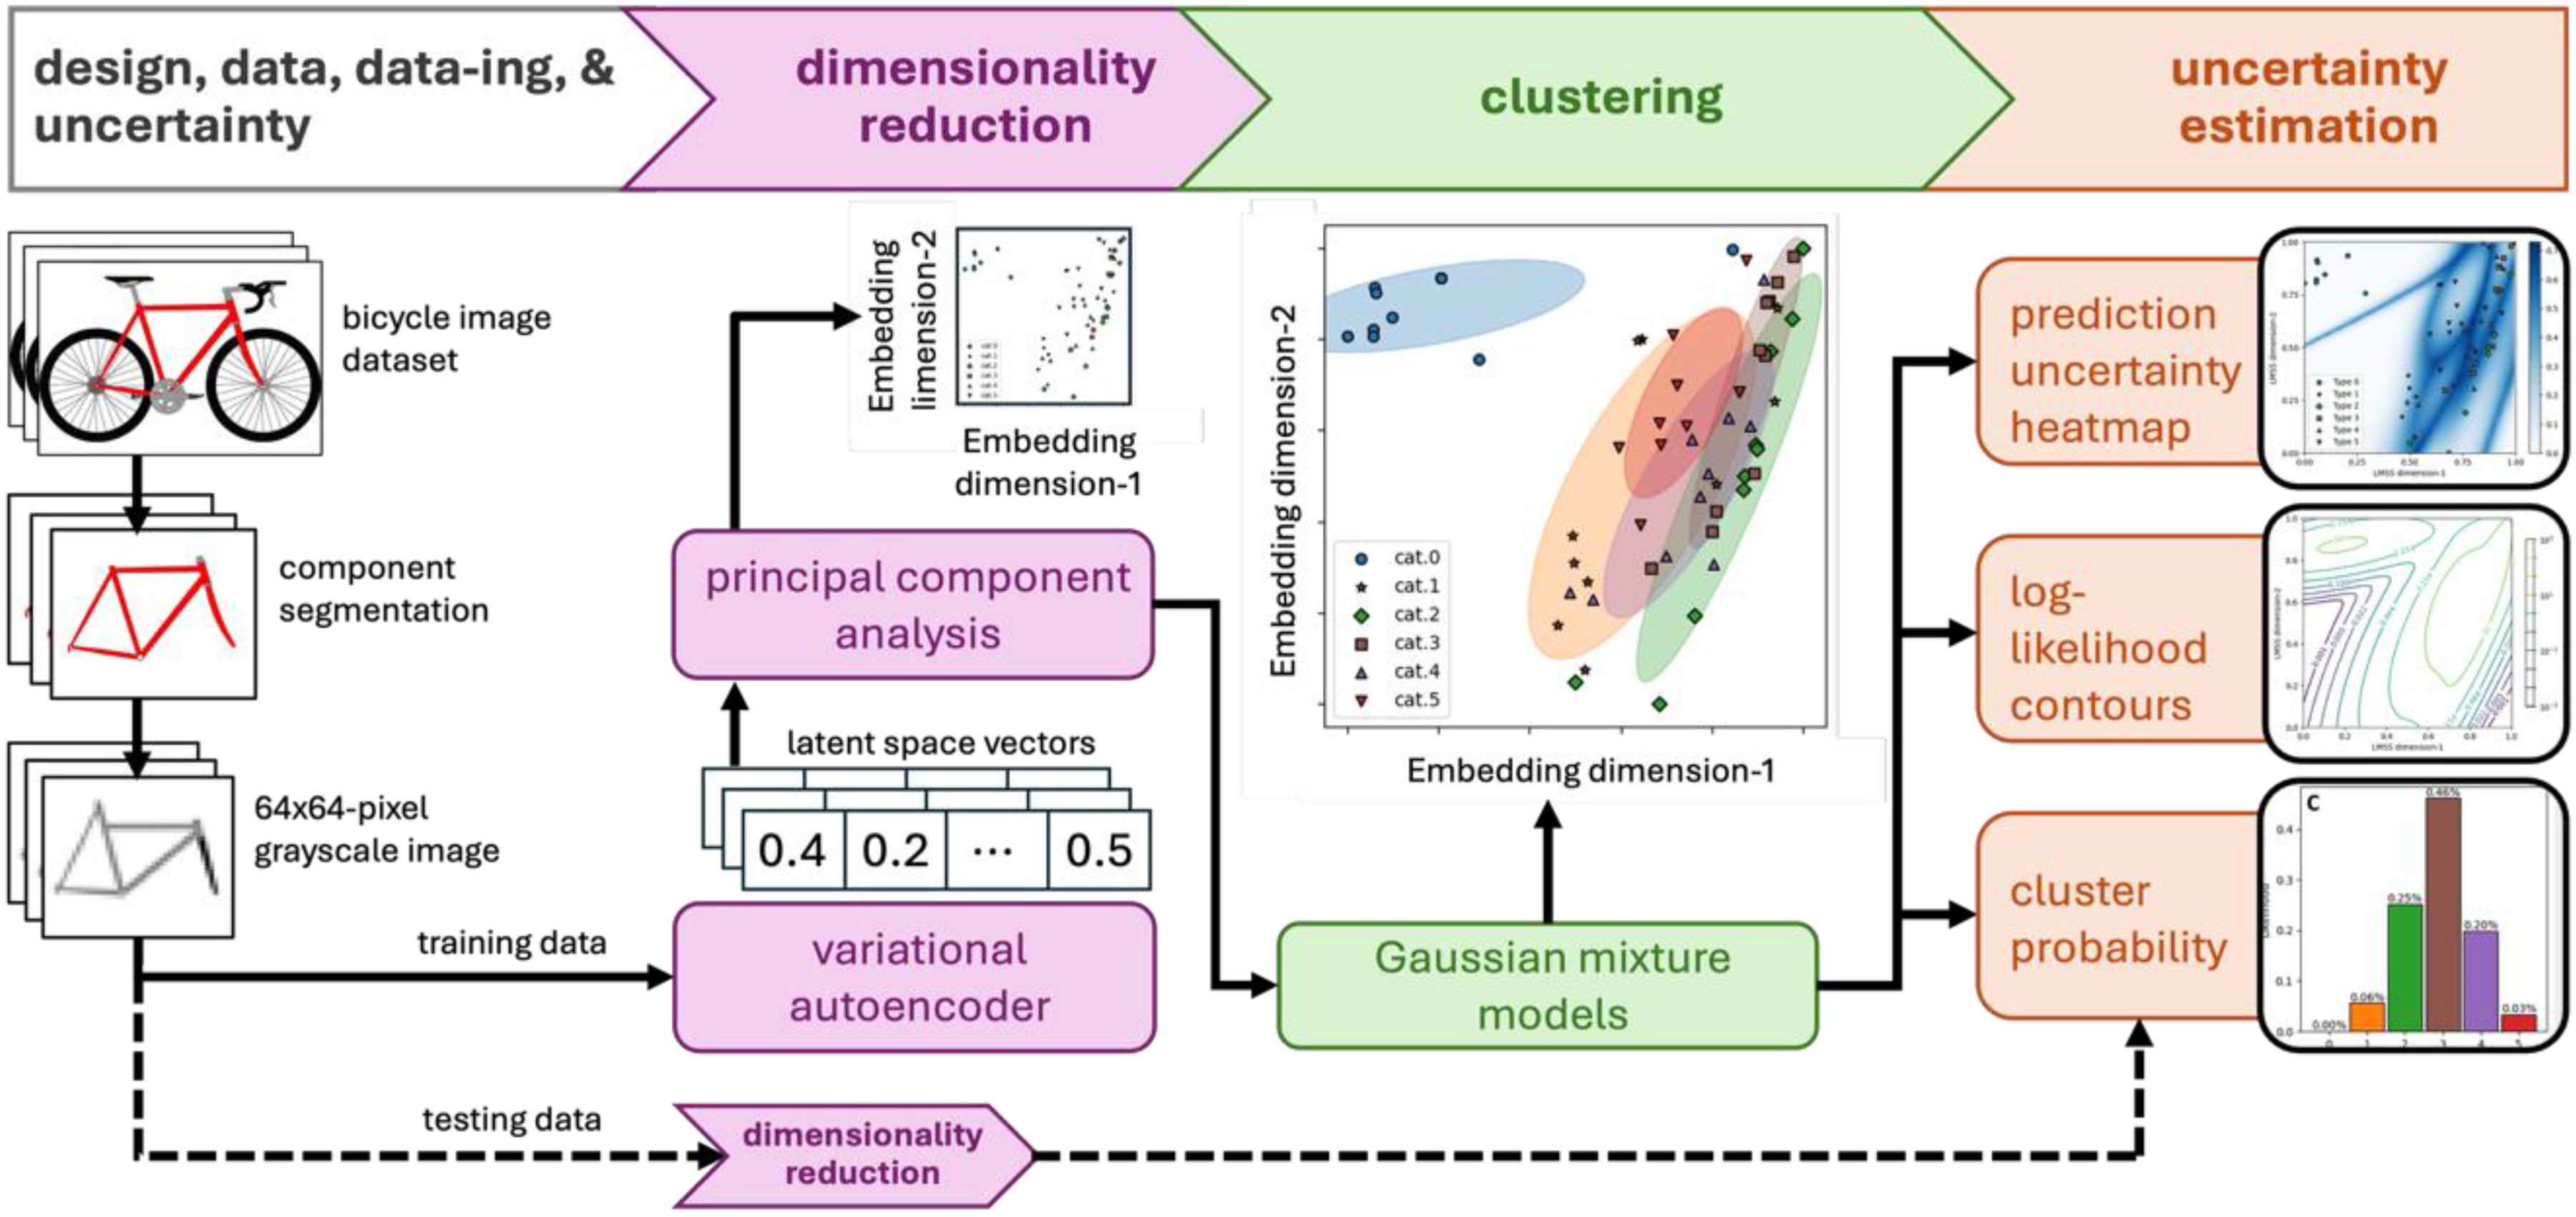
Roadmap of the case study design selection.
In the following paragraphs (Steps 1 through 4), a typical student's learning journey for the four steps of the roadmap (Figure 5) is described, considering the decisions they may need to make, the mistakes they may encounter, and how uncertainty reasoning may influence their approach. Although the past tense may be used in the following paragraphs (Steps 1 through 4), this is merely an anticipated student's learning journey, as the course has not yet been implemented to provide opportunities to observe, assess, and evaluate students.
Step 1: Engineering Design, Data, Data-ing, and Uncertainty
Students begin with an open dataset of bicycles, extracting the component of interest (the bicycle frames) from the raw images. Initially, many approach the dataset with the assumption that it is complete and ready to find “the best design” through direct comparison. However, as they explore the data, inconsistencies emerge, such as missing labels, bicycle designs in overlapping categories, and incomplete or unbalanced dataset categories. This realization marks the first encounter with epistemic uncertainty, resulting from incomplete knowledge or imperfect data. Through guided discussion and exercises, students learn to document data limitations, clean the data, and visualize variability rather than ignoring it. In the proposed roadmap, transforming the two-dimensional image data into a one-dimensional vector representation is a good practice to make the image dataset suitable for dimensionality reduction, followed by data visualization.
Step 2: Dimensionality Reduction
Once students have preprocessed the dataset, they apply PCA to reduce dimensionality and identify dominant geometric trends. As discussed previously, the principal components of the VAE's latent space vectors captured the directions of maximum variance in the data, with the first few principal components representing most of the data's intrinsic variability. By projecting the data onto these components, the dimensionality of the image data was compressed into the VAE's bottleneck layer and then into only two principal components. The output of this process was a latent l -dimensional space, which serves as an embedding of the original data.
Initially, it is anticipated that many misinterpret PCA as merely a data compression technique; yet, through reflective analysis, they come to appreciate its role in capturing the underlying structure of design variability. Students must decide how many principal components to retain, e.g., 1, 2, or 3 components for 1D, 2D, or 3D embedding space, respectively, balancing the trade-off between representational simplicity and information loss. This decision on modeling uncertainty versus interpretability introduced the notion of aleatory uncertainty, which arises from natural variability in design data. By reconstructing frame designs from reduced components, students visualize how uncertainty propagates through their simplified models and affects the clustering of designs.
Step 3: Clustering
In the third step, GMM was used to cluster the training data based on the principal components obtained from PCA. GMM is a probabilistic clustering approach that assumes the data is generated from a mixture of several Gaussian distributions, each representing a cluster. Each cluster was characterized by its mean vector and covariance matrix, as highlighted previously. The model estimated the parameters of these Gaussian components to fit the data best. During clustering, the GMM aimed to capture 90% of the data coverage to ensure that the clusters effectively represented the underlying data distribution, while avoiding overfitting and underfitting. Here, students often expected the algorithm to produce clear, discrete categories, such as “mountain bikes” and “road bikes,” and so forth. Instead, they observed overlapping probability distributions, where some designs belonged partially to multiple clusters. At this point, a deterministic classification mindset is challenged, as a frame design may be 70% similar to a road bike cluster and 30% to a hybrid cluster, revealing that design boundaries are often probabilistic rather than absolute.
Step 4: Uncertainty Estimation
In the final stage, students integrated the probabilistic models developed in the prior phases to estimate the uncertainty associated with the clustering outcomes using log-likelihood contours derived from the GMM.
The suggested metrics for uncertainty analysis are expressed in Eqs. (12)-(15). During the testing stage of the roadmap, students analyze a dataset containing C design types. For each testing sample, the log-likelihood
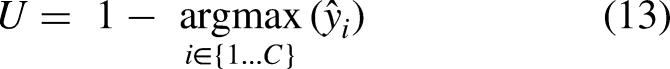
The prediction uncertainty U becomes simply the negation of the predicted class likelihood, as shown in Eq. (13). Students often discover that designs near cluster boundaries (e.g., frames blending mountain and hybrid geometries) exhibit higher U values, signifying low classification confidence and thus greater ambiguity in design interpretation. Finally, the confusion of the model can be quantified by calculating the normalized Shannon's entropy H (Chlaily et al., 2023), as in Eq. (14). A higher mean entropy indicates that the GMM model is less confident in its design-type predictions, causing the students to revisit earlier modeling decisions such as the number of clusters or the adequacy of feature selection in PCA.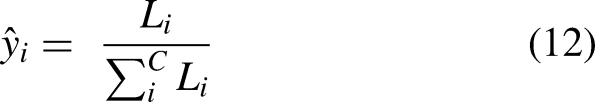
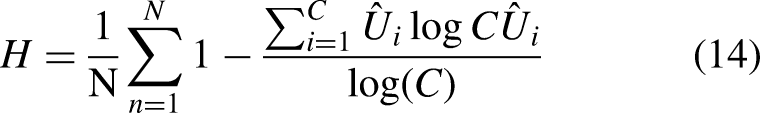
This uncertainty analysis approach transforms the students’ mindset from a passive interpretation of model outputs to active probabilistic thinking. For instance, a conceptually appealing frame may lie in a high-entropy region of the design space, suggesting a need for further testing or redesign. At this stage, students begin to reason about concepts such as risk, robustness, and design innovations.
Results and Discussions
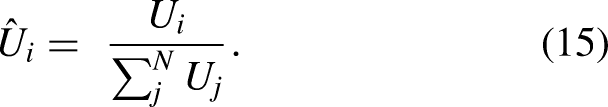
To further illustrate the applicability of the proposed probabilistic roadmap for selecting bicycle frame designs, Figure 6 presents an example of the process. Figure 6a displays the testing input image, which was processed using the same pipeline as the training set. After the image passes through the encoding and dimensionality reduction process (Figure 6b), the resulting low-dimensional embedding is shown in Figure 6c, where the test design (marked with a red “×”) was projected into the embedding space. Each point in the resulting 2D design space represents a unique bicycle frame design generated during the roadmap's Step 1. Colored ellipses indicate GMM-fitted clusters corresponding to each design type, capturing the probabilistic density of the training samples. The location of the test design embedding suggests ambiguity in its classification, as it was positioned inside the clusters associated with Types MTB and Road1. This is quantified in Figure 6d, where the GMM estimated the posterior probabilities of cluster membership for the test point. After calculating the membership probability for each cluster, all probabilities were combined to compute a class likelihood. The highest likelihood was assigned to Type MTB (72.05%), followed by Type Road1 (27.94%). Types Road2 and BMX showed negligible likelihoods, consistent with their distant position in the embedding space.
Bicycle frame clustering from (a) engineering design data, (b) dimensionality reduction using autoencoder and PCA, to (c) clustering and (d) likelihood calculation.
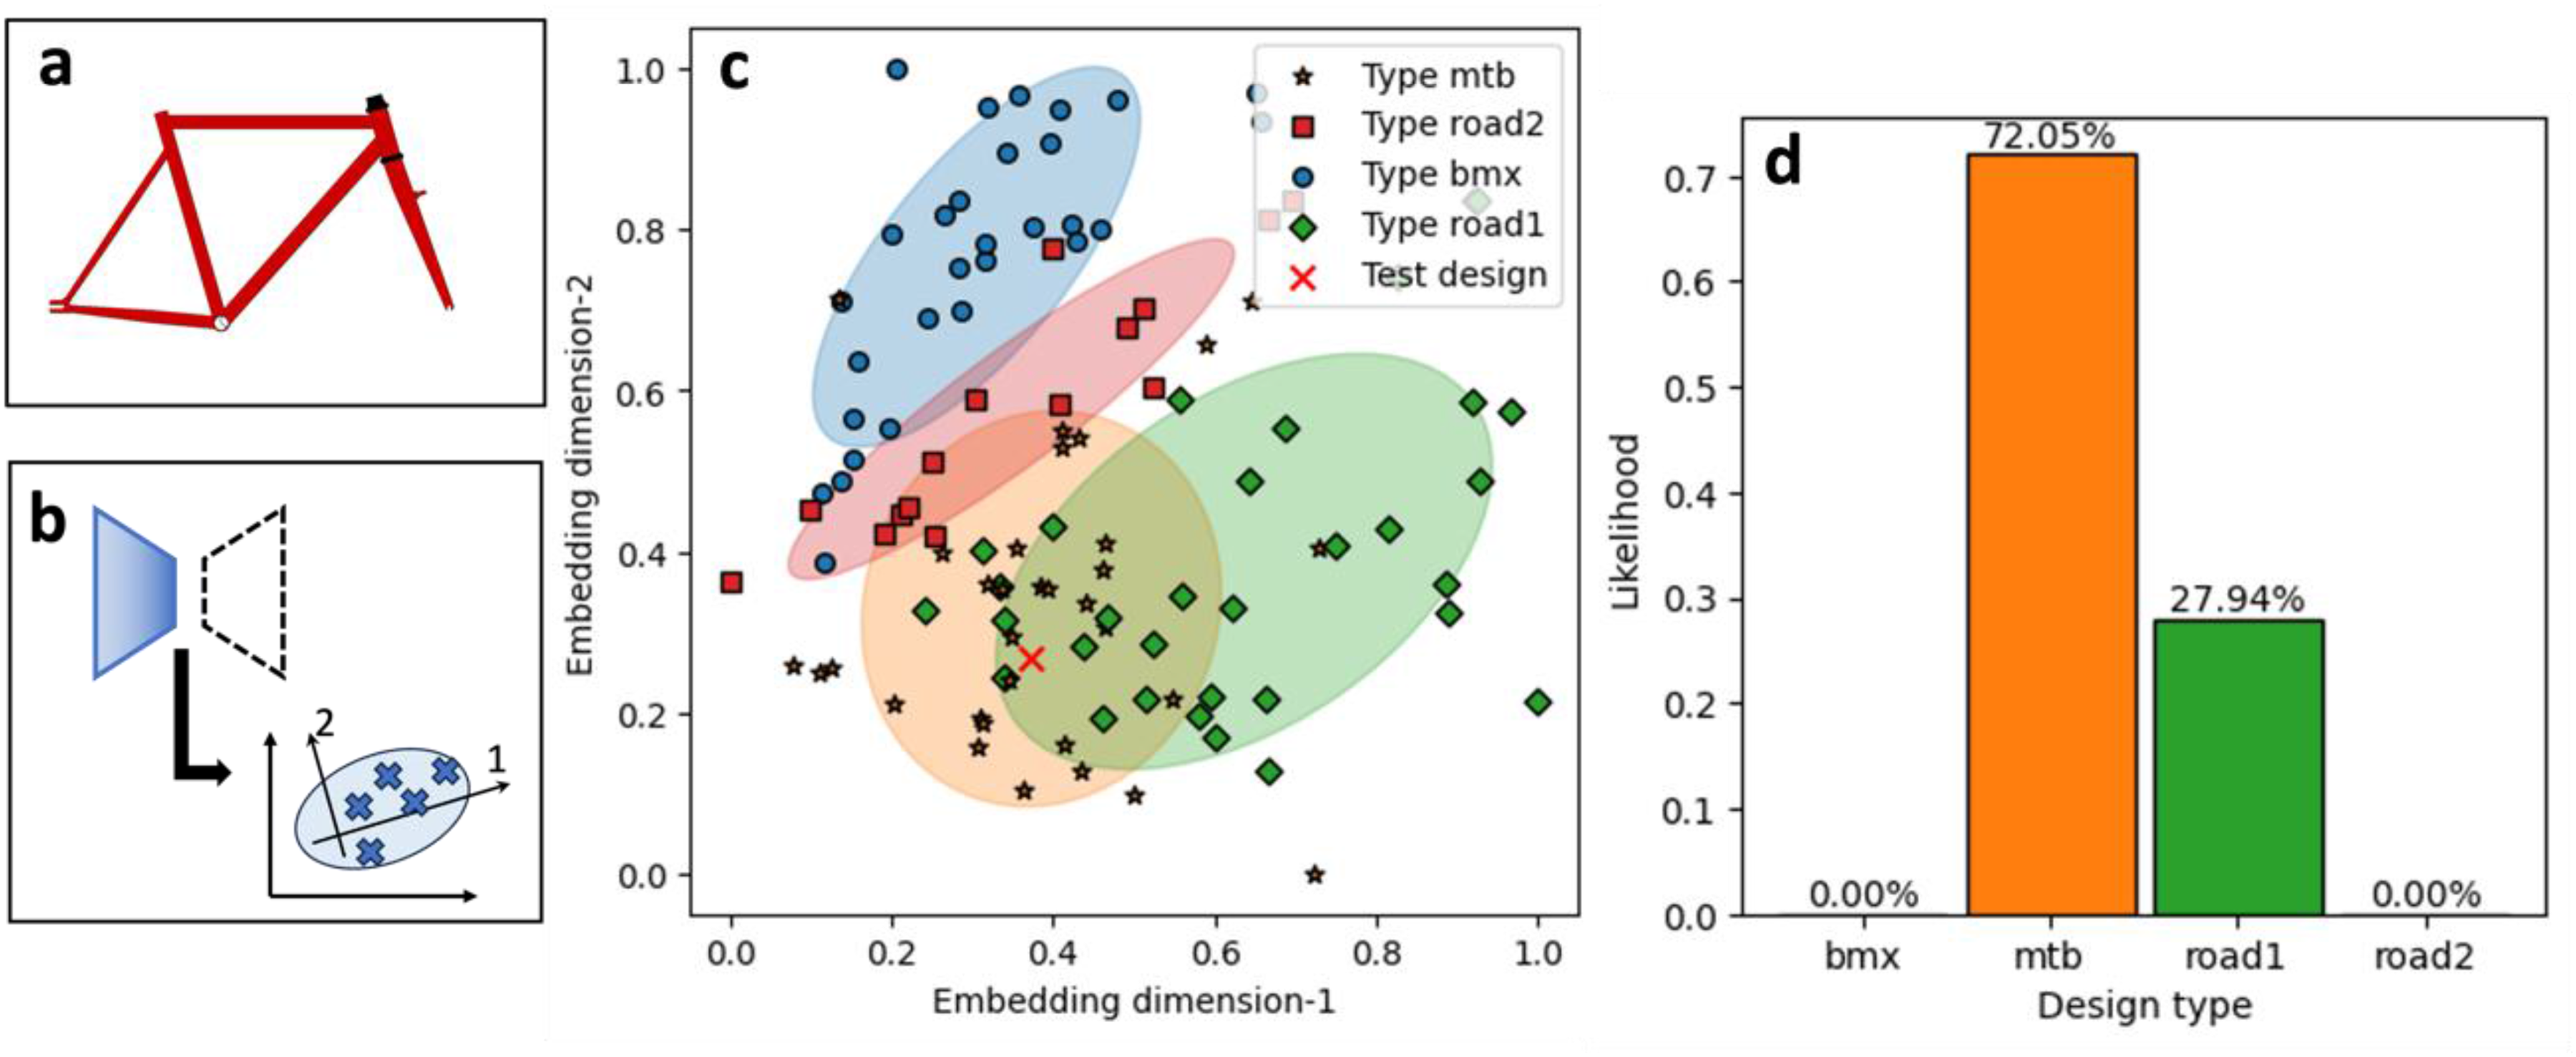
Figure 7 illustrates the supervised and unsupervised approaches for data labeling, providing more details about the results of Steps 1 and 2 of the roadmap's methodology. In the supervised learning approach (Figure 7a), each bicycle frame design was manually assigned to a known design type, such as MTB, Road1, Road2, or BMX. This method requires domain expertise to ensure that clusters correspond to meaningful frame types. However, the visualization shows overlaps between groups, reflecting shared structural features across designs and highlighting the difficulty of drawing clear boundaries in complex design spaces. While supervised labeling preserves real-world interpretability, it also introduces subjectivity and requires significant manual effort.
Labelling of bicycle frame clusters using (a) Supervised (manual labelling) and (b) Unsupervised (
In the unsupervised learning approach (Figure 7b), k -means clustering was used to generate labels, resulting in compact and well-separated clusters that were generated automatically. Unlike the supervised case, these clusters are not tied to predefined types but rather emerge from data-driven similarities in the design space. This reduces human bias and effort while potentially revealing new design families; however, expert interpretation is needed to connect clusters back to their engineering meaning. Together, the two approaches illustrated a trade-off between interpretability and automation in design classification.
Regardless of the labelling approach, the results of clustering demonstrated how latent design space enabled intuitive visualization of design variation and supported probabilistic inference for uncertainty estimation when new design concepts were being developed. Such an uncertainty-aware tool is invaluable in early-stage design exploration, where decision-making is affected by many design features that overlap in the design space. For such cases, the student may benefit from probabilistic guidance rather than deterministic assignment.
Finally, the design selection was evaluated using the whole dataset, which consisted of 136 images of bicycle frames. A 5-fold cross-validation test was conducted, meaning that 20% of the dataset was excluded from the model's training dataset and used for testing the model's performance. This process was repeated five times. At each training and testing phase, the performance metrics, specifically the F1 score and accuracy, were computed. Finally, the average and standard deviation of these metrics were considered for evaluation at the end of the cross-validation. Table 2 presents the cross-validation results of the proposed probabilistic roadmap, along with the results obtained using a deterministic model (custom convolutional neural network (CNN) classifier) for comparison. The architecture of the CNN classifier is the same as the encoder part of the autoencoder neural network, with the difference that it uses a SoftMax activation function in the last layer, which was recommended for classification problems.
Cross-Validation Results of Conceptual Design Selection Over Five Folds.
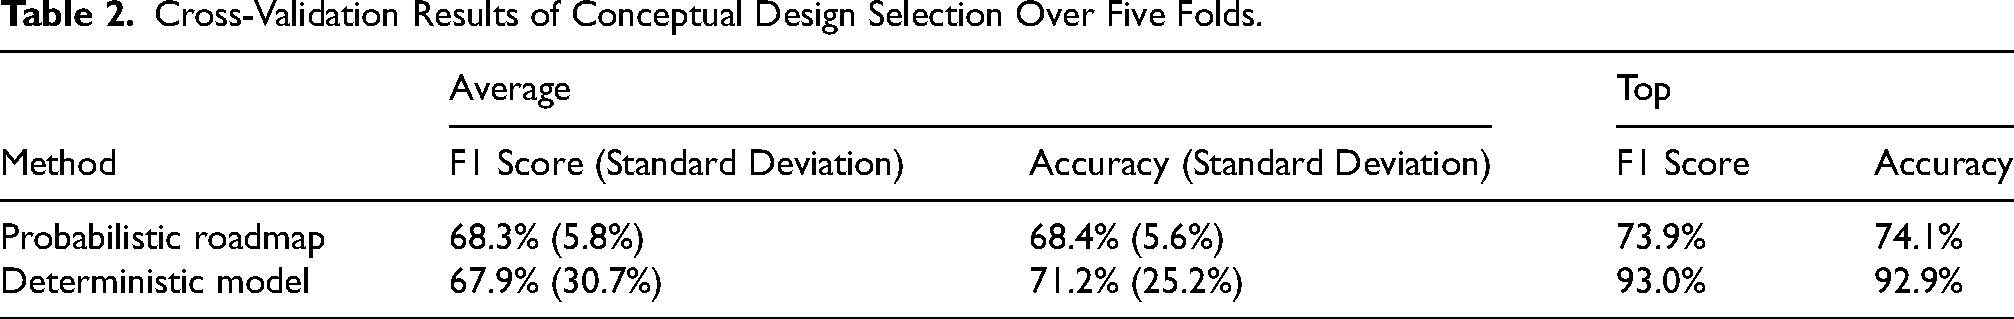
For both the probabilistic and deterministic cases, the average prediction metrics had values of approximately 70%. Although this accuracy is not sufficient for a reliable classification algorithm, it is consistent with the results of Regenwetter, Curry et al.'s study (2022), which reported an accuracy of 66.8% using only images and a classification CNN. Achieving better classification performance for this dataset can be challenging due to the overlap between classes and class imbalance, as pointed out by Regenwetter, Curry et al. (2022). However, an uncertainty analysis might be helpful to understand why classifying bikes is not a straightforward exercise. Although the deterministic model achieved a top F1 score and accuracy of around 93%, the lower average metric suggests poor prediction performance for some of the dataset's folds. This inconsistency is evident in the higher standard deviation for the deterministic case. Hyperparameter tuning is also crucial for the deterministic model, as neural networks can overfit, exhibiting high accuracy for specific folds that closely resemble the training dataset's distribution but poor results for bicycle designs outside this distribution. Modeling uncertainty in the dataset could be a potential solution to these issues. The probabilistic model's ability to model data uncertainty by creating non-parametric probability distributions appears to have led to a more robust decision roadmap overall.
Figure 8 illustrates the uncertainty distribution across the embedding design space, where uncertainty is visualized as a heatmap plot. Darker blue regions corresponded to higher uncertainty levels. In this study, uncertainty was quantitatively defined as the cumulative probability of a design sample belonging to any design type other than the predicted type. This metric captured the ambiguity in classification based on proximity to multiple cluster centroids in the latent space.
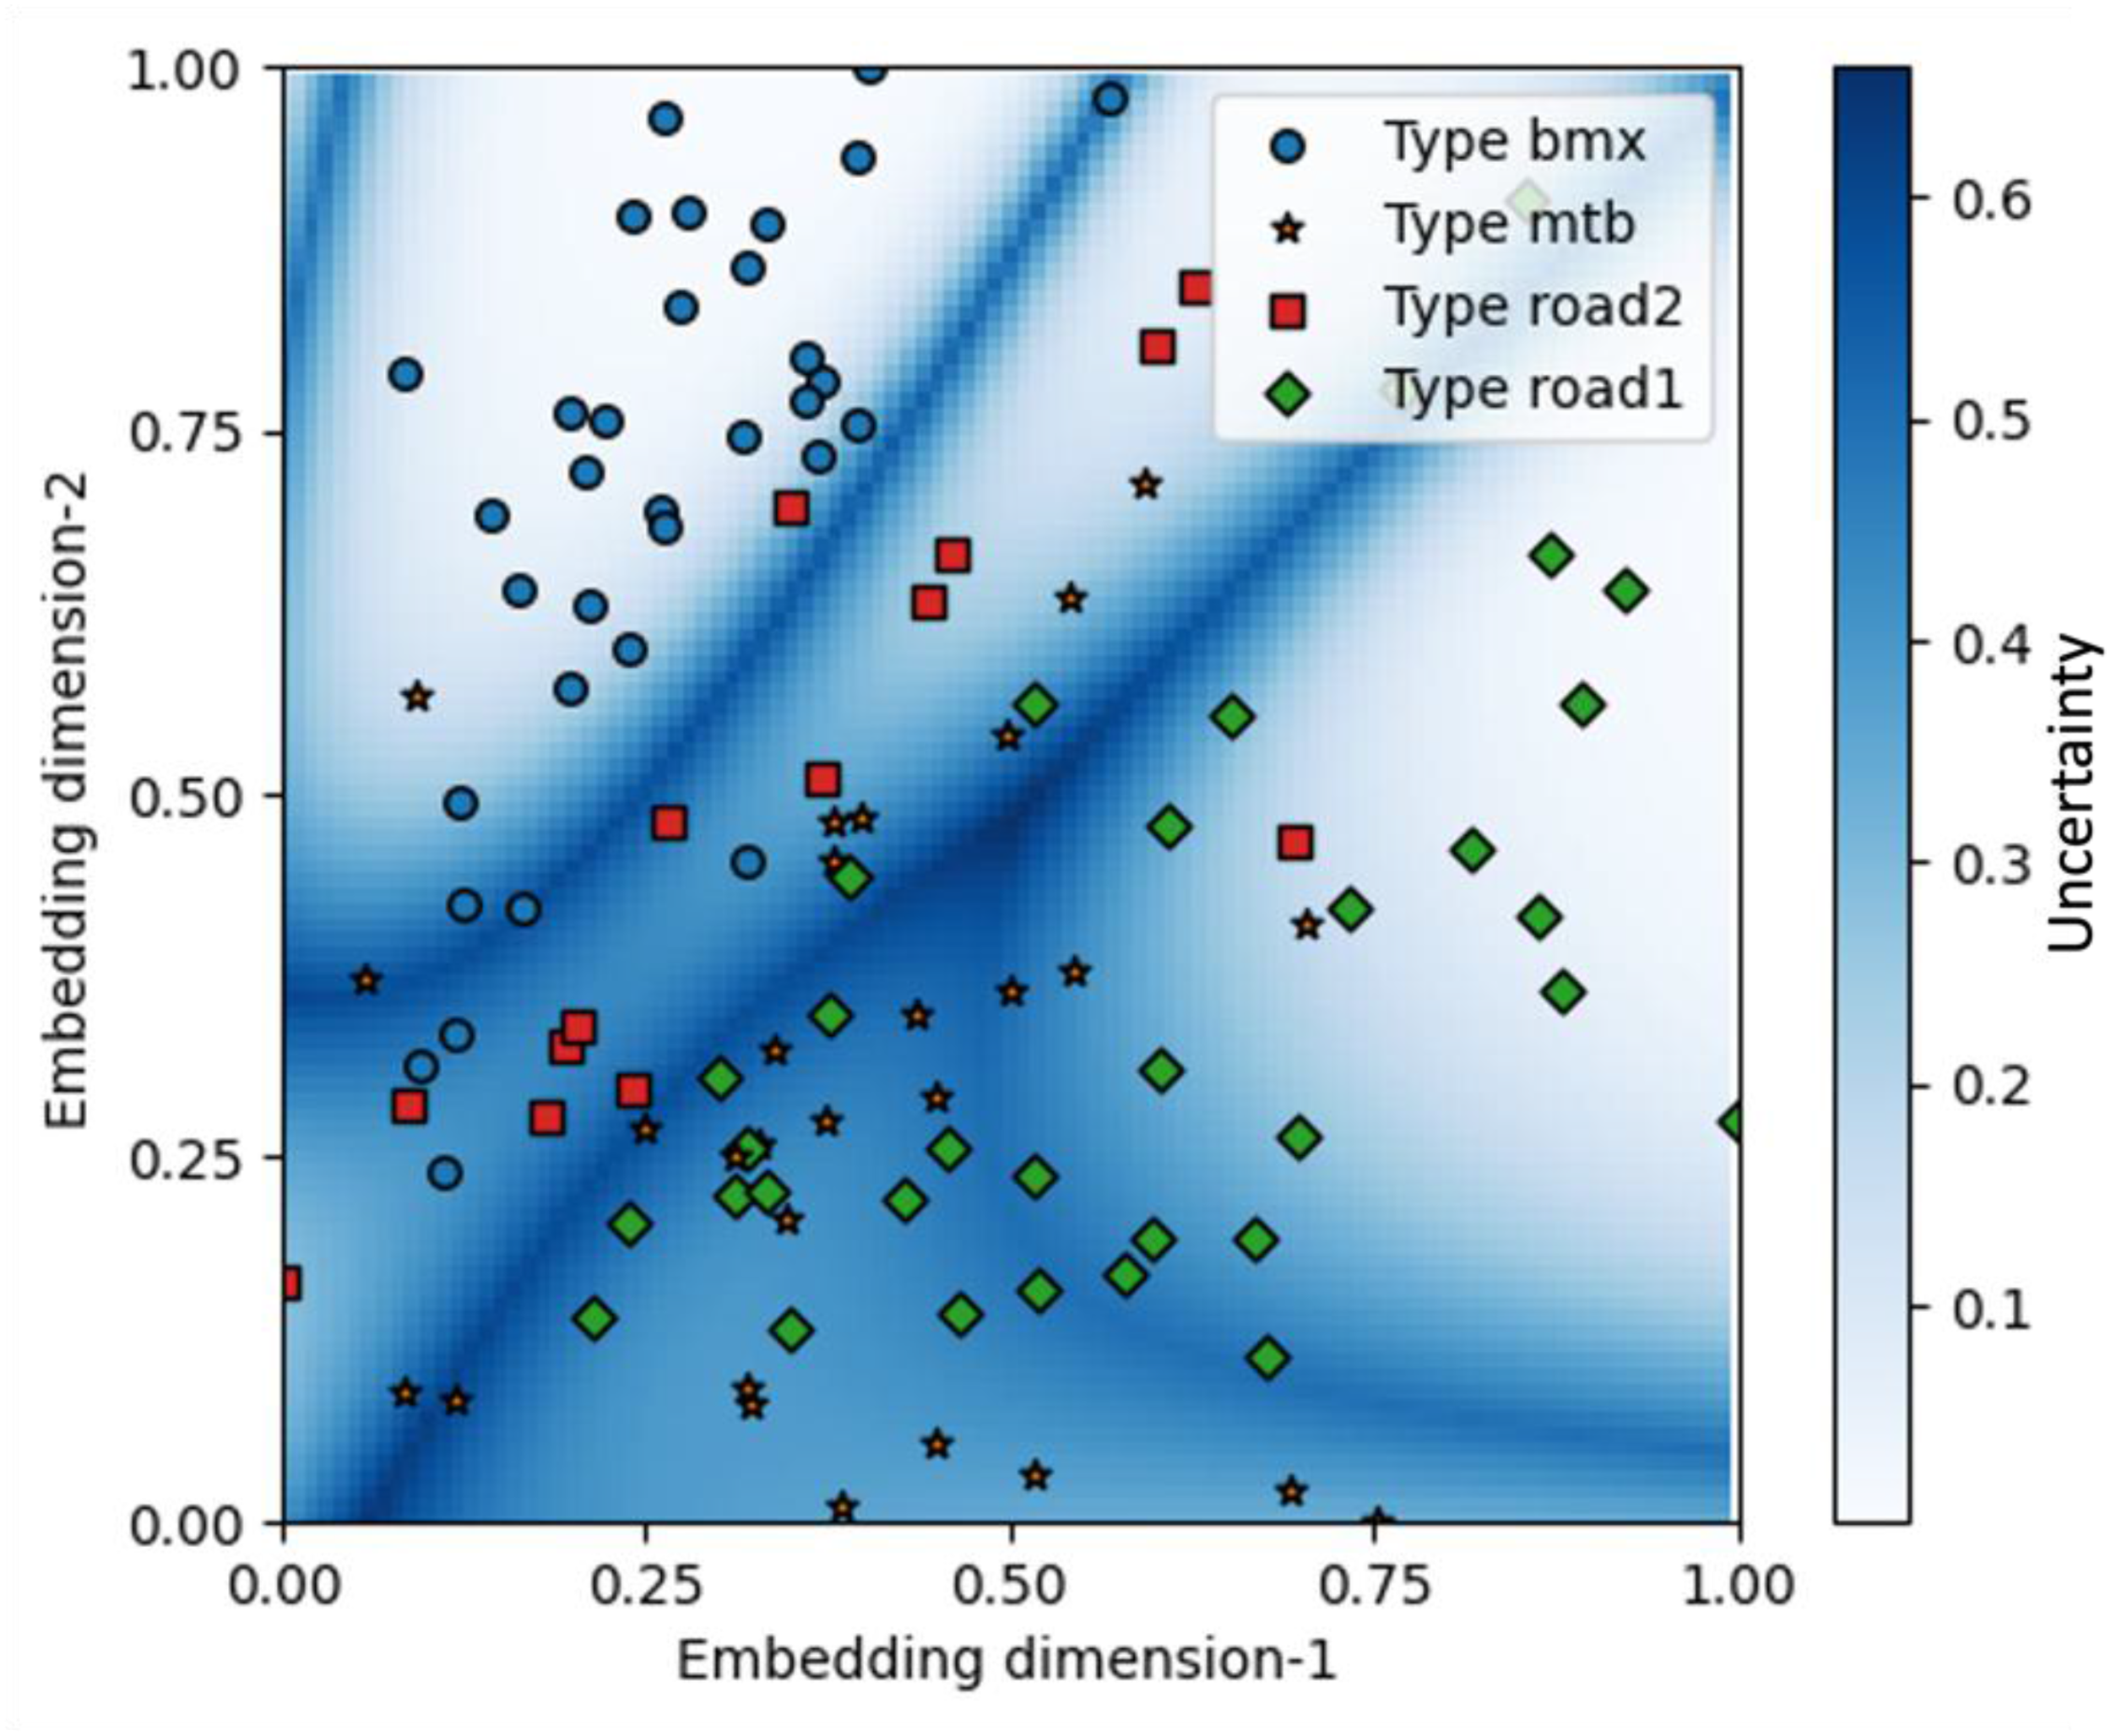
Prediction uncertainty (heatmap) between Gaussian mixture models.
The results showed that uncertainty was not uniformly distributed throughout the design space. High uncertainty tends to concentrate near the boundaries between clusters, while mid-uncertainty regions develop where clusters overlap. Mid-uncertainty areas indicated zones of conceptual similarity, where design features were less distinctive and multiple design types exhibited comparable likelihoods. Conversely, low uncertainty (lighter blue or white regions) was observed near the centers of well-separated clusters, such as Type BMX, where classification was more confident and unambiguous.
Figure 9 illustrates the log-likelihood contours computed by aggregating the likelihoods from all fitted Gaussian components in the GMM. These contours served as a probabilistic representation of the model's confidence in different regions of the design space.
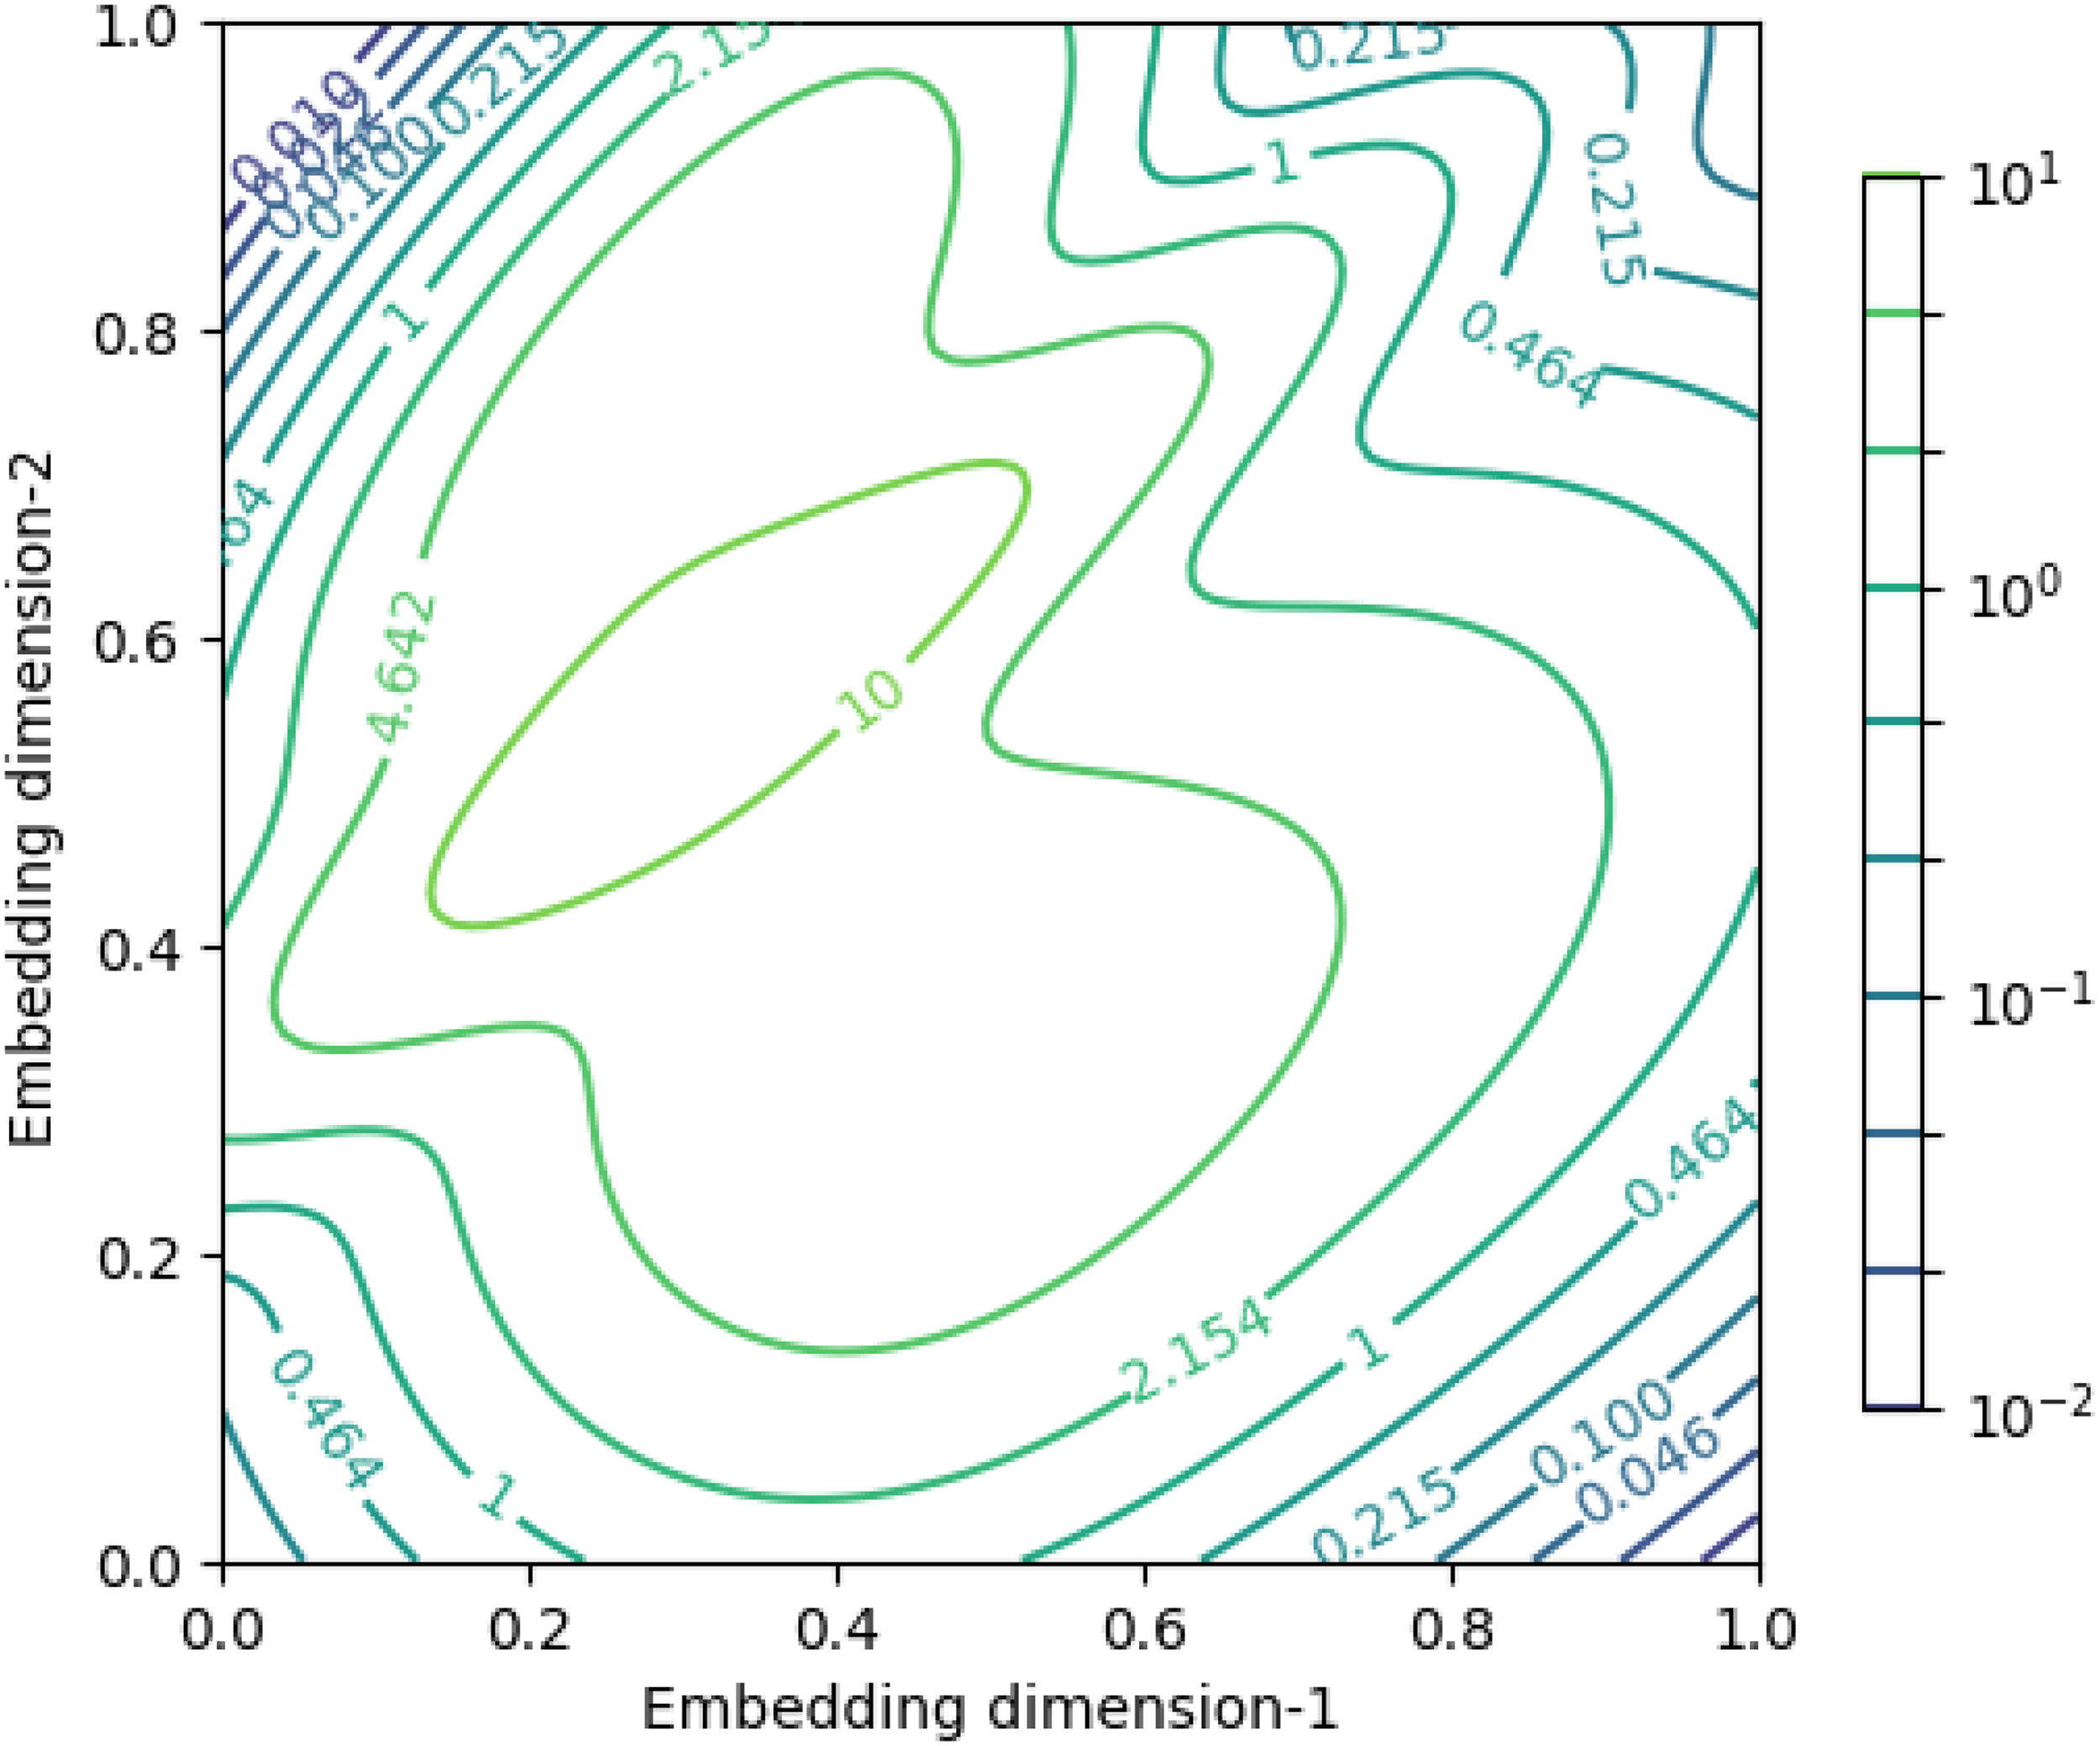
Log-likelihood contours in an embedding space after adding up all Gaussian mixture models.
The key insight from this plot is the visualization of the log-likelihood distribution. High log-likelihood regions (e.g., central green contours) indicated areas where multiple design samples were densely clustered. These zones reflected high confidence in the clustering predictions, as the model had observed more data on these areas of the design space during training. This concentration suggested a more reliable grouping of design types. Conversely, low log-likelihood regions (e.g., peripheral purple contours) highlight zones with sparse data availability. These areas represented increased uncertainty in cluster assignment due to limited design variability observed in these regions. Therefore, any new design mapped to these regions would be considered less confidently classified by the model.
The following insights and guidelines can help interpret the areas in the design space where the model exhibits high entropy (or uncertainty). High uncertainty typically indicated that the model struggled to interpret specific designs confidently. Students can address this in three ways. First, when different designs share too many similarities, they can improve feature selection by identifying and adding more distinctive characteristics, such as unique shapes, performance metrics, or material properties, to help the model distinguish between them. Second, if the model itself cannot recognize subtle differences between design types (epistemic uncertainty). In that case, they can enhance the modeling approach by using more advanced dimensionality reduction, clustering, or classification techniques that better preserve class boundaries. Finally, if the problem comes from poor-quality or overly compressed training data (aleatory uncertainty), designers can improve the input data by collecting higher-resolution, cleaner, and more diverse samples.
To better understand how the amount of training data per design type affects the robustness of clustering predictions, a sensitivity analysis was conducted on two uncertainty metrics: mean uncertainty and entropy. The results, illustrated in Figure 10, show how these metrics change as a function of the percentage of the whole training dataset. The mean uncertainty (represented by blue bars in Figure 10) reflects the average probability that a test design does not belong to the predicted design type. As expected, this value tends to increase with the number of training samples per design type. For instance, with 23% of the whole dataset, the mean uncertainty was relatively low (53%), suggesting overconfidence in predictions due to limited variability in the training data. As more samples were introduced (e.g., 77% of the entire dataset or ∼100 samples), the model captured a broader range of design variations, leading to more cautious predictions and higher mean uncertainty, which stabilized around 70%.
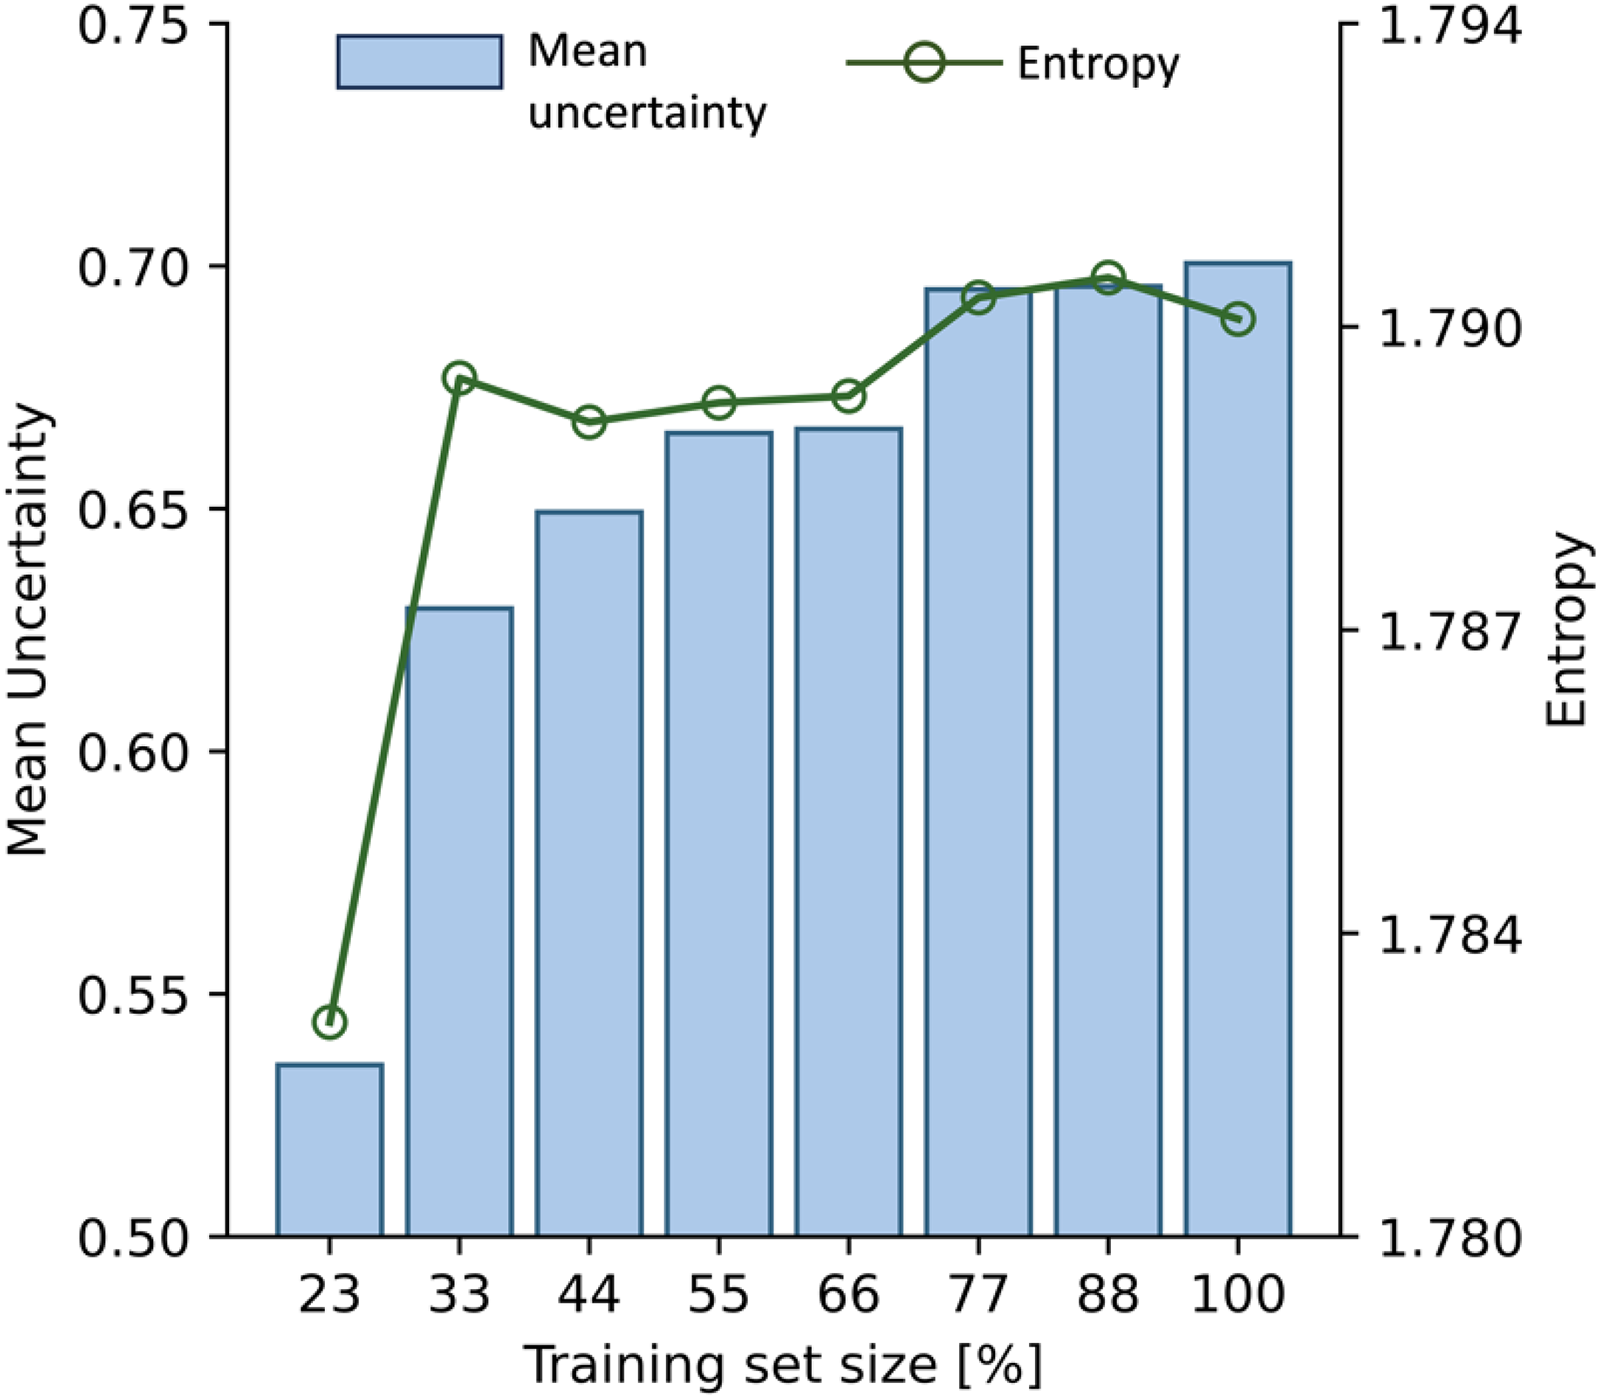
Sensitivity analysis on the number of samples per frame design type in the training dataset.
The entropy values (green line) provided a second metric for the model uncertainty by quantifying the chaotic behavior of the model's predictions. Initially, entropy presented a ∼0.4% rise as additional samples diversified the design representation. Interestingly, once the training size exceeds 33% of the entire dataset, the entropy reaches a plateau at approximately 1.79, indicating a point at which additional data no longer contributes to reducing prediction chaos.
Generalization, Limitations, and Conclusions
Although the proposed design course has not been formally taught, based on parallel studies, the proposed uncertainty-aware design roadmap can be effectively adapted across disciplines, depending on the availability of data. For instance, Magana et al. (2024) proposed a scaffolding interdisciplinary project-based learning course in biological systems. In this study, students could analyze gene regulatory modules by identifying dominant gene-interaction patterns through PCA and classifying regulatory behaviors using GMMs. Similarly, MacLeod and van der Veen (2020) presented a case study of interdisciplinary hospital traffic modeling projects in STEM programs. By applying this study's roadmap, open-ended projects could involve analysis of patient-flow data, dimensionality reduction of performance indicators, and clustering of traffic patterns under uncertainty. Another example is the case study presented by Sheikh (2024), in which abstract probabilistic concepts are taught to students in the Electrical and Computer Engineering program. For this case, students could apply the proposed roadmap to noisy circuit or signal datasets, using probabilistic clustering to identify stable or unstable profiles and quantify model confidence.
Across these cases, the proposed roadmap can be implemented to transition from deterministic to probabilistic reasoning by interpreting data variability as a crucial design element. However, educators may face challenges such as aligning interdisciplinary programming skill levels, addressing nonlinear data behaviors (e.g., sociopolitical contexts), and the availability of extensive datasets. These limitations can make uncertainty analysis difficult to achieve within short capstone timelines.
As a general measure, the proposed educational course is most effective when projects entail accessible datasets, intuitive aleatory and epistemic uncertainty, and sufficient among students. It is better suited for upper-level design or modeling courses or serves as a computational capstone that complements traditional design-build-test projects. Consequently, with this reasoning and the literature that validates similar approaches, this course can be integrated into any STEM-related educational program under scaffolded instruction that progressively introduces data reasoning and probabilistic modeling. Furthermore, the modularity of the proposed roadmap allows selective adoption of components, such as uncertainty quantification or probabilistic clustering, within existing curricula.
This study employed the backward design to develop a structured, data-driven conceptual design course that incorporates uncertainty reasoning into engineering design education. The course is aligned with ABET competencies and structured around nine frameworks, categorized into five groups. As a learning platform for engineering students, this study proposes a hands-on and team-based educational program that supports three discipline-based education research fields: 1) how to approach engineering design (i.e., engineering design education), 2) the integration of uncertainty quantification and probabilistic thinking (i.e., uncertainty education), and 3) how to handle data for informed decision-making in engineering design (i.e., data and data-ing).
An educational flow and an educator's guide were detailed as a practical implementation roadmap with scaffolding for a 15-week semester, using the bicycle frame case study as a capstone project. It highlighted the skill development that occurs as students gradually take on more responsibility, progressing from educator-led demonstrations to guided exercises and ultimately to an open-ended capstone project that considers uncertainty in design. The guide included preparation materials for educators, including scientific papers covering the theoretical background of each module, recommended programming libraries for technical implementation, limitations and recommendations for educators conducting this course for the first time, and guidance on adapting the course for undergraduate versus graduate-level instruction.
As a case study, a probabilistic data-driven design selection roadmap was presented. It was found that both probabilistic and deterministic classifiers could not achieve more than 70% accuracy, primarily because the dataset contained significant class overlap and imbalance, which made it difficult for models to generalize without overfitting, as shown by their high variability across folds. By using a probabilistic approach, the classifier performed more reliably because it directly captured data uncertainty. Further sensitivity analysis revealed that the prediction entropy reached a plateau once about 33% of the data was used for training, indicating that adding more samples did not contribute to reducing uncertainty. Overall, the study concludes that improving design classification requires better features, stronger modeling techniques, and more diverse data.
As future work, learning assessment data can be collected by teaching the proposed course in various engineering programs. Parallel studies in literature have shown that uncertainty-aware, data-driven conceptual design is not only technically beneficial but also pedagogically essential in STEM program education. Consequently, the proposed course can be easily generalized to accommodate learning goals across different disciplines.
Footnotes
Funding
The authors received no financial support for the research, authorship, and/or publication of this article.
Declaration of Conflicting Interests
The authors declared no potential conflicts of interest with respect to the research, authorship, and/or publication of this article.
Author Biographies