






Abstract
Introduction
Mitosis-karyorrhexis index (MKI) is important for risk stratification workup of neuroblastic tumors. MKI is calculated by estimating the denominator (5000 tumor cells). We hypothesized that whole slide image (WSI) with appropriate digital image analytical software could provide an objective aid to pathologist’s MKI workup.
Materials & Methods
With IRB approval, sixteen cases of neuroblastic tumors as convenient cases were used. H&E slides were scanned at 40X using an Aperio Scanscope AT2 scanner and stored in SVS format. Digital photos were also taken and stored in TIFF format. Qupath, an open source image analytical software, was used to annotate, define region of interest (ROI) and automatically count the cells within ROI.
Results
With selected parameters, Qupath was able to provide cell count using both WSI (.svs) and digital images (.TIFF). Comparison of automated count and eyeball manual count generated precision above .96, recall above .96, F1 scores above .98, with false positive rate ranging from .6 to 3.7%, and false negative rate from .6 to 3.8%. Compared to original pathological report, automated tumor cell count led to lower MKI in 3 of 16 cases (18.8%) and change of “unfavorable histology” to “favorable” in one case (1/16, 6.3%).
Conclusion
Combination of WSI (or digital images) with Qupath is able to provide an automated, objective and consistent way for cell count to facilitate pathologist’s MKI determination in neuroblastic tumors’ workup and research.
Introduction
Neuroblastoma is a common tumor predominantly affecting mainly children before 5 years old. The average age at diagnosis is around 1 to 2 years. Neuroblastoma is characterized by clinical and histopathologic heterogeneity. 1,2 Depending on the result of risk stratification, children with neuroblastic tumors will be given different options of treatment. 2 The risk stratification systems have been evolving over the last several decades to classify patients into low, intermediate and high risk disease groups. 1,2 The parameters used by the Children’s Oncology Group (COG) include age at diagnosis, disease stage defined by the International Neuroblastoma Staging System (INSS), histology classification based on the International Neuroblastoma Pathology Classification (INPC) criteria, MYCN amplification status, chromosomal segmental aberration and ploidy status. 1,2
Shimada and colleagues developed and later the INPC updated the histology grading system to classify neuroblastic tumors into favorable or unfavorable histology. These features include grade of tumor differentiation, percentage or quantity of Schwannian stroma, age and mitosis-karyorrhexis index (MKI). 3-5
MKI is defined by the percentage of mitosis and karyorrhexis in high power-field, and categorized as low (<2% or <100 mitotic and karyorrhectic cells), intermediate (2-4% or 100-200 mitotic and karyorrhectic cells), and high (>4% or >200 mitotic and karyorrhectic cells) per 5000 cells. According to COG experience, mitosis and karyorrhexis could vary from area to area, so does the cellularity of background tumor cells. COG working group preferred to average the numbers of mitotic and karyorrhectic cells from multiple representative microscopic fields of all the sections available, to the counting based on the evaluation of “hot spots” (a single or a few areas of the highest activities). Counting MK is cumbersome for pathologist. In general MKI is calculated by estimating the denominator (5000 tumor cells). 3-6
Entering the era of digital pathology, the ability of acquiring high resolution digital images of entire microscopic slide (whole slide image, WSI) by whole slide scanner make it possible to perform tasks like digital image analysis. In recent years, a broad variety of biomedical image analysis software, both commercial and open source, have been developed. We hypothesized that WSI with selected digital image analysis software could provide an objective aid to pathologist’s cell count, to provide a relatively more objective and consistent way to determine MKI, for both clinical and research use.
Materials and Methods
Institutional Review Board (IRB) Approval
Current study (AI in pediatric pathology) was reviewed and approved by the Institutional Review Board (IRB) office, Washington University in St. Louis, with IRB ID # 202107131.
Case Selection
Sixteen cases of neuroblastic tumors from 2016 to 2021, as convenient cases, were used. Multiple slides from same case were used.
Whole Slide Scanning and Whole Slide Image
H&E slides were scanned at 40X using an Aperio Scanscope AT2 scanner (Leica Biosystems, Wetzlar, Germany) and stored in SVS format.
Digital Photography
Digital photos (DP) of H&E stain slides were generated through Olympus DP71 digital camera with Olympus cellSense Entry software, saved and stored in TIF format.
Qupath
QuPath (https://qupath.github.io) is an open source desktop software application specifically designed to analyze and explore whole slide imaging data. 7,8 It was adopted to view, annotate, and count cell numbers for both WSI and digital photos in current study, within region of interest (ROI). 7,8
Annotation
Following online instructions, WSI and digital images were annotated using Qupath.
7,8
Briefly, in Qupath, project was created and WSI images imported to the project. Annotations for “tumor”, “mitosis” and “karyorrhexis” were performed by circulating corresponding components (tumor as t, mitosis as m and karyorrhexis as k) with different color circles, see Figure 1. Since tumor cells were far more than m/k, a region of tumor cells could be annotated with a big circle, along with being individually circled (see Figure 1). Example of annotation of whole slide image (WSI) in neuroblastoma. Tumors annotated by blue circle, mitosis annotated by red circle and karyorrhexis by black circle. The number at the left middle part of screen indicted the number of different annotated objects.
Depending on the size of pathologic specimen, in general, appropriately one to five hundred (100-500) objects (tumor cell, mitosis and karyorrhexis) were annotated per case.
Counting Parameters and Script
For cell count function, a series of parameters were involved and adjusted, usually including ["detectionImageBrightfield”: “Hematoxylin OD”, “requestedPixelSizeMicrons”: .5, “backgroundRadiusMicrons”: 15.0, “medianRadiusMicrons”: 1.5, “sigmaMicrons”: 1.0, “minAreaMicrons”: 5.0, “maxAreaMicrons”: 300.0, “threshold”: .04, “maxBackground”: 10.0, “watershedPostProcess”: true, “cellExpansionMicrons”: 1.4032, “includeNuclei”: false, “smoothBoundaries”: true, “makeMeasurements”: true}')]. The most frequently adjusted parameters included min to max area, which determines the area occupied by cell; sigma, which determines the degree of cell fusion; and threshold, which determines the staining density, the larger, the less objects with lighter staining would be included.
Cell Count Script Running
Briefly, open Qupath; Open the project in Qupath; open the image you want to analyze; Use drawing method (circle, rectangle, polygon, etc.) to draw ROI on the image; Go to Automate → Show Script Editor (In Script Editor, open “File” and “open” and chose script “groovy”); Select the correct script and click Run → Run; cells would be detected and showed up on the image (see Figure 2). Example of tumor cell count in WSI. (A). Select a region (can be any shape), as demonstrated by the yellow box, in WSI. (B). Qupath detected 183 tumor cells automatically, as circled with blue within the region circled by yellow box selected by pathologist. (C). Multiple regions were selected, as demonstrated by the colored boxes. (D). Qupath detected the total number of cells within multiple boxes. Abbreviation: WSI = whole slide image.
Then go to the Annotations tab. On the lower-left corner, Qupath will summarize how many cells have been detected within the ROI(s) (see Figure 2).
In the Annotations tab, you can also select specific object to see the summary of cells inside this object (ROI).
Cell Count by Qupath “Cell Detection” Function
Alternatively, cell count could be conducted using the “cell dection” function via the following steps: Qupath → “Open project” → double click the images in which cells needed to be counted → draw a ROI in the image opened → “Analyze” → “Cell detection” → adjusting parameters in “cell detection screen” → “Run” → “Annotation”. The cell count would be displayed in “Annotation” tab.
Cell Count Performance Evaluation
Images analysis were automated with cell count script. Same area with object set was printed as color print. Manual counting (eyeball counting) of printed area was performed by board certified pediatric pathologist (MH). Automated count was compared with manual counting (Figure 3). Parameters were adjusted based on performance determined by eyeball counting as the gold standard method. The same foci that were used in the printed format were used by the software recognition. Cells located at the drawing line (for region of interest) were not included. (A) representative digital photo of a neuroblastic tumor case, H&E, 400X. (B). Qupath demonstrated cell count in digital photo as A. In this case, it yielded a count of 1072 within the highlighted box. (C) Manual count of potentially missed cell (by Qupath) circled in Green, as 6 (6), adding the total cell count to 1078; mitosis and karyorrhexis (MK) circled in yellow, as 8. Together, a mitosis-karyorrhexis index of .7% was obtained.
For cell counting script performance testing, the following parameters were used (SigmaMicron 1.0; minAreaMicron 5.0, maxAreaMicron 300.0, and threshold .04).
Phox2B Immunohistochemistry
Phox2B (RTU rabbit monoclonal (EP312) from Cell Marque, Rocklin, CA, USA) immunohistochemisty (IHC) was performed in the Histology Laboratory, Department of Pathology and Laboratory Medicine, Children’s Hospital Los Angeles, following institutional standard procedures.
Cell Detection & Count by Phox2B Immunohistochemistry (“Positive Cell Detection”)
Qupath → “Open project” → Double click the images in which cells needed to be counted → drawing a ROI in the image opened (Figure 4A.) → “Analyze” → “Cell detection” → “Positive cell detection” and adjusting parameters in “positive cell detection tab” → choosing “Optical density sum” in “Detection image” → “Run” → “Annotation”. The cell count would be displayed in “Annotation” tab (Figure 4B). Qupath can count cells by different staining intensity. (A) Cell detection and count by Phox2B immunohistochemistry. Region of interest (ROI) was selected with a box in an image of Phox2B immunohistochemistry. (B) Cell detection and count by Phox2B immunohistochemistry. Within ROI of Phox2B immunohistochemistry, strongly stained nuclei (Num 3+) were detected with red circle; occasional weakly stained cell (Num 2+) was detected with yellow circle. Non-neuroblastic nucleated cells (negative cell, Num 1+) were detected with blue circle (not shown in current field). These 3 types of cells were counted separately in the left Annotation tab.
Above function could also be accomplished through a script-based approach.
Statistical Analysis
Since in current study, in any image of tumors, there was no true negative (of tumor cells), the cell count function using Qupath, with above parameters, was evaluated for the following characteristics: Precision = TruePositives/(TruePositives + FalsePositives); Recall = TruePositives/(TruePositives + FalseNegatives); F-Measure = (2 * Precision * Recall)/(Precision + Recall). 9
Results
Whole Slide Image Generation
Thirty three (33) WSI were generated from 20 neuroblastic tumor cases, of either biopsy or resection, ranging from 1 to 4.2 GB in size. These cases included 16 neuroblastoma (13 poorly differentiated and 2 differentiating subtypes), and 1 ganglioneuroblastoma nodular subtypes.
Cell Count in WSIs and in Digital Photos With H&E Stains and Immunohistochemistry
With a script developed by us which set the running parameters, the Qupath was able to give automated cell count in region/(s) of interest (ROI) in WSIs of H&E stain selected by pathologist, with examples demonstrated in Figure 2.
The script developed with parameters set (see “Counting parameters and script” in Materials & Methods) could count tumor cells within one selected region (Figure 2A, region selected; and Figure 2B, cells counted within selected region), or multiple selected regions (Figure 2C, multiple regions selected; Figure 2D, cells counted in all selected regions) in WSI. False negative result included multiple tumor cells counted as one, or tumor cells missed for unknown reasons. False positive result included examples of one cell artificially counted as multiple, or neuropil fiber aggregates as tumor cell, or endothelial cells counted as tumor cells. Mitosis and karyorrhexis could not be recognized or classified.
The function could also be run on digital photos, with examples demonstrated in Figure 3 (Figure 3A, digital photo of H&E stain at 400X; Figure 3B, region selected in digital photo and cells counted; Figure 3C, manual review of cells counted and manual count of mitosis and karyorrhexis). The application yielded a cell count of 1072 in one 400X photo (approximately 440 × 330 μ). The manual review suggested no obvious false positive, and that 6 possible cells were missed by the application (false negative). Manual counting of m and k generated a count of 8, leading to a MKI of .7% [8/(1072 + 6 = 1078)], low MKI, the same result as in the original report.
Due to the presence of false positive result, such as counting endothelial cells, in H&E stained slides, cell detection and count with Phox2B immunostain, using Qupath “positive cell detection” function was also attempted. The automation could detect and count Phox2B stained nuclei of neuroblastic tumor cells (Figure 4A and B).
Cell Count Automation Performance Evaluation
Cell Counting Performance Evaluation.

Abbreviation: WSI = whole slide image
Comparison of Mitosis-karyorrhexis index and risk classification between by histology in original reports and by computer-aided approach.
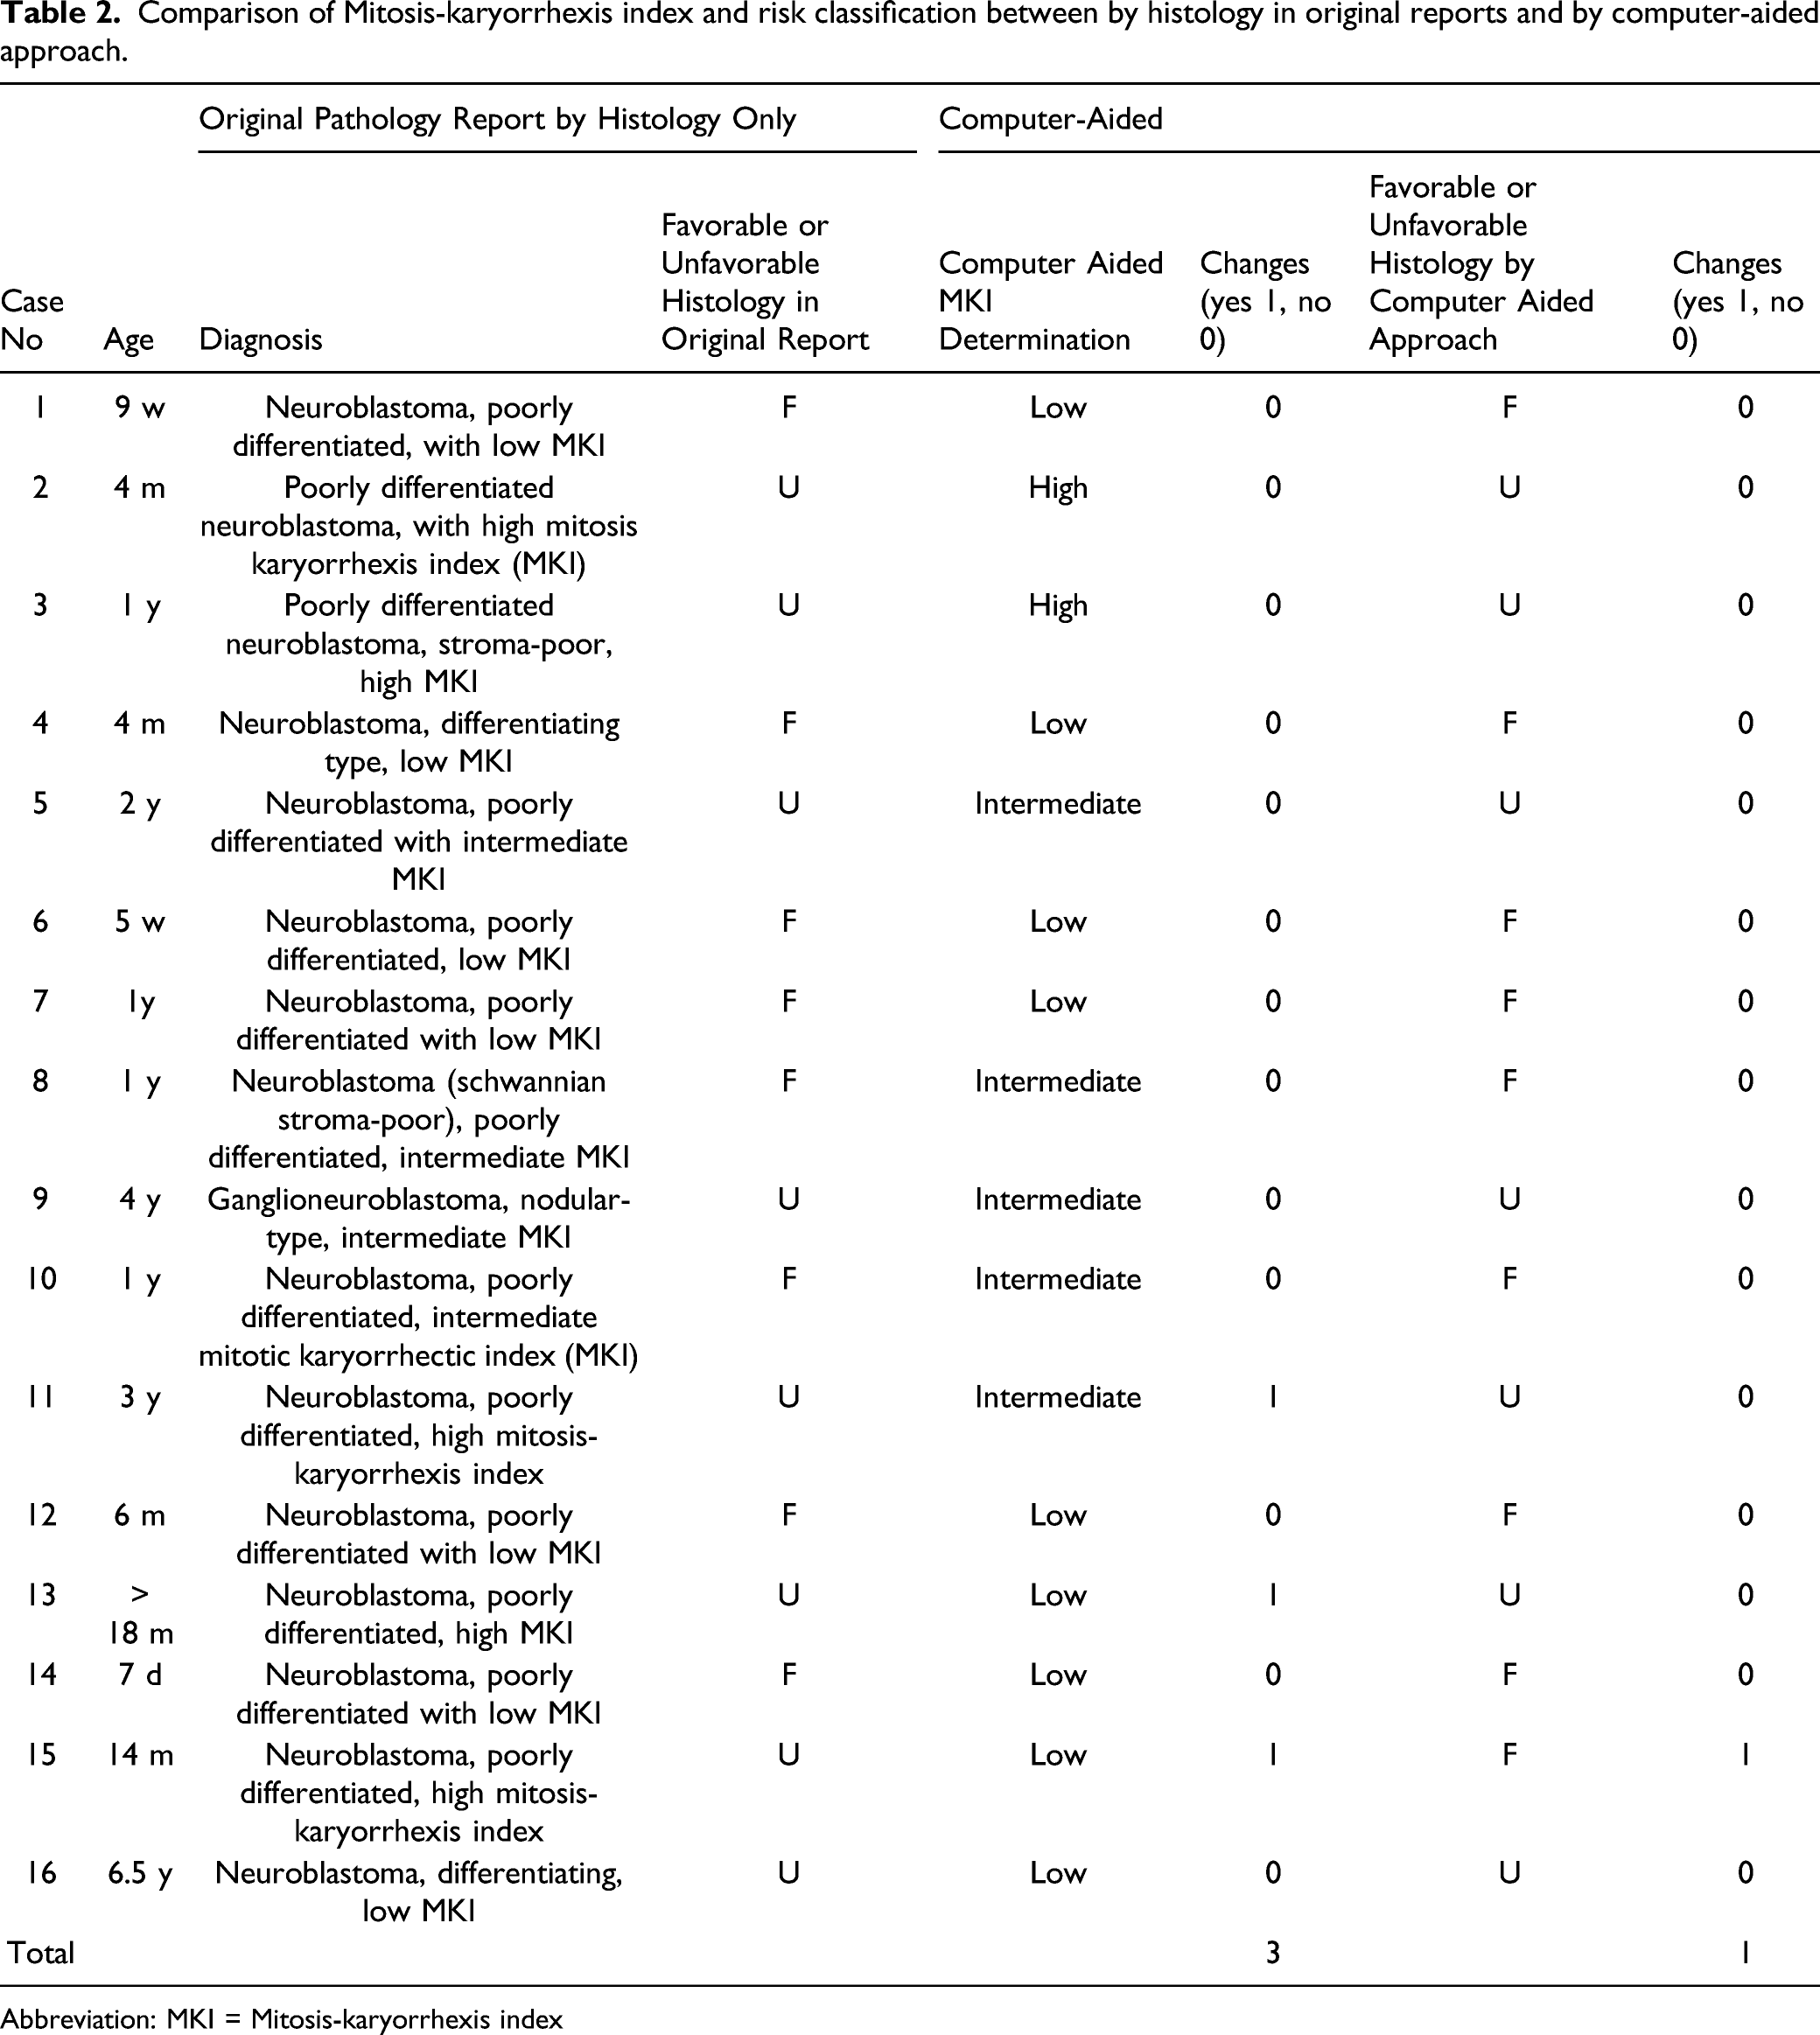
Abbreviation: MKI = Mitosis-karyorrhexis index
Discussion
In current study, we demonstrated an automated tumor cell count to provide a semi-automated way for MKI determination in cases of neuroblastic tumors using WSI and Qupath imaging software. With our approach, pathologist could select one or multiple regions until approximately 5000 cells, and then manually count mitosis and karyorrhexis within these regions. In this way, MKI could be calculated with exact count instead of estimating the tumor cells. Same strategy could be applied to digital graphs. Current study is the first one in medical literature for cell count in neuroblastic tumors using WSI, digital photography and image analytic software. This approach, available for both H&E and immunostains, for both WSI and digital photos, provide an objective, consistent and documentable approach for clinical research. It also carries the advantage of turning categorical variables into continuos variables.
Suggested Ways to Count Cells Using Qupath for Both WSI and Digital Images
In institutions with WSI facility, Pathologist could submit an H&E slide of neuroblastic tumor for WSI. Pathologist can then review the WSI using Qupath. Pathologist could count cells within a ROI, or multiple ROIs until 5000 cells reached, within a WSI using methods described above.
In institutions with no WSI facility, pathologist could take 5-6 400x digital images and count cells within the whole image digital photo.
Cell Counting in Neuroblastic Tumors Which Have a Wide Spectrum of Morphology
Neuroblastic tumors are characterized by heterogeneity both clinically and histopathologically. Neuroblastic tumors are microscopically characterized by features including neuroblastic tumor cells with different degrees of differentiation, neuropil, Homer Wright pseudorosette, blood vessels and blood cells including both red blood cells, and variable amount of Schwannian stroma. While MKI is important for risk stratification for patients with neuroblastic tumors, manual cell counting is a very labor-intensive and time-consuming task. The manual counting also has an inherent weakness, which is the reproducibility issue.
In current study, we were able to accomplish cell count which includes the counting of neuroblast (tumor cells). The automation appears to recognize tumor cells, endothelial cells and white blood cells as “tumor cells”, reflecting that possibly it recognize nucleated cells. These cell types could be differentiated by adjusting the parameters, such as the cell area (minAreaMicron and maxAreaMicron), and staining density (threshold). Multiple tightly packed cells, for example in highly cellular undifferentiated or solid area, or Homer Wright pseudorosettes, could be counted as one cell (false negative). This issue can be partially overcome by lowering the SigmaMicron parameter.
H&E nuclear detection could also be affected by section thickness and staining quality. For example, too thick section could produce nuclei overlapping, leading to false negative results. Again, fine parameter adjustment might help address this issue.
For the issue of false positive, such as mistaking nucleated endothelial cells or white blood cells as neuroblastic tumor cells, immunohistochemistry (IHC) based nuclear detection, such as Phox2B, could provide a more specific and precise NB cell detection and count. However, IHC makes recognition of mitosis and karyorrhexis almost impossible. In addition, same issues in H&E such as thick section would lead to the same false negative issue from nuclei overlapping. A related issue is that neuroblastic cells have different degree of differentiation and morphology towards ganglion cells. The current H&E approach seems to be able to count these more differentiated ganglion cell like tumor cells by catching the nuclei. Ultimately, the IHC approach probably would be the solution to overcome the challenges brought by heterogeneity in cell differentiation and morphology in neuroblastic tumors.
Comparison of Shimada Classification by Conventional Manual Count Versus Computer-Aided Count
In diagnosis of neuroblastic tumors, the near-exact, objective and consistent cell count of tumor cells were nearly impossible. It was usually accomplished by estimation, such as high cellularity: 700-900 cells per HPF, moderate cellularity: 400-600 tumor cells, and low cellularity with extensive neuropil: 100-300 cells per HPF. 4 Figure 3 showed a tumor high at the moderate cellularity range (600 tumor cells per HPF as suggested 4 ) but Qupath gave a count of 1072. The difference could be 78.7% [(1072-600)/600]. This could lead to potential change in MKI group and even favorable vs unfavorable histology. For example, in a child with age between 1.5 to 5 years old, with differentiating neuroblastoma, the manual count of MKI could put the child as high or intermediate MKI (and unfavorable histology), but the computer-aided count could suggest a low MKI, thus favorable histology. In our study cohort, we did see a change of high MKI by manual count to intermediate or low MKI by automated count in 3 of 16 cases (18.8%), but only resulting in change of “unfavorable biopsy” to “favorable biology” in one case (case #15, 1/16, 6.3%). This case’s patient was 14 months old (<1.5 years old), with neuroblastoma, poorly differentiated, high MKI, thus in the “unfavorable histology group”. The computer count changed this case to low MKI, thus in the “favorable histology group”.
Assay Performance
For current cell count script with specific parameters, accuracy and specificity were not calculated because that both values require True Negative in the calculation, which were absent in current study. Therefore, instead of Sensitivity and Specificity, we calculated precision and recall. For the final number to evaluate the cell count detection model, we used the F1 score. Precision and recall are not the best ways to evaluate our model because they either ignore false positives or false negatives in the formula. We chose the F1 score that summarizes precision and recall to get a full picture of the model’s performance. The F1 score is between 0 and 1, and it is the higher the better. From the table above, all the F1 scores are greater than .95. This indicates that the detection model gets insight into the picture so it can find cells very accurately.
While the F1 score evaluates the performance of the model, and while false positive and false negative rates varied up to 3.7 and 3.8%, respectively, in real life, the performance would be better since users may have the same amount of false positive and false negative which would offset each other, so even the model makes mistakes, the user still gets the correct number of cells.
WSI Versus Digital Images
Digital photo can be stored in TIFF format (Tagged Image File Format) which support multiple “pages” or images as well as a variety of storage formats and compression methods. An SVS file is a Tiled TIFF image that has a few additional pages (images) that include the slide label, overview image, and a few smaller, scaled copies of the scanned slide. SVS files are used by a number of medical/microscope scanners such as Aperio. They are often very large in size. 10,11
Our success of applying same script and same parameters setting used in WSI in TIFF digital images provides a convenient alternative for those institutions without a WSI facility.
Limitation
While this is a proof of principle study, the relatively small sample size (n = 16) is a limitation. Second, it may need parameter adjustment to deal with histological processing variation such as section thickness. Importantly it could not classify mitosis, karyorrhexis from tumor cells.
Future Direction: Automated Mitosis Detection
The next step is to have fully automated MKI determination by machine learning. However, there are a few major challenges towards this goal based on studies from other cancer types.
The potential major challenge is the markedly imbalanced signal to noise ratio in cancer histology, including neuroblastic tumor histology, as summarized by Nateghi. 12 We also found that the MKI could be as low as less than .01% in WSI with millions of cells. To solve the problem of the imbalanced dataset, different methods were proposed, including re-sampling, such as random oversampling with augmentation and random undersampling, optimization-based processing to reduce the false positives (non-mitoses), and to employ hard negative mining. 12
Second, WSI is huge in size, as exemplified by that the size of WSI used in current study could range up to 5 GB. This size poses a challenge to the computing capacity for both computers and imaging software.
Footnotes
Acknowledgments
We appreciate the excellent work of Path Digital Image Center, Department of Pathology & Immunology, Washington University in St. Louis School of Medicine.
Declaration of Conflicting Interests
The author(s) declared no potential conflicts of interest with respect to the research, authorship, and/or publication of this article.
Funding
The study was supported by the Department of Pathology & Immunology faculty development fund to Dr Mai He, Washington University in St Louis School of Medicine (PJ000023111).
