
Abstract
Simulating large-scale, high-fidelity population health models demands immense computational resources and efficient parallelization strategies. We present the design and performance of Enable (Efficient National-scale Agent-Based Learning Environment), a hybrid CPU-GPU agent-based modeling framework optimized for the Frontier supercomputer. Enable generates contact networks directly from activity schedules, enabling location-based parallel execution without relying on precomputed contact graphs. A GPU device constructs contact networks and uses an efficient load balancing algorithm to assign locations to processors, while CPUs perform the simulation tasks. This design achieves high parallel efficiency by ensuring balanced edge distributions across processors, resulting in uniform execution times. We evaluate both strong and weak scaling using synthetic and real-world datasets generated from UrbanPop, Uber H3, and OSM maps. Scaling performance is studied with city-to national-scale population sizes on up to 1200 GPUs of the Frontier supercomputer. Enable addresses key computational challenges in large-scale high-fidelity agent-based simulations that beset the development of national-scale virtual population health twins.
Keywords
1. Introduction and background
Agent-based modeling (ABM) has historically been widely used in infectious disease epidemiology to model the transmission of disease and the efficacy of interventions. Its reach as a decision-making tool for hospital administrators, public health policy makers, industrial health, and human health security is, however, much broader. ABMs are well suited for simulating complex systems characterized by high variability and shaped by multiple interacting determinants operating across different levels, often resulting in emergent phenomena. These simulations can serve as virtual representations, or twins, for population health. Virtual population health twins enable in silico exploration of system behaviors and testing the effects of exposure to potentially harmful substances in the work or everyday environment, public health interventions, and spread of infectious diseases in a controlled setting Colasanti et al. (2022); Li et al. (2016); Lu and Habre (2023); Luke et al. (2017); Scott et al. (2015); Raab et al. (2022); Tracy et al. (2018). The utility of these simulations, however, is dependent upon how well the models can characterize the population and there is a sharp trade-off between computational cost and model realism.
Computational tools that enable in silico experimentation can leverage large volumes of data to provide an integrated view of population health that mirrors the complexity and heterogeneity that exist in the real world. A prototype for virtual, dynamic, data-driven representations of human populations that can be used to predict disease, develop targeted interventions and prevent chronic diseases is under development within a larger project. Upon completion, these virtual population health twins are expected to serve as tools that can be used to optimize human health and longevity. This paper reports the parallel design and performance of a high-fidelity data-driven simulation engine, called The data-driven dynamic 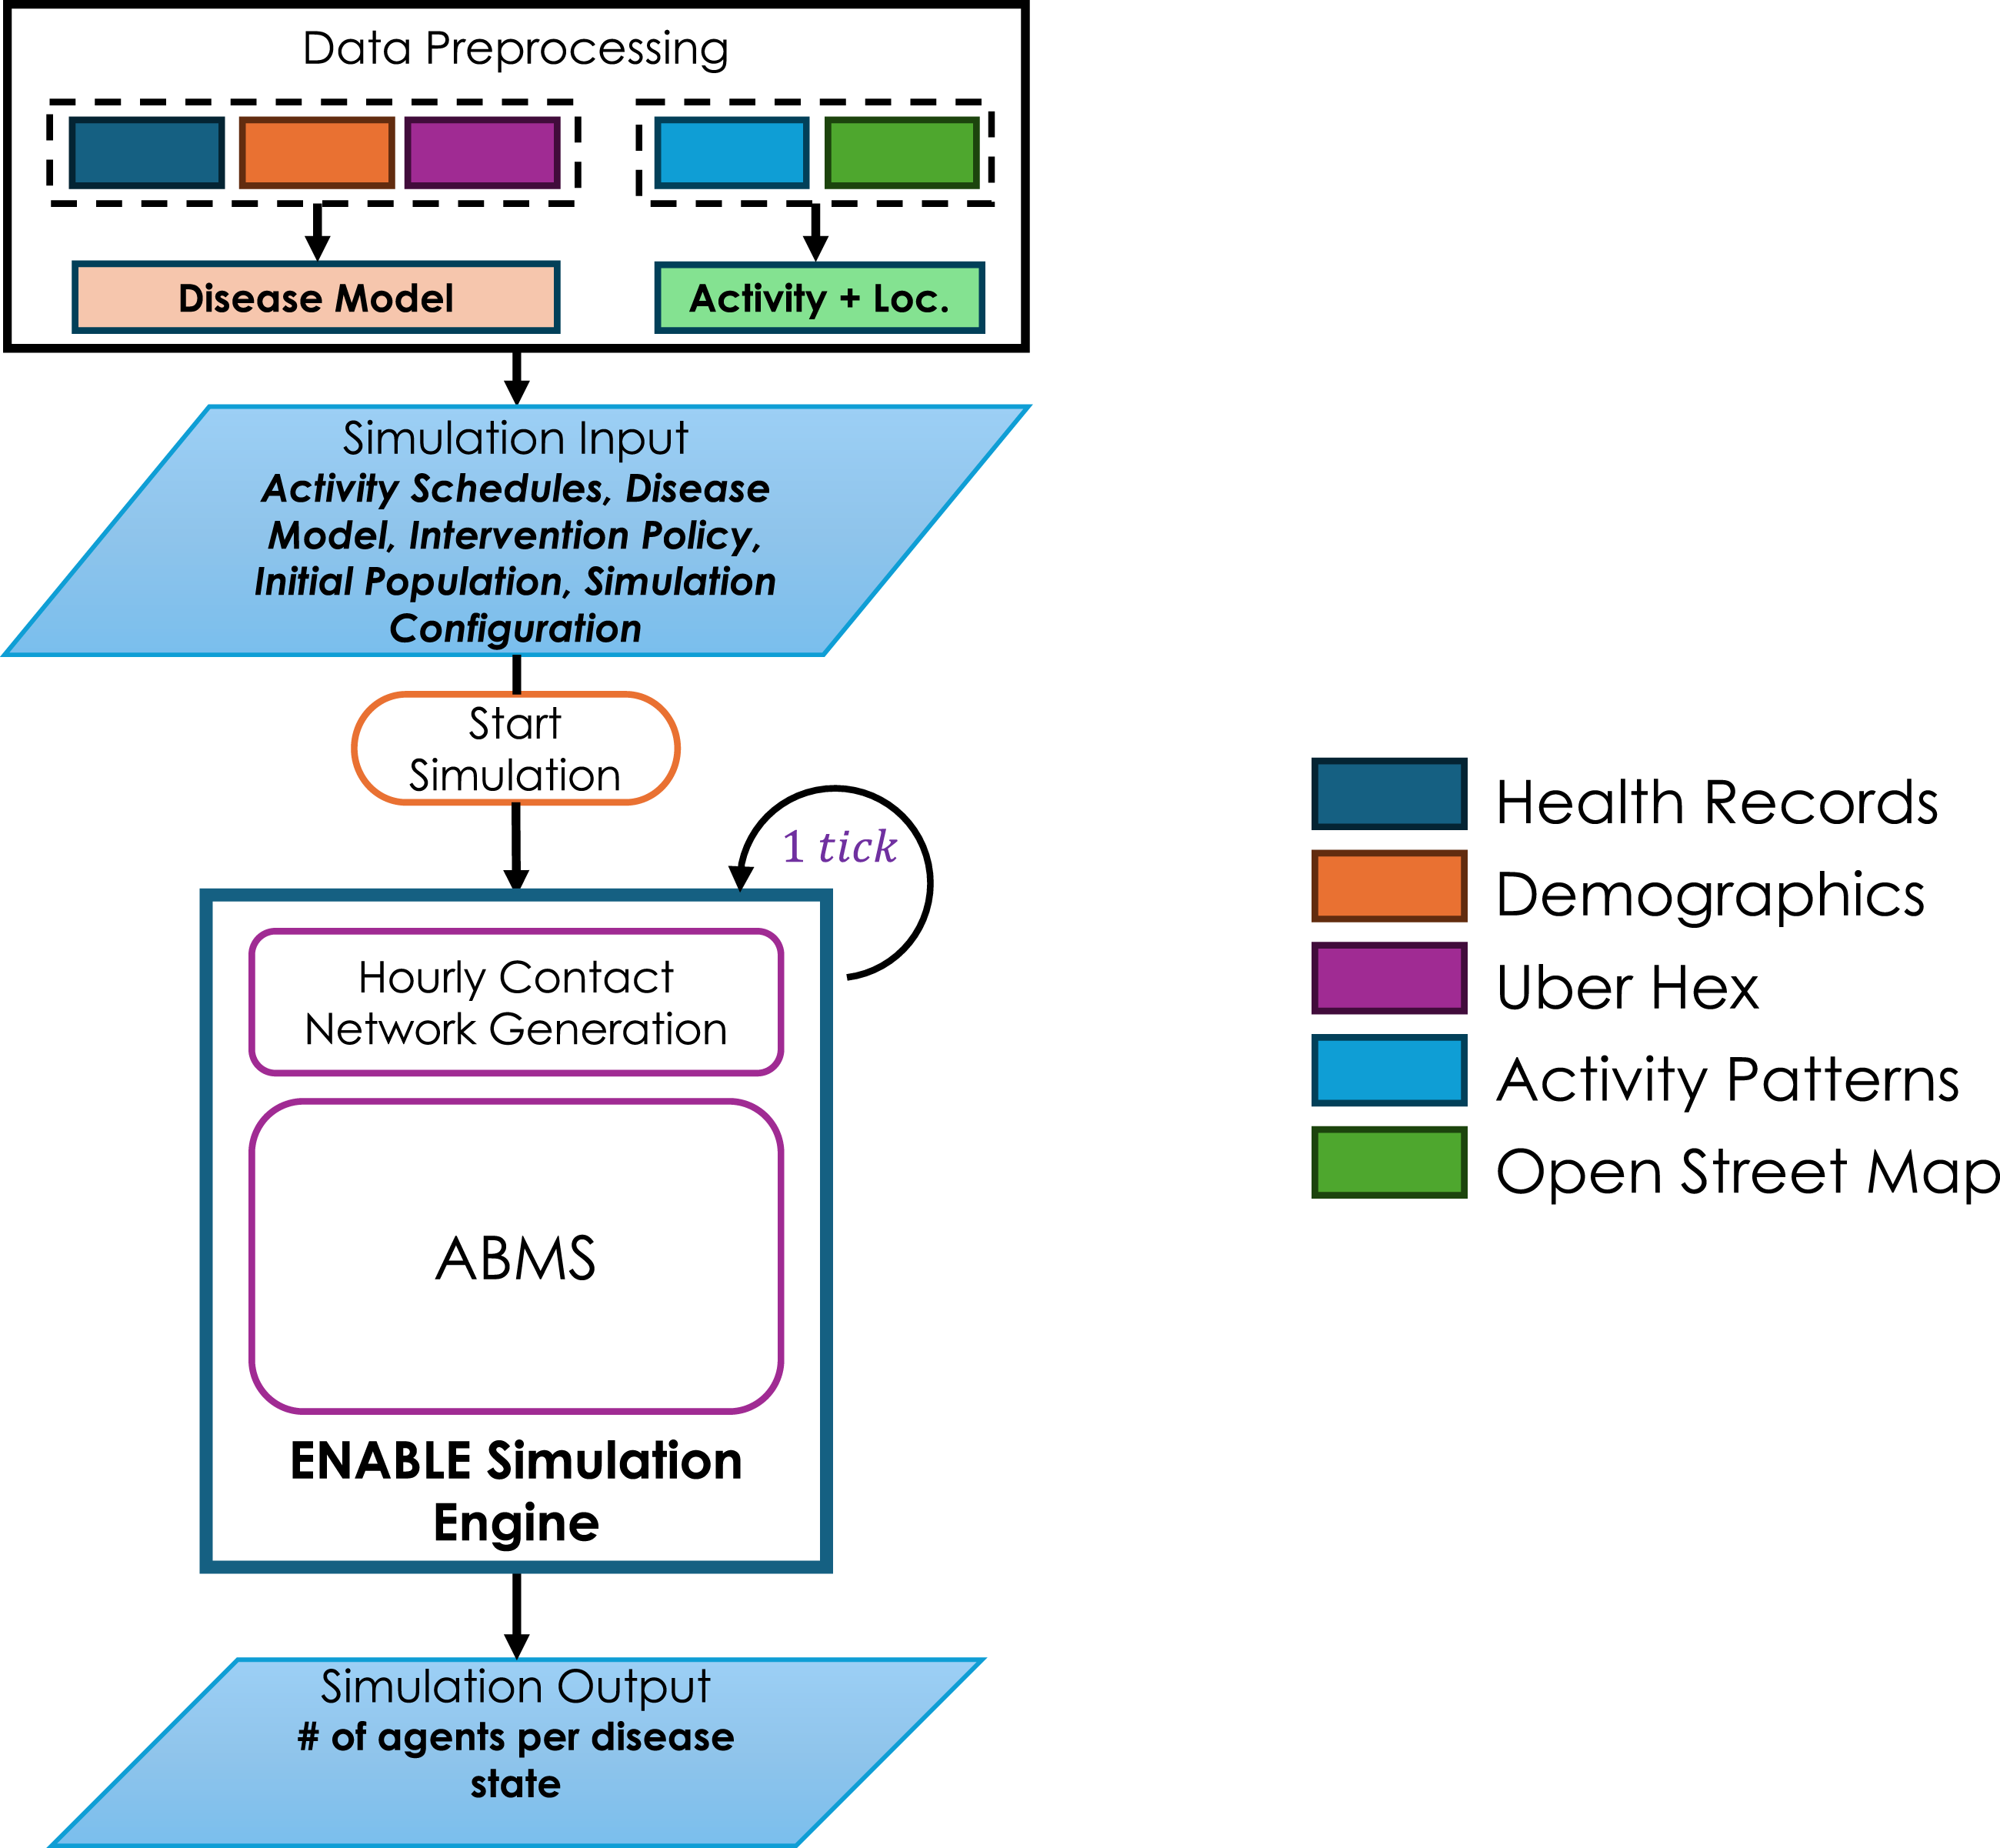
ABM is well suited to investigate population health dynamics because it captures the heterogeneity of individuals and their behaviors within a complex environment. Unlike aggregate models, ABMs simulate individual agents – each with unique attributes such as age, occupation, health status, and daily routines – and model their interactions with other agents and their environment over time. This allows for a granular representation of how diseases spread, how people respond to interventions, and how social, spatial, and behavioral factors influence health outcomes. ABMs are particularly powerful for exploring ”what-if” scenarios, such as the impact of targeted intervention strategies for public health planning and epidemic response. However, key computational challenges must be addressed before the benefits of large-scale high-fidelity ABM simulations for real-world decision support can be realized.
1.1. Computational challenges
National-scale ABMs have demonstrated the epidemiological importance of preserving fine-grained population heterogeneity Chen et al. (2024). High-fidelity ABMs often involve simulating millions or even hundreds of millions of agents that interact over time and space, often with fine-grained individual behaviors and environmental contexts. Achieving strong and weak scaling across thousands of computing processes in a distributed memory setting on a heterogeneous CPU-GPU parallel computer is non-trivial due to the irregular, dynamic nature of agent behaviors. Agents do not interact uniformly in space or time – urban centers may see dense, overlapping interactions while rural regions remain sparse, leading to unbalanced workloads.
Scalability is also adversely affected by the diversity of agent behaviors and model heterogeneity. In many simulations, agents engage in different activities with varying computational costs – e.g., disease transmission calculations, policy compliance checks, and mobility updates – which makes uniform parallel execution difficult. Unlike numerical simulations with predictable computation patterns, ABMs are event-driven and highly asynchronous. This unpredictability challenges traditional load-balancing strategies.
Furthermore, as simulations are scaled up to national levels, inter-node communication and synchronization can become scalability bottlenecks, especially when agents need to frequently update shared data structures such as time-varying contact networks. Achieving scalability requires not only dividing computation evenly but also reducing inter-dependencies and optimizing communication between distributed components. Communication overhead increases when agent interactions span partition boundaries, especially in spatially distributed simulations. Efficient domain decomposition, interaction locality, and communication minimization are essential to maintaining high parallel efficiency.
ABMs often lack fine-grained representations of the actual location of individuals over time, failing to faithfully represent population movement and interactions. As models are often developed to predict macro level outcomes, trade-offs between model specificity and computational complexity are often accepted. However, these concessions limit ABM’s ability to capture contextual dependencies; ignoring interactions between agents, their geospatial contexts, and the effects on the disease of interest. Additionally, temporal modeling of contacts that consider an agent’s sequential pattern of exposure and the evolution of networks over time enable greater insights into spatiotemporal trajectories of exposure and disease. These methods have become more prevalent, supported by techniques such as time-sliced contact graphs and dynamic location-based interaction modeling.
Despite these advances, challenges remain in harmonizing heterogeneous data sources, achieving real-time simulation speeds, and ensuring reproducibility. Our work builds on these foundations by integrating high-fidelity activity schedules, real-world spatial data, and scalable contact network generation into a unified, high-performance ABM framework designed for context-aware population-scale health simulations. We improve spatiotemporal realism through the integration of platforms like UrbanPop Tuccillo et al. (2023), OpenStreetMap (OSM) OpenStreetMap contributors (2017), and Uber H3 Technologies (2022), enabling more accurate modeling of movement, collocation, and urban infrastructure. The
In this preliminary study, we address a number of these challenges using a data-driven approach that is complemented by efficient load-balancing and communication hiding strategies to maximize heterogeneous parallel performance of the ABM simulations on the Frontier supercomputer and present initial performance results on up to 1200 GPUs across multiple population scales.
1.2. Contributions
In this paper, we present a hybrid CPU-GPU framework, called • • • • •
Evaluations are presented to demonstrate excellent weak and strong scaling performance using both synthetic and real-world datasets that include Urban-Pop (activity schedule generation), Uber H3 Hex (location indexing and spatial partitioning) and OpenStreetMap (geographic context and points of interest identification).
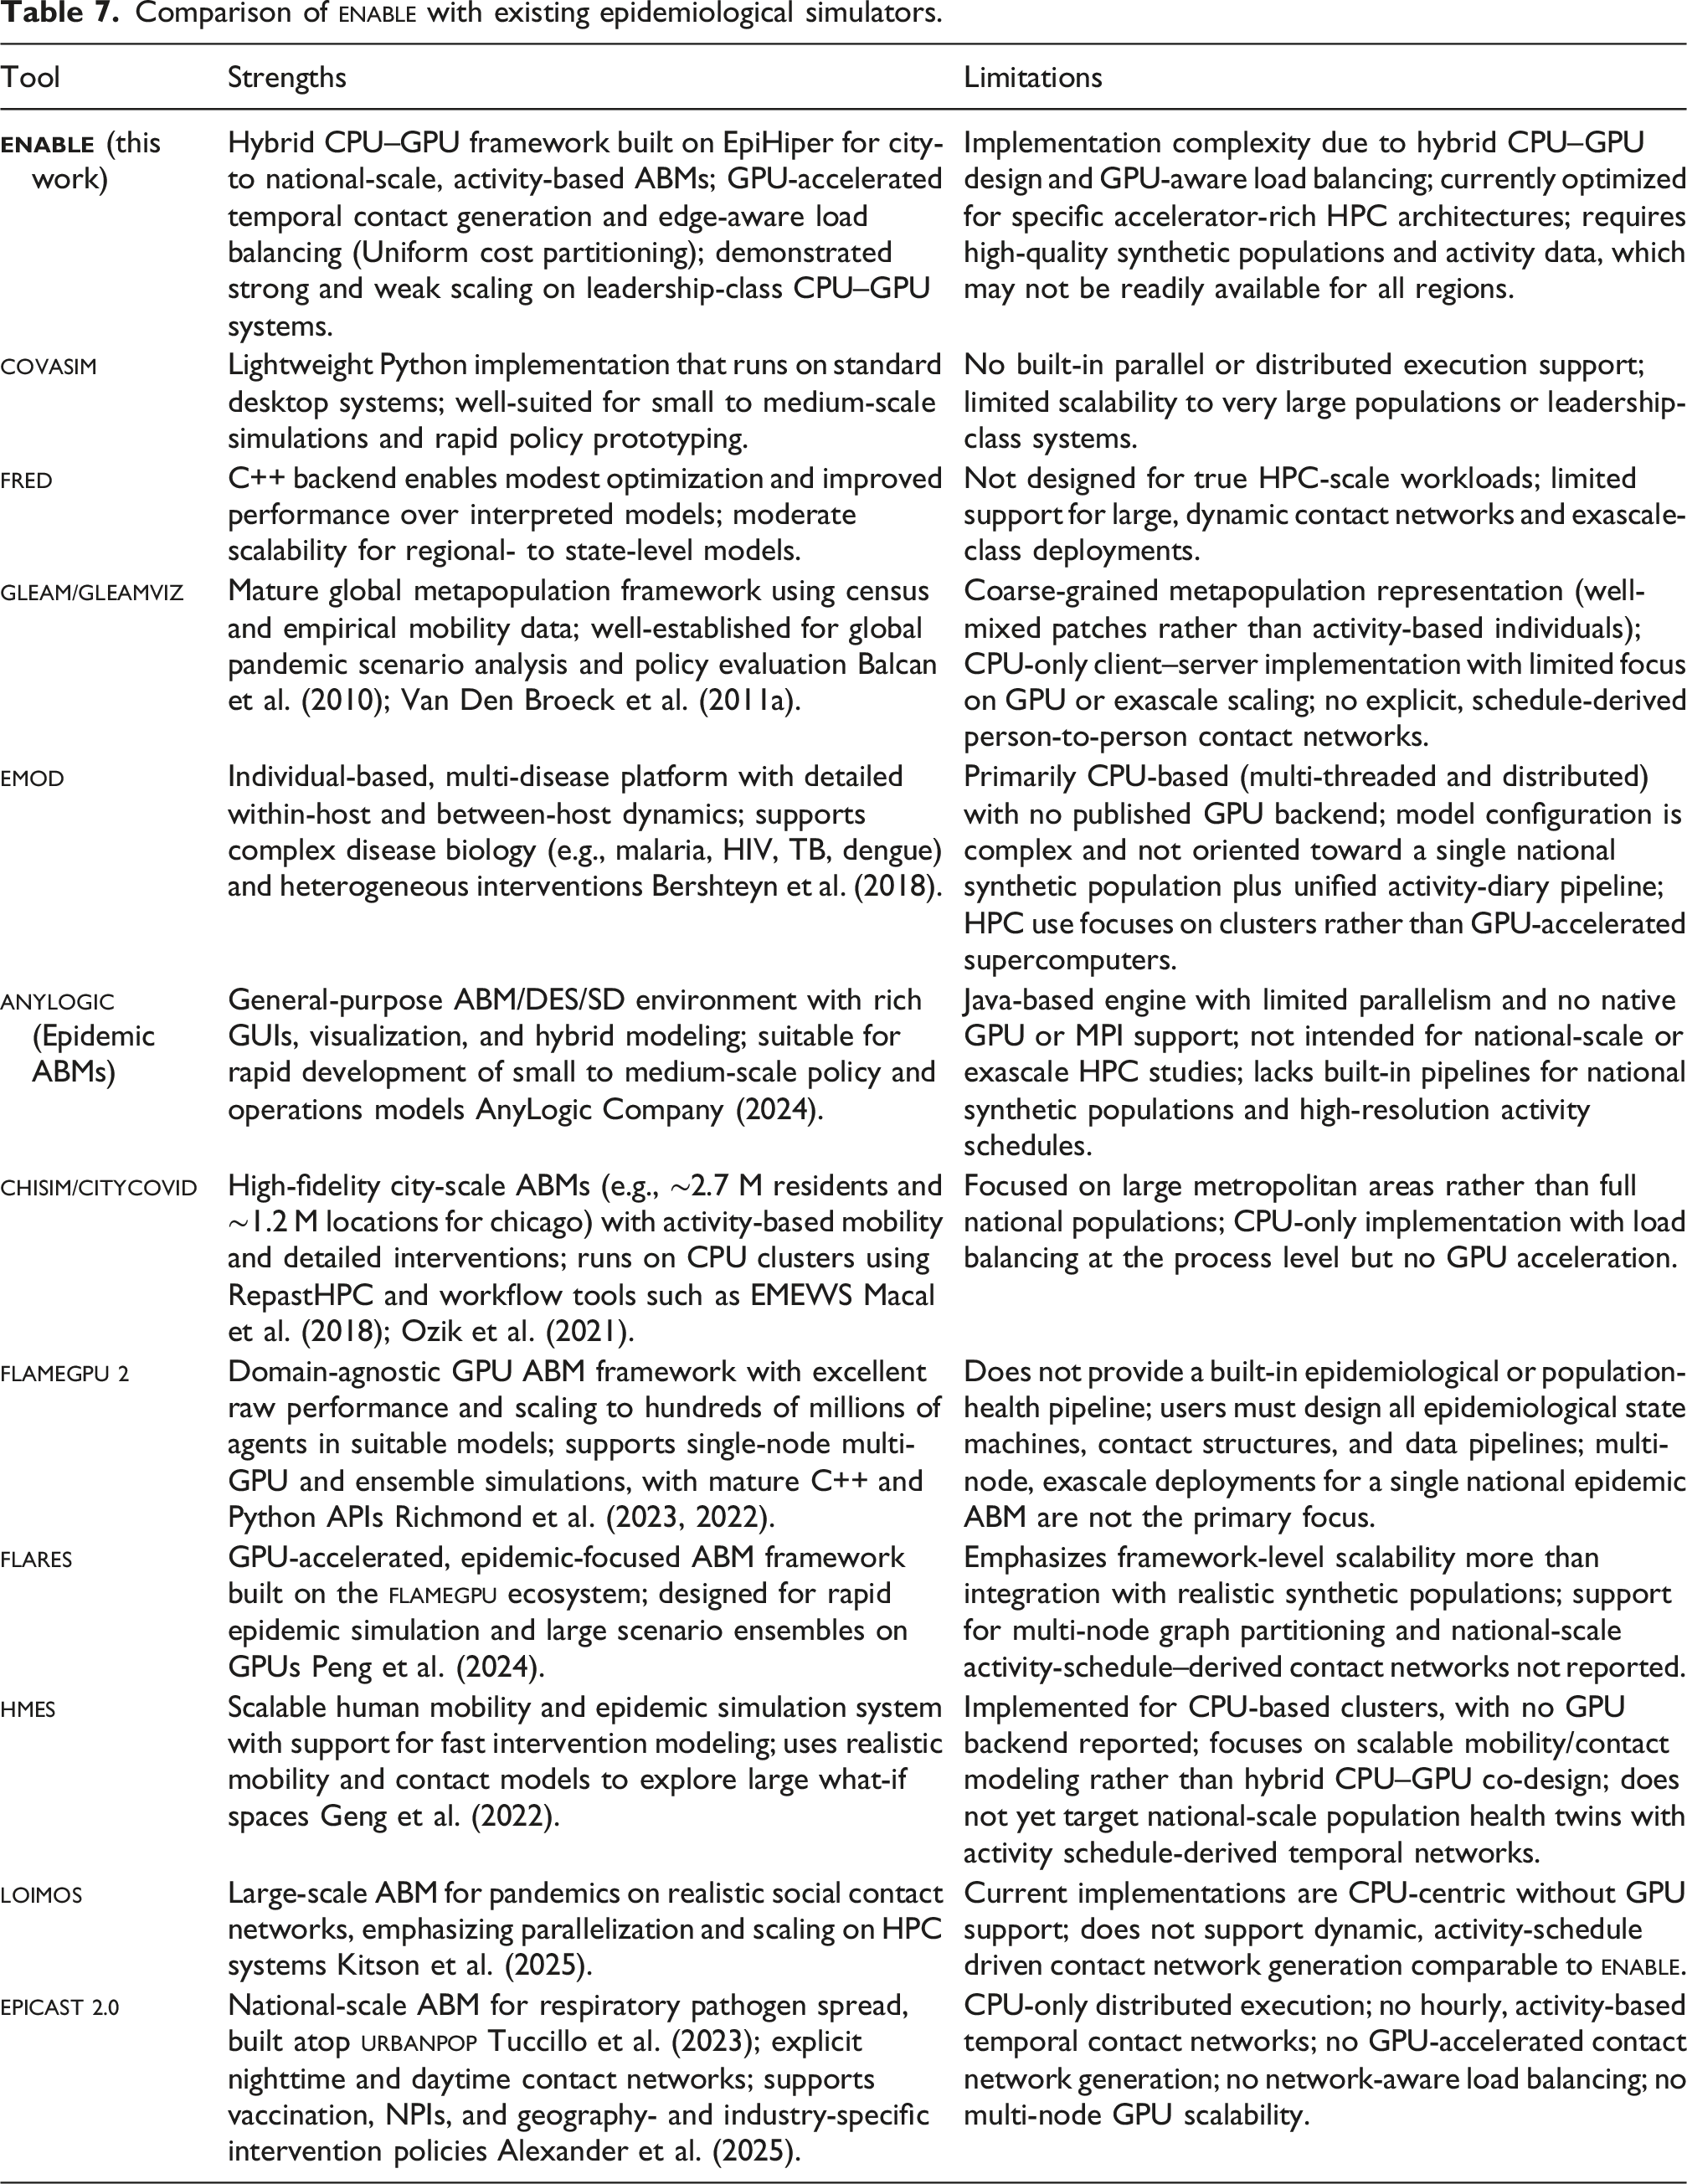
1.3. Related work
Early ABMs, such as
Recent advancements in ABM have focused on addressing computational barriers through high-performance computing and hybrid architectures. For instance,
1.3.1. Population scale and fidelity
1.3.2. Contact networks generation
In
1.3.3. Parallelism and load balancing
Overall, • • • • •
Taken together, these features distinguish
2. Data preparation
Since
2.1. Population data
ORNL’s
2.2. Activity data
Sample activity schedule sorted by agent ID.
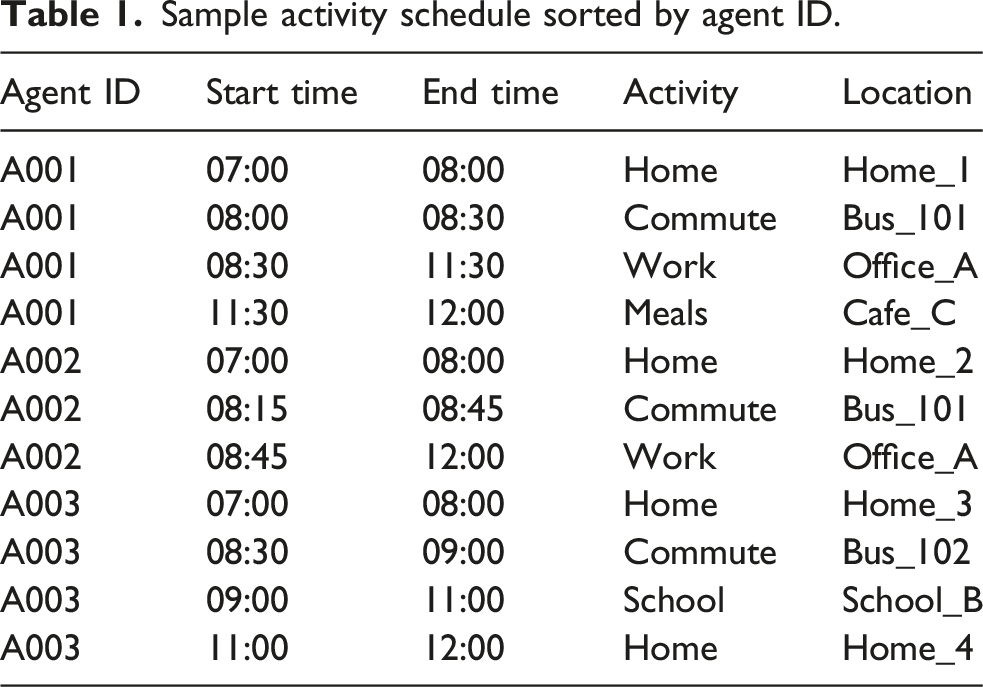
We generated full-week activity schedules for each agent in Utah’s synthetic population based on the 2017 National Household Travel Survey (NHTS) US Department of Transportation, Federal Highway Administration (2017). The NHTS consists of a large series of trip diaries for people and households weighted to be representative of the United States population. The trips encompass a variety of activity types, including home, work, school errands, meals, services, leisure, exercise, medical, social, religious/community, and volunteering. While a given person’s trip diary in NHTS typically does not span an entire week, trips recorded for various lifestyle cohorts – defined by primary role/occupation during the week, age, and geographic context – can be grouped into subsamples to estimate aggregate travel behavior. These cohort definitions are conflated with the
We used several criteria to harmonize • • •
Based on these criteria, we stratified the Utah synthetic population into 110 cohorts. We then defined NHTS subsamples matching each cohort to support activity schedule simulation. We relied on a target subsample size of at least 500 trips to ensure that each subsample would be representative of an entire week. We defined the subsamples first by United States (US) Census Region (West, Midwest, Northeast, South) and primary role, then further pruned them by occupation and urbanicity if the number of trip responses remained above the threshold subsample size.
We developed an R package,
For each agent cohort defined for Utah, we generated a pool of 200 full-week activity schedules, linking Monday schedules with successive weekdays based on nearest-neighbor matching on activity sequences, and repeating the procedure for weekends using Saturdays as a baseline. Finally, we randomly assigned activity labels to agents in the synthetic population by cohort label.
Note that our current activity data generation pipeline (
2.3. Location data
The
Daytime activity locations were then assigned to workers and students. The process of generating activity schedules for Utah encompasses all rural counties, core-based metro/micropolitan statistical areas (CBSAs), and combined statistical areas (CSAs) overlapping state boundaries. The worker module,
Following location assignments, anchor activities were matched to
3. Efficient contact network generation
Contact networks represent interactions or collocations between individuals, where nodes correspond to people and edges represent their contacts. Because interactions are time-dependent and often brief, contact networks are typically time-varying. In this work, a temporal contact network composed of 24 static hourly networks – one for each hour of the day – is directly extracted from activity logs of the population and location data of the activities, as described in Sections 2.2 and 2.3.
Many traditional agent-based models Barrett et al. (2008) rely on generated contact networks represented as edge lists, where each edge denotes a direct contact between individuals residing in a given location. In these models, each person’s next disease state is determined by both their internal state and the states of the people they are connected to through these contact edges. When executed sequentially, such a model can easily update the state of each individual.
However, problems arise when the model is parallelized. The main challenge is that the edge list must be partitioned across multiple ranks, and even an efficient partitioning scheme cannot guarantee that the nodes allocated to different ranks are independent. Interdependent nodes may reside on different ranks, necessitating complex communication protocols to ensure accurate and consistent disease progression across the simulation.
An alternative strategy involves using activity schedules to generate the contact network. By grouping individuals based on their co-location at the same time, these models can create mutually exclusive groups where disease progression is confined within each group. This grouping allows each rank to handle an independent subset of people without the overhead of managing inter-dependencies across ranks, thereby simplifying parallel execution and improving scalability.
Figure 2 illustrates an activity-scheduled contact network with 8 people across 3 locations, distributed over 2 computing ranks. Under a location-agnostic scheme, edges are typically grouped by node (e.g., rank 1 handles agents p1 to p4, while rank 2 handles agents p5 to p8), which can introduce communication overhead when, for example, p1 is linked to p5 across different ranks. In contrast, location-aware partitioning treats each location as a complete subgraph and assigns all agents in one location to the same rank. This approach ensures disease progression can be computed locally without inter-rank communication. Example of a contact network generation with 8 people and 3 locations using location-aware and location-agnostic partitioning approaches.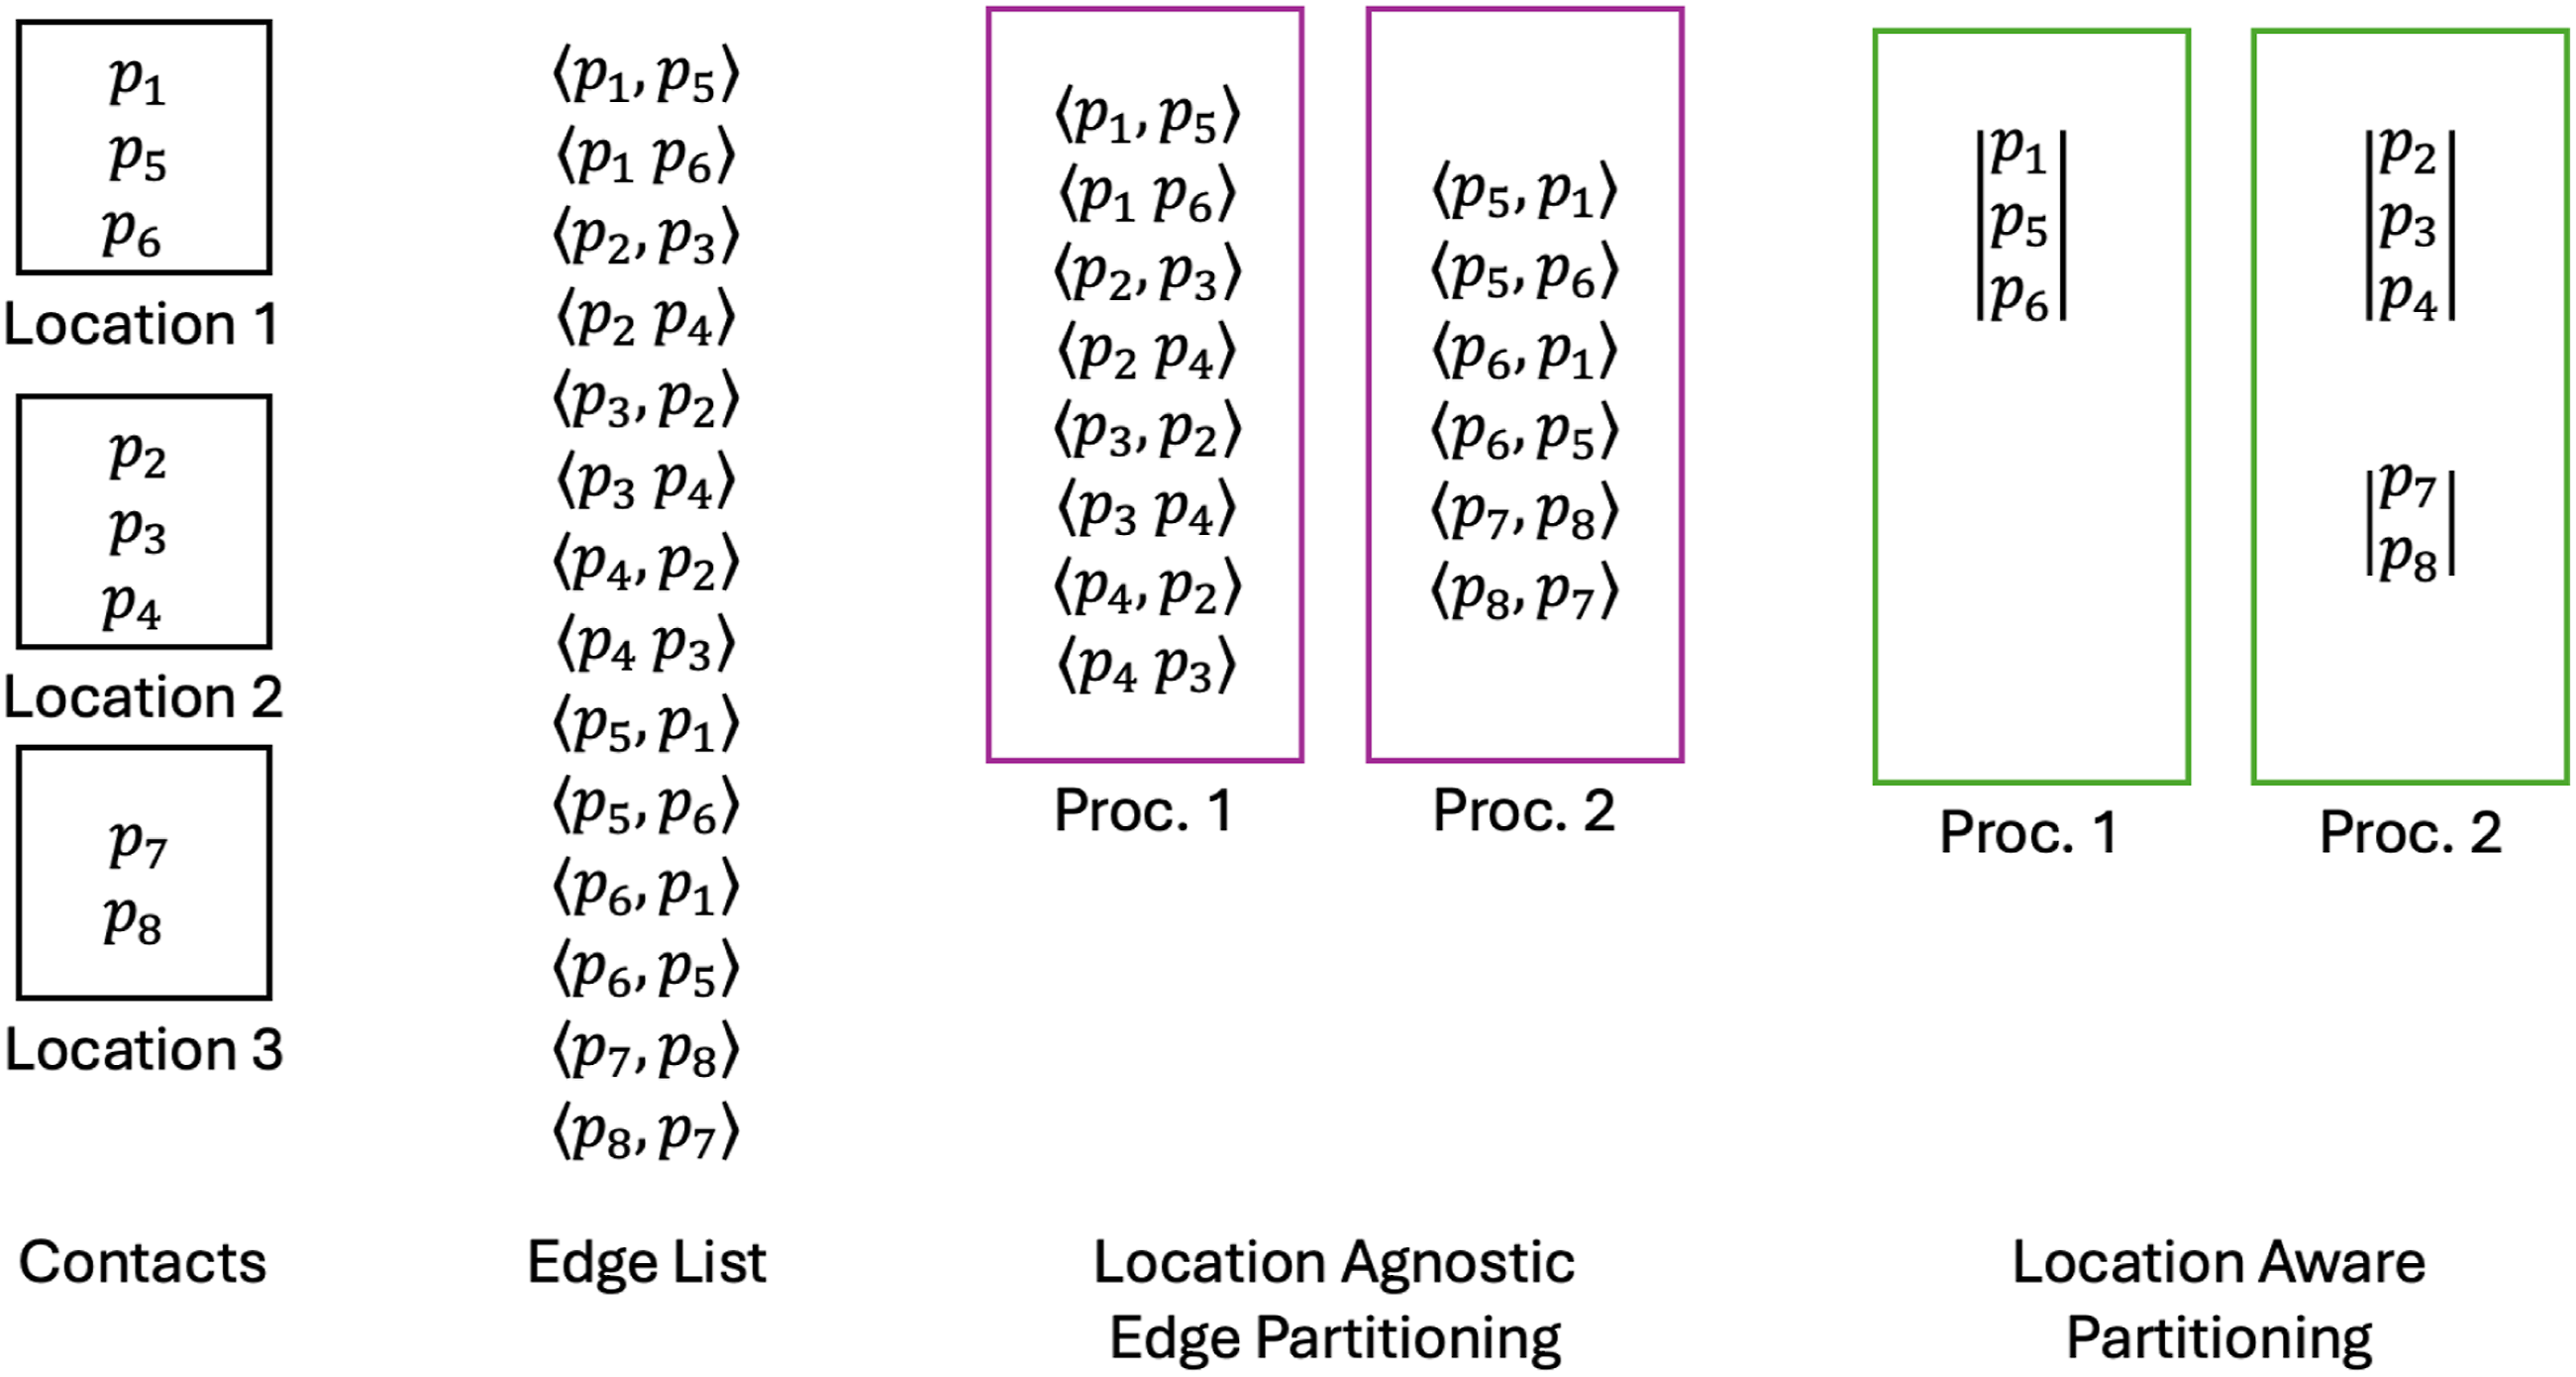
To efficiently generate a contact network from a given activity schedule, we use location-aware partitioning. The pseudocode for this process is shown in Algorithm 1. As a first step, we group agents based on their location. Specifically, we are given an activity schedule A for N agents in L locations, over H time units hours. Each agent has one activity listed per hour, yielding up to 24 activities per agent for a day. During preprocessing, we create an intermediate data structure D that records the list of agents present in each location for each hour. This co-location matrix, D, is then used to generate the contact networks.
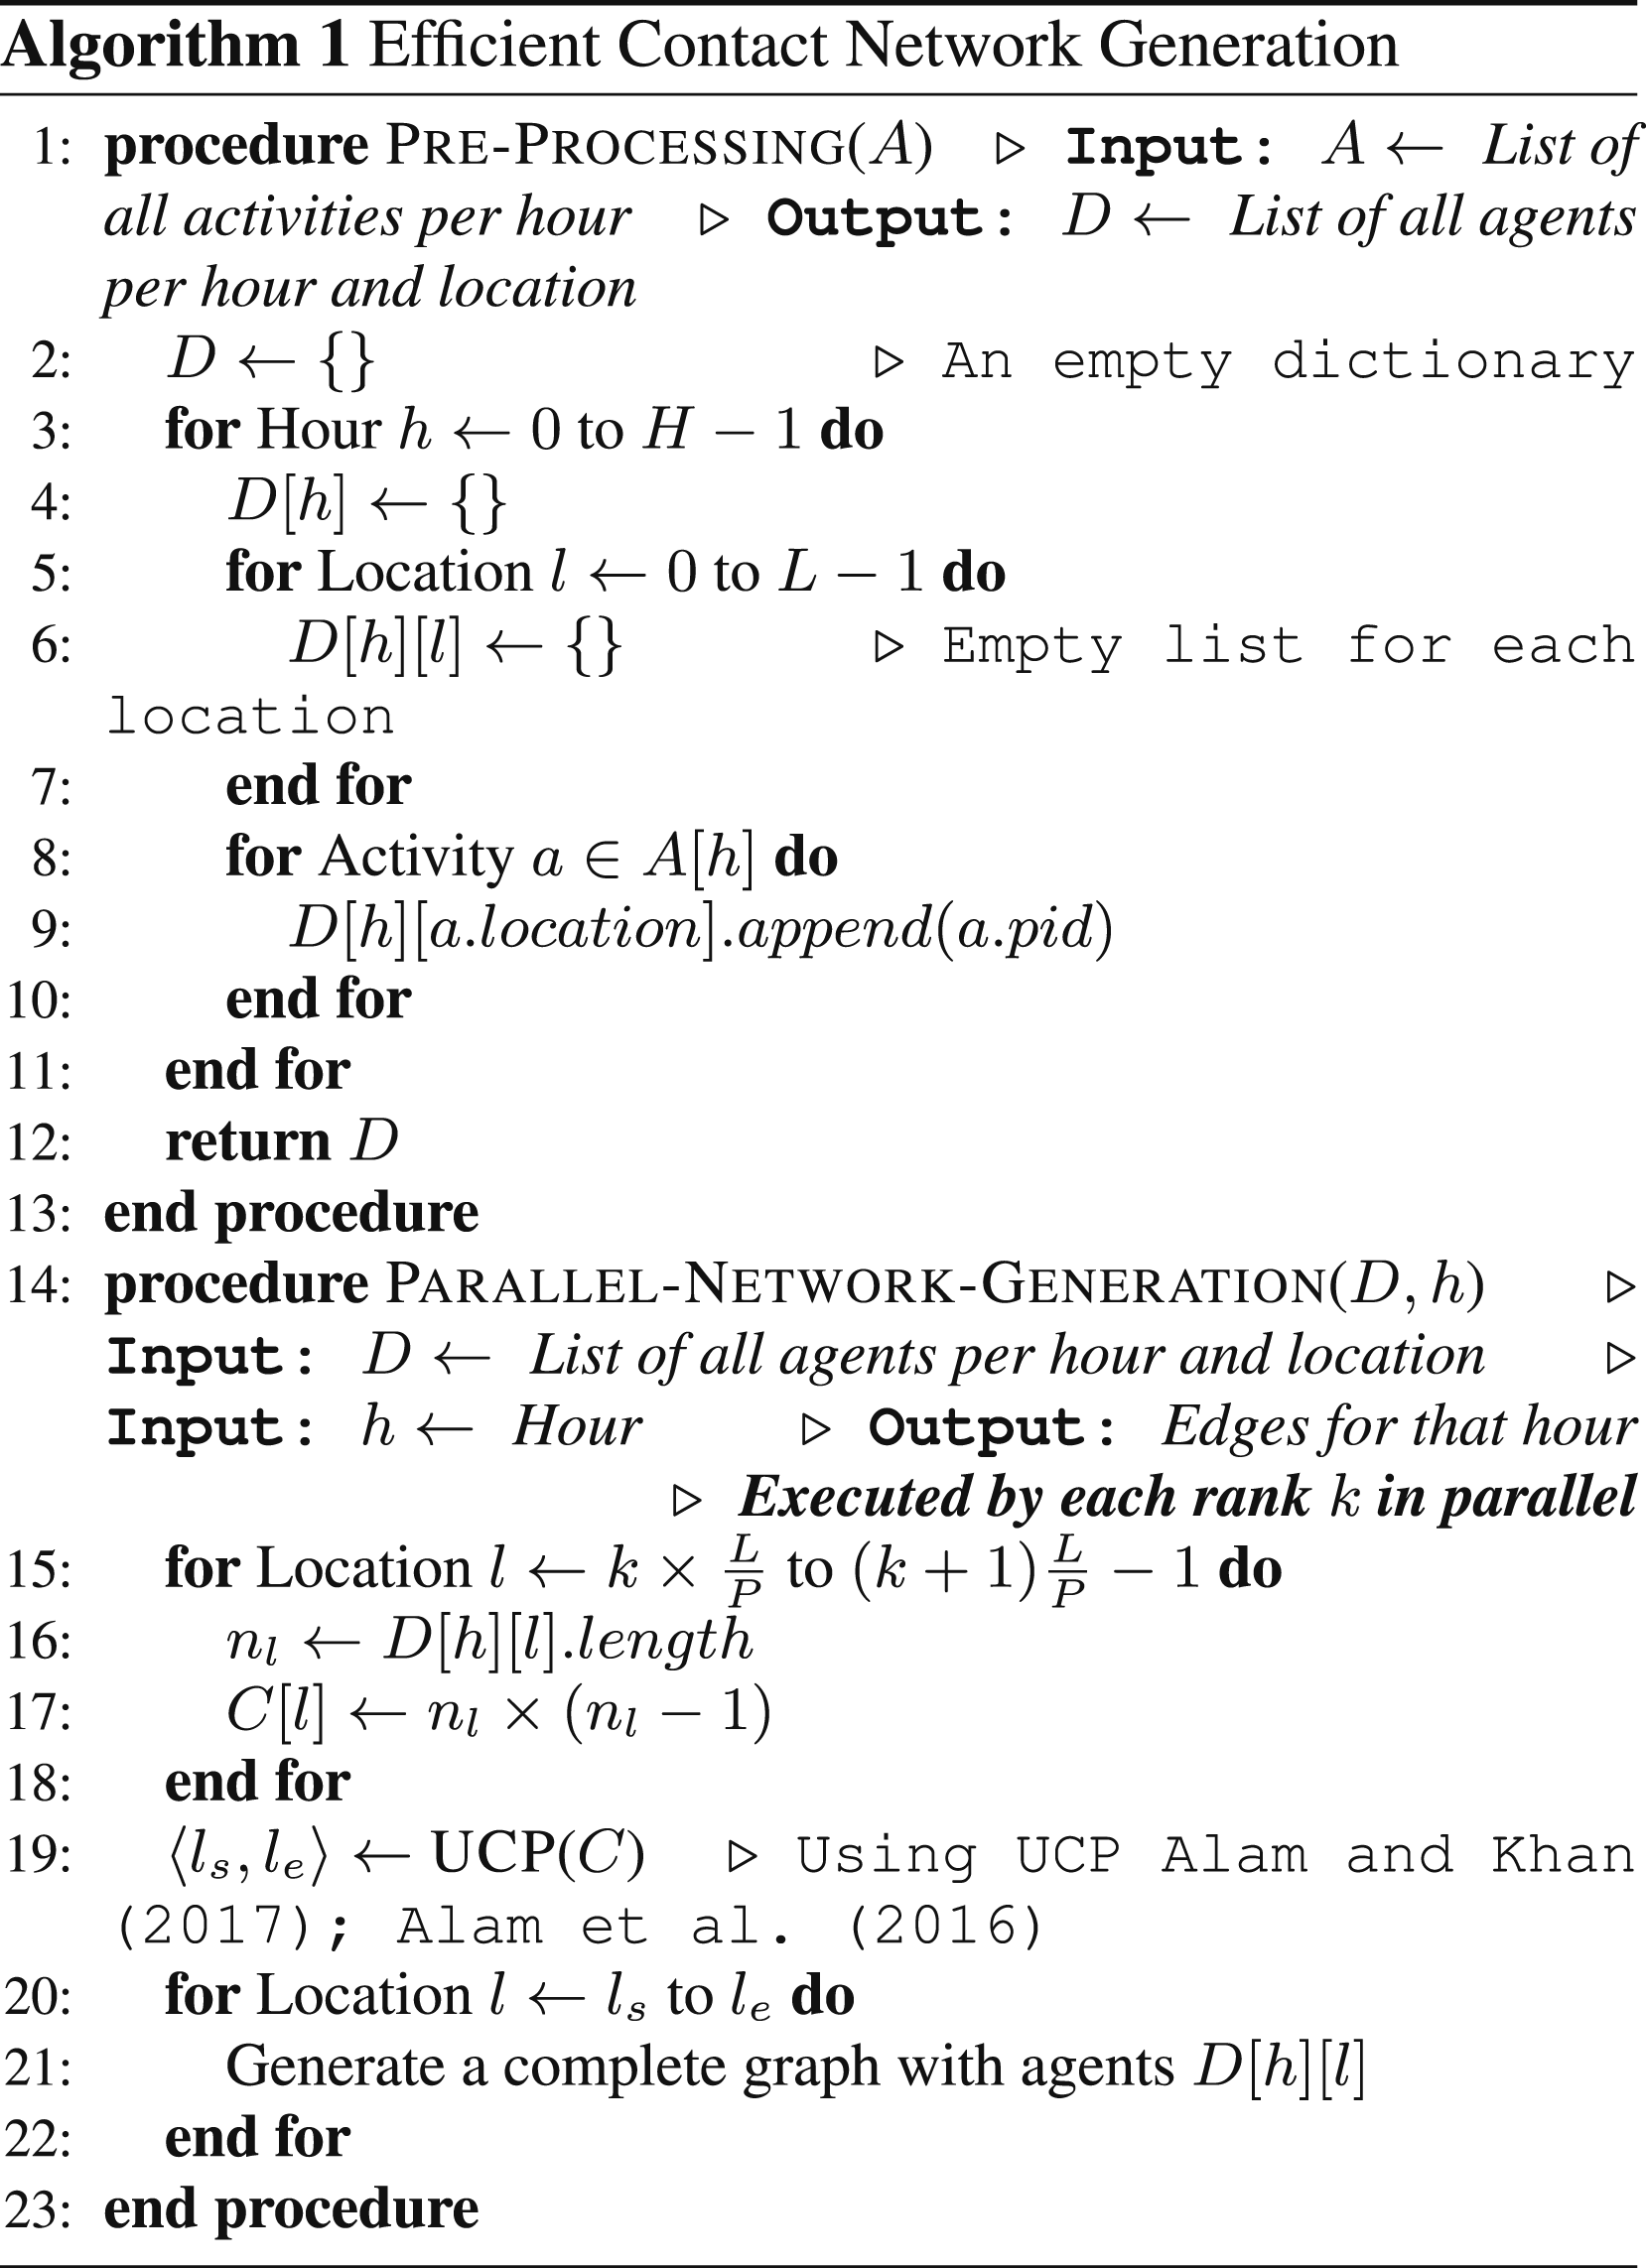
Next, we generate the contact networks in parallel. Notably, the contact network for a location at a given hour is independent of the other locations at that hour. For each location ℓ at hour h, all agents present form a complete graph. If a location ℓ has n ℓ agents, it contributes n ℓ (n ℓ − 1) directed edges. We, therefore, treat each location as a separate task when constructing the contact network and distribute these tasks among P ranks. As we will demonstrate, the way locations are distributed across ranks significantly affects the simulation’s load balance. To achieve a balanced workload, we use a distributed memory parallel algorithm called the Uniform Cost Partitioning (UCP) scheme Alam and Khan (2017); Alam et al. (2016). In this scheme, each location’s cost is considered to be n ℓ (n ℓ − 1), corresponding to the number of edges processed. The UCP algorithm determines the optimal set of locations ⟨ℓ s , ℓ e ⟩ assigned to each rank using an MPI-based parallel implementation. Each rank then uses this assignment to generate the complete graphs for its allocated locations.
3.1. Reduced memory footprint
In practice,
4. Load balancing algorithm
To distribute the tasks with good load balancing, an accurate estimation of the computational cost of each task is needed. Estimating costs and distributing tasks to get the best load balancing are the most challenging parts of scaling
The work of generating edges is divided into many independent tasks. Let
4.1. Computational cost
Let c
ℓ
be the computational cost of executing task 
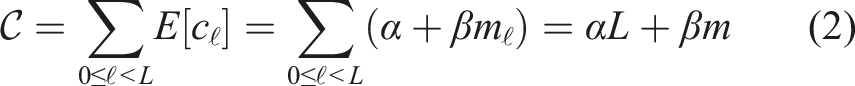
4.2. Task distribution
Parallel edge generation proceeds by splitting the task set Π into P disjoint subsets Π0, Π1, …, ΠP−1, such that Π
k
∩Π
l
= ∅ for k ≠ l and ⋃
k
Π
k
= Π. Each rank P
k
is then assigned the subset Π
k
, executing the tasks
Finding such subsets is a well-known problem called chains-on-chains partitioning (CCP) problem Pinar and Aykanat (2004); Manne and Sørevik (1995); Olstad and Manne (1995). For improved speedup, the CCP problem must be solved in parallel. In Alam and Khan (2017), the authors introduce the Uniform Cost Partitioning (UCP) algorithm, a distributed memory parallel method that runs in
The original UCP algorithm considers the task as non–divisible, i.e., the entire task is assigned to a rank. However, when the tasks are divisible, an extension of the UCP algorithm, called UCP–DIV Alam et al. (2016) that achieves fine-grained load balancing by dividing the tasks into multiple sub tasks can be used. A careful examination of the task
4.3. Implementation of UCP–DIV on the GPU
Although the UCP and UCP–DIV algorithms were originally proposed and implemented for distributed-memory systems, a GPU-based implementation of the UCP algorithm had not been available until now. Our work provides a CUDA implementation, later adapted to
The kernel was initially developed in CUDA due to CUDA’s more mature tooling and documentation, which allowed for faster prototyping and debugging during early development. Once the CUDA implementation was validated for correctness and performance, it was translated to HIP to ensure cross-platform compatibility and support for AMD GPUs. This approach allowed us to leverage existing CUDA resources while ultimately achieving our portability goals.
The translation from CUDA to HIP is largely syntactic:
The core of the GPU approach relies on an efficient prefix-sum procedure derived from Blelloch’s algorithm Blelloch (1990), carefully optimized to avoid bank conflicts and handle large arrays Poscablo (2025). Because GPU computation can outpace MPI communication at large processor counts, our current design executes the entire UCP partitioning computation on a single GPU attached to each MPI rank, thereby removing the need for inter-rank communication overhead.
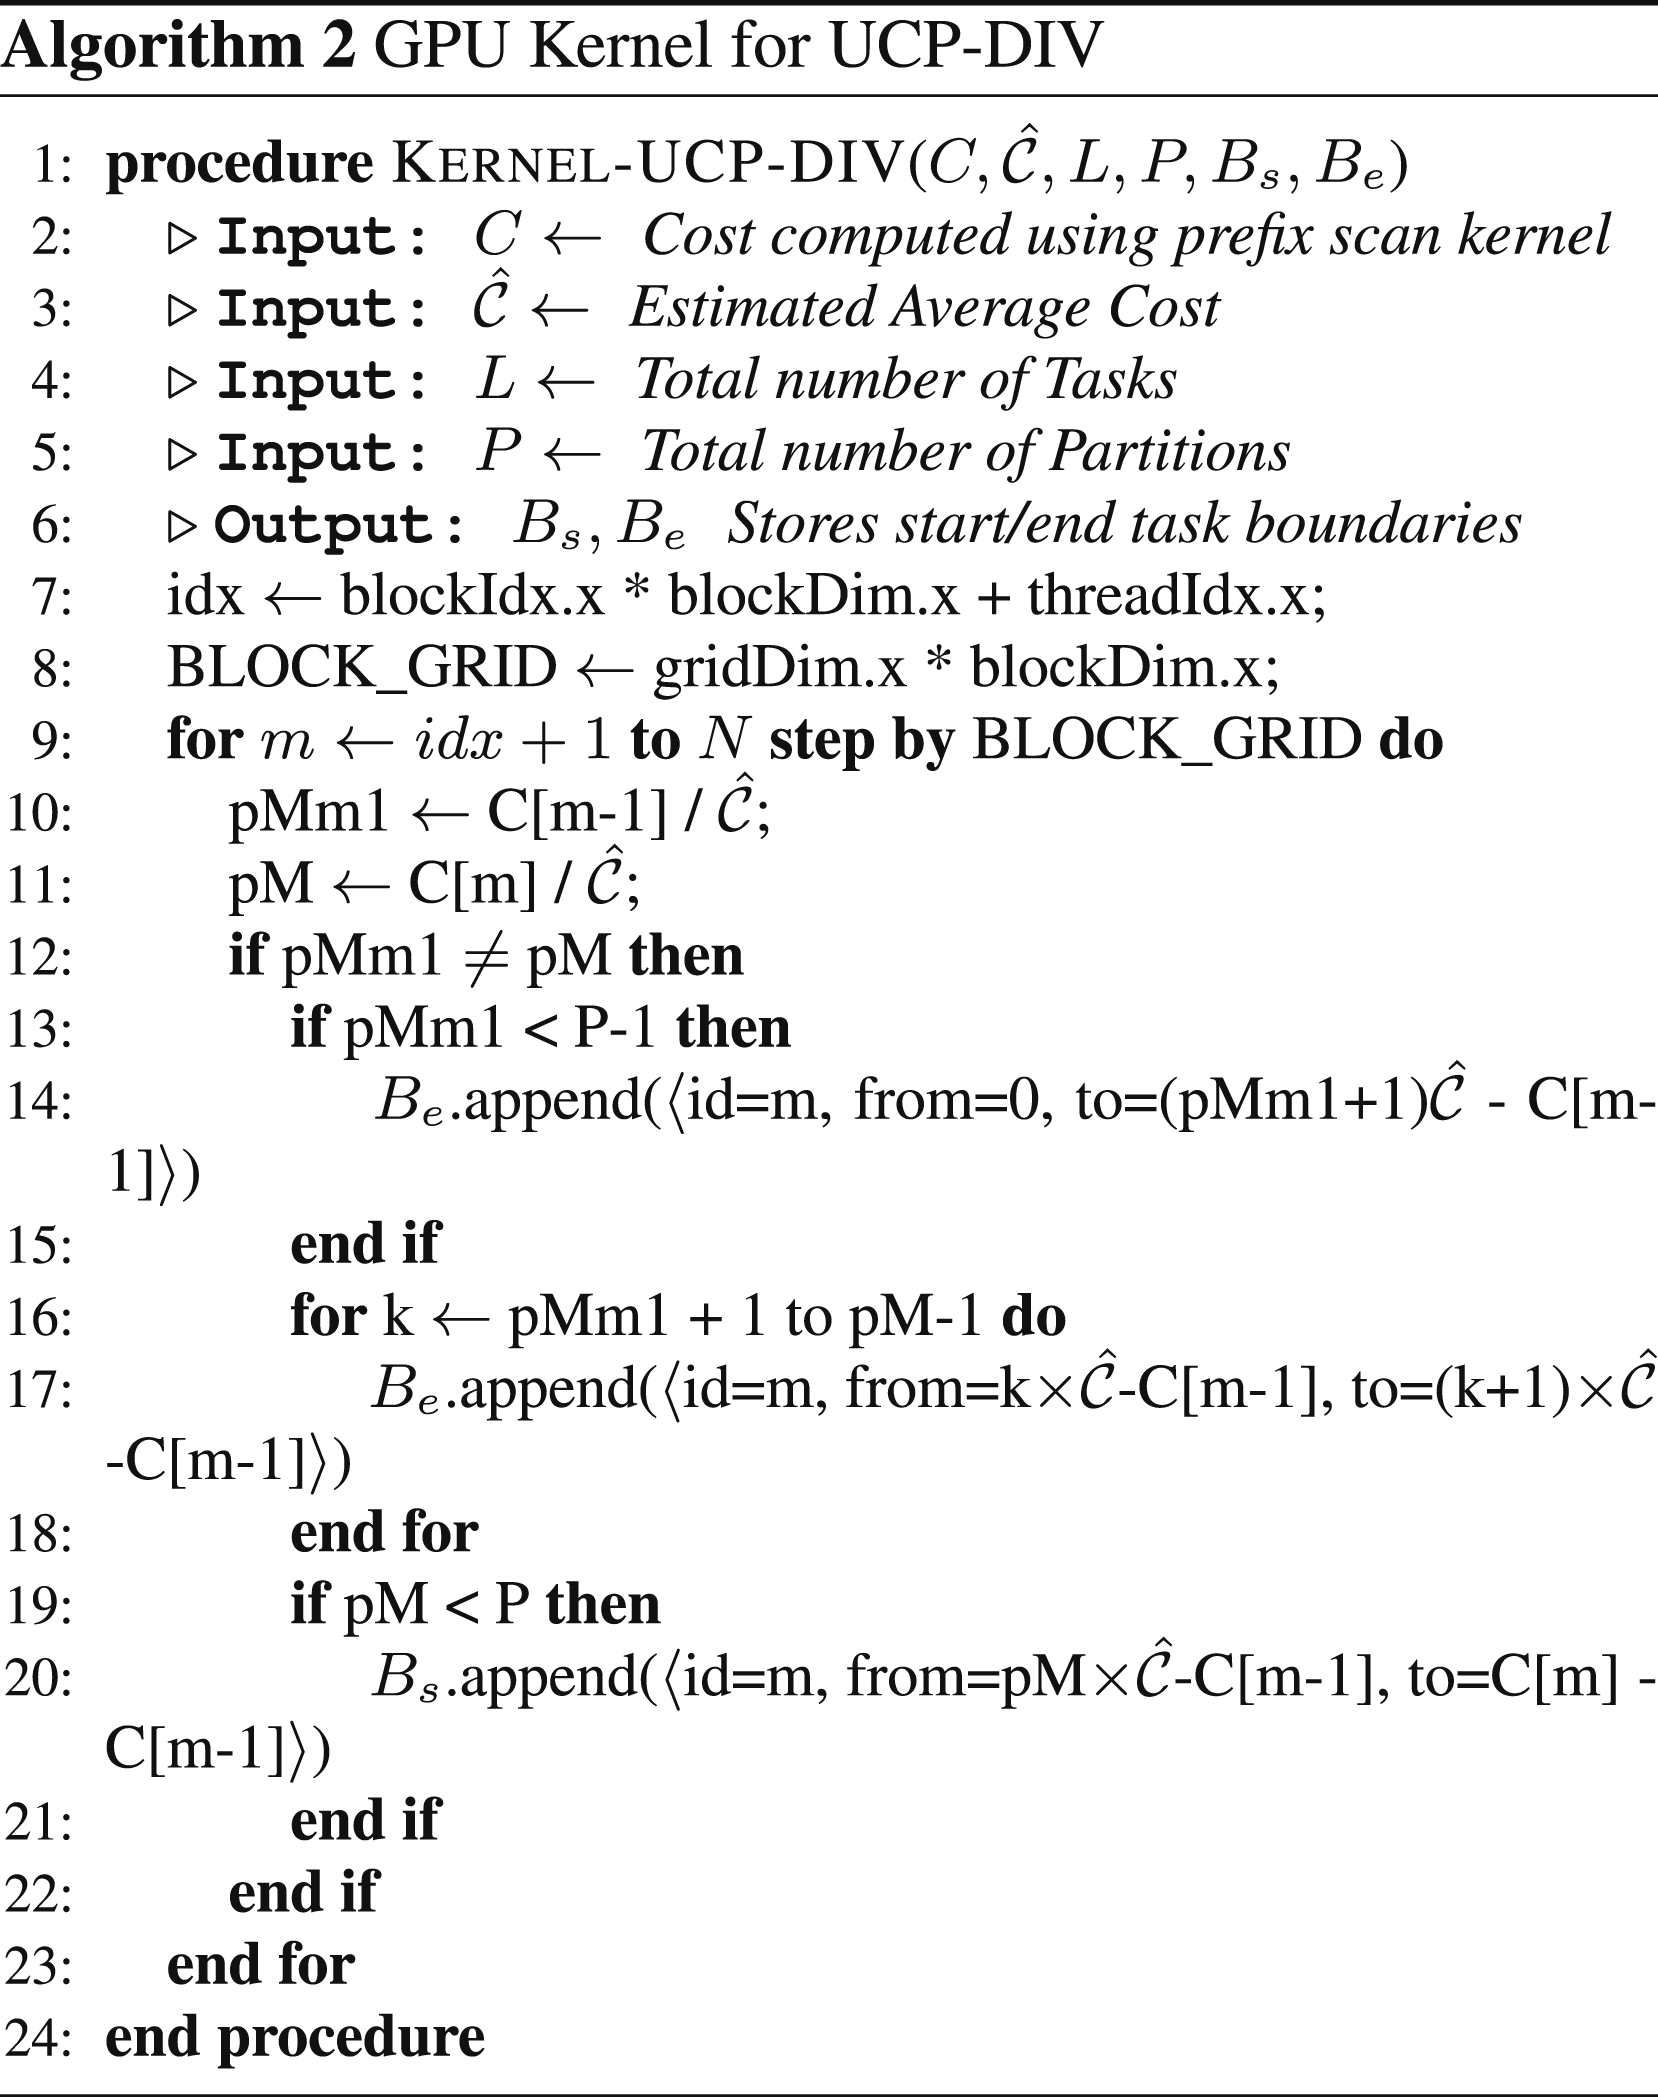
The pseudocode for the GPU kernel used in UCP–DIV, developed for this study, is shown in Algorithm 2. The algorithm processes the entire cost array in SIMD fashion, incrementally stepping through the data with an offset equal to the total thread count to reduce bank conflicts and enhance memory coalescing. It also removes the need for the binary search performed in the distributed-memory parallel version. Task boundaries are written to a pre-allocated GPU buffer, eliminating any intra-node communication overhead. In practice, this approach effectively scales to handle millions of tasks.
5. Architecture-aware simulations
To achieve highly granular simulations of disease propagation, a finer-grained model that uses hourly contact networks rather than daily ones is used. Our activity schedule is similarly granular, specifying up to 24 activities per agent per day. With a typical ABMS framework, the contact network for each time step is first determined and next all disease propagation paths according to the current contact network and the chosen epidemiological model are processed. Once the epidemiological model completes for time step t, the contact network for the next hour needs to be generated again. Thus, the tasks for each time step t involve two main phases: (1) generating the contact network for hour t from the activity schedule, and (2) running the epidemiological model on that newly generated network. Because both phases are computationally demanding, careful consideration is required to parallelize them effectively.
Modern high-performance computing (HPC) systems typically comprise multiple CPU cores and several GPUs that are attached to the CPUs. These processing units excel in different areas. CPUs are most efficient when the workload involves random memory accesses, branching, and complex decision making. GPUs, on the other hand, are well-suited for operations where the same instruction can be applied to many data items in parallel. Previous studies have demonstrated that epidemic simulations, which rely on irregular memory access patterns and intricate propagation rules, are better handled by Bisset et al. (2012); Xiao et al. (2019). Therefore, in our agent-based modeling and simulation (ABMS) system, CPUs focus on running the core epidemic simulations using the disease propagation model.
However, GPUs can still be leveraged to accelerate an important complementary task: generating the contact networks for upcoming time steps. Figure 3 demonstrates this idea. While the CPUs are busy progressing the epidemic simulation, GPUs can consume the activity schedule data and build the next hour’s contact network. Because GPU kernel calls are asynchronous, they return control to the CPU immediately after launching, and the overhead for these launches is typically small. As a result, while the CPU cores are advancing the disease model for time step t, the GPU can concurrently process the activity schedule, determine the partition of contact networks based on estimated costs using the UCP algorithm (see Algorithm 1), and prepare the new contact network. CPU-GPU execution of 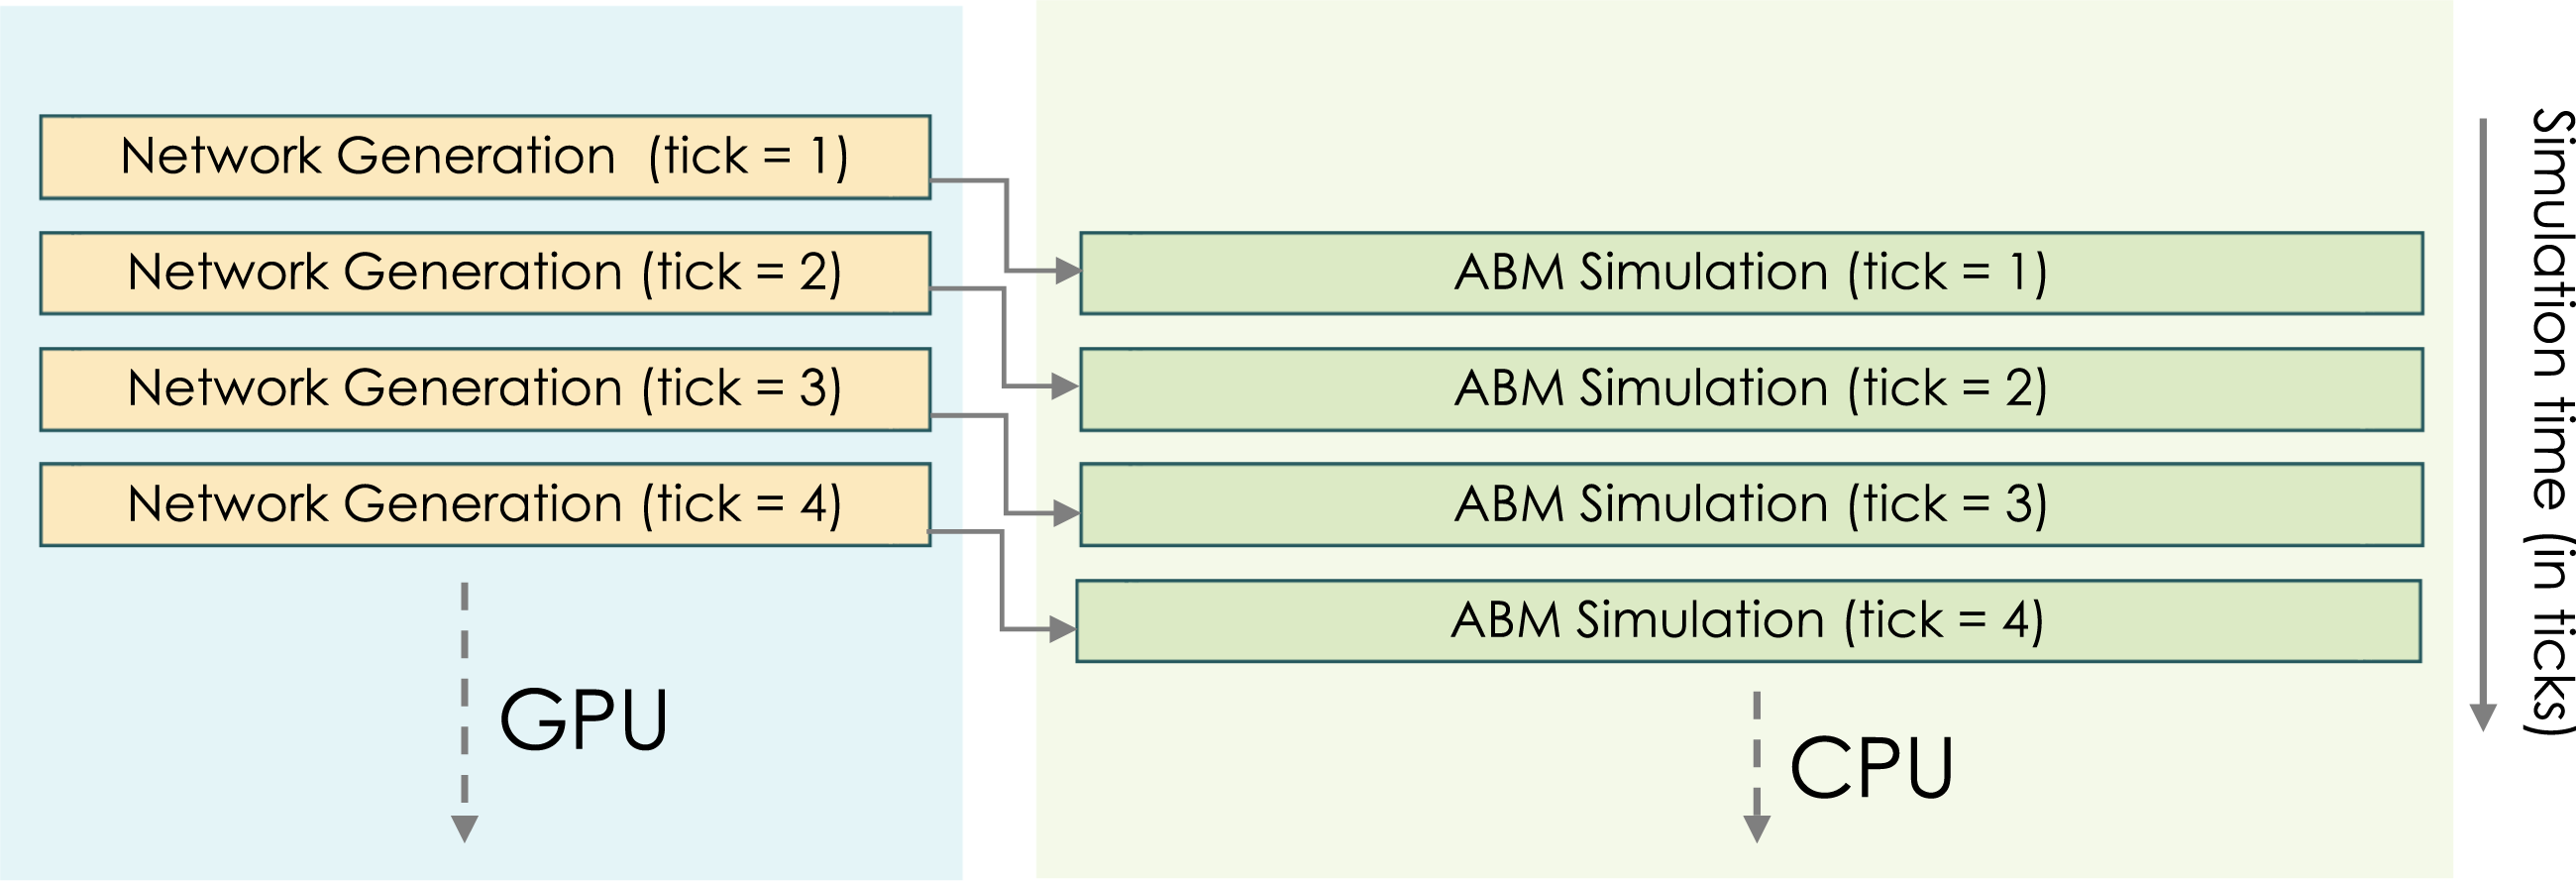
Before moving on to time step t + 1, the CPU switches its contact network pointer to the GPU-generated network from the previous time step, instructs the GPU to generate the next hour’s network, and proceeds with the new simulation time step. Note that the contact network is represented in a location-centric manner, listing which agents occupy each location, rather than explicitly storing all edges (see Figure 2). The epidemic simulation engine then iterates over these co-located agents, treating them as complete graphs, to compute the next state of the disease.
We conducted experiments to measure wall-clock time under two configurations: (1) a synchronous baseline, in which GPU-based partition boundary computation completes before the CPU-based disease simulation begins at each time step, and (2) the asynchronous pipelined execution described in this paper, where contact generation for time step t + 1 overlaps with disease simulation for time step t. Across our benchmark scenarios (Utah state-scale synthetic population of approximately 3 million agents), the asynchronous pipeline reduces per-step wall-clock time by roughly up to 20%. The degree of improvement depends on the relative costs of the two stages; in practice, the CPU-based disease simulation is typically more expensive than the GPU-based load-balancing phase. As a result, the overlap can effectively hide most of the shorter stage when the two stages are well matched in runtime.
In our experiments, the GPU-based UCP runtime typically accounts for approximately 1% – 20% of the total per-timestep runtime for Utah state-scale synthetic population of approximately 3 million agents. The exact fraction varies depending on problem size and system configuration, but remains a relatively small portion of the overall simulation cost, with the CPU-based disease simulation dominating the timestep runtime.
The GPU-based UCP load-balancing phase incurs an approximately constant per-timestep cost, as it depends solely on the number of locations and is independent of disease state. The CPU-based disease propagation phase, however, varies with hourly contact network density and the current epidemiological state. During low-contact overnight periods, when agents are predominantly co-located within small household groups, the UCP phase can account for up to 20% of total per-timestep wall-clock time. During peak-contact periods (roughly hours 8–14), when network density is highest, disease propagation dominates and the UCP fraction falls below 1%. Across the full diurnal cycle and all problem sizes studied, 1%–20% is a reasonable characterization of the GPU load-balancing overhead.
6. Performance results
The Frontier HPE Cray EX supercomputer housed at the Oak Ridge Leadership Computing Facility was used for this performance study. The system comprises 9408 AMD compute nodes, each featuring a 64-core “Optimized 3rd Gen EPYC” CPU and 512 GB of DDR4 memory. In addition, every node hosts four AMD MI250X accelerators, each containing two Graphics Compute Dies (GCDs), thereby offering eight GCDs per node with 64 GB of high-bandwidth memory (HBM2E) each. Connectivity is powered by AMD’s Infinity Fabric, enabling up to 36 GB/s bidirectional bandwidth between CPU and GPU, 200 GB/s peak bandwidth between GCDs on the same MI250X, and 50–100 GB/s between GCDs located on different MI250X accelerators.
6.1. CPU-GPU process mapping
Since each MI250X physically houses two GCDs that the operating system exposes as independent GPU devices, each Frontier node maps to 8 logical GPUs per node. Not all 64 CPU cores are available to user applications. Frontier operates in low-noise mode, which permanently pins all OS and system processes to core 0. In addition, SLURM core specialization (invoked via the
In GPU-centric HPC applications, the standard practice is a one-to-one mapping of MPI ranks to GPUs.
GPU affinity is enforced through two SLURM binding directives:
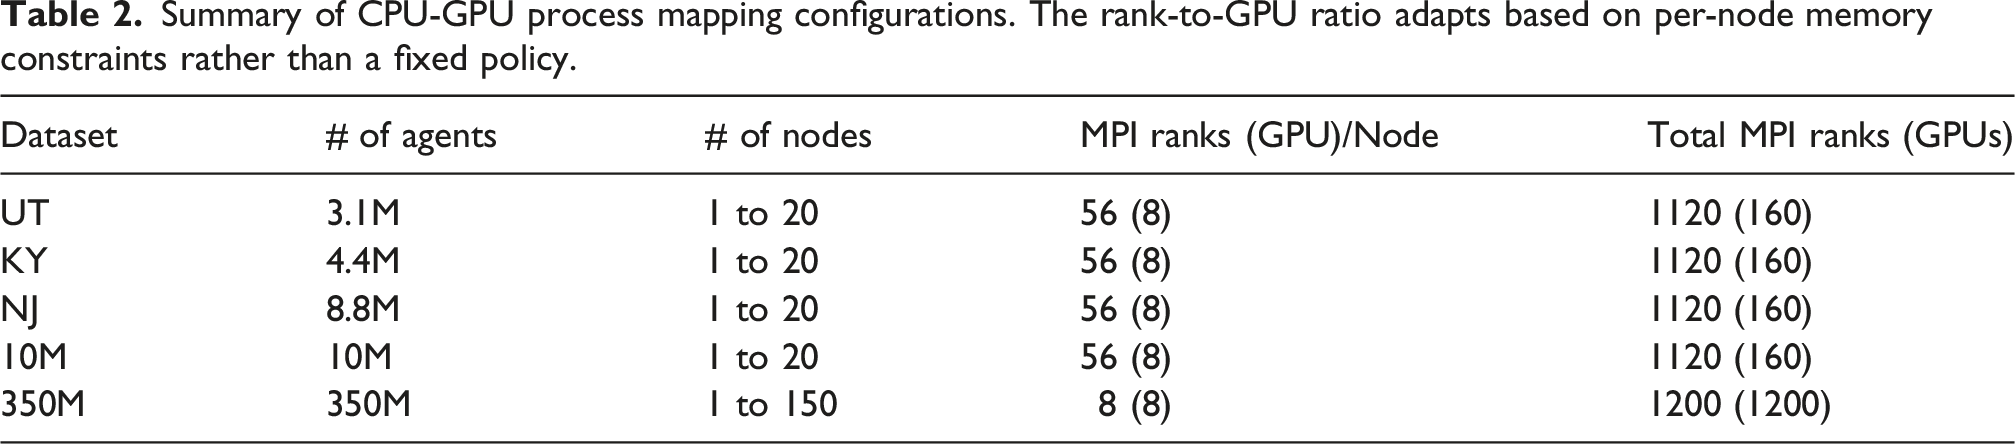
Summary of CPU-GPU process mapping configurations. The rank-to-GPU ratio adapts based on per-node memory constraints rather than a fixed policy.
6.2. Epidemic disease model
Our experiments were conducted using a Susceptible – Infected – Recovered (SIR) model operating on a contact network. At each discrete time step, every infected agent has a probability β of transmitting the disease to any susceptible neighbor in the contact network. Each infected agent then recovers with probability γ, transitioning to the recovered state. The contact network is updated at an hourly timestep, reflecting changes in agents’ locations and interactions.
The classical Susceptible–Infected–Recovered (SIR) model generates characteristic epidemic trajectories where the susceptible population decreases monotonically, the infected population follows a bell-shaped curve with a distinct peak, and the recovered population increases toward saturation. We applied an SIR model to demonstrate epidemic behavior using hourly contact network data from the Utah synthetic population. The resulting SIR curves are presented in Figure 4. SIR curves for the Utah synthetic population, where S = Susceptible, I = Infected, and R = Recovered. The simulation used a classical SIR epidemic model executed for 30 simulated days with hourly activity-driven contact networks generated from the Utah dataset comprising 3.1 M agents.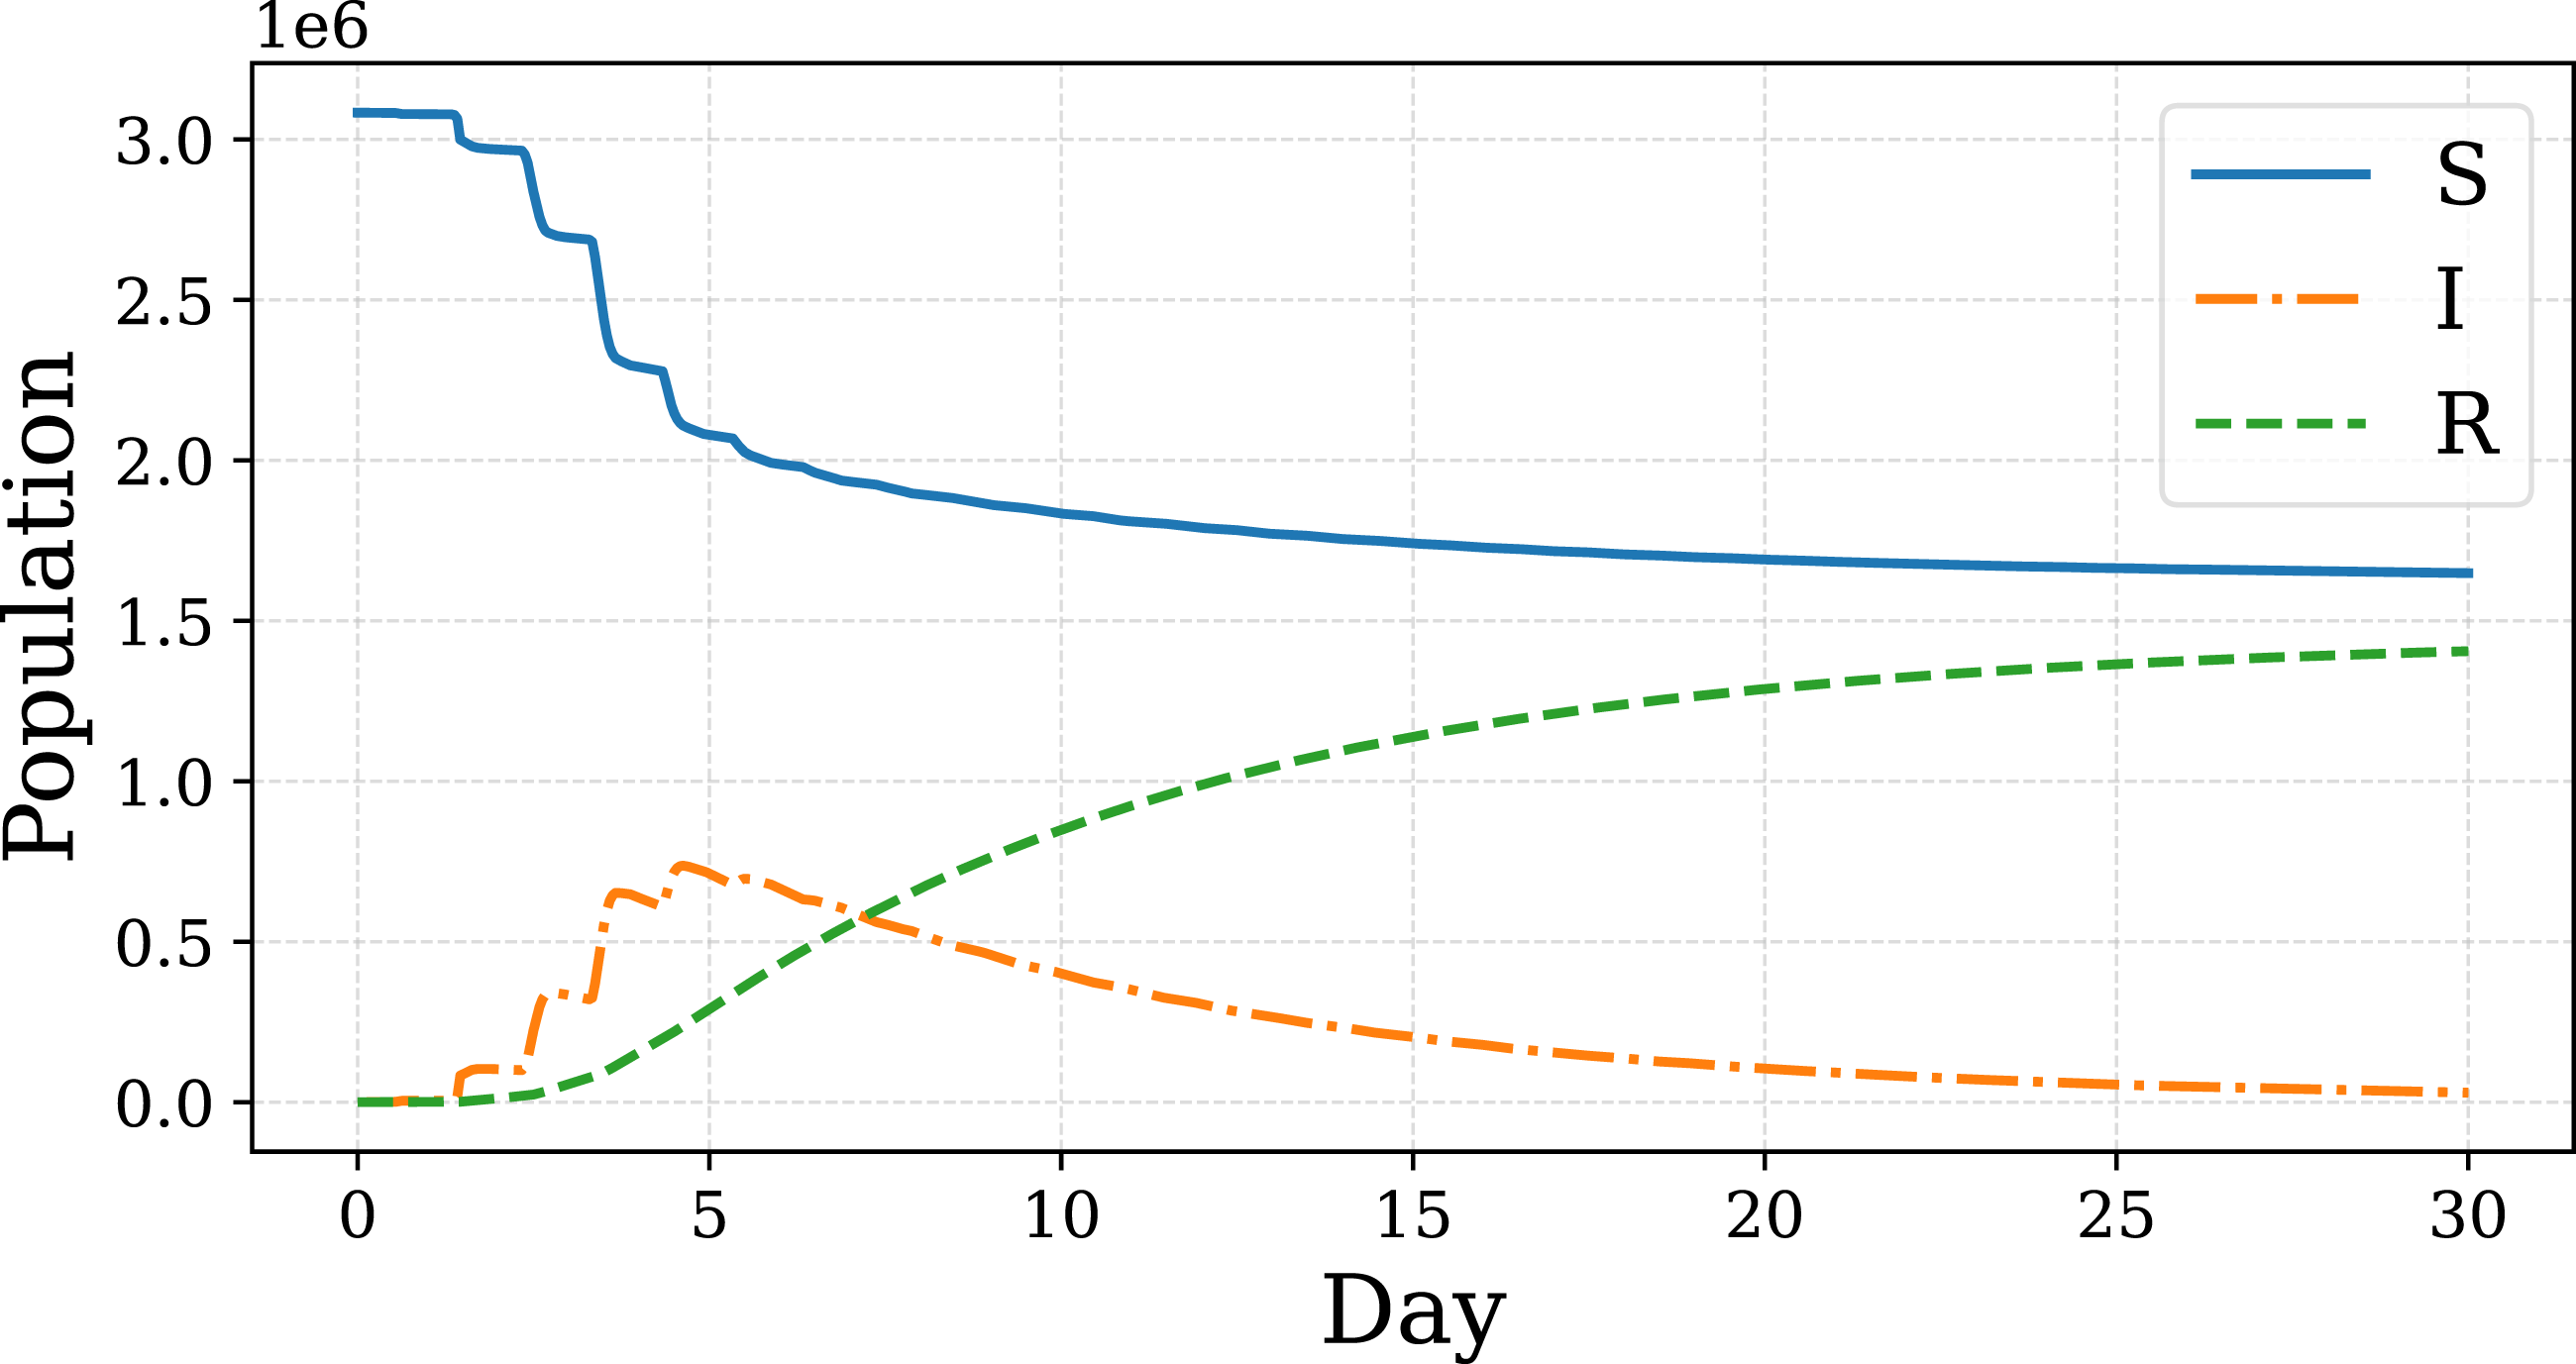
As shown in the figure, the model exhibits the expected classical SIR patterns. However, the hourly contact network reveals temporal variations in disease transmission. During daytime hours, when interpersonal contacts reach their maximum frequency, the disease spreads more rapidly than during nighttime hours, as evidenced by sharp increases in the number of infected individuals. In our model, contact frequency peaks between 8 AM and 4 PM, corresponding to periods of heightened transmission activity.
6.3. Experimental scenarios
In this section, the datasets and experiments designed to evaluate the performance of the
The population sizes used in this scalability study vary in their size between a few million agents (Utah, Kentucky and New Jersey) to tens and hundreds of agents (10M and 350M). Unlike the Utah, Kentucky and New Jersey datasets, activity schedules for population sizes of 10M and 350M agents are currently unavailable. These larger-scale datasets were synthetically generated and used in these scaling studies merely to demonstrate the scalability of the ENABLE framework at national-scale population sizes. The parallel performance characteristics are expected to mirror those presented here for the synthetic populations when activity schedules for such large populations become available.
The first synthetic dataset contains 10 million people and 100 thousand locations. For each time step (an hour) it produces about 990 million edges to process. The second synthetic dataset has 350 million people and 3.5 million locations for each simulation hour. Therefore, it creates approximately 34.5 billion edges for each 1-h time step (called a tick).
Constructing of the UT state-level activity dataset with 3.1 million individuals distributed across 1.04 million households and 1596 schools was described in Section 2.2. We also estimated 101 thousand workplaces and 100 thousand additional locations for non-home/work/school activities. Each person is associated with a geoid and can move to a workplace within that region. For every individual, the dataset specifies their hourly activities for each day of the week, producing 7 × 24 = 168 entries per person. Each entry includes the activity type, the relevant location, and the specific day and hour. Finally, these schedules were used to generate hourly contact networks. The number of connections varies from millions during the night to billions in the daytime as expected in realistic activity patterns of any population that is overwhelmingly home-bound at night.
Since each Frontier computing node holds 512 GB of memory, the number of MPI ranks that can be executed in a computing node depends on the memory required by the MPI processes. To generate the contact networks over the course of the simulation, the activity schedule is loaded and stored in the CPU memory. Each activity is denoted by a location (4 bytes) and an activity type (2 bytes). In case of the 10M synthetic population, storing 24 activities requires 10M × 24 × 6B = 1.34 GB of memory. For Utah, the activity schedule is defined for 7 days and requires 3.1 M × 24 × 7 × 6B = 2.8 GB of memory. Therefore, both cases used all 56 available cores in a computing node to execute 56 MPI ranks in parallel.
However, the 350M synthetic population dataset requires a different mapping due to main-memory storage constraints. Storing the full activity schedule for 350M agents, covering 24 hourly activities per agent across a simulation day, requires approximately 47 GB of CPU memory per rank. Supporting 56 MPI ranks simultaneously would demand roughly 56 × 47GB ≈ 2.6 TB, far exceeding the 512 GB DDR4 capacity of a single Frontier node. To accommodate this,
6.4. Load balancing performance
As highlighted in Section 4, estimating and balancing computational loads of tasks with irregular data dependencies, as is the case in ABM simulations of epidemiology, in a distributed memory parallel setting are challenging. For optimal speedup, both estimating and balancing need to be executed in parallel. One common approach is to partition the set of locations among the ranks so that the computational workload is evenly distributed. However, a naive scheme that merely assigns an equal number of locations to each rank often leads to imbalanced loads.
In this section, we report the efficacy of the load balancing algorithm that was implemented (see Section 4) and integrated into the
Figure 5 illustrates the number of edges processed and the runtime per rank when locations are uniformly partitioned among ranks. Specifically, rank P
i
handles locations from i × n
L
/P to (i + 1) × n
L
/P − 1, where n
L
is the total number of locations and P is the number of ranks. As Figure 5(a) shows, the uniform location assignment does not yield a balanced edge load, because some locations contain significantly more people. Consequently, as shown in Figure 5(b), the runtime for processing edges in each rank also varies substantially among ranks, leading to runtime imbalance. Looking into both figures, it is evident that the run times correlate strongly with the number of edges each rank handles. If the locations were partitioned in such a way that edges are more evenly distributed across the CPU ranks, the overall runtime is likely to become more balanced as well. Figure 5 demonstrates the necessity for more sophisticated partitioning strategies to ensure efficient parallel performance. Uneven distribution of loads and parallel execution time on CPU ranks without the UCP load balancing algorithm.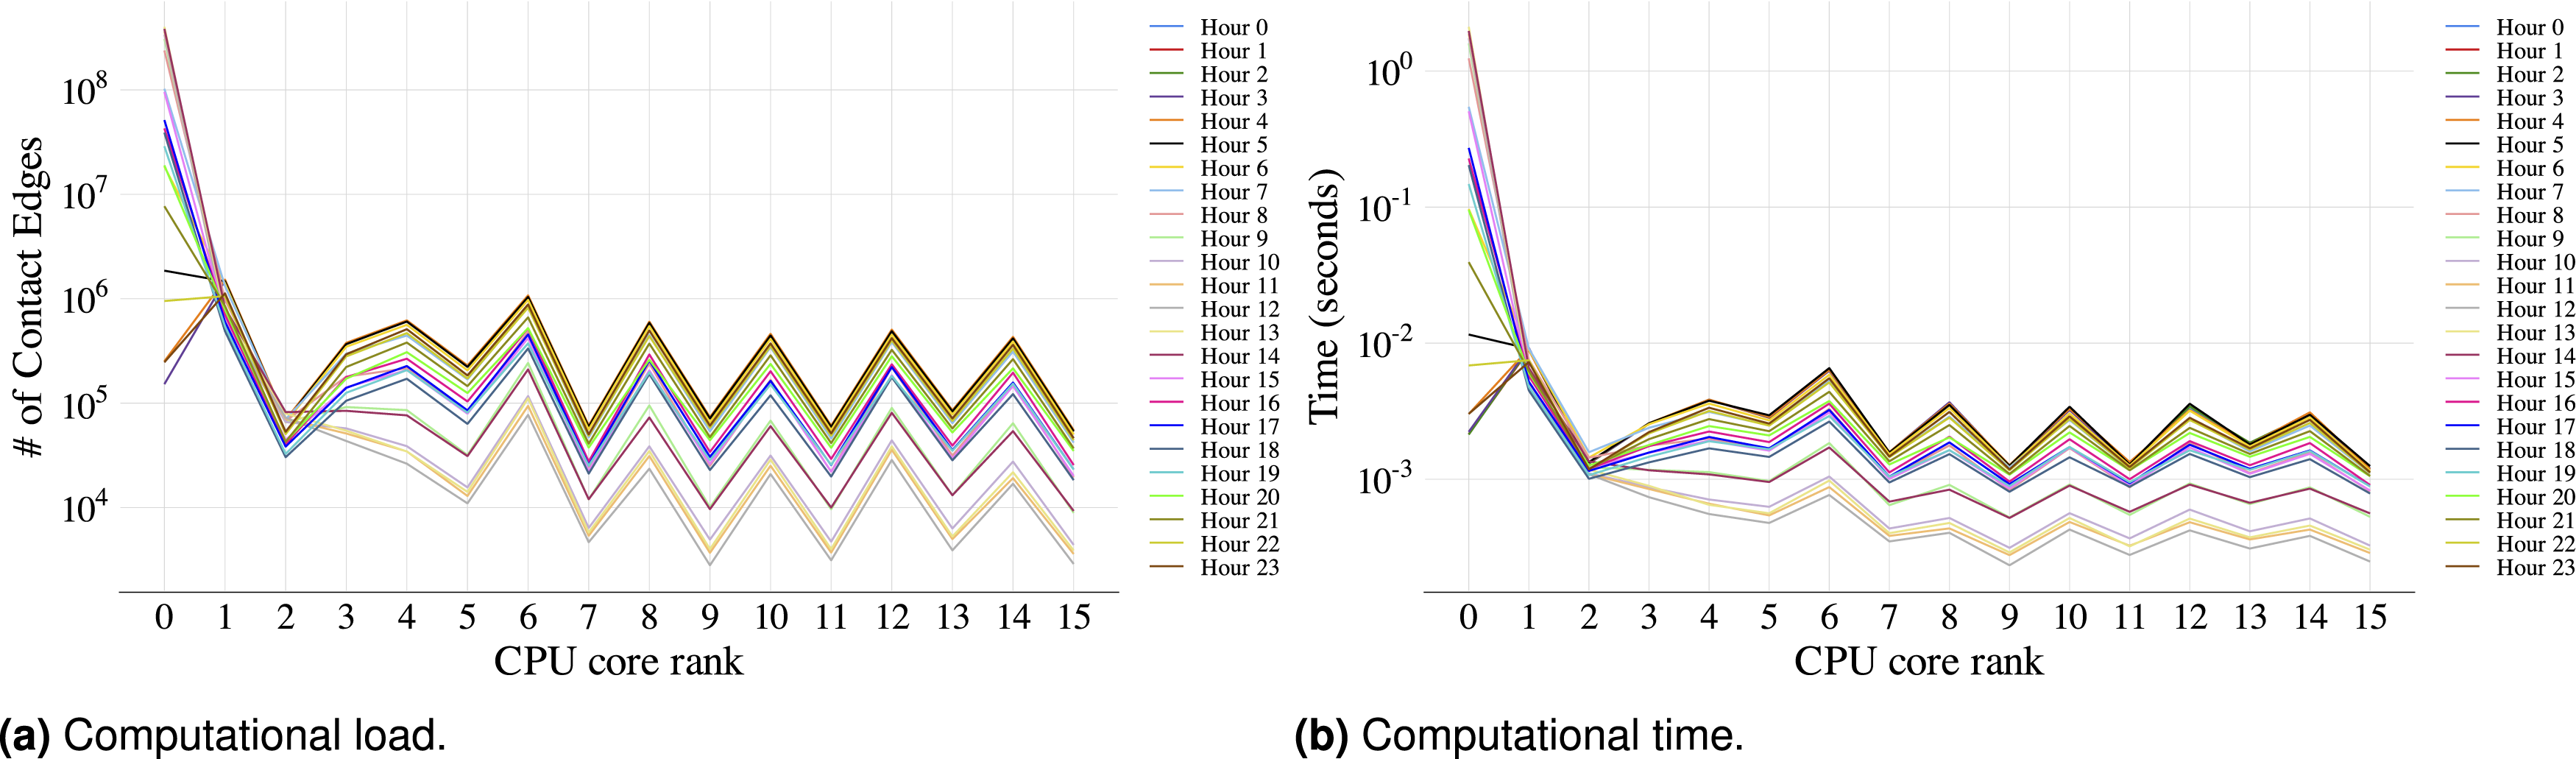
Using the UCP partitioning algorithm helps address the load imbalance evident in the naive approach, where there is a strong correlation between the number of edges assigned to each rank and its runtime leads to uneven workloads (see Figure 5). By distributing edges more evenly among ranks (Figure 6), UCP achieves a more uniform runtime across ranks, a trend evident for contact networks at all hours. It is worth noting that slight “jitters” occur near the lower end of the runtime scale, likely due to hardware effects or measurement noise, but overall, the UCP method maintains significantly more balanced performance. Improvement in parallel load balance and execution time due to UCP load balancing algorithm in 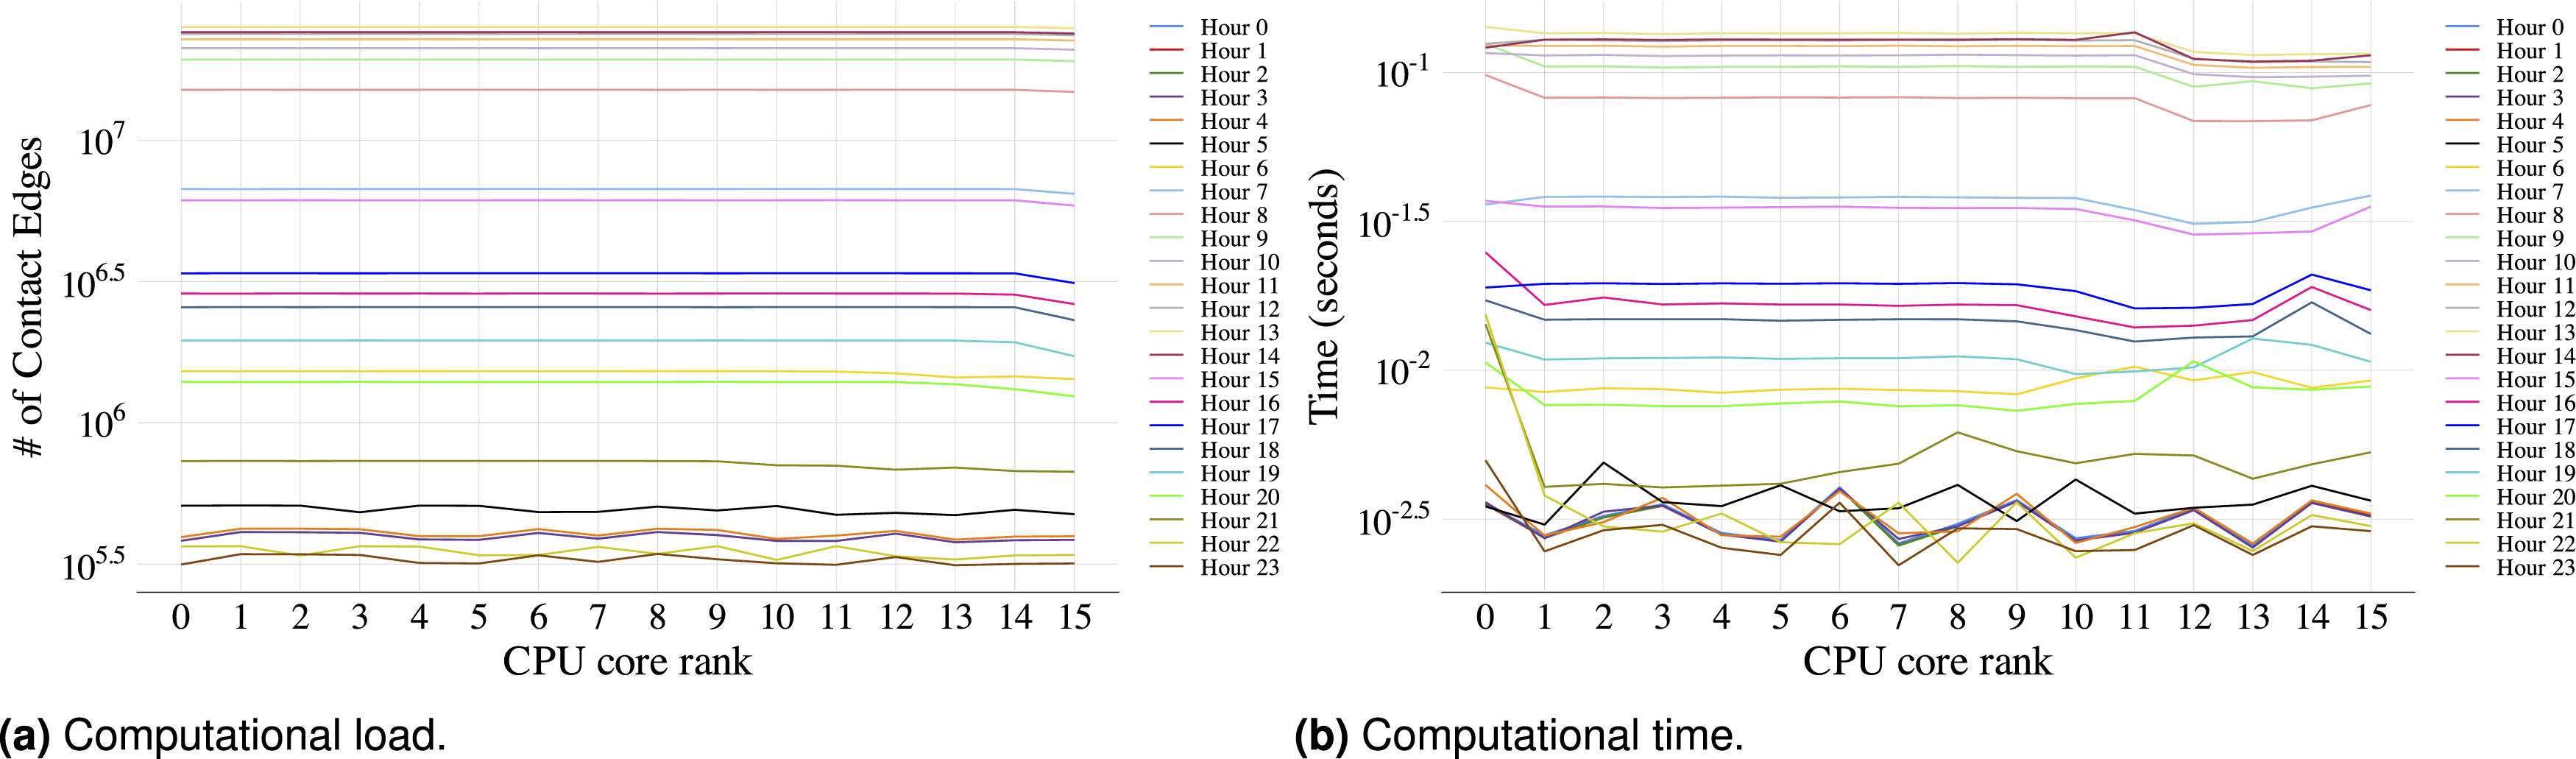
6.5. GPU performance
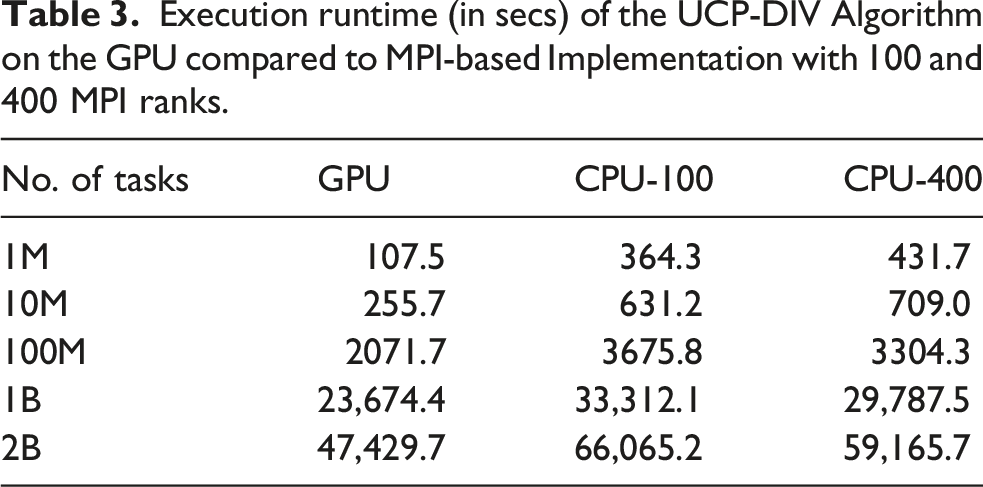
We conducted a comparative performance evaluation between GPU-accelerated and MPI-distributed implementations of the UCP-DIV algorithm. The distributed MPI version employed standard optimization techniques including parallel prefix operations and optimized inter-rank communication across P ranks. The GPU implementation utilized single-device execution with thread-level parallelism and high-bandwidth memory access.
Execution runtime (in secs) of the UCP-DIV Algorithm on the GPU compared to MPI-based Implementation with 100 and 400 MPI ranks.
There are two main kernels used to compute UCP: PrefixSum and UCP-DIV. The PrefixSum kernel is used to perform prefix sum operations on the GPU. The kernels UCP-DIV is used to find boundary based on UCP-DIV algorithm. Hardware performance counters were collected via
Hardware performance counters for the two primary UCP kernels on AMD Instinct MI250X, N = 107 tasks. HBM bandwidth utilization is normalized to the 1600 GB/s per-GCD peak; FP64 utilization to 23,900 GFLOP/s.
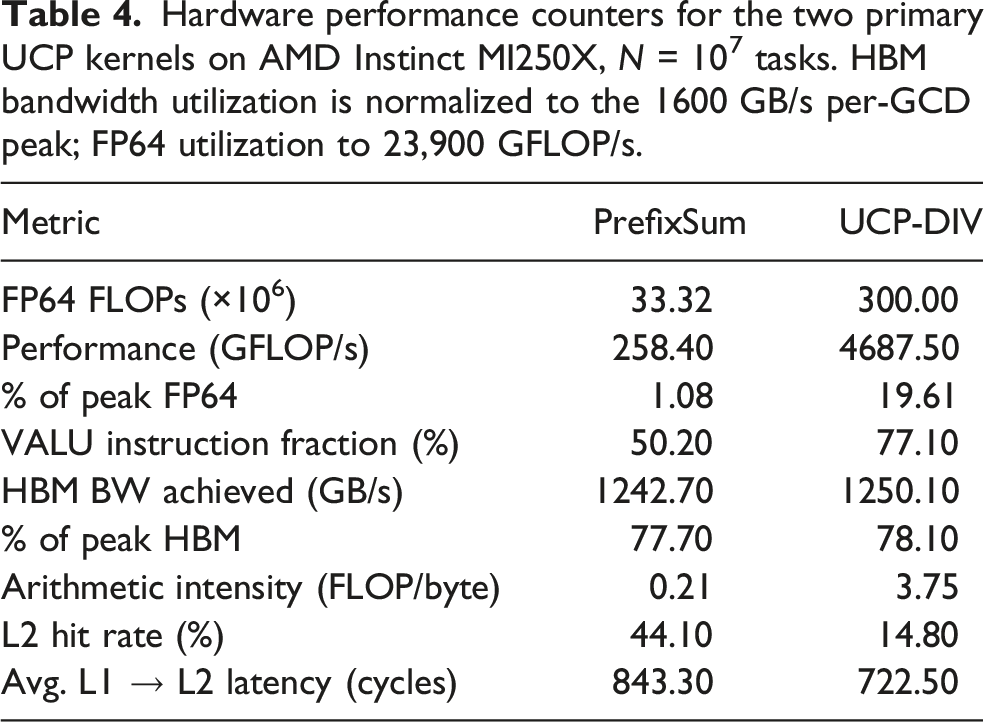
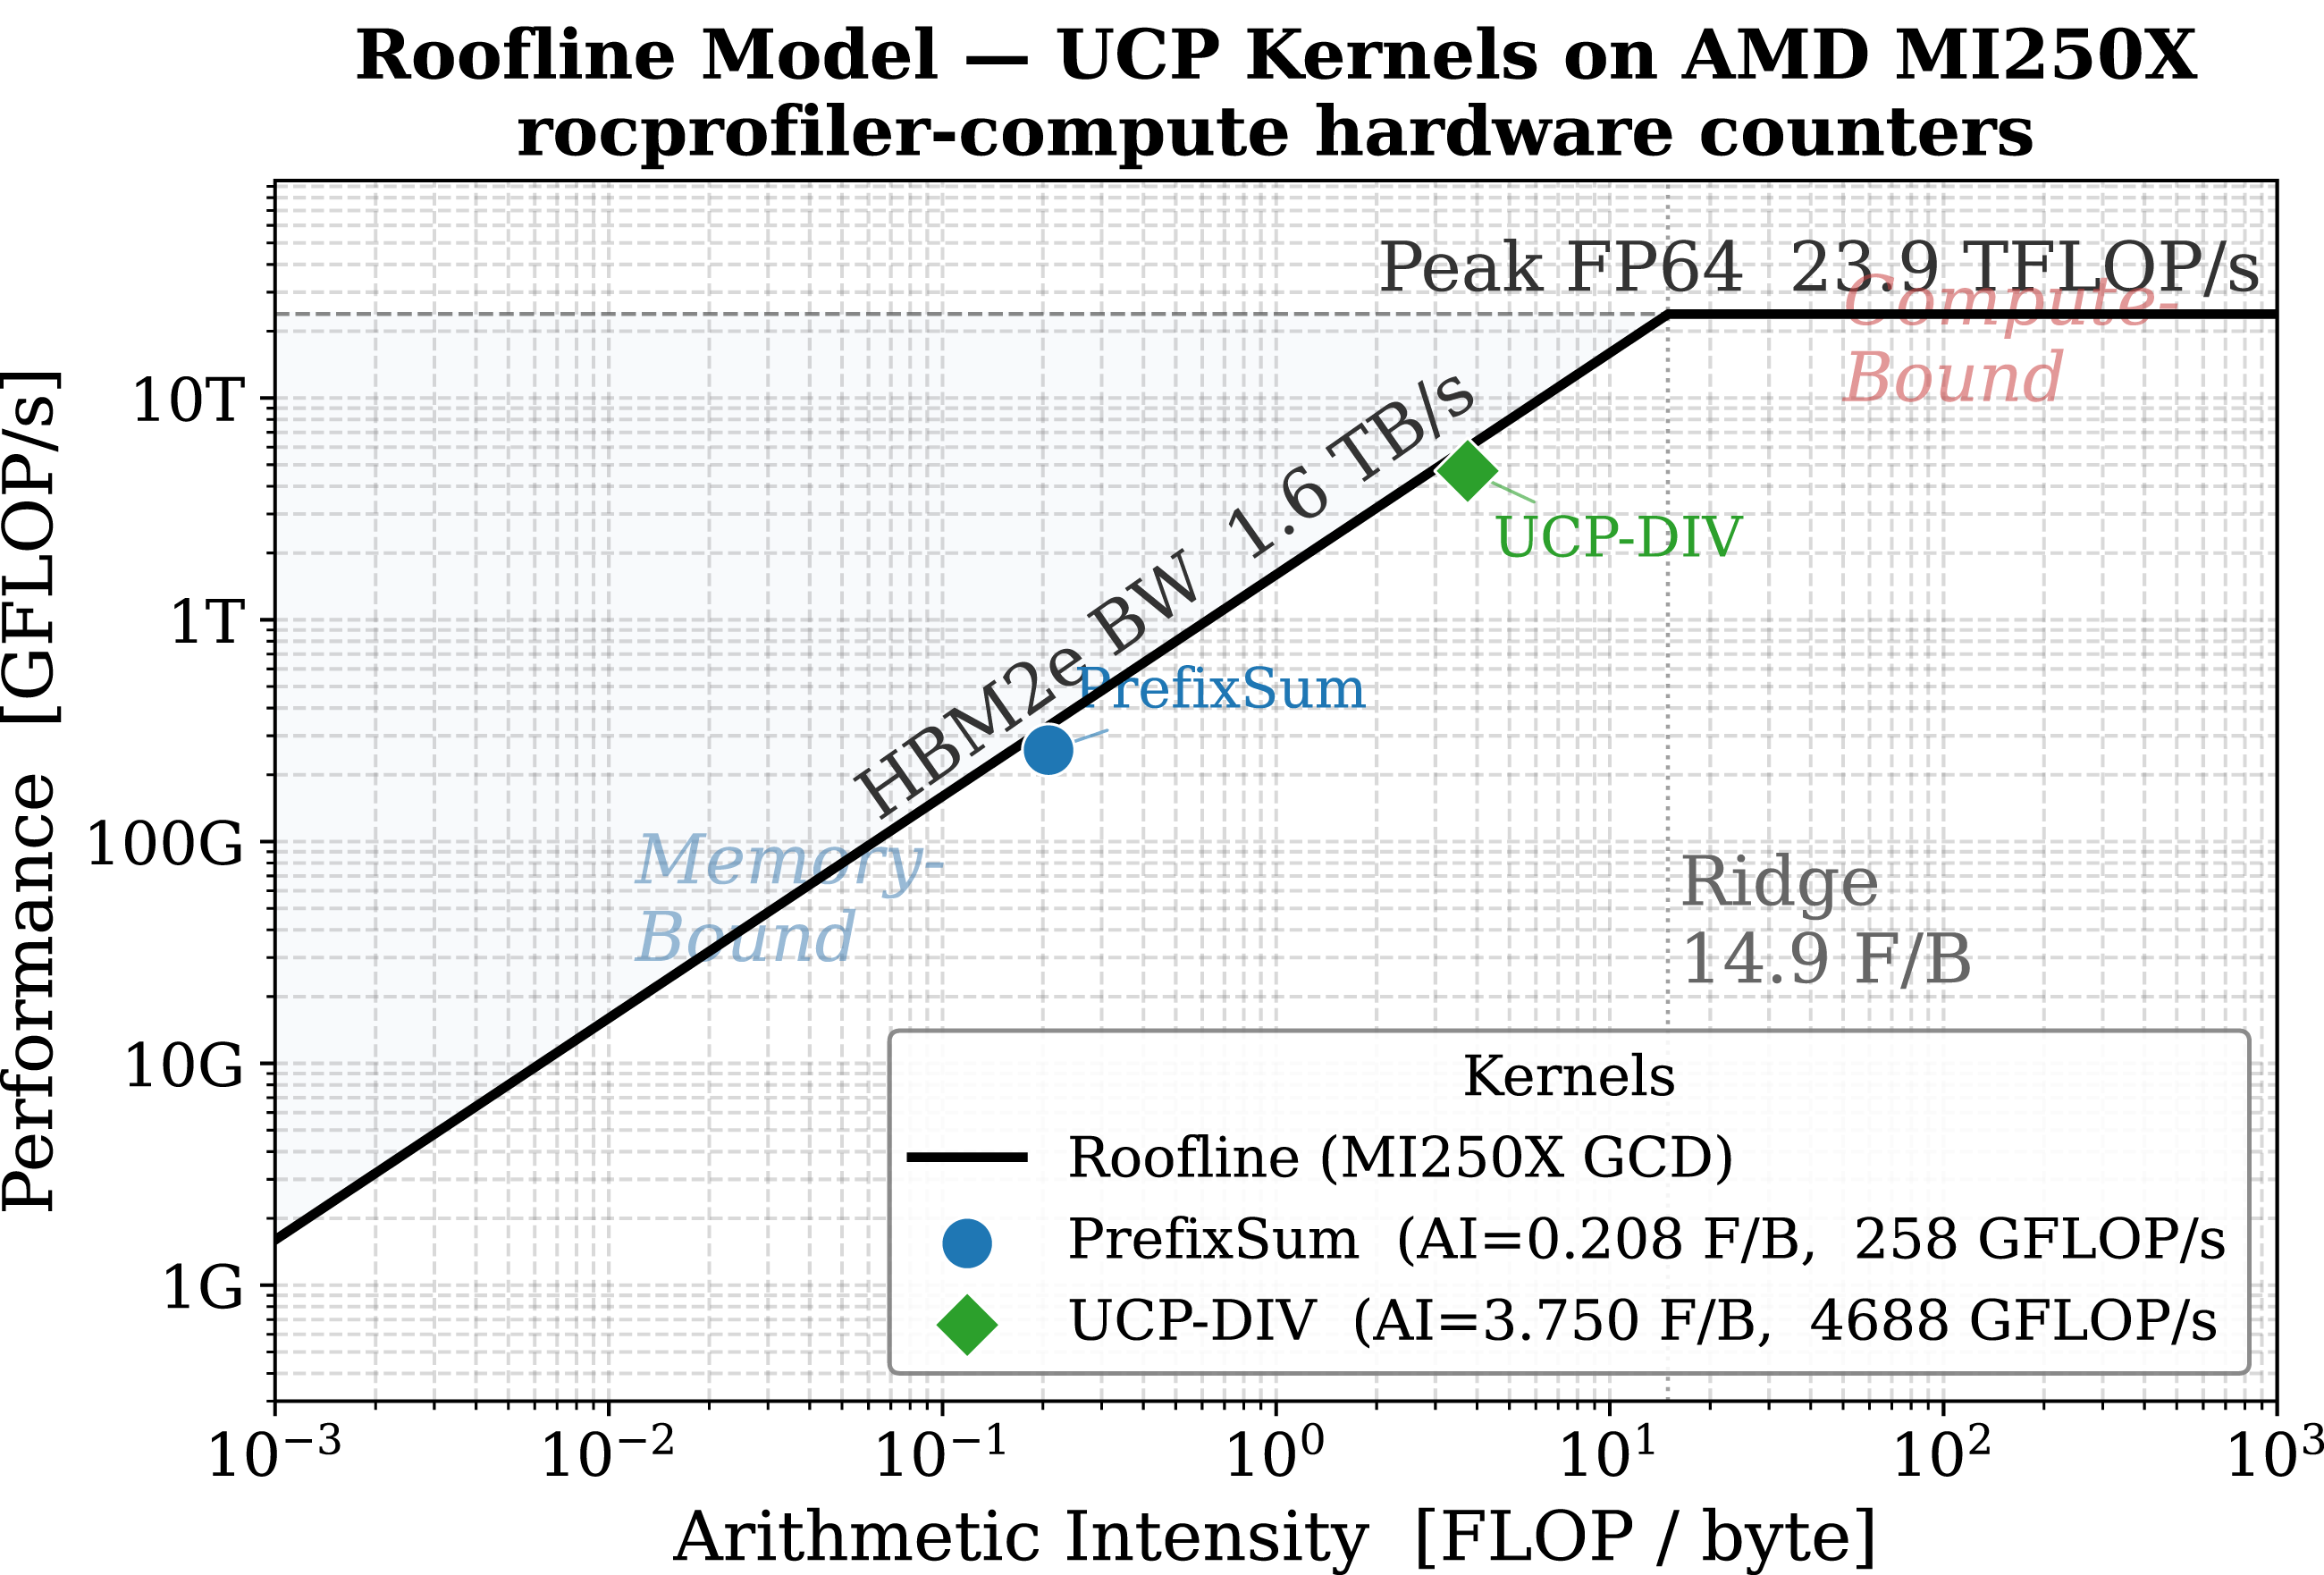
Roofline model for the UCP kernels on AMD Instinct MI250X. Both
Although both kernels are memory-bound,
6.6. Scaling studies
Strong scaling of a parallel application illustrates how its parallel execution time changes with the number of ranks for a fixed problem size. Figure 8(a) displays the speedup of the Strong scaling with real-world and synthetic population data of varying sizes.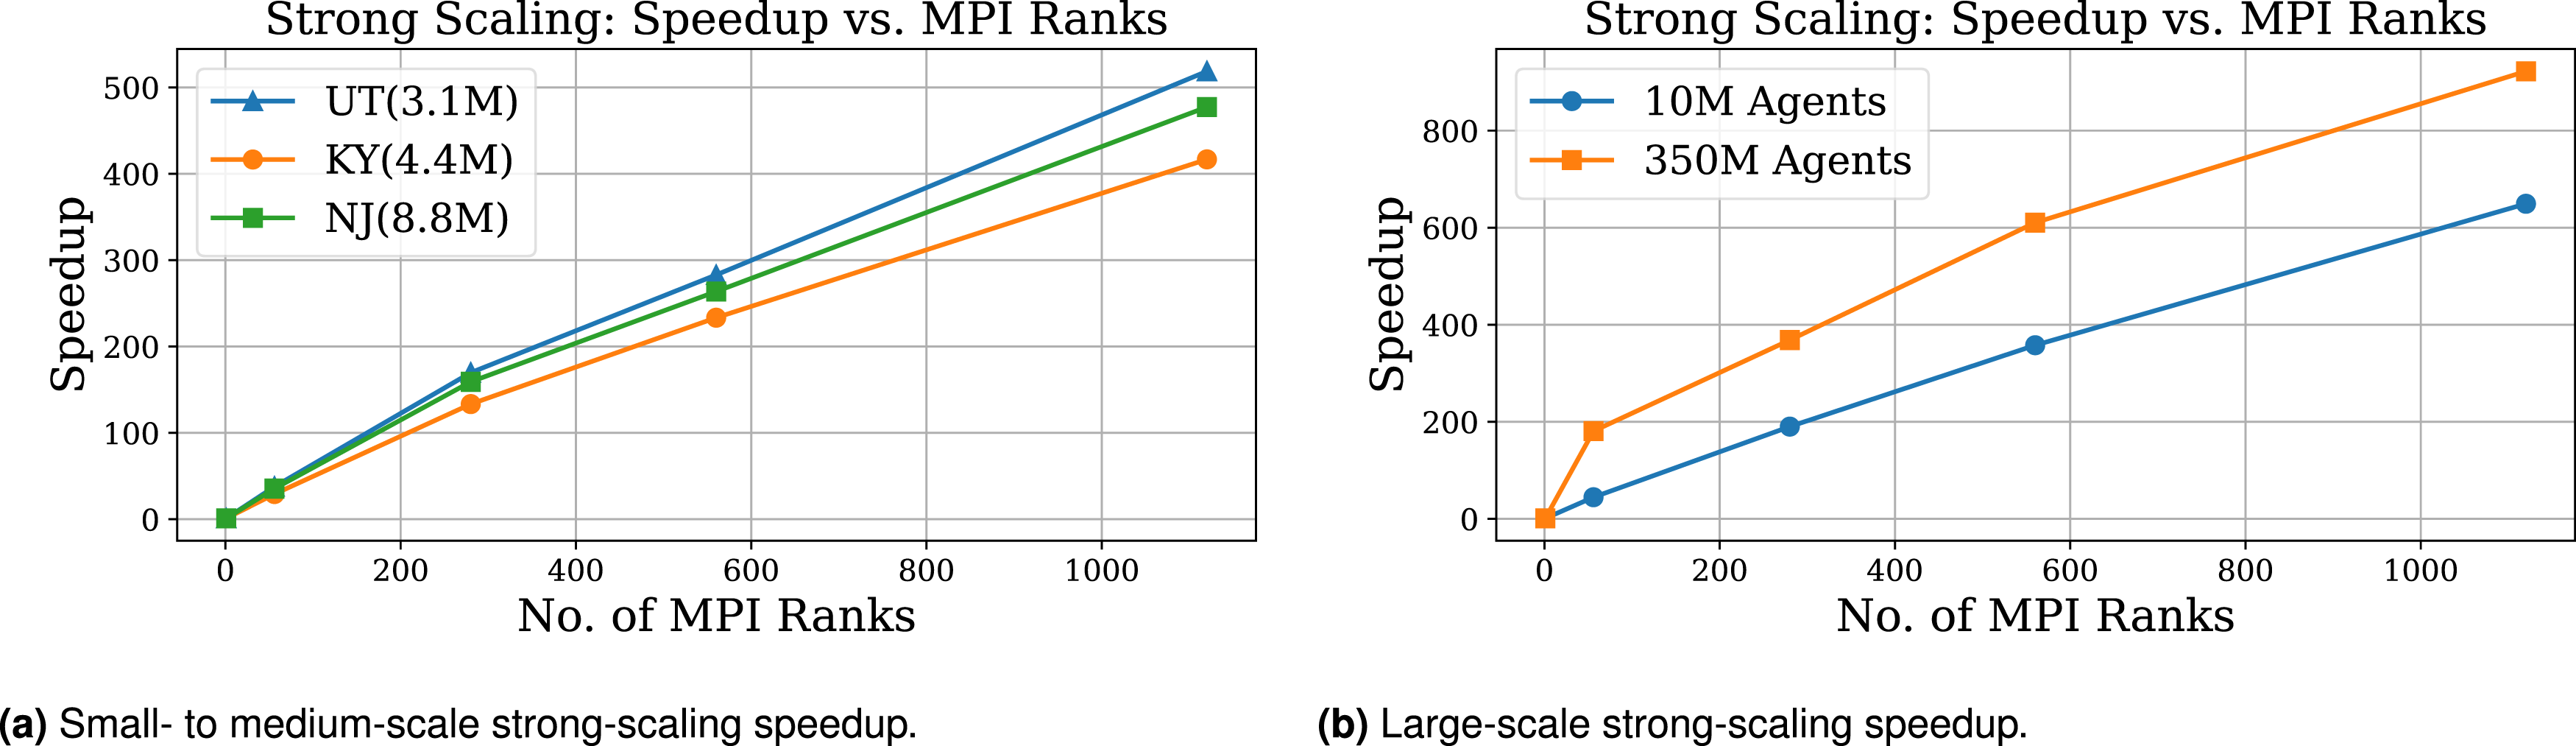
Strong-scaling speedup.
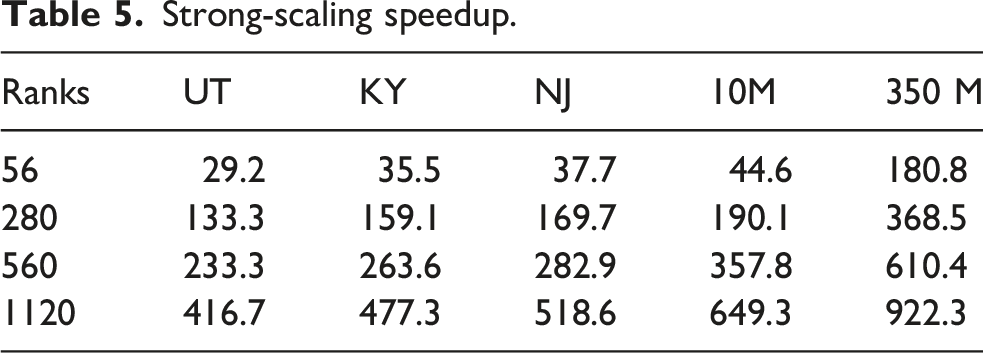
Parallel efficiency follows the expected behavior for strong scaling, gradually decreasing as the number of MPI ranks increases due to reduced computational work per rank and relatively increasing communication costs. For smaller population size and large GPU counts (UT at 1120 GPUs), the strong-scaling efficiency is poor which is to be expected as communication overheads dominate. However, for larger workloads, such as with 350M population, the efficiency reached above 80% despite the irregular computational workload of the data-driven ABMs. This behavior indicates that the ENABLE simulator effectively balances computation and communication and is capable of exploiting large-scale parallel systems for high-fidelity epidemic modeling. Overall, the results demonstrate that ENABLE achieves scalable performance across both synthetic and state-level workloads, with larger problem sizes exhibiting superior scalability and efficiency characteristics, consistent with strong scaling theory in distributed agent-based simulations.
Weak scaling measures the performance of a parallel algorithm when the input size per rank remains constant. For this experiment, the number of ranks was varied from 1 to 1200. Each rank executed approximately 291.7 K people and 2.9 K locations for a maximum of 350M people using 1200 ranks (GPUs). Figure 9 shows that the Weak scaling for up to 350M agents across 1 to 1200 MPI ranks (GPUs) with ∼291.7 K agents and ∼2.9 K locations per rank.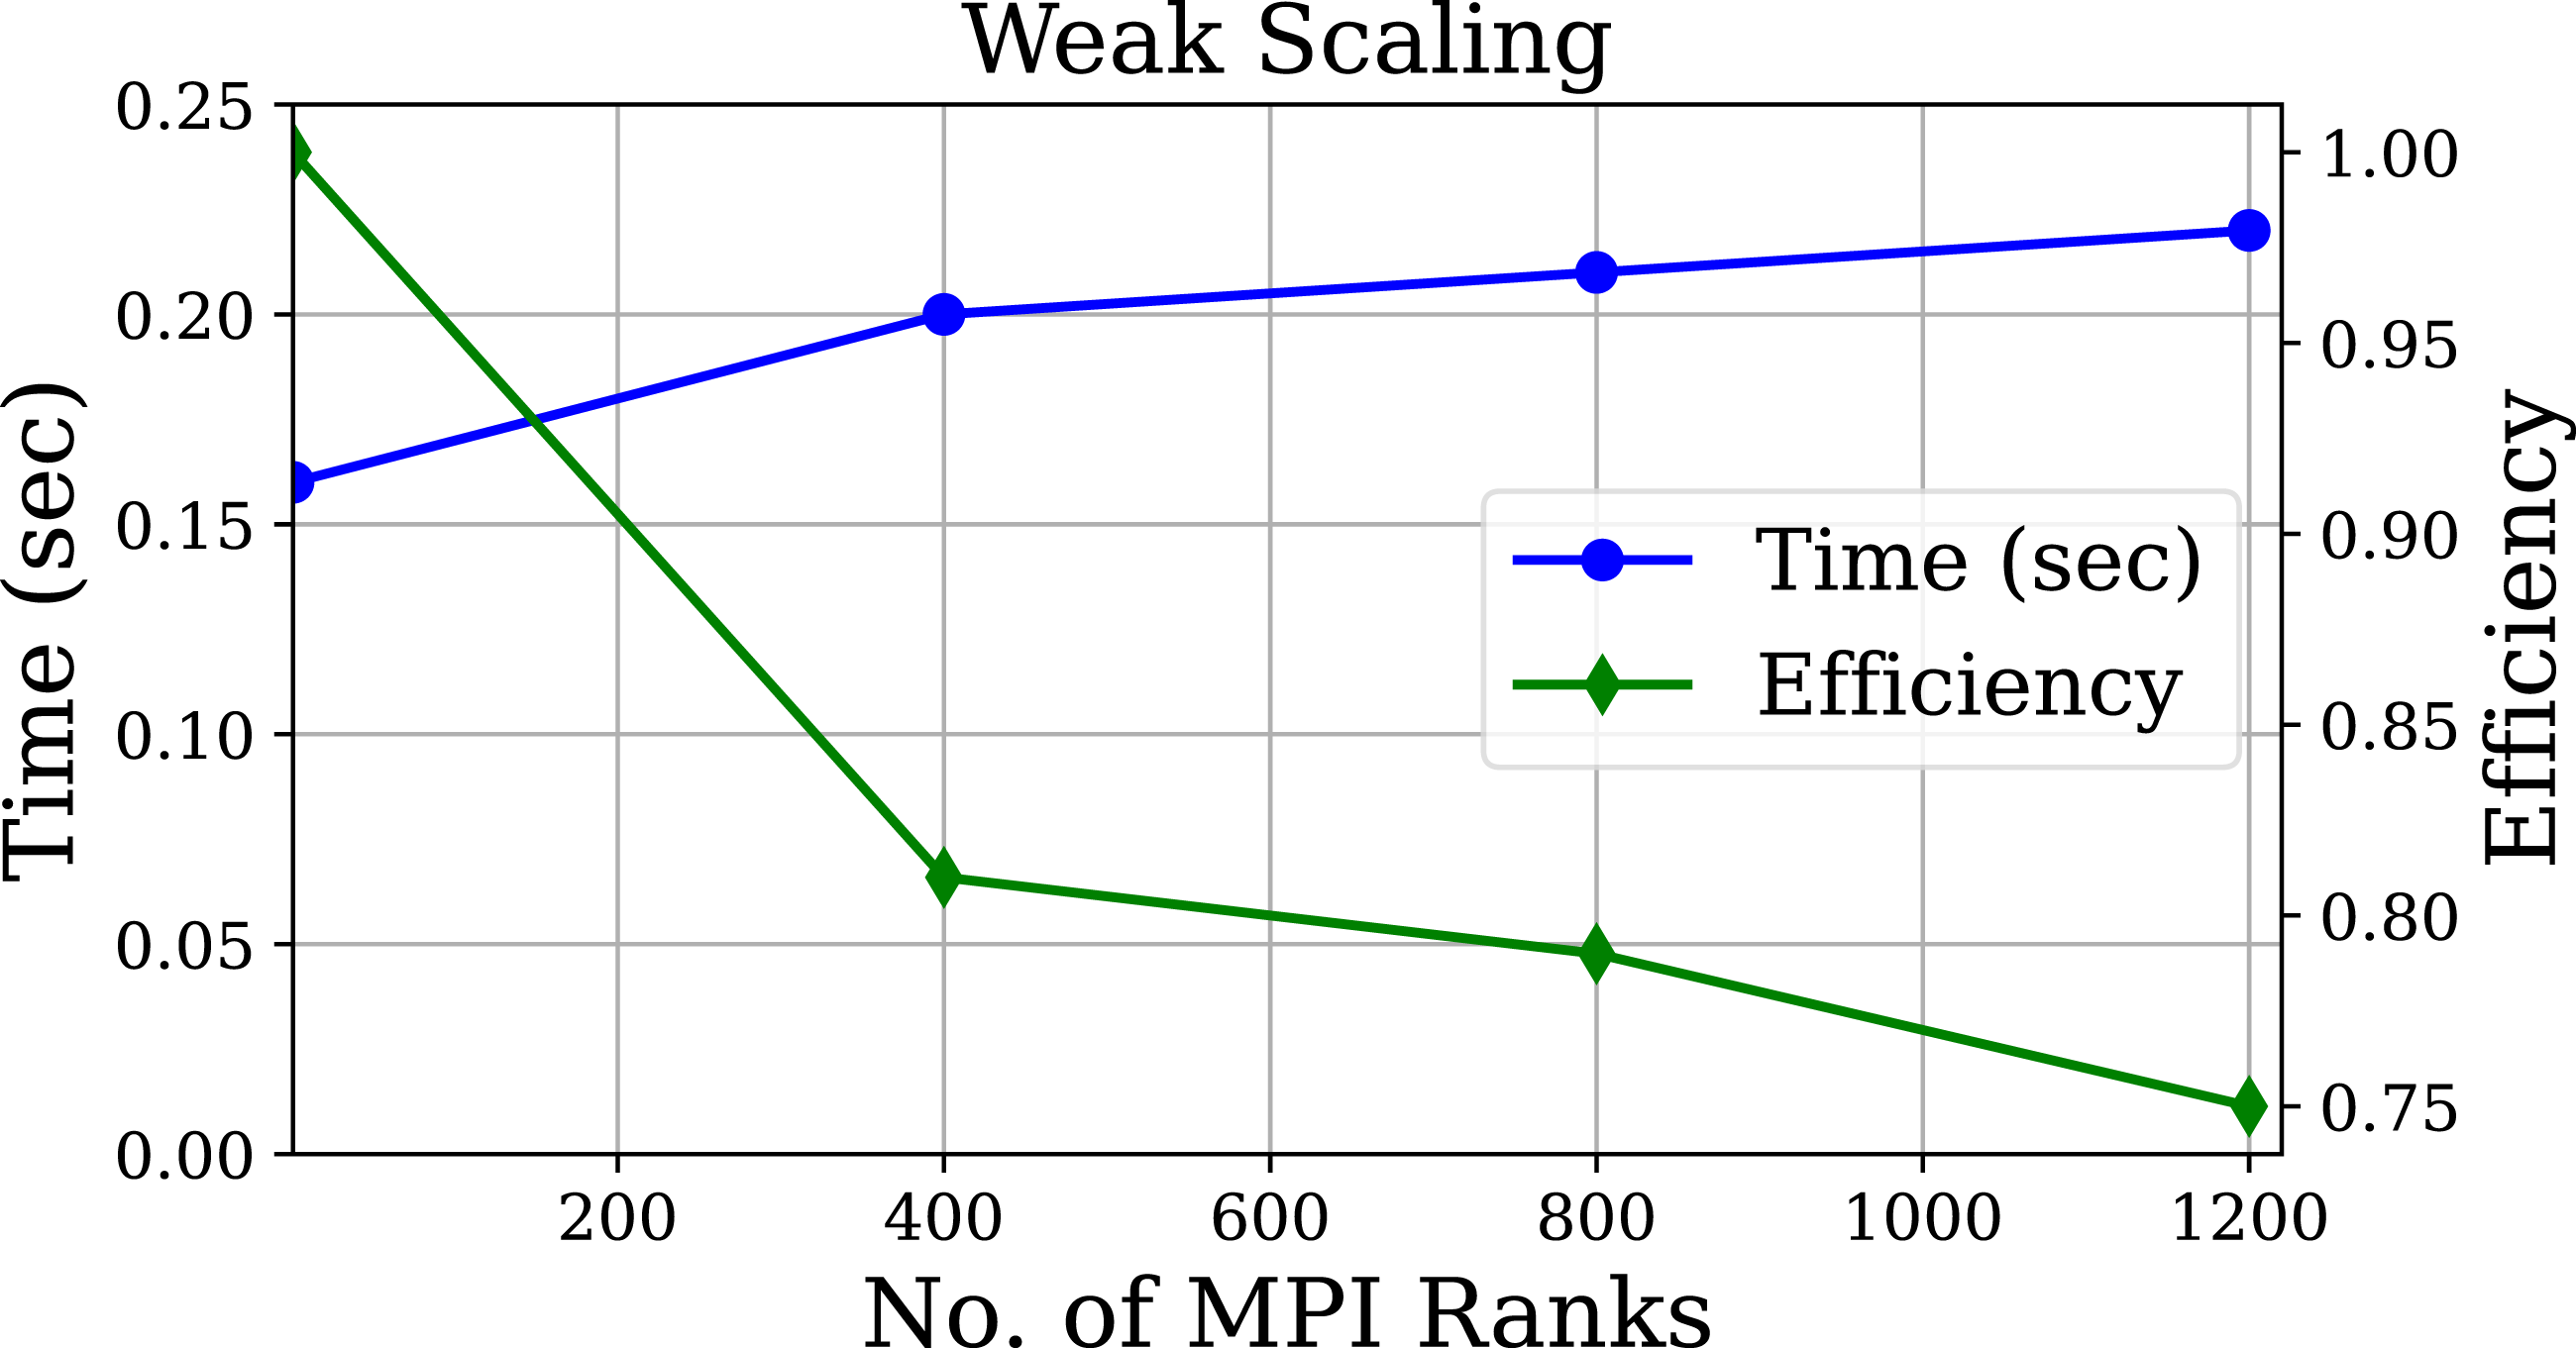
6.7. Model validity
6.7.1. Comparison with compartmental models
The primary goal of this paper is to report the architectural design and scaling performance of
The unit test scenarios presented here consist of a population of n = 4000 agents divided into three compartments namely Susceptible (S), Infectious (I) and Recovered (R) individuals representing the SIR compartmental disease model. The disease dynamics are modeled by the following set of ordinary differential equations (ODEs):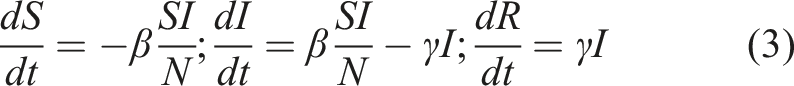
The mathematical and computational framework used to define the disease model within the agent-based
Transmissibility (τ) is a global scaling parameter in
Figure 10 demonstrates that the SIR curves computed using the ODE model and Comparisons of SIR curves computed by an ODE model (β = 0.5; γ = 0.1) and 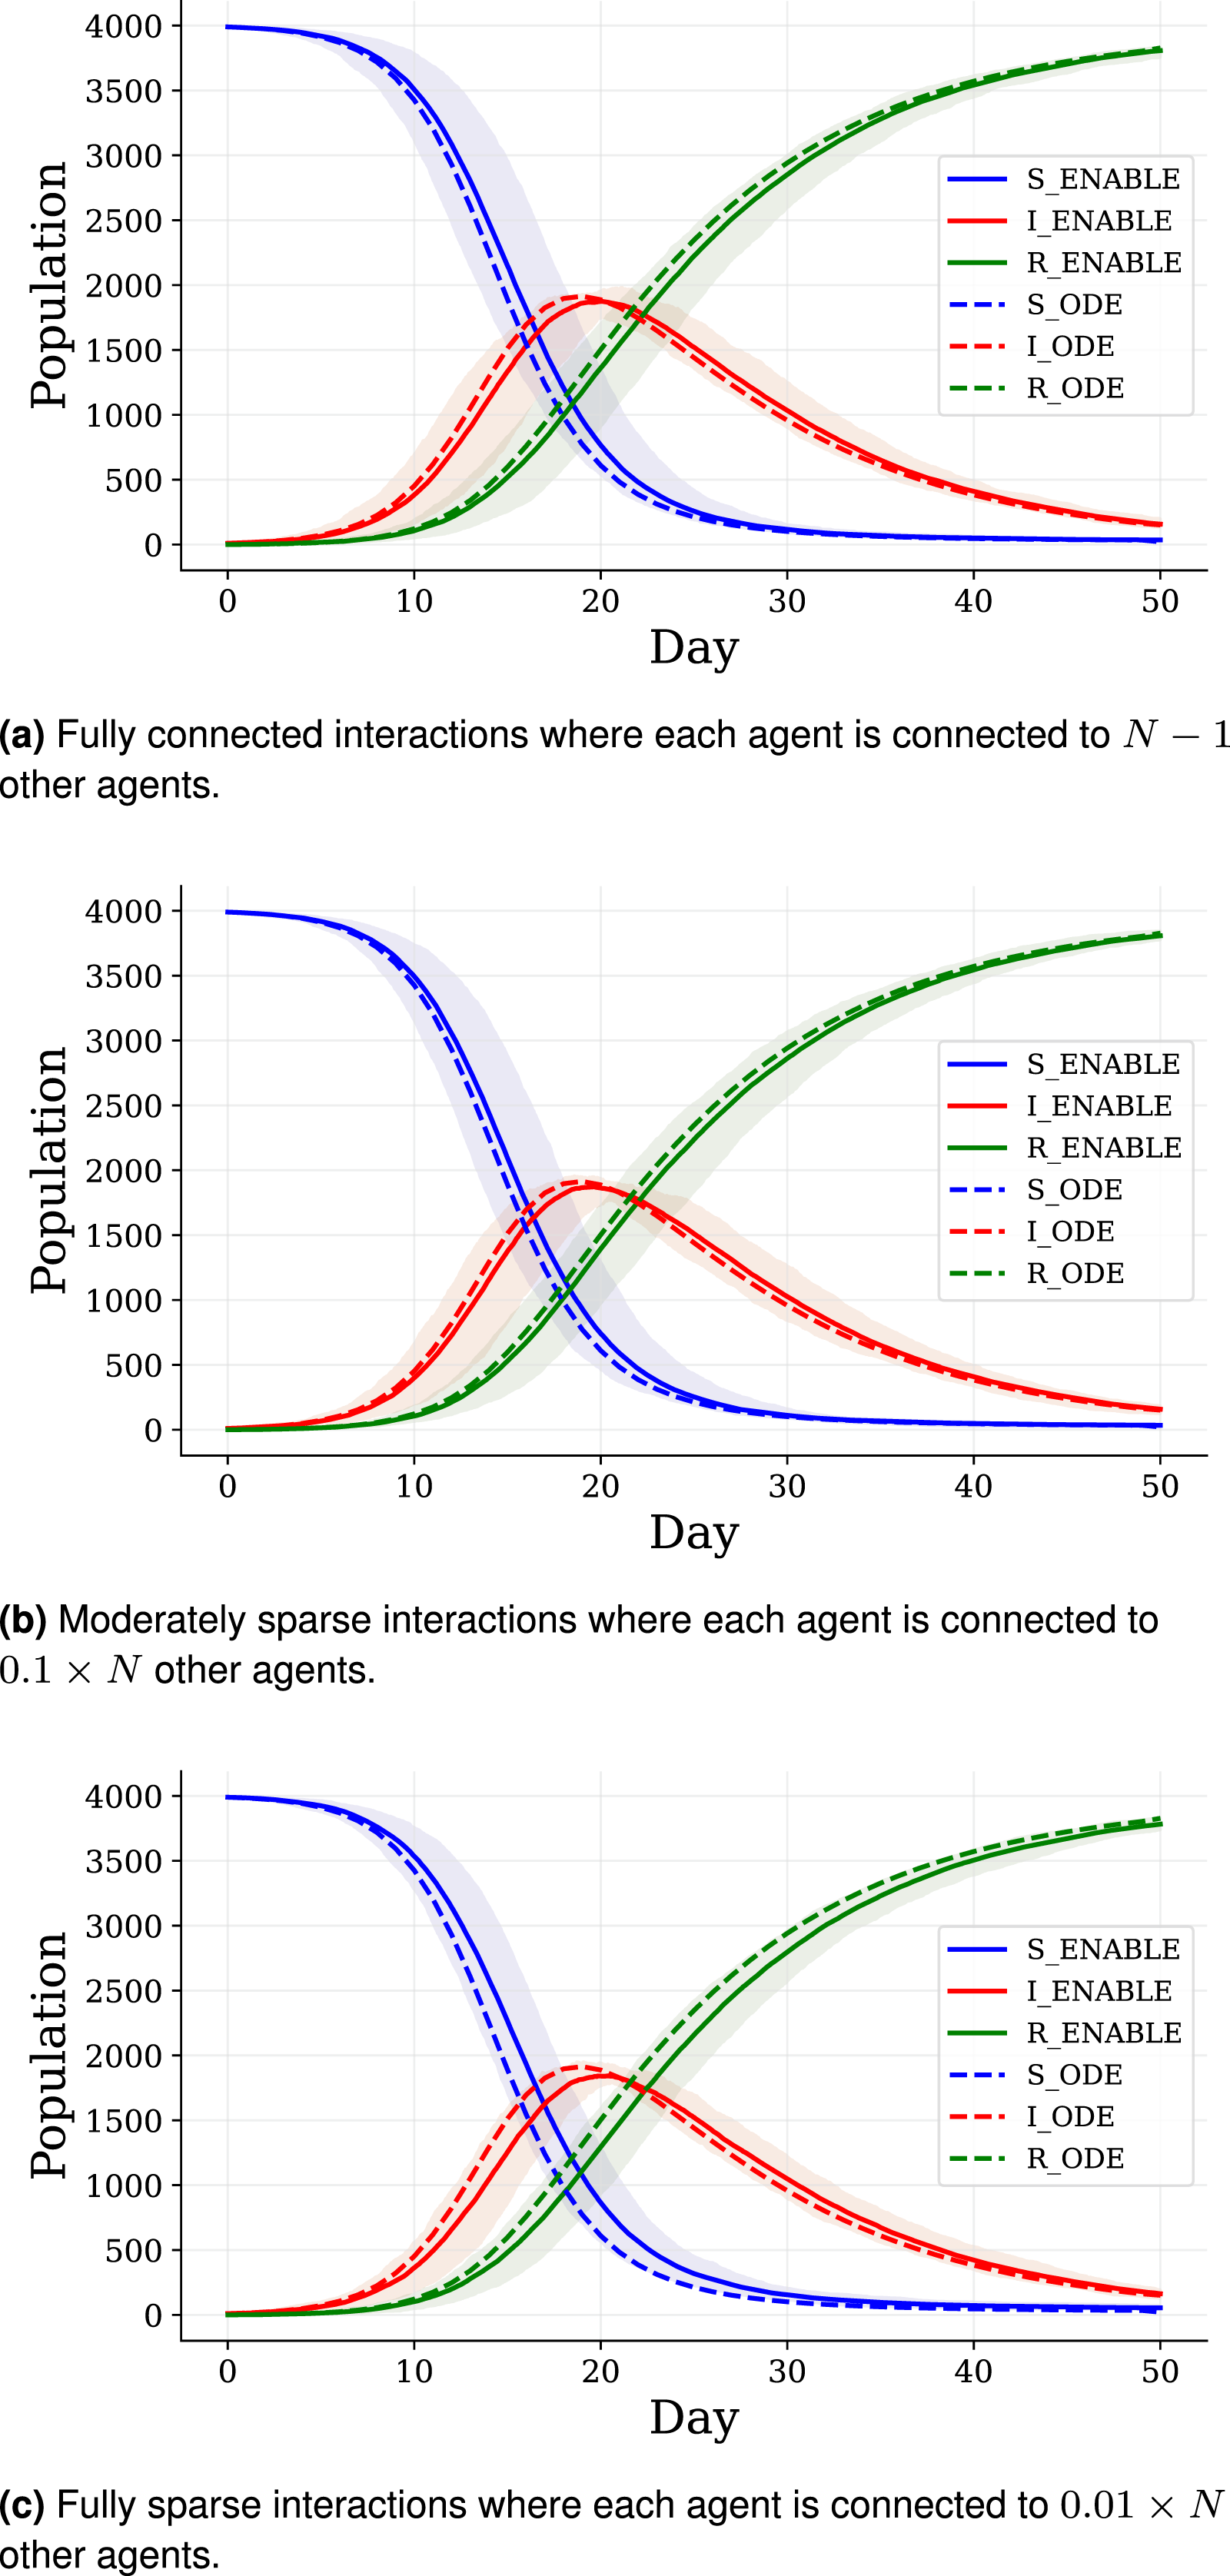
6.7.2. Validity of parallel execution across multiple ranks
Ensuring deterministic and reproducible stochastic behavior across different processor configurations is essential for verification and validation in large-scale parallel simulations. During the development of the parallel epidemic simulation workflow, differences were observed in the behavior of random number generation depending on the distribution used and the number of MPI ranks involved.
One possible workaround involved re-initializing the seed generator and the random number generator for each individual sample. Under this approach, each gamma sample was generated from a newly constructed generator initialized with the same seed, which ensured identical values across different MPI configurations. While this strategy restored determinism, it incurred a substantial performance penalty because repeated initialization of random number generation objects is computationally expensive. This overhead becomes significant in large-scale simulations that require billions of stochastic samples.
To address these limitations, a custom gamma distribution generator named
The custom
The underlying pseudorandom number generator in
Using this custom generator, simulations executed across different MPI ranks generate consistent stochastic realizations, enabling reliable comparison of results and improving the robustness of large-scale parallel simulation studies with the SIR epidemic trajectories showing the evolution of susceptible (S), infected (I), and recovered (R) populations over time.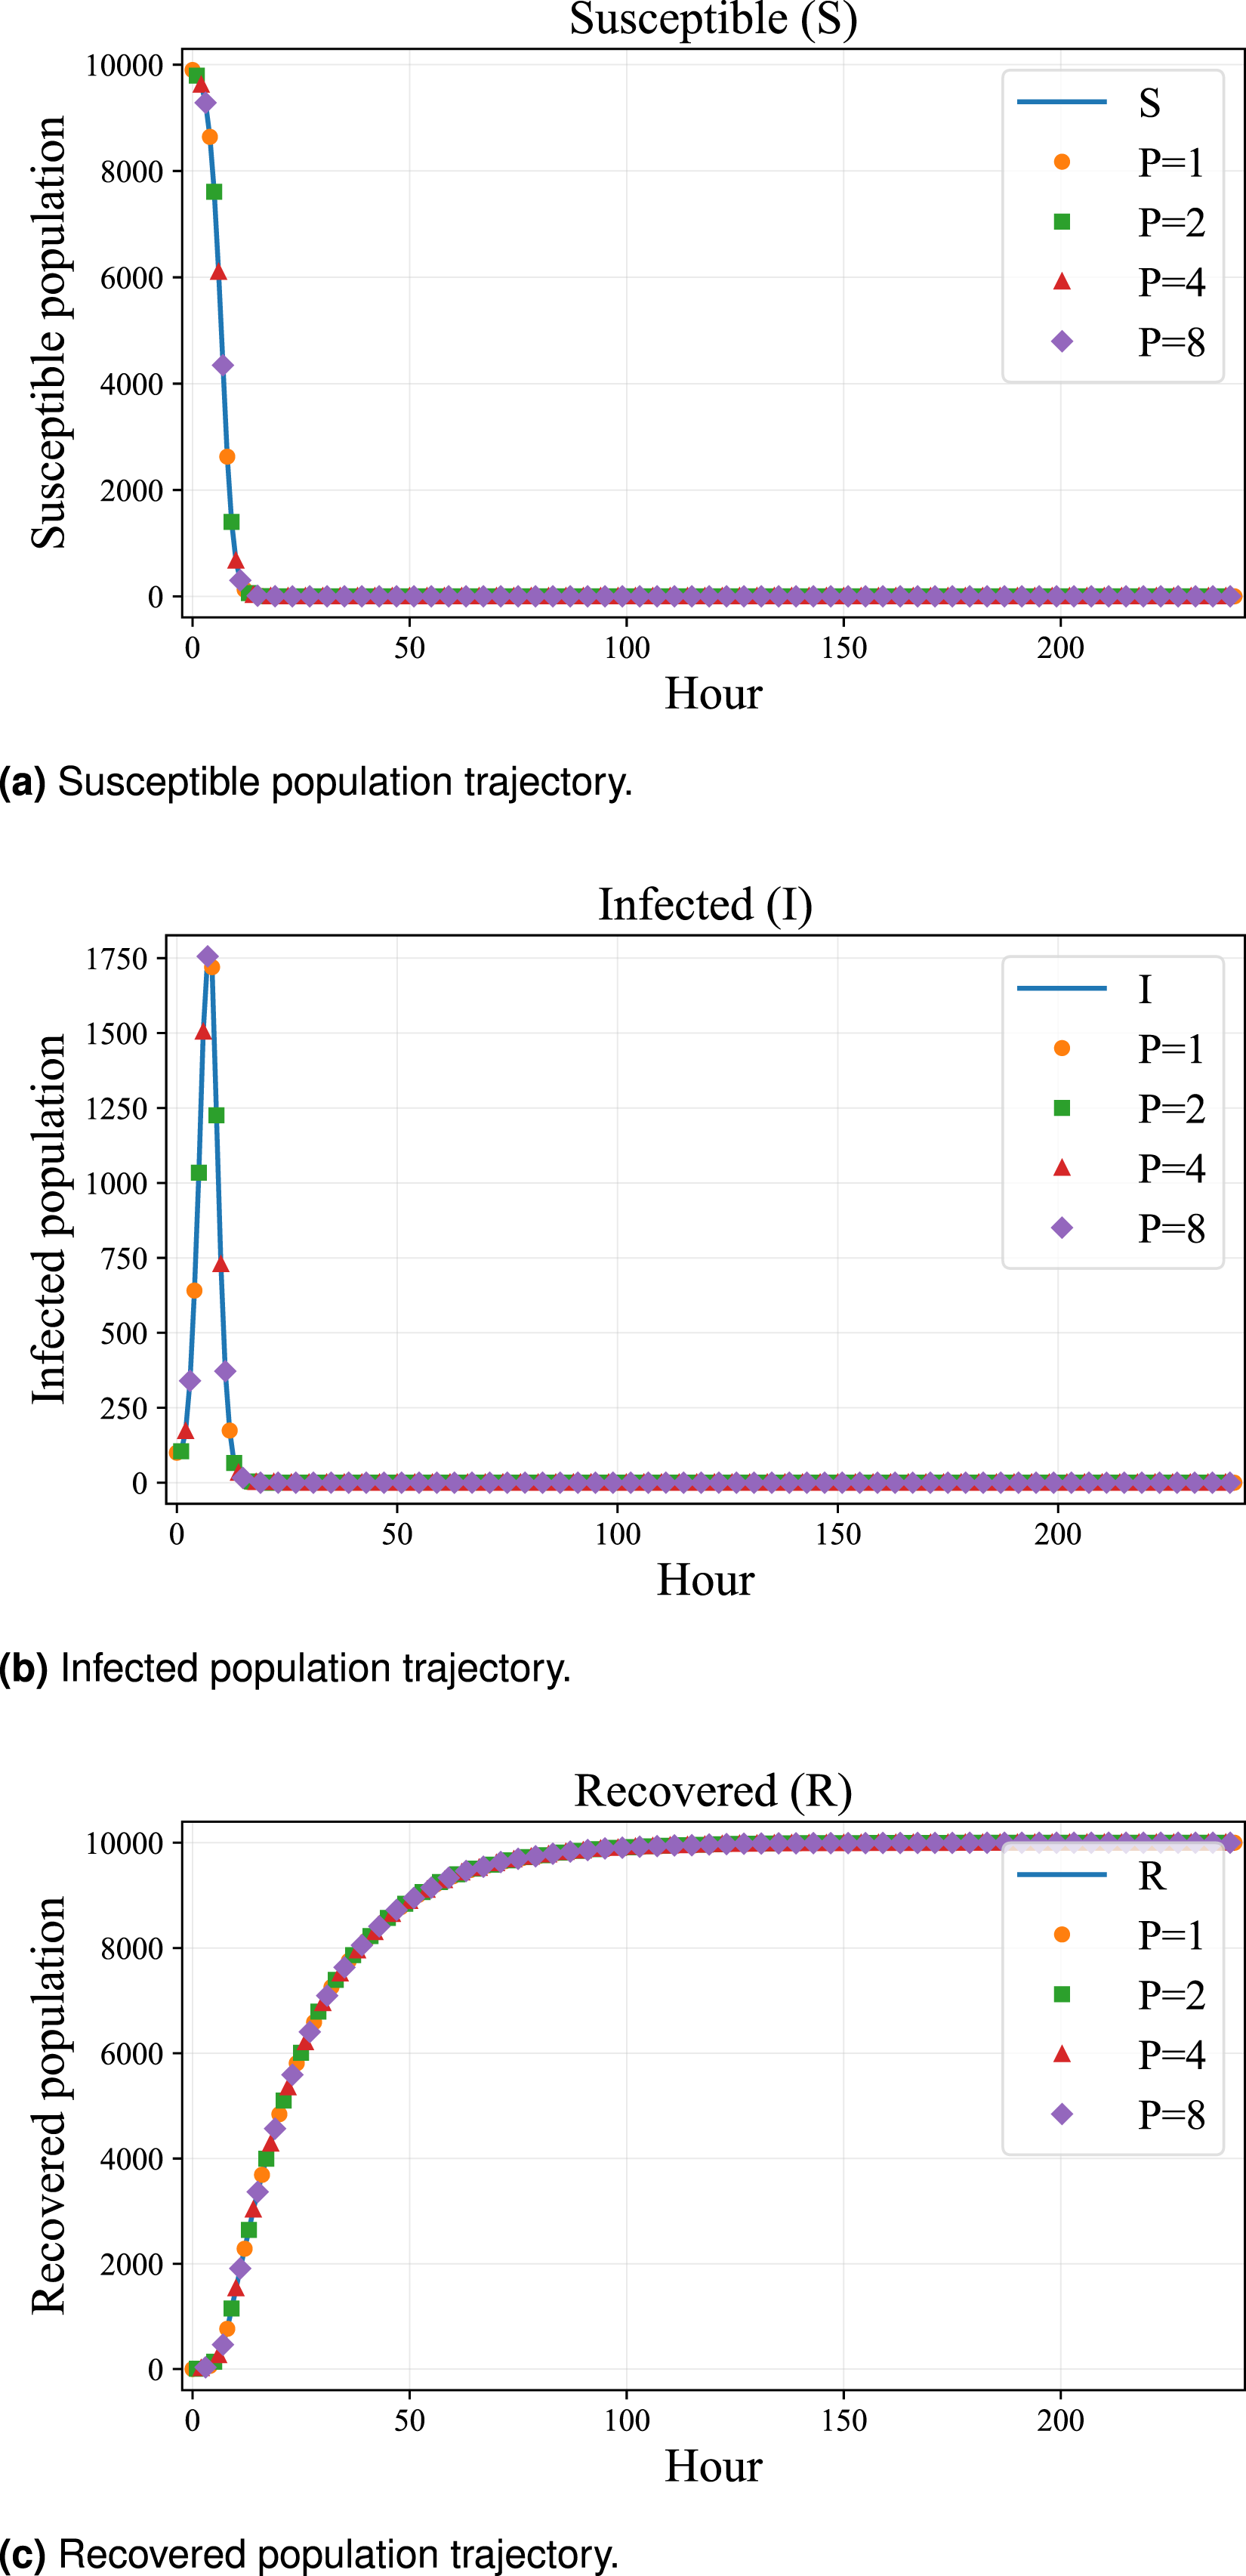
7. Portability
Parallel performance results of the
Portability of the
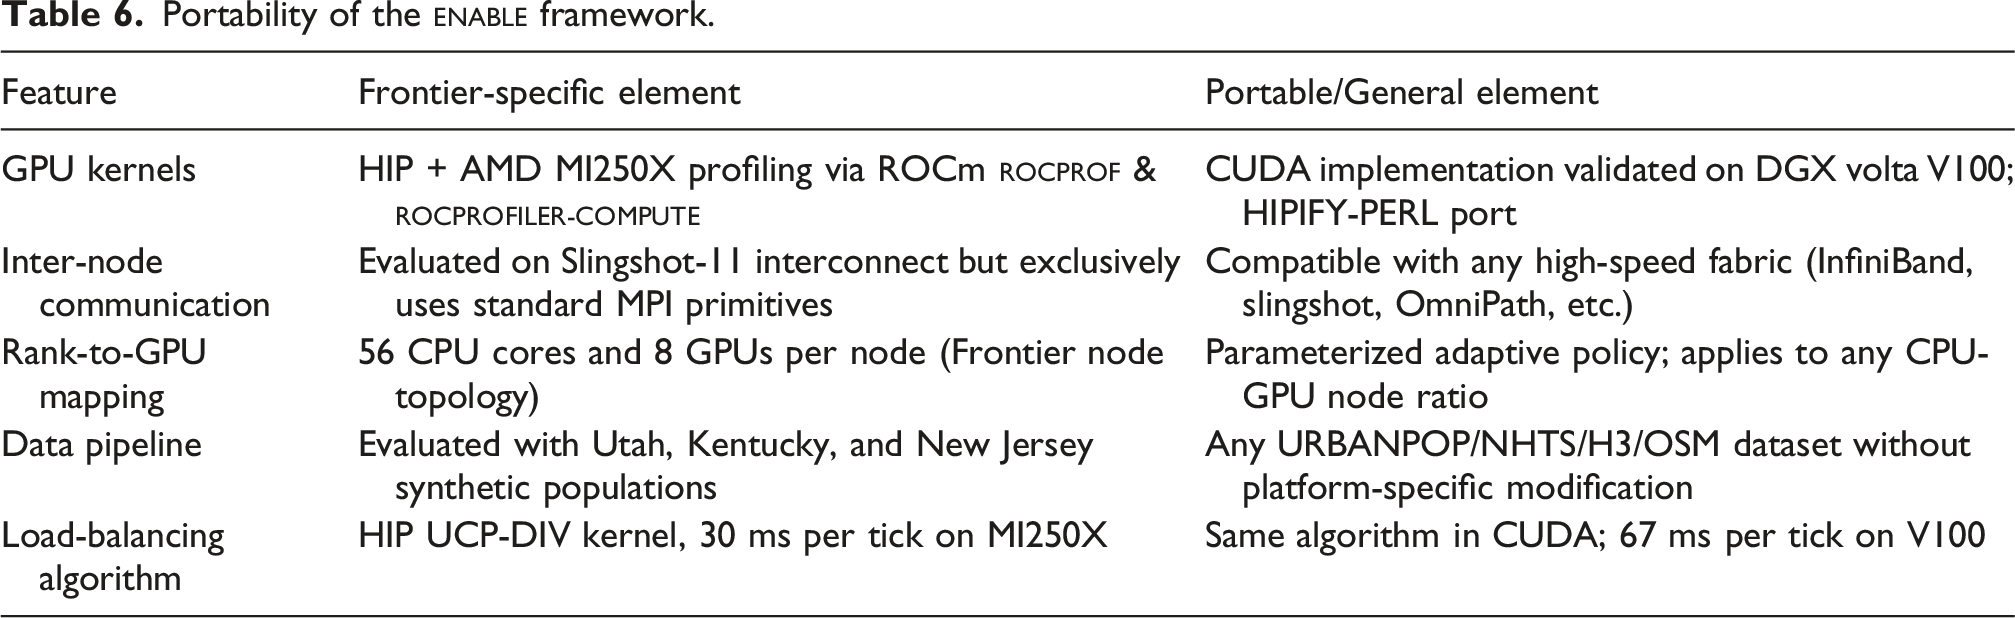
GPU kernel portability: The UCP-DIV load-balancing kernel was prototyped in CUDA and subsequently ported to HIP using HIPIFY-PERL. This two-stage development process was deliberate: the CUDA codebase targets NVIDIA GPUs (as demonstrated by the comparative profiling on a DGX Volta V100 system reported in Table 3), while the HIP translation supports AMD GPUs including the MI250X devices on Frontier as well as any future AMD architecture.
Comparison of
Architecture-neutral data pipeline: The upstream data pipeline (URBANPOP, NHTS-derived activity schedules, Uber H3 spatial indexing, OpenStreetMap) is fully decoupled from the simulation runtime. Synthetic populations for any geographic region can be ingested without platform-specific modification.
8. Conclusions and future work
We introduced ENABLE (Efficient National-scale Agent-Based Learning Environment), a hybrid CPU–GPU framework for scalable, data-driven agent-based population health simulations on heterogeneous architectures such as the Frontier supercomputer. Key contributions include: dynamic contact network generation from time-varying activity trajectories, enabling realistic spatio-temporal mobility patterns and laying the foundation for real-time data assimilation; a GPU-resident implementation of the Uniform Cost Partitioning (UCP-DIV) algorithm — first in CUDA, subsequently ported to HIP — that balances location-based edge distributions across ranks, reducing inter-process communication and memory overhead; and an asynchronous CPU–GPU execution pipeline that overlaps contact network construction with disease propagation, minimizing host-device communication overheads. Comprehensive strong and weak scaling evaluations on synthetic and real-world datasets (UrbanPop, Uber H3 Hex, OpenStreetMap) confirm excellent parallel efficiency at up to 1200 GPUs. Future work will target full Frontier-scale deployment and integration of real-time data pipelines for a broader class of policy and emergency response scenarios.
Footnotes
Acknowledgements
This manuscript has been authored by UT-Battelle, LLC under Contract No. DE-AC05-00OR22725 with the U.S. Department of Energy. The United States Government retains and the publisher, by accepting the article for publication, acknowledges that the United States Government retains a non-exclusive, paid-up, irrevocable, worldwide license to publish or reproduce the published form of this manuscript, or allow others to do so, for United States Government purposes. The Department of Energy will provide public access to these results of federally sponsored research in accordance with the DOE Public Access Plan (![]() ). This research used resources at the Oak Ridge Leadership Computing Facility which is a DOE Office of Science User Facility. This research was sponsored by the U.S. Department of Energy, Office of Science, Office of Advanced Scientific Computing under Award Number DE-SC-ERKJ422.
). This research used resources at the Oak Ridge Leadership Computing Facility which is a DOE Office of Science User Facility. This research was sponsored by the U.S. Department of Energy, Office of Science, Office of Advanced Scientific Computing under Award Number DE-SC-ERKJ422.
Funding
The authors received no financial support for the research, authorship, and/or publication of this article.
Declaration of conflicting interests
The authors declared no potential conflicts of interest with respect to the research, authorship, and/or publication of this article.