






Abstract
This article investigates in two ways the use and reporting of marker variables to detect common method variance (CMV) in organizational research. First, a review of 398 empirical articles and 41 unpublished dissertations that employ marker variables indicates that authors are not reporting adequate information regarding marker variable choice and use, are choosing inappropriate marker variables, and are possibly making errors in their assessment of CMV effects. Second, two data sets are presented that investigate the properties of six prospective markers to assess the degree to which they capture specific, measurable causes of CMV and the conclusions these markers produce when applied to substantive relationships. Results from the review and empirical investigation are used to expand the set of conditions scholars should consider when determining whether to employ a marker technique over other alternatives for detecting and controlling CMV and how best to do so.
Concern about the effects of common method variance (CMV) continues to capture the attention of organizational scholars, despite disagreement over its prevalence and nature (Podsakoff, MacKenzie, Lee, & Podsakoff, 2003; Spector, 2006). Defined as systematic variance resulting from the method used to collect data (e.g., a self-report survey), CMV is frequently associated with apprehension about artificially inflated relationships among variables (Spector & Brannick, 2010). Researchers have proposed and have begun evaluating post hoc CMV detection techniques in response to such concerns (Lindell & Whitney, 2001; Malhotra, Kim, & Patil, 2006; Richardson, Simmering, & Sturman, 2009; L. J. Williams, Hartman, & Cavazotte, 2010). While disagreement exists about which approach is most accurate, with some authors not recommending the use of any (Conway & Lance, 2010; Podsakoff et al., 2003), marker-based techniques have been tentatively suggested as effective means of identifying CMV (Malhotra et al., 2006; Richardson et al., 2009). Yet, even those who most strongly endorse such methods caution that their utility is likely a function of the quality of the markers used to implement them (Lindell & Whitney, 2001; L. J. Williams et al., 2010).
The primary determinants of a marker variable’s quality are the degree to which it (a) is influenced by the same causes of CMV (e.g., affectivity, acquiescence) as a set of substantive variables, but (b) is not theoretically related to those substantive variables. Identifying such a marker is not a simple endeavor—it is difficult to know whether any variable truly reflects variance due to method and, if so, what causes that method variance. Although markers should be chosen a priori based on theoretical and methodological considerations, extant theory is often inadequate for establishing when variables will be unrelated to one another or to which types of CMV they will be most vulnerable (Richardson et al., 2009; L. J. Williams et al., 2010). Empirical studies of marker techniques are likewise of limited assistance. Whereas Richardson et al. (2009) demonstrate the importance of using a substantively unrelated marker to accurately detect CMV, their simulated data does not lend itself to the identification of actual variables that might perform well in this capacity. Williams et al. (2010), in contrast, demonstrate a marker technique with a carefully selected, replicable marker, but their data prevents them from empirically assessing the causes of CMV it may or may not reflect.
In light of the challenge and importance of employing an appropriate marker, the present article seeks to offer new insight into the identification and selection of “ideal” markers with two studies. The first reviews the practice of marker variable use in published and unpublished research, with particular attention given to the markers utilized, the arguments offered for their appropriateness, and the conclusions drawn from their use. The second study builds on the first by empirically investigating prospective markers to assess the degree to which they capture specific, measurable causes of CMV, and produce conclusions that are similar to those obtained by directly controlling for those causes or by using an alternative technique.
Together these studies capitalize on secondary and primary data to investigate the properties of and conclusions drawn from multiple marker variables relative to one another and other ways of identifying CMV (e.g., measuring presumed CMV causes). In this way, we extend understanding of how actual markers that scholars have or might utilize influence the conclusions drawn about CMV, both in terms of the broader body of method variance knowledge as well as for any individual research effort. Prior to presenting the two studies, we outline the history and conceptual underpinnings of marker variable approaches to CMV detection. We conclude by discussing nuances associated with marker variable selection that are suggested by our findings but that have not been presented in previous work. In this regard, we expand the set of conditions scholars should consider when determining whether to employ a marker technique over other alternatives for capturing and detecting CMV and how best to do so.
Marker Variable Approaches and “Ideal” Versus “Nonideal” Markers
Whereas there have been conceptual criticisms of marker variable techniques (e.g., Podsakoff et al., 2003), few published studies empirically investigate their effectiveness. Among these, Richardson et al. (2009) present a data simulation that examines the ability of different post hoc statistical techniques to detect CMV in data. Because their study indicates that the correlational marker technique performs poorly, they advise against its use. Alternatively, the confirmatory factor analysis (CFA) marker technique demonstrates reasonable ability to detect the presence of CMV, leading Richardson et al. (2009) to write, “We do, however, suggest the CFA marker technique can be applied with an appropriate marker variable to test for the presence of CMV” (p. 796). While these authors caution that their simulation indicates that none of the tested post hoc techniques satisfactorily detects CMV bias or produces more accurate correlations, they nonetheless conclude, “The CFA marker approach can contribute to making more informed judgments when it is used as intended (i.e., with an ideal marker)” (p. 795). L. J. Williams et al. (2010) also support the use of the CFA marker test, yet argue that it can be used for correcting method bias in addition to detecting CMV.
Lindell and Whitney (2001) were the first to describe use of a marker variable to detect and remove method variance in same-source cross-sectional data. They proposed that if observed relationships among variables measured using the same method are affected by noncongeneric (i.e., equal) CMV, this variance can be identified and partialled out by using a proxy (i.e., marker) for method variance. That is, if there is no theoretical reason for expecting a marker to be related to at least one other study variable, the amount of CMV present in data is embodied in the extent to which the absolute observed correlation between the marker and the theoretically unrelated variable departs from 0.00. L. J. Williams et al. (2010) extended Lindell and Whitney’s work to apply marker variables within the context of CFA. Unlike the correlational approach, the CFA marker technique accounts for method effects that either equally or unequally affect study variables (i.e., are noncongeneric or congeneric, respectively), as well as for unreliability due to measurement error. The CFA-based approach, however, requires that the marker be theoretically unrelated to all substantive variables with which it is modeled (Richardson et al., 2009).
Based on this logic, an effective marker should share negligible or no substantively meaningful variance with the variables suspected of CMV bias. Although Lindell and Whitney (2001) indicate that a marker can be chosen post hoc from existing study variables by selecting the one with the smallest observed correlation with those variables, they also write, “The best way is for the researcher to include a scale that is theoretically unrelated to at least one other scale in the questionnaire, so there is an a priori justification for predicting a zero correlation” (p. 115). This recommendation is made because markers do not directly measure CMV, but rather are proxies for it. Thus, without a defensible, a priori assumption of no substantive relationship between a marker and other variables, one has no conceptual basis for concluding that observed marker relationships are a function of CMV instead of true relations. In contrast, if no true association exists, any observed relationship is inferred to result from CMV inflation. While CMV can deflate correlations (L. J. Williams & Brown, 1994), the prevailing concern with CMV is that it produces Type I error, and marker variables are anticipated to capture CMV inflation.
Another important criterion for a useful marker is that responding to its items elicits similar cognitive processes or response tendencies as those prompted by substantive items, thereby making it prone to the same CMV causes. Lindell and Whitney (2001, p. 118) advise the use of “one or more multiple marker variables that are designed to estimate the effect of CMV by being more similar to the criterion in terms of semantic content, close proximity, small number of items, novelty of content, and narrowness of definition (Harrison, McLaughlin, & Coalter, 1996).” Thus, if study items require perceptual, subjective responses, the marker should as well. A marker might also elicit comparable response processes and tendencies (e.g., [dis]acquiescence; Podsakoff et al., 2003) when its items share the same format (e.g., the same Likert-type scale) as substantive items (L. J. Williams et al., 2010).
Richardson et al. (2009) refer to markers meeting all of these criteria (chosen a priori, theoretically unrelated to substantive variables, but similar to them in content and format) as “ideal.” Furthermore, their simulation indicates that the accuracy of CMV detection dramatically improves when the CFA approach is applied with a theoretically unrelated marker that is biased by CMV at the same levels as are substantive variables. Yet, research rarely explicitly specifies which variables are irrelevant to a given theory, and the absence of sufficiently developed CMV theory does not allow for strong predictions about when variables will be affected by the same method causes (Schmitt, 1994). Thus, identifying ideal markers can be difficult (Richardson et al., 2009; L. J. Williams et al., 2010), and authors might make unintentionally poor marker choices.
Extending Richardson et al. (2009), nonideal marker variables can be categorized into two groups. First are those that are similar to substantive variables in content and format (and presumably distorted by the same CMV causes) but theoretically related to them—for example, a post hoc marker that has conceptually identifiable substantive associations with variables of interest. The danger associated with this nonideal marker is its inability to distinguish between substantive and method variance, which may lead researchers to conclude that CMV exists when it does not. The other type of nonideal marker is dissimilar to substantive variables in content and format, regardless of the theoretical relationships with them. Examples of this second type of marker are respondent age and gender. The risk associated with these types of markers is that CMV should only negligibly influence recall and reporting of comparatively objective or autobiographical details (Chan, 2009; Podsakoff et al., 2003; Spector, 2006), and applying such a marker likely provides little information about CMV. Furthermore, if these variables are theoretically related to the substantive variables, their use could identify CMV when it is not actually present.
Building on the recommendations of Lindell and Whitney (2001), Richardson et al. (2009), and L. J. Williams et al. (2010), we offer six initial best practices for marker approaches. The first three regard basic reporting, which allows readers to judge the quality of marker variables and analyses. The second set encourages authors to more deeply justify their marker variable choices. First, authors should explicitly name and describe their marker, including response-scale format or other measurement properties that make it similar to substantive study variables, as this is fundamental for readers to infer whether the marker is a plausible proxy for CMV. Second, the marker should be reported in the study correlation matrix so that the magnitude of its relations with other variables can be assessed. Third, authors should identify the marker technique (correlational or CFA) implemented, so that readers can judge results with the potential accuracy of a given technique in mind. Fourth, authors should describe why no theoretical relationship between the marker and other study variables is expected—preferably with theoretically based arguments or, at a minimum, with citations from prior research. Fifth, authors should discuss the marker’s theoretical content and susceptibility to CMV relative to other study variables. In other words, authors should detail why the marker was chosen and indicate which types of bias they believe it captures. Finally, authors should report whether the marker was chosen a priori. While a marker selected post hoc can be ideal, purposely choosing one before data collection indicates forethought regarding its substantive unrelatedness and the types of CMV it may represent.
For this second set of criteria to be practically feasible, however, empirical evidence regarding how potential markers relate to commonly measured substantive variables, how such markers relate to measurable causes of method variance, and the kinds of conceptual arguments that might be marshaled to support claims of idealness is needed. Such evidence could come from the body of extant research that has used a marker variable approach, or it can come from primary studies designed for this purpose. Study 1 of the present article, therefore, explores marker use and associated conclusions as reported in published and unpublished research. In turn, Study 2 tests several prospective markers that have been used in prior research or that have the potential for broad application, considering both their conceptual suitability in various contexts and the extent to which they represent variance due to multiple measured CMV causes.
Study 1: Review of Published and Unpublished Research Using Marker Variables
Collectively, the body of research using marker variable approaches can contribute to understanding of the practical application of markers, the properties of markers that researchers position as ideal, and the arguments used to support claims of idealness in ways that single studies and data simulation cannot. Assuming the six best practices for marker variable choice, use, and reporting are heeded, this literature also has the potential to enhance knowledge about the prevalence of CMV in real data. Although prior research has summarized some studies using marker variables (e.g., Richardson et al., 2009; L. J. Williams et al., 2010), no comprehensive review of literature employing marker techniques has been conducted. Furthermore, with the publication of the above articles, use of marker techniques may have substantially changed. Therefore, in Study 1, we reviewed research conducted between 2001 and 2012 purporting to use either the correlational or CFA marker technique, coded it for a variety of characteristics, and used the results to form a holistic picture of marker-based approaches as they are used in practice and to extend broader knowledge about CMV in general.
Method
We used Web of Science to identify articles citing Lindell and Whitney (2001), Richardson et al. (2009), and L. J. Williams et al. (2010), as we believed these three articles to be the ones most likely referenced by authors utilizing a marker variable. The search encompassed the time period from the date of publication of the earliest of these articles—Lindell and Whitney (2001)—to December 2012, and it yielded 598 publications. Of these, we removed 46 because they were nonempirical, not in English, conference papers, books or book chapters, meta-analyses, or works that primarily addressed methodological issues. Articles were coded on a number of dimensions (detailed below), including if a marker was used, whether authors chose ideal markers and how they justified their choices, the marker variable analyses used (e.g., a CFA marker analysis), and the conclusions authors drew from their analyses (i.e., evidence of CMV found or models changed due to CMV). If the marker used was explicitly identified, we recorded its name and whether it appeared in the correlation matrix. We also coded measurement of any explicit CMV causes (e.g., negative affectivity). All coding was conducted by the first and second authors of the present study. To establish consistency, these authors first jointly coded 20 randomly chosen manuscripts, then independently coded an additional 20 articles (only 15 of which were determined to have used a marker variable) and found an initial agreement level of 80.20%. After resolving the discrepancies in coding through discussion, the two authors coded the remaining articles independently. All remaining disagreements in coding were resolved through discussion between these authors.
This initial search and coding process produced 366 articles that used a marker variable. Of these, four also measured a presumed cause of CMV, and an additional six measured only a presumed cause of CMV. While this initial set of articles is large and informative, we conducted an additional search for publications citing Podsakoff et al. (2003). Although Podsakoff et al. do not recommend use of a marker technique, their article has been cited for a variety of approaches to address CMV, including measuring presumed causes of CMV. We restricted the Podsakoff et al. cited reference search from date of publication (2003) to the end date of the prior search (2012). After eliminating articles already included in the initial sample, we identified 3,857 articles, eight of which could not be obtained. The current authors then divided this sample and performed a preliminary electronic or hand search based on a list of terms and references intended to ascertain use of a marker variable or a measured CMV cause (available on request from the first author). Using the removal criteria described previously, we eliminated 365 articles from the sample. Of the remaining articles, 294 were classified as possibly using a marker variable or measuring a presumed CMV cause, thereby requiring additional coding. The first and second authors coded each of these 294 articles independently, then resolved discrepancies through discussion. After completing the full coding process, the two search procedures resulted in a final total of 398 published articles that employed a marker variable.
Because manuscripts that use a marker and find high levels of CMV may be less likely to be published, a final search was conducted to identify unpublished research implementing a marker technique. ProQuest Digital Dissertations database was used to search for the word “marker” appearing anywhere in the text of included dissertations and one of the four key citations listed above. We also solicited unpublished manuscripts by posting requests on scholarly listservs in multiple disciplines in which organizational research is conducted. The ProQuest search produced 139 full-text dissertations, 1 48 of which used a marker. Seven dissertations were removed from this sample because they had been published, resulting in a final sample of 41 dissertations. Surprisingly, the listserv requests produced only four responses, none of which identified manuscripts that used a marker variable or measured cause of CMV. The sampled dissertations were coded on the same criteria as the published articles.
Results
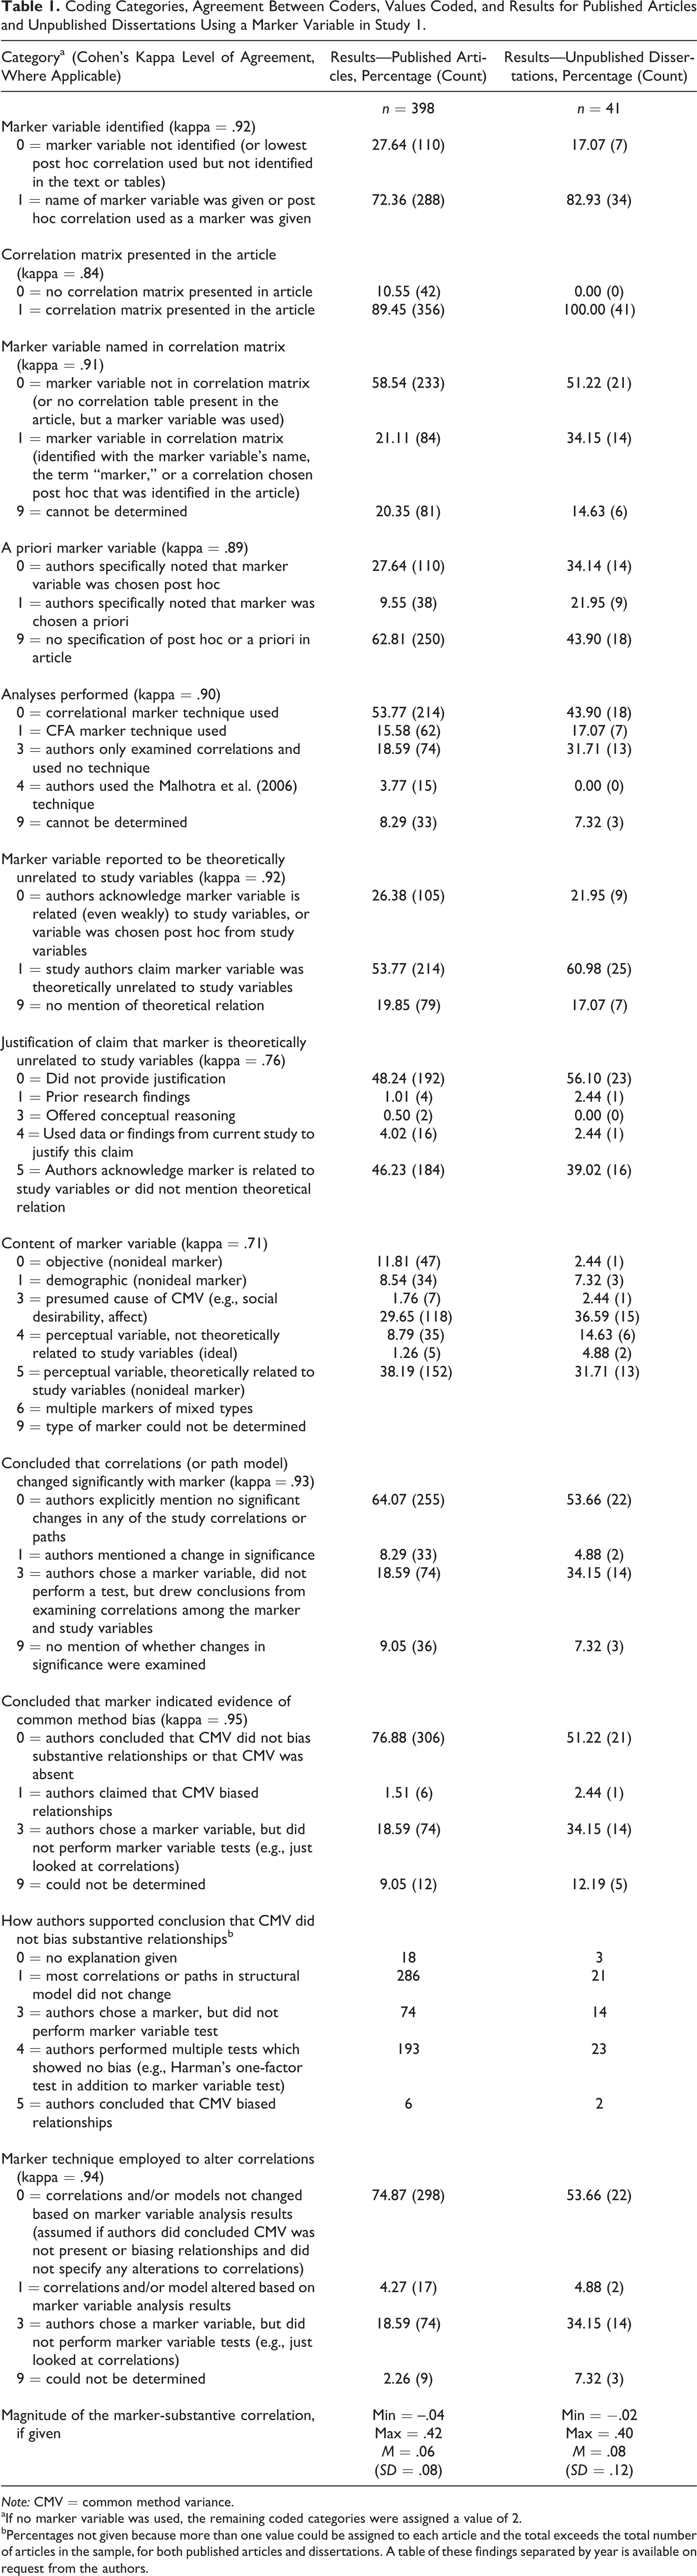
Coding categories and values, level of coder agreement, and coding results for these 398 published articles and 41 unpublished dissertations are presented in Table 1. Although these results are collapsed across time, a few notable trends in year of publication are discussed with other results below. Because so few of the identified studies explicitly measured a presumed cause of CMV, detailed coding of these variables is not contained in Table 1, but instead is included in the summary of results below. Table 1 shows that most published articles (288, 72.36%) and dissertations (34, 80.95%) specified the marker’s name or the names of variables chosen post hoc. Among published articles, about one-fifth (84, 21.11%) include the marker in the correlation matrix, and 43.90% (18) of the dissertations do so. The vast majority of all published articles and dissertations either employ a post hoc marker (published: 110, 27.64%; dissertations: 14, 34.15%) or do not specify whether the marker was selected a priori or post hoc (published: 250, 62.81%; dissertations: 18, 43.90%). Only 15.58% (62) of articles employ the CFA marker technique, but its use grew over time. This technique was used in 27 articles published in 2012, in 12 articles in 2011, in eight articles in 2010, in seven articles in 2009, and in two or fewer articles in prior years. Dissertations used the CFA technique slightly more frequently (7, 17.07%), a finding that may partially result from the unavailability of dissertations prior to 2008. The predominant use of the correlational technique over CFA is likely due in part to the former being introduced several years earlier and because published empirical criticisms of the technique did not appear until after some of the article publication dates.
Coding Categories, Agreement Between Coders, Values Coded, and Results for Published Articles and Unpublished Dissertations Using a Marker Variable in Study 1.
Note: CMV = common method variance.
aIf no marker variable was used, the remaining coded categories were assigned a value of 2.
bPercentages not given because more than one value could be assigned to each article and the total exceeds the total number of articles in the sample, for both published articles and dissertations. A table of these findings separated by year is available on request from the authors.
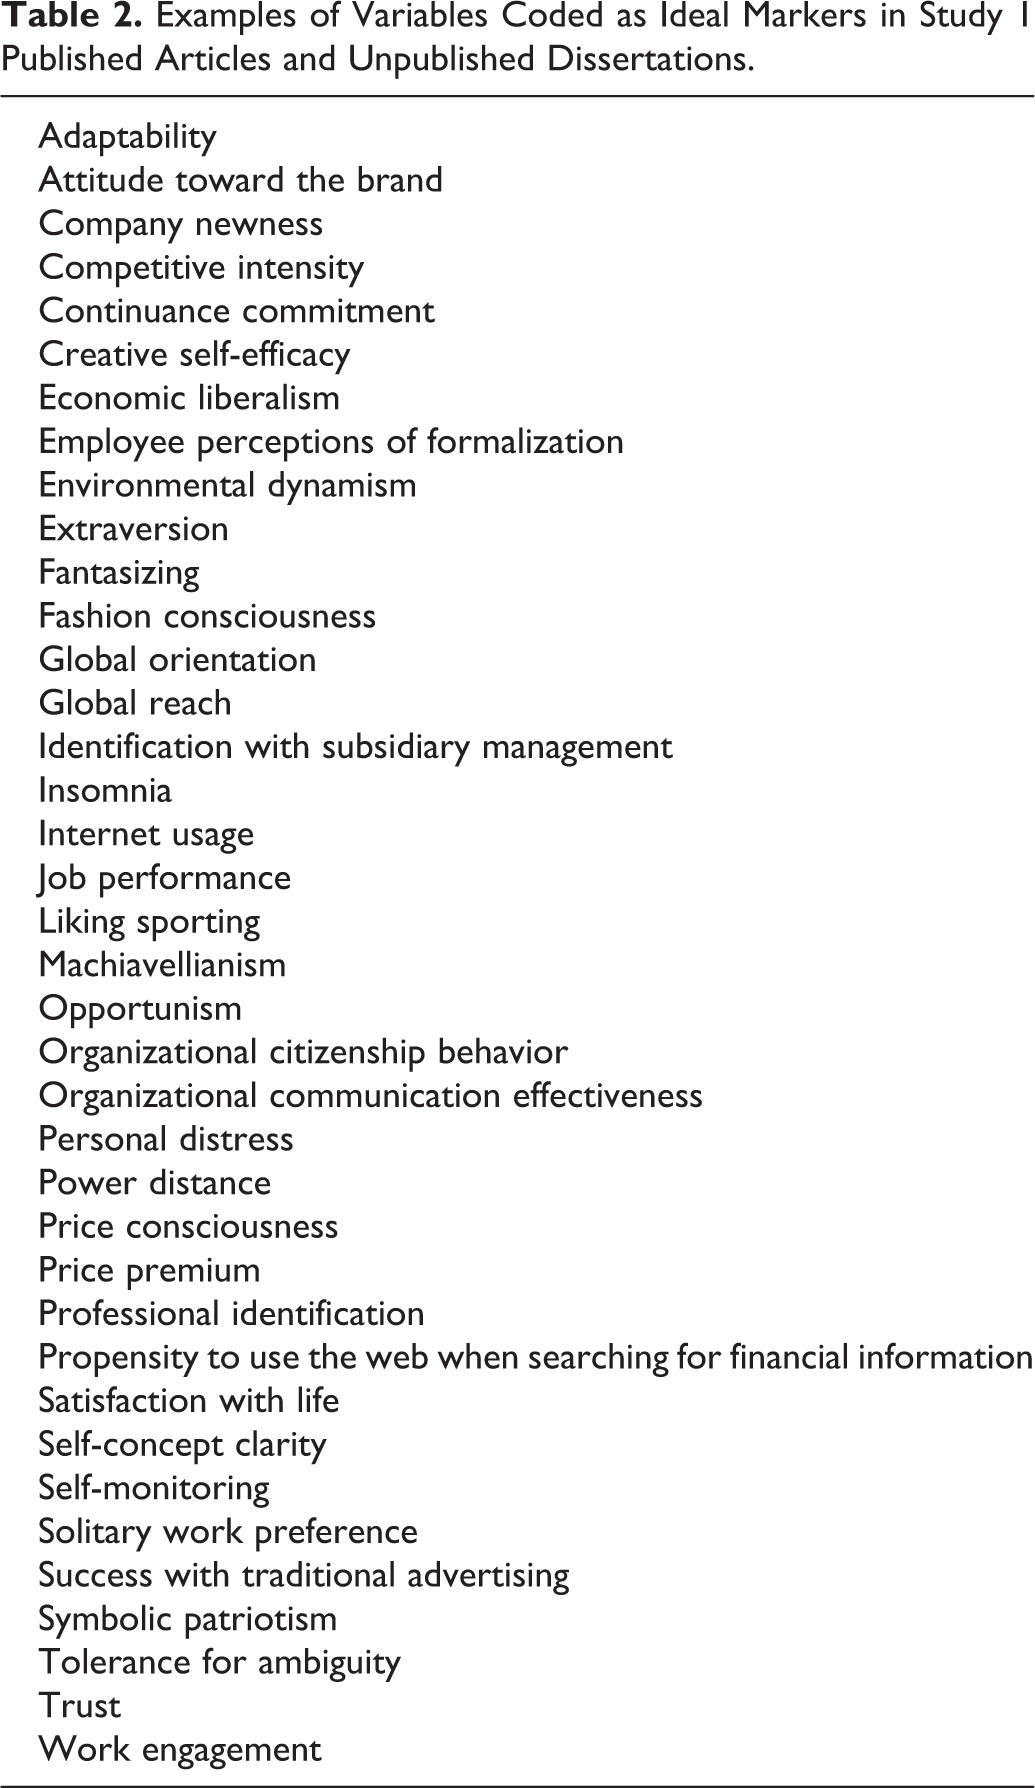
As previously noted, a key characteristic of an ideal marker is that it is theoretically unrelated to other study variables, but similar to them in content and format such that it might be equivalently vulnerable to the same causes of CMV. We codified these features in multiple ways. First, we considered whether authors explicitly stated their markers were theoretically unrelated, and for those claiming unrelatedness, we also coded the justification offered (if any). Second, as a broad means of ascertaining susceptibility to similar causes of CMV, we coded marker variable content (e.g., perceptual/subjective, demographic) in those studies naming the marker used and providing sufficient information (published n = 246, dissertation n = 28). 2 Combining these two ratings, we further classified markers as objective nonideal, demographic nonideal, perceptual/subjective ideal, or perceptual/subjective nonideal. Because objective and demographic variables are conceptually less likely than perceptual/subjective variables to reflect CMV causes like affective responding or (dis)acquiescence, we treated these variables as nonideal, even if authors claimed unrelatedness. Perceptual/subjective variables were coded as ideal if authors claimed theoretical unrelatedness; they were coded as nonideal if unrelatedness was not claimed (or could not be determined) or authors acknowledged the potential for theoretical relations. Finally, for those studies found to use an ideal marker, we coded marker format in terms of whether the marker was on the same response scale as at least one substantive study variable (not in Table 1, but reported in the text below). Some examples of identified ideal marker variables are listed in Table 2.
Examples of Variables Coded as Ideal Markers in Study 1 Published Articles and Unpublished Dissertations.
According to Table 1, slightly more than half of all published articles (214, 53.77%) and dissertations (25, 60.98%) expressly claimed use of a theoretically unrelated marker. Within this subset, a small number (published = 16, dissertation = 2) justified the claim of unrelatedness by referring to a small or nonsignificant correlation in their data. An even smaller number cited prior research findings (published = 4, dissertation = 1) or offered conceptual, theoretically based reasoning (published = 2, dissertation = 1). Importantly, most of the published articles and dissertations claiming unrelatedness provided no information beyond simply stating this claim (published = 192 of 214, 89.72%; dissertation = 23 of 25, 92%). Among studies not classified in any of the preceding categories, a nontrivial number (published = 79, 19.85%; dissertation = 7, 17.07%), made no statement regarding marker unrelatedness.
Summarizing only the 246 published articles and 28 dissertations that both named the marker used and for which content coding was possible, the modal marker category was perceptual/subjective ideal (published = 118, 48.18%; dissertation = 15, 53.57%). Although not reported in a table, we found that 9.35% (23) of published articles and 50.00% (14) of dissertations reported using a marker that was both perceptual/subjective ideal and with response options that were equivalent in number and anchors to at least one other study variable. Dissertations using an ideal marker generally gave information about response options and anchors for marker variables, while published articles did not. Although the number of studies utilizing an ideal marker (published = 117, dissertations = 15) is promising, we judged a surprising number of markers as nonideal objective (published = 47, 19.11%; dissertation = 1, 3.57%) or nonideal demographic (published = 34, 13.82%; dissertation = 2, 7.14%). Several studies employed perceptual/subjective markers that they acknowledged as potentially substantively related to other study variables (published = 35, 14.23%; dissertation = 6, 21.43%). Five published articles and two dissertations employed multiple markers. Table 3 presents the type of marker variable used by year in published articles (excluding 2001-2004, for which there was not a large enough sample size to draw meaningful conclusions). Except for increased ideal marker use in 2011 and 2012, there are no other notable trends, and nonideal marker use and lack of reporting remain prevalent.
Percentage Frequency of Type of Marker Variables From Published Articles and Dissertations in Study 1 Listed by Year.
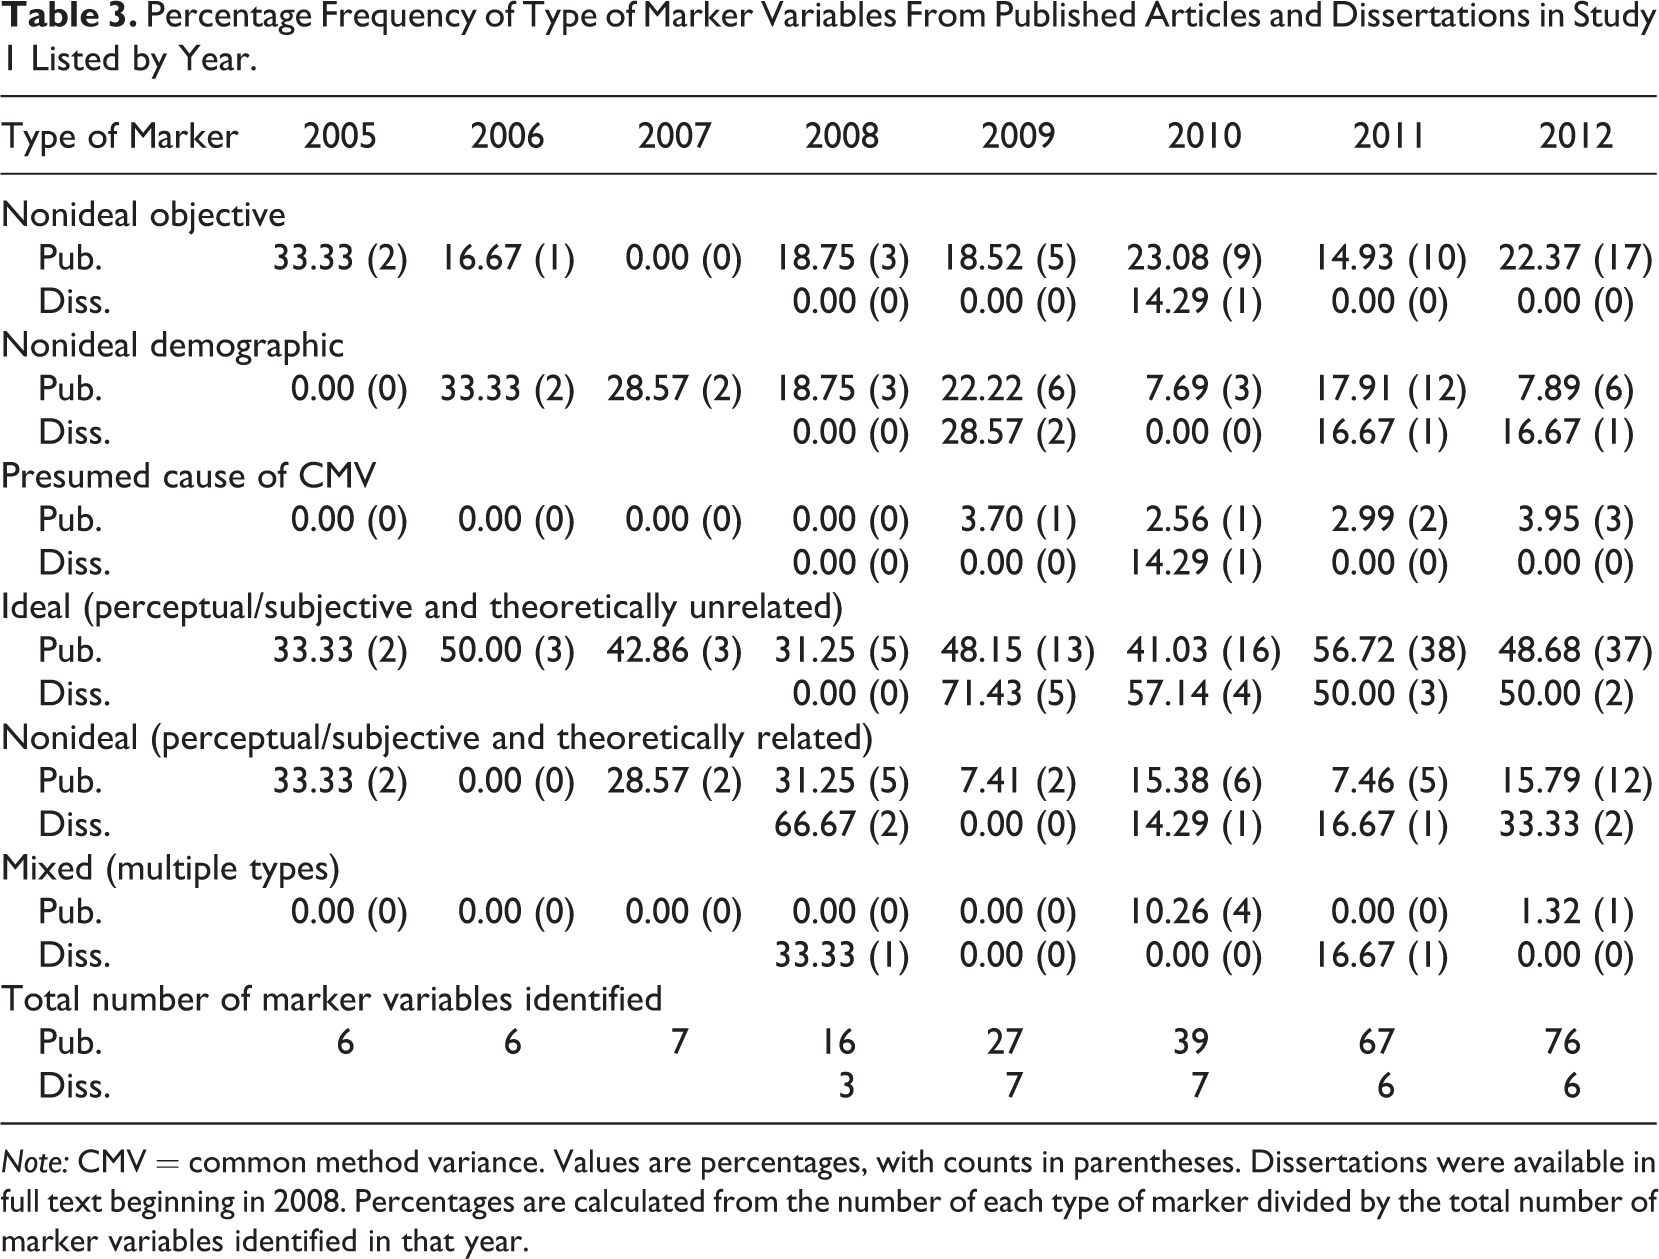
Note: CMV = common method variance. Values are percentages, with counts in parentheses. Dissertations were available in full text beginning in 2008. Percentages are calculated from the number of each type of marker divided by the total number of marker variables identified in that year.
Table 1 also indicates the conclusions made by authors after employing a marker technique. Specifically, we coded whether authors indicated that correlations or path models changed significantly when the marker was applied, whether they concluded that CMV biased data, and whether they relied on correlations or paths that were altered to correct for CMV when drawing conclusions about the magnitude or significance of relationships among study variables. Table 1 indicates that, overall, most authors did not believe CMV to be present or biasing and, thus, they did not “correct” relationships because of it. Authors most often cited the lack of change in correlations or paths in a structural model as support for their claim that bias was absent. Because, however, the efficacy of marker techniques depends on use of an ideal marker and because evidence indicates the correlational approach is ineffective at CMV detection (Richardson et al., 2009), these findings must be treated cautiously.
In the 32 published articles and five dissertations utilizing an ideal marker and the CFA approach, only four and one, respectively, concluded that CMV was present in their data, and only two and one, respectively, claim that CMV biased data. Examining these findings more closely reveals that in cases employing an objective or demographic marker, none detected any CMV—possibly, as we suspect, because demographic and objective variables are relatively less vulnerable to influence from CMV. More frequently (in absolute terms) than was the case for any other marker type, using a perceptual/subjective ideal marker yielded the conclusion that relationships changed—a finding that would be expected if CMV exists in data and such markers truly are more likely to function as proxies for it. One of the five published articles using a nonideal, theoretically related perceptual marker detected CMV, but this finding could result from the marker identifying substantive, rather than method, variance. Although only two of the published articles and one of the dissertations using the CFA technique with an ideal marker claimed to identify CMV bias, five published articles presented results with the marker variable modeled in structural analyses.
Table 1 indicates the average size of correlation between the marker variable and substantive variable, when reported (ranging from –.04 to .42). 3 We further investigated the magnitude of correlation based on the type of marker variable used (combining the sample of published articles and dissertations). The average reported correlation between a nonideal objective or demographic marker variable and substantive variables was .06 (SD = .07, range = –.02 to .30). The average correlation between a nonideal perceptual, theoretically related marker variable and substantive variable was .10 (SD = .13, range = –.07 to .42). The difference in magnitude between the average correlations is likely because the former type of marker is less vulnerable to the same causes of CMV as substantive study variables and because the latter type of marker shares substantive variance with other study variables. The lowest average marker-substantive correlations (M = .04, SD = .05, range = –.04 to .19) reported were for ideal marker variables that were perceptual and not theoretically related to study variables. Thirty-eight of the marker variable-substantive correlations (of 139 given) were .01 or lower.
Finally, although a marker might be presumed ideal, its ultimate utility stems from whether it truly is a proxy for a presumed cause of CMV, such as social desirability, affectivity, or a response style (e.g., acquiescent or disacquiescent responding). As such, we coded the total published articles and dissertations identified via the cited reference searches for use of a measured CMV cause. To be coded as using such a variable, a study had to clearly indicate that the variable was included to assess method variance. Therefore, articles that included a measure for substantive reasons only, while citing one of the four key marker references (i.e., Lindell & Whitney, 2001; Podsakoff et al., 2003; Richardson et al., 2009; L. J. Williams et al., 2010) for other reasons, were not treated as measuring a CMV cause. We identified 113 published articles and no dissertations that measured one or more potential CMV causes. Four of these articles also used a marker, and are included in Table 1 results. For these studies, we recorded the CMV-cause variable(s) measured and conclusions about relationships to substantive variables.
Affectivity was the most commonly measured CMV cause (positive affectivity or PA, negative affectivity or NA, or both; 70; 61.95%). Social desirability was measured in 28 (24.78%) articles. Eight (7.08%) measured acquiescence, and seven (6.19%) measured multiple CMV causes. The articles capturing acquiescence do not do so by measuring it directly, but rather by evaluating positively and negatively worded items. In the 79 studies that included the measured CMV cause in the correlation matrix, the average magnitude of correlation with other study variables is .21 (SD = .15) for affectivity and .15 (SD = .13) for social desirability. These correlations are notably higher than those between marker and substantive variables reported in Table 1 (M = .08, SD = .119). This discrepancy, however, likely results from authors specifically choosing a post hoc marker with the lowest observed correlation in their data.
Surprisingly, in the sample of articles measuring a CMV-cause variable, 47 (41.59%) gave no further information on the measured CMV variable aside from mentioning its inclusion to address CMV. When a conclusion was drawn, it was often that the CMV cause was not significantly related to study variables (38, 33.63%). In 28 cases (24.78%), authors concluded the presumed cause of CMV was related to substantive variables (although they did not necessarily attribute such relationships to method variance). Notably, in 6 (5.31%) of the articles, the measured cause was concurrently positioned as both a substantive variable (i.e., an independent variable, mediator, or moderator) and as a CMV cause, which likely confuses interpretation of method effects versus substantive effects.
Discussion
Study 1 produced four primary findings. First, our review reveals that marker techniques are undeniably popular vehicles for detecting CMV and alleviating concerns about it, but to date, only a small number of studies implement the potentially more accurate CFA approach. Yet, because most articles offer little more information than the name of the marker used (and some do not provide that), it is impossible to evaluate the degree to which the markers used in these studies met the key criteria of theoretical unrelatedness and susceptibility to CMV. For instance, of the studies in our review that used the CFA marker approach (62), only about half (32) used a marker that we judged to be ideal. Although we observed no clear trends suggesting that marker selection and reporting have improved by year, we nonetheless note that those applying the more recently introduced CFA approach were more likely than others to report the type of marker used and to use one that we consider ideal.
The second finding concerns the justifications offered by authors for selecting a given marker. Because authors cannot know in advance whether variables share true and method variance, some conceptual rationale is necessary to compellingly position a marker as a theoretically unrelated proxy for particular method effects and to reduce the possibility of capitalizing on chance when drawing conclusions about the presence or absence of CMV. Yet, authors expressly reported choosing a priori markers in only 9.55% of all published articles reviewed. Perhaps even more troubling, only .50% of published articles and no dissertations presented conceptual, theoretically grounded arguments for marker unrelatedness or susceptibility to CMV. As can be seen in Table 2, many of the marker variables used could be theoretically unrelated to a number of substantive variables, depending on the aim and scope of the study in which they are used. In the few studies measuring a CMV cause, the information included was typically insufficient for inferring whether markers or substantive variables share variance with, and thus might reflect, a given method effect.
These first two findings have important implications for the third, which concerns the conclusions drawn from the application of marker techniques. Overwhelmingly, authors concluded that neither CMV nor bias was present in their data after using a marker approach; that is, observed relationships changed little after removing variance associated with the marker. Based on the consistency of these findings in such a large body of research, it is tempting to deduce that CMV simply is not a problem in most data and across many disciplines. The conclusions drawn by authors, however, cannot necessarily be taken at face value. As described, it is common to employ markers that are unlikely to be susceptible to CMV (e.g., objective or demographic variables) and, thus should have little capability to identify CMV in observed relationships. In many more cases, the information given about the marker was so trivial that results from its application must be treated as tentative at best and suspect at worst.
Rather than suggesting that CMV truly does not exist in typical data, the results could be interpreted as evidence of publication or reporting bias for research that finds evidence of CMV. Yet, just as the data do not allow strong conclusions about the true occurrence of CMV, neither do they allow robust inferences about the potential for publication/reporting bias. On one hand, the data from unpublished dissertations suggest they are no more likely than published research to find evidence of CMV. On the other hand, requests for other unpublished studies employing a marker technique produced almost no response, which could mean one of several things: (a) a CMV publication bias does not exist, (b) the potential for CMV is so stigmatizing that authors are reluctant to admit they have data—even unpublished data—that are influenced by it (in which case reporting bias might be prevalent), or (c) authors remain most likely to only perform post hoc marker analyses and at the behest of reviewers. Although we cannot answer this question—and all three possibilities are plausible—the latter is consistent with the extremely small number of studies unambiguously reporting use of an a priori marker.
Our goal, though, is not to simply critique what has been done, but to provide guidance by extending knowledge about useful marker application. We thus turn to an empirical investigation of ideal marker variables, nonideal marker variables, and measured presumed causes of CMV.
Study 2: Empirical Investigation of Ideal and Nonideal Marker Variables
Whereas prior research suggests the efficacy of the CFA marker technique depends on the marker used—its relationships with substantive variables and its susceptibility to CMV (Richardson et al., 2009; L. J. Williams et al., 2010)—Study 1 demonstrates substantial variability in the marker variables implemented and insufficient operationalization of marker techniques in extant research. Study 1 further highlights how little is known about the extent to which any marker represents CMV and, if so, what types of CMV it reflects. In fact, given limited theory about CMV (Schmitt, 1994; Siemsen, Roth, & Olivera, 2010) and divergent prior reports about its effects (e.g., see, Cote & Buckley, 1987; Crampton & Wagner, 1994; Spector, 1987; L. J. Williams, Cote, & Buckley, 1989), it is difficult for scholars to have any more a priori certainty about the nature and amount of CMV content in their chosen markers than they do about the influence of CMV on the substantive variables to which the marker technique is applied.
As use of the CFA technique grows, it is constructive to establish empirical evidence regarding whether a variety of markers reflects proposed CMV causes. It is likewise beneficial to further understand the prospect of concluding that CMV is present or absent in the event that a researcher inadvertently selects a marker that has substantive relationships with other study variables or that is not reflective of CMV. As a step in this direction, Study 2 examines in two samples the degree to which seven prospective markers reflect variance due to measurable causes of CMV. In turn, each of these markers is used to implement the CFA technique and compare the conclusions drawn to those from alternative analyses that, rather than markers, employ variables intended to explicitly operationalize possible CMV causes. We begin by describing the marker variables considered in this study, highlighting the contexts in which they might be appropriate for use as well as situations in which their utility might be limited.
Marker Variables Examined
We draw from research aimed at investigating marker techniques and published research employing an ideal marker with the CFA approach to identify three markers previously proposed as ideal: (a) perceptions of benefits administration, (b) creative self-efficacy (creative efficacy), and (c) use of the web for seeking financial information (web use). We also consider attitude toward the color blue (blue attitude) as a fourth prospective ideal marker. As far as we are aware, this is the only existing variable purposely developed for use as a marker. Because tenure was the most frequently reported demographic marker discovered in Study 1, we examine it as an example of a presumably nonideal objective marker. In Sample 2 we also consider cognitive trust in one’s supervisor (cognitive trust) as a perceptual/subjective nonideal marker. Although no publication reviewed in Study 1 uses cognitive trust as a marker, we treat it as an example of the kind of variable that might be selected as a post hoc, theoretically related, marker.
Prospective Ideal Markers
Benefits administration is the marker used by L. J. Williams et al. (2010) to demonstrate the CFA technique. This measure assesses perceptions that benefits have been explained and employee needs were taken into account during planning. If variables that are similar in semantic content are more likely to be susceptible to the same causes of CMV (Harrison et al., 1996), benefits administration would be a useful marker in studies assessing elements of the work context (e.g., those included in L. J. Williams et al., 2010: leader-member exchange or LMX, job complexity, and role ambiguity). Benefits administration might not be theoretically unrelated, however, in studies about justice or compensation. For instance, whereas most items focus on knowledge about benefits, those addressing the benefits determination process or the consideration given to employee needs might substantively overlap with measures of justice. Furthermore, compensation-related variables can produce spurious relationships between job characteristics and affective outcomes because the nature of one’s job usually correlates with formal rewards derived from it (Spector, Fox, & Van Katwyk, 1999).
Creative efficacy, or the belief that one can produce creative outcomes (Tierney & Farmer, 2002), is used as a marker by Yang, Mossholder, and Peng (2009) in their study of supervisory procedural justice and trust in one’s supervisor. Not only do they apply a marker technique to substantive relationships among variables that receive a great deal of scholarly attention, but they are some of the only authors from Study 1 to state their marker is ideal and explicitly reference the criteria laid out by Lindell and Whitney (2001). As perceptual variables that must be self-rated, it is possible that creative efficacy, justice, and affective trust are susceptible to similar causes of CMV. Yet because of creative efficacy’s proposed relationships with other variables, it might be nonideal in studies of job complexity, performance, and possibly even supervisory justice (i.e., because it has been theoretically linked to other perceptions of supervisory behaviors toward a rating subordinate; see Tierney & Farmer, 2002).
Web use, which gauges the frequency with which one uses the web to search for financial information and services, was used by Hansen (2012) to study consumer trust, satisfaction, and loyalty, and he explicitly described it as theoretically unrelated to these variables. Because web use is taken from the marketing literature and concerns a behavior not typically relevant to management theories, it could be theoretically unrelated to many management variables. As a measure of a rater’s own behavior, its semantic content could make it susceptible to the same causes of CMV as other self-rated behavioral measures (e.g., performance or citizenship) for which respondents might want to present a positive impression. Yet, perhaps because they are less affectively charged, some research has found measures of performance to be relatively unsusceptible to CMV (Cote & Buckley, 1987; L. J. Williams et al., 1989), and thus web use could be less helpful in studies of attitudes and nonbehavioral perceptions.
Deliberately developed for use as a marker (Miller & Chiodo, 2008), blue attitude is conceptually similar to a marker used by Johnson, Rosen, and Djurdjevic (2011; satisfaction with neutral objects). Attitudes are among the most commonly measured variables in management research, and they are also frequently criticized as vulnerable to CMV (Podsakoff et al., 2003). In this regard, the affective and evaluative elements inherent in the blue attitude items might elicit response processes similar to those required in replying to other attitudinal measures, and thus, make this marker similarly susceptible to CMV (Chan, 2009). For example, because items require affective evaluation (e.g., “I like the color blue”), people who are predisposed to endorse positively worded items or who are positively affectively disposed might respond in ways that are independent of item content or their actual standing on the items. Nonetheless, the theoretical unrelatedness of blue attitude cannot be universally assumed. Although we are aware of no management theories about color, this construct could substantively overlap with affective disposition, a stable personality trait shown to relate to variables such as job satisfaction and turnover (Judge, 1993) and measured by asking respondents to report their satisfaction with a series of purportedly neutral objects (e.g., public transportation; Weitz, 1952).
Prospective Nonideal Markers
Study 1 authors often chose nonideal markers that were either (a) of different content or format relative to other study variables and unlikely to be influenced by CMV (e.g., objective or demographic variables) or (b) of similar content and format but possibly related to other study variables. In all, 81 publications in Study 1 reported using a demographic or objective marker. Of these, 15 (18.5%) used job or organizational tenure. Because recall of autobiographical information is enriched when bounded by a temporal reference point (e.g., beginning or ending; J. A. Robinson, 1986), the semantic content of and response processes required by questions about tenure are likely different from those prompted by temporally ambiguous or affectively charged items. Furthermore, questions about tenure are often formatted differently than perceptual questions. Respondents might, for instance, enter their first year of employment or the number of years in their jobs, rather than select from a set of predetermined Likert-type options. It therefore seems unlikely that questions about tenure would be highly susceptible to dispositional CMV causes or stable response tendencies.
Yang et al. (2009) define cognitive trust as employee perceptions of a supervisor’s competence, reliability, and predictability. These authors position cognitive trust as a mediator among variables assessing additional perceptions about the supervisor, and they place all responses on the same 5-point agree/disagree Likert-type scale, making cognitive trust and these variables similar in semantic content and format. Logically, however, cognitive trust should be substantively related to these variables. As such, cognitive trust appears to have much in common with the typical post hoc perceptual/subjective marker identified in Study 1. That is, although it might be similarly vulnerable to the same CMV causes as other variables, it would be unusual for researchers to collect data on a variable (other than an a priori marker) that they do not expect to be related to study variables, unless collecting data for multiple, diverse studies.
Measured Causes of CMV
As evidenced by the interest in post hoc statistical detection techniques, there is no single mechanism by which researchers can unequivocally identify all possible CMV in their data. There are, however, at least three purported sources of CMV for which measurement approaches exist: (a) affectivity, (b) social desirability, and (c) response styles. Review of the articles in Study 1 also reveals the first two are among the most commonly measured causes of CMV in published work employing a marker technique. To the extent that a marker shares nonsubstantive variance with such measures, it can be said to be biased by these CMV causes. Returning to a fundamental argument found in marker variable research (i.e., Lindell & Whitney, 2001; Podsakoff et al., 2003; Richardson et al., 2009; L. J. Williams et al., 2010), a given marker or set of markers will be efficacious when they and substantive variables are similarly susceptible to the same causes of CMV. In the present study, a marker should have greater utility when it and substantive variables share significant variance with the same measured CMV causes.
As perhaps the most frequently referenced potential causes of CMV (see, e.g., Brannick, Chan, Conway, Lance, & Spector, 2010; Podsakoff et al., 2003; Podsakoff, MacKenzie, & Podsakoff, 2012), PA and NA are trait-like individual differences in emotionality (Watson & Clark, 1984). Whereas PA suggests a tendency for positive emotional experience as evidenced by the disproportional reporting of positive emotional states, NA is the opposite but independent tendency for negative emotional experience (Watson & Clark, 1984). Watson, Pennebaker, and Folger (1987) suggest that affectivity has the potential to influence virtually any measure, but variables reflecting perceptions of job conditions, stressors, and strains could be particularly prone to affective bias. Empirical evidence suggests that affective tendencies systematically shape responses to items measuring valenced aspects of situations or persons (Burke, Brief, & George, 1993; L. J. Williams & Anderson, 1994; L. J. Williams, Gavin, & Williams, 1996; Watson et al., 1987).
As Spector, Zapf, Chen, and Frese (2000) point out, however, the potentially biasing nature of affectivity must be considered relative to the variables it is thought to distort. If, for example, a perceptually based measure is intended to capture objective work conditions, variance due to NA (which is independent of the objective environment) can be considered biasing. Alternatively, if the goal is to capture individual variation in perceptions of the objective environment, the influence of NA is meaningful. Spector and colleagues (Spector et al., 1999; Spector et al., 2000) likewise offer theoretical arguments for why the influence of affectivity could be substantive, rather than biasing, in nature. As one example, those high in NA might be unattractive job candidates and, thus, selected into objectively less desirable jobs. Given conflicting conclusions about affectivity, it seems reasonable that distortion due to affectivity is possible, with the likelihood of such an effect varying based on the variables investigated.
Although social desirability can be thought of as an item characteristic, as used here, it is the tendency to present oneself favorably regardless of true position on the construct being measured (Crowne & Marlowe, 1964). Labeled as “one of the most powerful causes of common method biases” (Podsakoff et al., 2003, p. 893), social desirability often exhibits contrasting effects relative to NA (Spector et al., 2000). Paulhus (1984) distinguishes between two types of socially desirable responding. Self-deceptive enhancement occurs when a respondent holds an overly positive self-view and thus overestimates positive traits or beliefs. Impression management, on the other hand, is the conscious attempt to present oneself positively. Whereas social desirability can result in spuriousness, suppression, and moderation in observed relationships (Ganster, Hennessey, & Luthans, 1983), as is the case with affectivity, evidence of socially desirable responding cannot be unequivocally attributed to bias (Spector et al., 2000). Unlike affectivity, however, there exists “an objective and actuarial measurement” of intentional response distortion for use in situations where respondents are situationally motivated to respond desirably (i.e., the overclaiming instrument; Bing, Kluemper, Davison, Taylor, & Novicevic, 2011, p. 151). Although this measure cannot eliminate the possibility of substantive effects, preliminary evidence indicates its utility in quantifying response accuracy (Bing et al., 2011).
Response styles are propensities to systematically respond to items independently of their content and such that certain options are selected disproportionately, regardless of actual standing on the measured construct (Baumgartner & Steenkamp, 2001; Podsakoff et al., 2003). For instance, acquiescent response style (ARS) and disacquiescent response style (DRS) are the respective tendencies to select options at the positive or negative end of the scale provided (e.g., 4 and 5 or 1 and 2 on a 5-point scale in which these options correspond to agree and strongly agree or strongly disagree and disagree; Weijters, Schillewaert, & Geuens, 2008). 4 Although recognized among management scholars (e.g., see Podsakoff et al., 2003), response styles have received greater empirical attention in the marketing literature, in which procedures to operationalize and control for them have been developed (described in the methods section; Baumgartner & Steenkamp, 2001; Weijters et al., 2008). Because these procedures rely on randomly selected items from diverse instruments, response style measures should primarily reflect method, but not substantive, variance in markers and other variables.
Overview of Study 2 Analyses
Marker and substantive variables are analyzed in Study 2 to assess the extent to which they reflect the measured CMV causes in two samples. In turn, the CFA marker technique with the prospective markers and the measured CMV-cause variables is applied to substantive relationships. The substantive variables included in Sample 1 are those used by L. J. Williams et al. (2010) to demonstrate the CFA marker technique (i.e., LMX, job complexity, role ambiguity). In Sample 2, they represent a subset of the variables included in Yang et al. (2009). We focus on supervisory procedural justice, affective trust in one’s supervisor, and job satisfaction, all of which are perceptual and may elicit both affective and evaluative response processes.
We begin by decomposing marker and substantive variable reliabilities into their substantive and measured CMV-cause components. In turn, we apply the CFA marker approach across all substantive variables and perform corresponding analyses using the measured CMV causes in place of the markers. Finally, we apply an additional post hoc statistical correction that incorporates the markers and CMV causes in an alternative way. Namely, Siemsen et al. (2010) use analytical derivation and Monte Carlo simulation to support the idea that CMV bias in regression slope estimates decreases as more CMV-affected variables are incorporated into the equation. Paralleling insights from the marker and omitted variable literatures, they suggest adding substantively unrelated markers or measures capturing presumed causes of CMV. From this perspective, including either a subset of markers or measured CMV causes in a regression equation or structural model with substantive variables should produce comparatively unbiased estimates of independent-dependent substantive relationships.
Triangulation between the reliability decomposition and the CFA analyses modeling CMV with markers and measured CMV causes provides evidence regarding the nature of the method variance (i.e., substantive or method, and if method, what cause) captured via the CFA marker technique when it is used with given variables. In other words, the analyses described above make it possible to identify some potential sources of method variance and to cross-validate the conclusions drawn across a variety of diverse marker and method variables, as well as between different approaches to identifying and controlling method effects in two samples.
Method
Samples and Procedures
Sample 1 consists of responses to an online survey by full-time working adults recruited by students in a research pool at a large public university. The students received extra credit for recruiting, but respondents did not receive incentives. Study participants were employed in diverse jobs, including CPA, legal assistant, veterinarian, and civil engineer. Of the 327 participants enlisted, 265 (81%) responded to the survey. After eliminating responses from those who completed the survey twice, indicated they worked fewer than 30 hours per week or did not have a supervisor, and had missing values on the nondemographic variables, the final usable sample size is 222 (i.e., an effective response rate of 61%). This sample is 53% female, is 85% Caucasian, averages 42 years of age (SD = 13.5), and has worked an average of 20 years (SD = 12.8). Most indicate they had earned at least a 4-year college degree (71%).
Sample 2 consists of full-time working adults drawn from the population of current or potential masters of business administration students who took the GMAT between 2010 and 2012, had earned a minimum score of 450, and who were working or intended to work while pursuing their degrees. These participants were offered either course extra-credit or the chance to win a $100 gift certificate to an online retailer. Of the 2,142 invited to participate in the online study, only 146 (7%) responded to our initial request and multiple reminders. The invitation was therefore resent nine months later to the remaining 1,956 members of the population who had not responded previously and who had not opted out of the study. This time, a chance to win one of three $100 gift cards to an online retailer was offered. With reminders, this second request produced another 118 responses (response rate of 6%). Participants who indicated they worked fewer than 30 hours per week, those without a supervisor, and those missing data on the substantive variables were removed to produce a total usable sample of 227.
ANOVA was employed to compare all study variables and relevant demographics between the original Sample 2 respondents and those who participated nine months later. The only significant difference is for gender, with 51% of respondents in the initial group and 36% of those in the second group being female. In total, the full Sample 2 is 44% female, is 85% Caucasian, averages 32 years of age (SD = 7.14), and has worked an average of 12 years (SD = 8.56). All respondents indicate they have earned a minimum of a 4-year college degree.
Measures
Except where noted, all marker items are on a 5-point Likert-type scale (1 = strongly disagree, 5 = strongly agree) in both samples. With the exception of blue attitude, all marker measures can be found in their entirety in the published works cited below.
Perceptions of benefits administration is measured using nine items by M. L. Williams (1995). 5 Following L. J. Williams et al. (2010), indicators for this marker are modeled as three randomly created item parcels in all CFA procedures reported in this study except for reliability decomposition (described below; using parcels in this instance could mask nuances in the extent to which benefits administration is composed of variance due to the measured causes of CMV). Creative efficacy is measured with three items developed by Tierney and Farmer (2002) and used by Yang et al. (2009). Web use is gauged with the three items reported by Hansen (2012). Responses for these items are on a 5-point Likert-type frequency scale (1 = never, 5 = all of the time). Finally, blue attitude (Miller & Chiodo, 2008) is measured with three items: “I prefer blue to other colors,” “I like the color blue,” and “I like blue clothes.” Although the original blue attitude measure is composed of four items, including the fourth (“I hope my next car is blue”) produces unacceptable internal consistency reliability and model fit in our samples. Thus, only the first three items are used in all analyses. Tenure is measured as organizational tenure in Sample 1 and job tenure in Sample 2. Respondents entered the number of years for which they had worked at their current employers or in their current jobs. As tenure is a single-item measure, we assume a reliability of .90 in CFA analyses requiring that the factor loading from the tenure construct to the relevant tenure item be constrained to a value of the square root of its reliability and the error term for the item be constrained to a value of one minus its reliability times its variance. Cognitive trust in one’s supervisor is measured using five items by Yang and Mossholder (2006). Indicators for this marker are modeled as three random item parcels in all CFA procedures other than the reliability decomposition.
Following L. J. Williams et al. (2010), we include LMX, job complexity, and role ambiguity as the substantive variables of interest for Sample 1. All measures employ their original scales. LMX is captured using Liden and Graen’s (1980) seven-item measure. Items are on multiple 5-point response scales, as presented in Graen and Uhl-Bien (1995). Six items from Sims, Szilagyi, and Keller (1976) measure job complexity. As with the original of this measure, responses for the first four items range from very little (1) to very much (5), and for the remaining two items they range from a minimum amount (1) to a maximum amount (5). For all job complexity items, anchors are only provided for the extreme and midpoint responses, again as is done with the original measure. Role ambiguity is measured with six items from Rizzo, House, and Lirtzman (1970; 1 = strongly disagree, 5 = strongly agree).
Sample 2 substantive variables—supervisory procedural justice, affective trust in supervisor, and job satisfaction—are from Yang et al. (2009). Contrary to Sample 1, all items are on the same 5-point agree/disagree response scale employed for all of the markers except web use. Supervisor procedural justice is gauged using the full seven-item Colquitt (2001) measure. As in Yang et al. (2009), the items are worded to reference the supervisor’s general behaviors. Affective trust is measured using five items developed by Yang and Mossholder (2006). Hackman and Oldham’s (1975) three-item measure is used to gauge job satisfaction.
With the exception of overclaiming, all CMV-cause measures are on a 5-point Likert-type scale (1 = strongly disagree, 5 = strongly agree) in both samples. PA and NA are gauged using the respective 10-item measures developed by Watson, Clark, and Tellegen (1988). Because our intention is to capture trait-like affectivity (e.g., as opposed to current mood), the items’ stem asks respondents how they feel “generally” or “on average.” The self-deception form of social desirability is measured using five items from Paulhus’s (1984) short form of the Balanced Inventory of Desirable Responding. Including the fifth item (“In a group of people, I have trouble thinking of the right things to talk about”) produces unacceptable alpha reliability in Sample 2, and thus it is not included in any Sample 2 analyses. In both samples, the self-deception items are reversed scored such that higher values indicate greater self-deception.
The impression management form of social desirability is measured via the short-form of Paulhus, Harms, Bruce, and Lysy’s (2003) overclaiming instrument, as described by Bing et al. (2011). Specifically, respondents indicate their familiarity with 25 existent and nonexistent names and topics. Respondents who claim to be familiar with nonexistent items are more likely to be engaging in purposeful misrepresentation. Overclaiming was not collected in Sample 2. Because the properties of the items used to measure the CMV cause variables are not of interest and to reduce the number of indicators in our complex models, we used random parcels of items as indicators of overclaiming, PA, and NA in all relevant CFA models (L. J. Williams et al., 2010). Parcels were also used for self-deception in Sample 1; however, indicators were modeled individually for the four self-deception items in Sample 2.
ARS and DRS are measured using an approach recommended by Weijters et al. (2008; see for a full description of this procedure). Briefly, three sets of 14 substantively unrelated items each are used to capture the frequency with which each respondent selected each response option on these items, irrespective of their content. Using the equations provided by Weijters et al. (2008), these frequencies are used to compute three distinct indicators (i.e., one from each set of items) each for ARS and DRS. Following Weijters et al. (2008), the 42 total items used to capture response styles in this study are randomly sampled from the Handbook of Marketing Scales (Bearden & Netemeyer, 1999), the Marketing Scales Handbook (Bruner & Hensel, 1994), and Measures of Personality and Social Psychological Attitudes (J. P. Robinson, Shaver, & Wrightsman, 1991). To increase the likelihood that the items are substantively unrelated (and thus less likely to capture coherent substantive content), no two items are sampled from the same measure. Indeed, similar to the average interitem correlation of .07 reported by Weijters et al. (2008), average response styles interitem correlations in Samples 1 and 2 are .08 and .09, respectively. Sample items are “Consumerism issues are important to me,” “I follow through with the treatment advice my physician gives,” and “Social learning theory considers higher level needs to be innate.” The full set of items is available from the authors on request.
Analyses
We first decompose the marker and substantive variable reliabilities to quantify the degree to which each reflects its underlying construct and the measured causes of CMV. 6 These “reliability decomposition analyses” from L. J. Williams et al. (2010) entail five steps. The first estimates standard CFA models, each including a single marker (or substantive) variable and the full set of measured CMV-cause variables, with all included constructs freely correlating. The second step estimates the equivalent of L. J. Williams et al.’s “baseline” models. These models set factor loadings and error terms for the CMV-cause variable indicators to the unstandardized values obtained from the initial CFA models, and fix the correlations between the single marker (substantive) variable and the measured CMV-cause variables to zero. The CMV-cause variables, however, still freely correlate with one another. The third step estimates models corresponding to “method-U.” These are identical to the baseline models but add secondary factor loadings from each CMV-cause construct to each marker (substantive) item. Comparison of model fit between the method-U and respective baseline models indicates whether, in addition to variance due to the underlying construct, the marker (substantive) variable shares significant variance with the measured causes of CMV as a group. The fifth step enters the completely standardized marker (substantive) construct → marker (substantive) item loadings, marker (substantive) item error terms, and secondary CMV-cause construct → marker (substantive) item loadings from the method-U models into the reliability decomposition equations shown on page 500 of L. J. Williams et al. (2010), and calculates the percentage of total construct reliability due respectively to the substantive and each CMV-cause construct.
We next apply the standard CFA marker approach outlined by L. J. Williams et al. (2010) to the set of substantive variables in each sample with each prospective marker. This set of “CFA marker models” involves four steps and determines whether each marker identifies the presence of CMV and bias in each sample. The first step creates a CFA model with the three substantive variables from a given sample and one of the markers. The second step creates a “baseline” model that is identical to the CFA model, but the marker is not allowed to correlate with the substantive variables and marker item factor loadings and error terms are set to the unstandardized values obtained from the CFA model. The third step specifies the “method-C” and “method-U” models. These are identical to the baseline model except they include secondary loadings between the substantive items and the marker construct. In method-C, these loadings are set to equal one another; in method-U, they freely vary. If method-C fits significantly better than the baseline model, CMV is said to be present. If method-U fits significantly better than method-C, the identified CMV is assumed to be congeneric. The completely standardized factor correlations from the better fitting model represent substantive relationships corrected for CMV (although Richardson et al., 2009, question the average accuracy of the correction). The fourth step, referred to as “method-R,” produces the final model, which is identical to method-C or –U (depending on which fit better), but constrains the substantive factor correlations to their unstandardized estimates from the baseline model. If the method-R model fits significantly differently from method-C or U, it suggests that CMV biases observed substantive relationships (although Richardson et al., 2009, question the accuracy of this test as well). Due to shared variance among the markers, it is possible that separately examining each by itself slightly overestimates its effects. As such, we estimate a further set of models that simultaneously includes all markers for which the CFA marker analyses produce evidence of significant CMV. In the baseline and method-C/U/R models for these latter analyses, the included markers freely correlate with one another, but they do not correlate with substantive factors. Intercorrelations among substantive factors are also allowed.
After completing the standard CFA marker analyses, we estimate similar models (CFA, baseline, method-C, method-U, and method-R) and analyses for each set of substantive variables with each measured CMV cause. These “measured CMV cause models” are identical to those described immediately above except the markers are replaced with the measured CMV-cause variables. Although these analyses are analogous to the four-step CFA marker procedure, using a measured CMV caused in place of the marker is also comparable to procedures outlined by L. J. Williams and Anderson (1994), L. J. Williams et al. (1996), and Weijters et al. (2008). In this case, the purpose is to determine whether each CMV caused variable identifies the presence of CMV and bias in each sample. Based on the results from modeling a single CMV caused, we further estimate models that concurrently include all measured causes of CMV that produce significant baseline versus method-C/U model comparisons. In the baseline and method-C/U/R models for these latter analyses, the CMV-cause constructs freely correlate with one another but not with the substantive constructs. Again, substantive factor intercorrelations are allowed.
The final analyses performed are the regression analyses suggested by Siemsen et al. (2010). These “Siemsen et al. analyses” require estimating a regression equation that includes additional independent variables (i.e., akin to markers or controls) that serve to reduce or eliminate CMV in the regression slope relating a focal independent and dependent variable pair. Although Siemsen et al.’s study explores only ordinary least squares regression for this purpose, we execute their analyses using both regression and structural equation modeling (SEM). Our logic is that the latter (and all other analyses in the present study) accounts for measurement unreliability, whereas the former does not. As Lance, Dawson, Birkelbach, and Hoffman (2010) have suggested, the effects of unreliability on observed relationships often oppose those of CMV. Assuming the presence of CMV, partialling out its effects (which is what Siemsen et al. argue their technique accomplishes) without also correcting for attenuation due to unreliability will increase the likelihood of misestimating substantive relationships.
In Sample 1 LMX and complexity are treated as independent variables, and ambiguity is treated as the dependent variable (L. J. Williams et al., 1996). In Sample 2 justice and affective trust are independent variables, and satisfaction is the dependent variable (Yang et al., 2009). To determine the point at which CMV deflates regression slope estimates and, thus, the number of other variables that must be added into the equation to effectively control for CMV, Siemsen et al. (2010) advise using the K* = 1/r rule (where K is the number of independent variables in the equation and r is the observed independent-dependent bivariate correlation). Applying this rule to the smallest independent-dependent correlation in each sample (i.e., complexity-ambiguity = .14 in Sample 1; affective trust-satisfaction = .47 in Sample 2), indicates respective minimums of seven and two total independent variables are required in Samples 1 and 2. Siemsen et al. recommend selecting additional variables that, like the focal variables of interest, presumably suffer from CMV and are correlated with one another at .30 or less.
We estimate separate equations/models respectively using markers and CMV-cause variables as the additional variables. Because Sample 1 requires six additional variables (besides the independent variable of interest) and because LMX and complexity correlate at only .22, the Sample 1 equations/models include both LMX and complexity as independent variables. In the marker variable equation/model we further include all markers (a) for which the reliability decomposition analyses indicate significant variance due to the measured causes of CMV and (b) that are correlated with one another and the independent variables at .30 or less. Thus, the additional variables are benefits administration, creative efficacy, web use, blue attitude, and organizational tenure. In the CMV-cause equation/model, all measured CMV-cause variables are included except self-deception, which correlates with NA at –.55. Although the correlation between ARS and PA is above .30 (i.e., .35), we retain both variables to fulfill the K* = 1/r rule. In all Siemsen et al. SEM analyses, we allow all independent variables to freely correlate.
Because justice and affective trust correlate at .74, we do not include the two together in the equations/models estimated for Sample 2. Rather, we separately estimate the marker and CMV-cause equations/models for each of these variables. As the K* = 1/r rule indicates that Sample 2 requires a single additional variable, we include creative efficacy in the marker equations/models. Reliability decomposition analyses indicate that 28% of creative efficacy’s total construct reliability is due to the measured CMV-cause variables, and its maximum correlation with either substantive independent variable is .22 (with justice). For the CMV-cause equations/models, we include ARS as the measured CMV-cause variable that reflects the greatest summed percentage of construct reliability across the three substantive variables (i.e., ARS represents a total of 37.73% of construct reliability in justice, affective trust, and satisfaction, but its largest correlation with the two independent variables is only .22). Again, the independent variable and the additional variable are allowed to freely correlate.
Results
Descriptive statistics and intercorrelations for the constructs in Samples 1 and 2 are shown in Table 4. In Sample 1, our substantive variable correlations are notably lower than those reported in L. J. Williams et al. (2010), as is the correlation between complexity and benefits administration. In Sample 2, our job satisfaction correlations are much larger than those reported by Yang et al. (2009). Creative efficacy exhibits a higher mean in both samples than the mean in Yang et al., and it correlates more strongly with justice (i.e., r = .22, as opposed to Yang et al.’s r = .04). Despite the variation in response scales employed in the Sample 1 survey, both samples exhibit similar mean levels and distributions for the response style variables.
Descriptive Statistics and Intercorrelations Among Study 2 Variables in Samples 1 and 2.
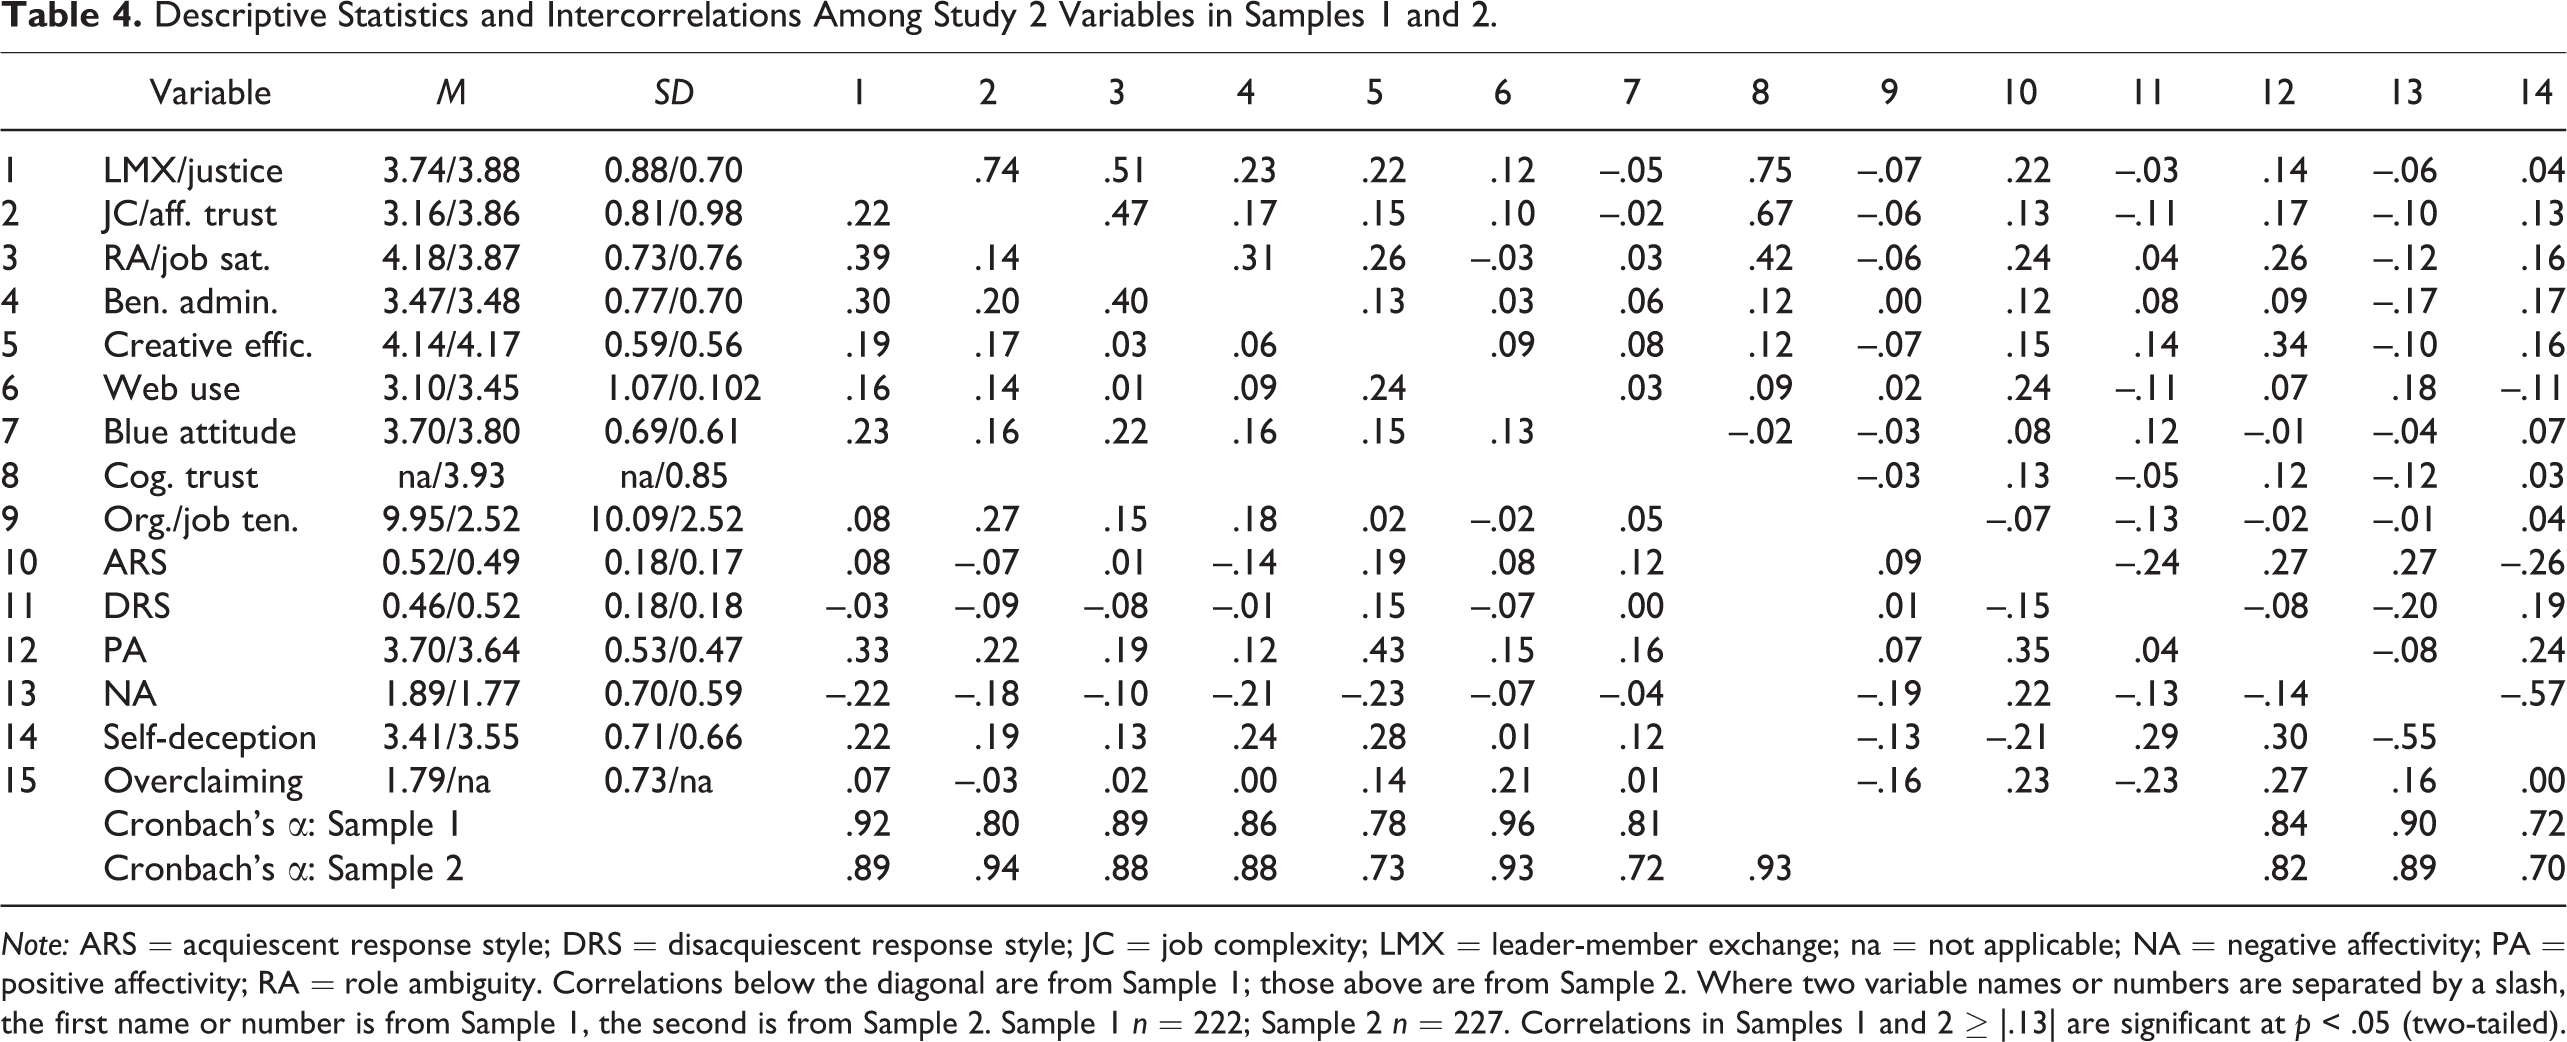
Note: ARS = acquiescent response style; DRS = disacquiescent response style; JC = job complexity; LMX = leader-member exchange; na = not applicable; NA = negative affectivity; PA = positive affectivity; RA = role ambiguity. Correlations below the diagonal are from Sample 1; those above are from Sample 2. Where two variable names or numbers are separated by a slash, the first name or number is from Sample 1, the second is from Sample 2. Sample 1 n = 222; Sample 2 n = 227. Correlations in Samples 1 and 2 ≥ |.13| are significant at p < .05 (two-tailed).
Reliability decomposition results for both samples are presented in Table 5. For each marker and substantive variable, the first row indicates the total construct reliability and the subsequent seven or six rows indicate the percentage of total reliability due to the underlying substantive construct and the respective measures of a presumed CMV cause. 7 The final row for each sample indicates the results of the chi-square comparison between the relevant baseline and method-U models. Instances where the chi-square difference is significant suggest the marker (substantive) variable is composed of significant variance due to the CMV causes.
Reliability Decomposition Results.
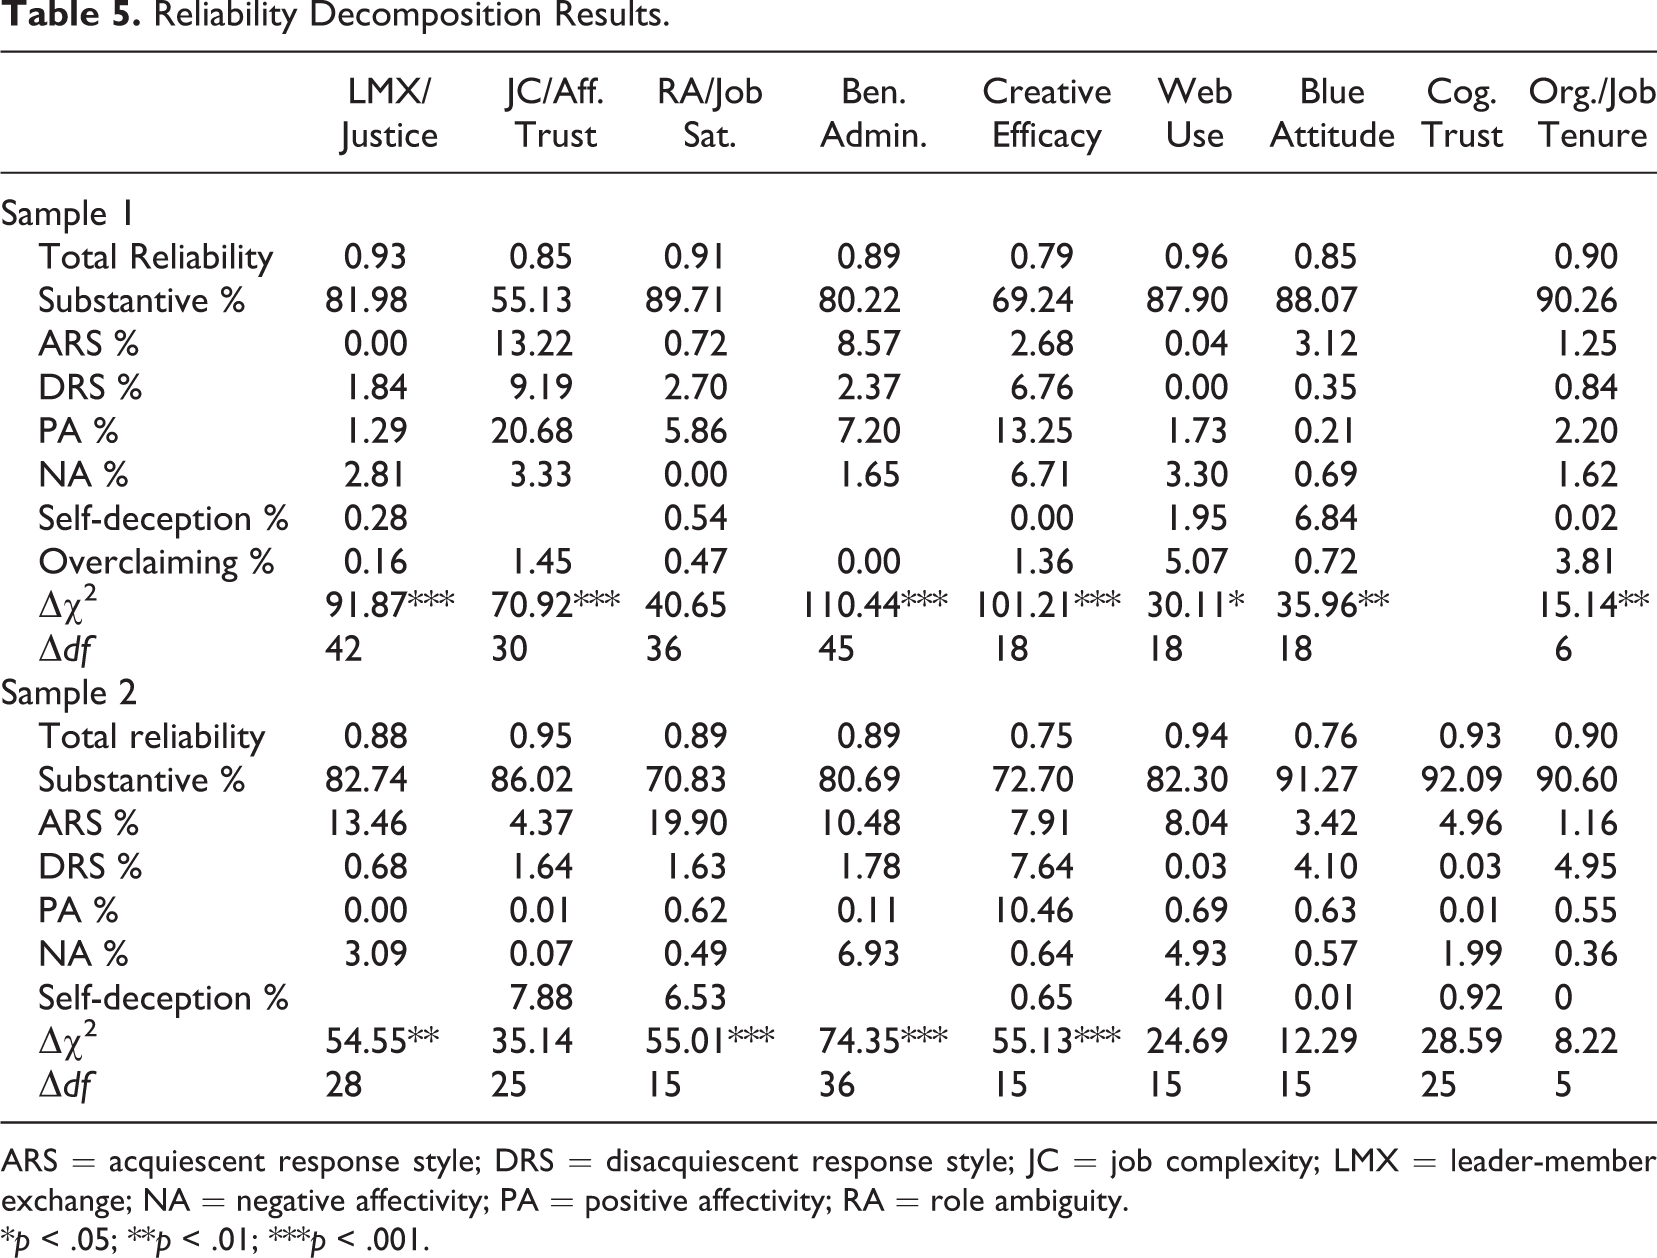
ARS = acquiescent response style; DRS = disacquiescent response style; JC = job complexity; LMX = leader-member exchange; NA = negative affectivity; PA = positive affectivity; RA = role ambiguity.
*p < .05; **p < .01; ***p < .001.
In Sample 1, ambiguity is the only variable with nonsignificant variance due to the measured CMV causes as a group. Although organizational tenure is examined as a prospective nonideal marker, it nonetheless contains significant variance from the CMV causes (in particular overclaiming). This finding implies that respondents engaged in some self-deception when reporting tenure. In contrast to Sample 1, most of the Sample 2 markers (i.e., web use, blue attitude, cognitive trust, and job tenure) and one substantive variable (i.e., affective trust) have no significant variance due to the CMV causes. All total construct reliabilities are at conventionally acceptable levels, but several marker and substantive variables exhibit comparatively small proportions of total reliability due to substantive variance—notably complexity and creative efficacy in Sample 1 and job satisfaction and creative efficacy in Sample 2. Reliabilities for these are respectively due to about 55%, 69%, 71%, and 73% of their intended constructs, with the remainder attributable to the measured CMV causes. We also draw attention to the total reliabilities for creative efficacy (.79, .75) and blue attitude (.76, Sample 2), which indicate these consist of more random error variance than do the other variables.
Whereas in Sample 1 PA, ARS, and DRS are responsible for the greatest aggregate proportions of variance across the marker and substantive variables, in Sample 2 the proportional variance is principally from ARS and self-deception. That is, PA accounts for roughly 21% of complexity, 13% of creative efficacy, 7% of benefits administration, and 6% of ambiguity in Sample 1. ARS accounts for about 20% of job satisfaction, 13% of justice, 10% of benefits administration, and 8% of both creative efficacy and web use in Sample 2. If the measured CMV-cause variables accurately reflect the CMV present in these data, the overall pattern shown in Table 5 implies that creative efficacy and benefits administration are the markers most likely to identify CMV in the present data. Especially when applied to the LMX-complexity and justice-satisfaction relationships, creative efficacy should control for CMV due to PA, DRS, and NA in Sample 1 and due to PA, ARS, and DRS in Sample 2. Benefits administration should chiefly control for ARS and PA in Sample 1 and ARS and NA in Sample 2.
Due to the volume of models estimated, we do not present fit statistics for all analyses performed for Study 2 (these are available from the authors on request). Rather, Table 6 presents only the results of the baseline versus method-C and method-C/U versus method-R chi-square difference tests from the CFA marker and measured CMV-cause analyses. Whereas the former model comparison is a statistical test for the presence of CMV, the latter is a test for bias due to CMV. In addition, we obtained and reanalyzed Yang et al.’s (2009) data, which are not evaluated using CFA in their original publication. Reanalysis results are also presented in Table 6.
Model Comparison Results From the Marker Variable and Measured CMV-Cause Analyses in Both Samples.
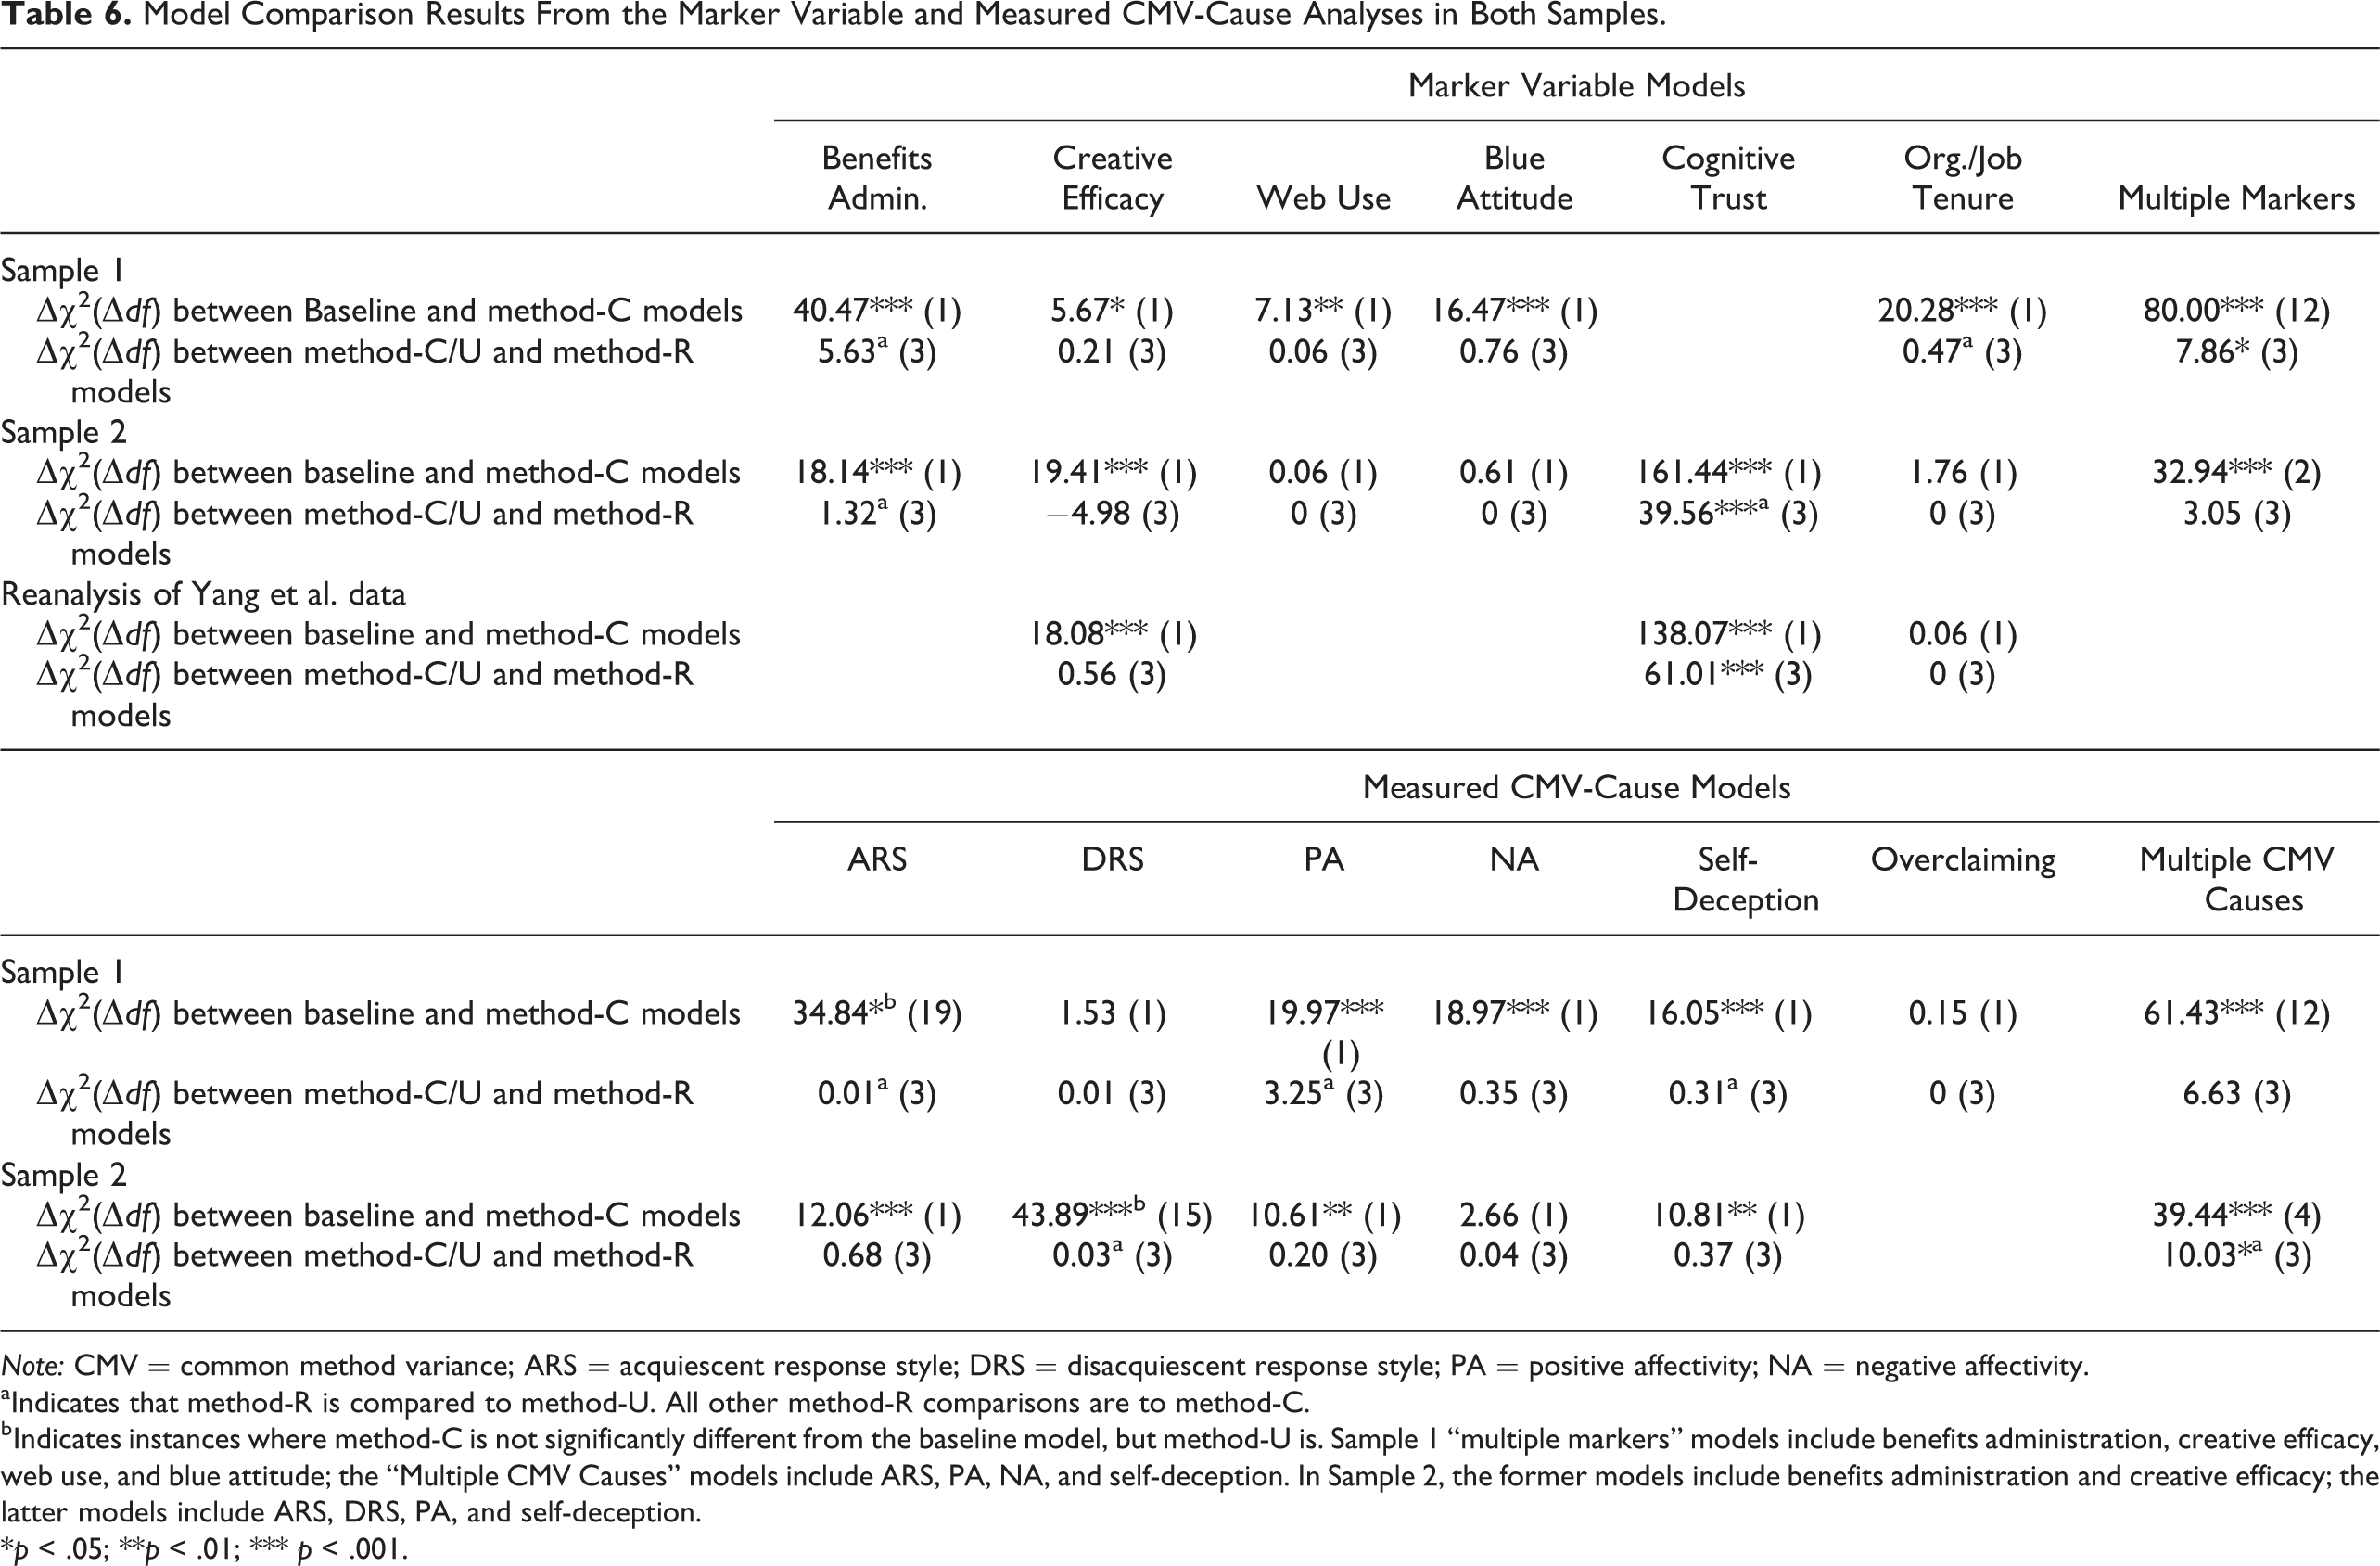
Note: CMV = common method variance; ARS = acquiescent response style; DRS = disacquiescent response style; PA = positive affectivity; NA = negative affectivity.
aIndicates that method-R is compared to method-U. All other method-R comparisons are to method-C.
bIndicates instances where method-C is not significantly different from the baseline model, but method-U is. Sample 1 “multiple markers” models include benefits administration, creative efficacy, web use, and blue attitude; the “Multiple CMV Causes” models include ARS, PA, NA, and self-deception. In Sample 2, the former models include benefits administration and creative efficacy; the latter models include ARS, DRS, PA, and self-deception.
*p < .05; **p < .01; *** p < .001.
As shown at the top of Table 6, applying each prospective marker in Sample 1 produces evidence of statistically significant CMV (i.e., regardless of the marker employed, the relevant baseline vs. method-C model comparison is significant). Indeed, even organizational tenure indicates the presence of CMV. This finding is consistent with the reliability decomposition results, and together they suggest that some individuals engage in impression management (e.g., present themselves as more experienced) by inflating reports of their tenure. In Sample 2, only two of the prospective ideal markers (benefits administration and creative efficacy) identify the presence of CMV, as does the prospective nonideal marker, cognitive trust. Applying creative efficacy and cognitive trust as markers to Yang et al.’s (2009) original data indicate the presence of CMV in their relationships as well. These latter findings partially differ from Yang et al. Although the correlational approach they use does not entail a statistical test for CMV, because correlations corrected using creative efficacy are only marginally different from their uncorrected counterparts, Yang et al. conclude that meaningful levels of CMV are not present in their data. The CMV-cause analyses in the bottom of Table 6 suggest that significant levels of CMV due to ARS, PA, NA, and self-deception are present in substantive relationships in Sample 1. ARS, DRS, PA, and self-deception indicate significant CMV in Sample 2.
Despite evidence that CMV may be present in both samples and in Yang et al.’s data, none of the prospective ideal markers on its own indicates bias. In fact, cognitive trust is the only individual marker to suggest significant bias. Given, however, that cognitive trust does not significantly reflect the CMV causes and that Yang et al. offer theoretical arguments about its relationships with justice and job satisfaction, the supposed bias is more likely to be substantive in nature. As is the case with the prospective ideal markers, none of the measured CMV-cause variables by itself indicates the presence of significant bias in either sample.
The final column in Table 6 shows the chi-square comparison results for models estimated with either multiple markers or multiple CMV-cause variables. Again, we include in these models only the prospective ideal markers or CMV causes that produce evidence of significant CMV in the analyses described above. The markers as a group indicate statistically significant CMV and bias in Sample 1, but only significant CMV in Sample 2. When we replace the markers with the CMV-cause variables, the findings reverse across the two samples. Whereas Sample 1 shows evidence of significant CMV only, results for Sample 2 suggest significant CMV and bias. For Sample 1, these results can be interpreted in two ways. First, contrary to the measured CMV-cause variables, the markers in Sample 1 capture method variance that is not reflected in the measured CMV-cause variables, and thus are able to identify sources of bias the CMV-cause variables cannot. In this case, the results from the marker models would indicate that CMV truly biases substantive relationships in Sample 1. Alternatively, the markers could share more theoretical variance with substantive variables in Sample 1 than do the CMV causes and, thus, inappropriately identify bias. The Sample 2 results from the multiple CMV-cause models can likewise be interpreted as indicating true method bias exists in the data or that the variance shared between the substantive variables and CMV causes is, in reality, substantive in nature. If the latter, these models falsely indicate bias. This group of findings further highlights the likelihood that the substantive and marker variables within each sample differentially reflect or are distorted by method variance—even when the variables appear in both samples.
Table 7 shows substantive relationships before (i.e., “uncorrected”; from bivariate zero-order correlations [r] or completely standardized factor correlations [φ] from a substantive variable-only measurement model) and after one or more marker or measured CMV-cause variables are controlled (i.e., “corrected”; completely standardized factor correlations from the relevant method-C/U model). Uncorrected and corrected substantive relationships from the original L. J. Williams et al. (2010) and Yang et al. (2009) data are presented as well. For comparison, this table likewise includes the standardized regression (β) and completely standardized gamma (γ) coefficients from the Siemsen et al. regression and SEM analyses, respectively.
Uncorrected and Corrected Substantive Relationships From Original Publications, Samples 1 and 2, and Reanalysis of Yang et al.’s Data.
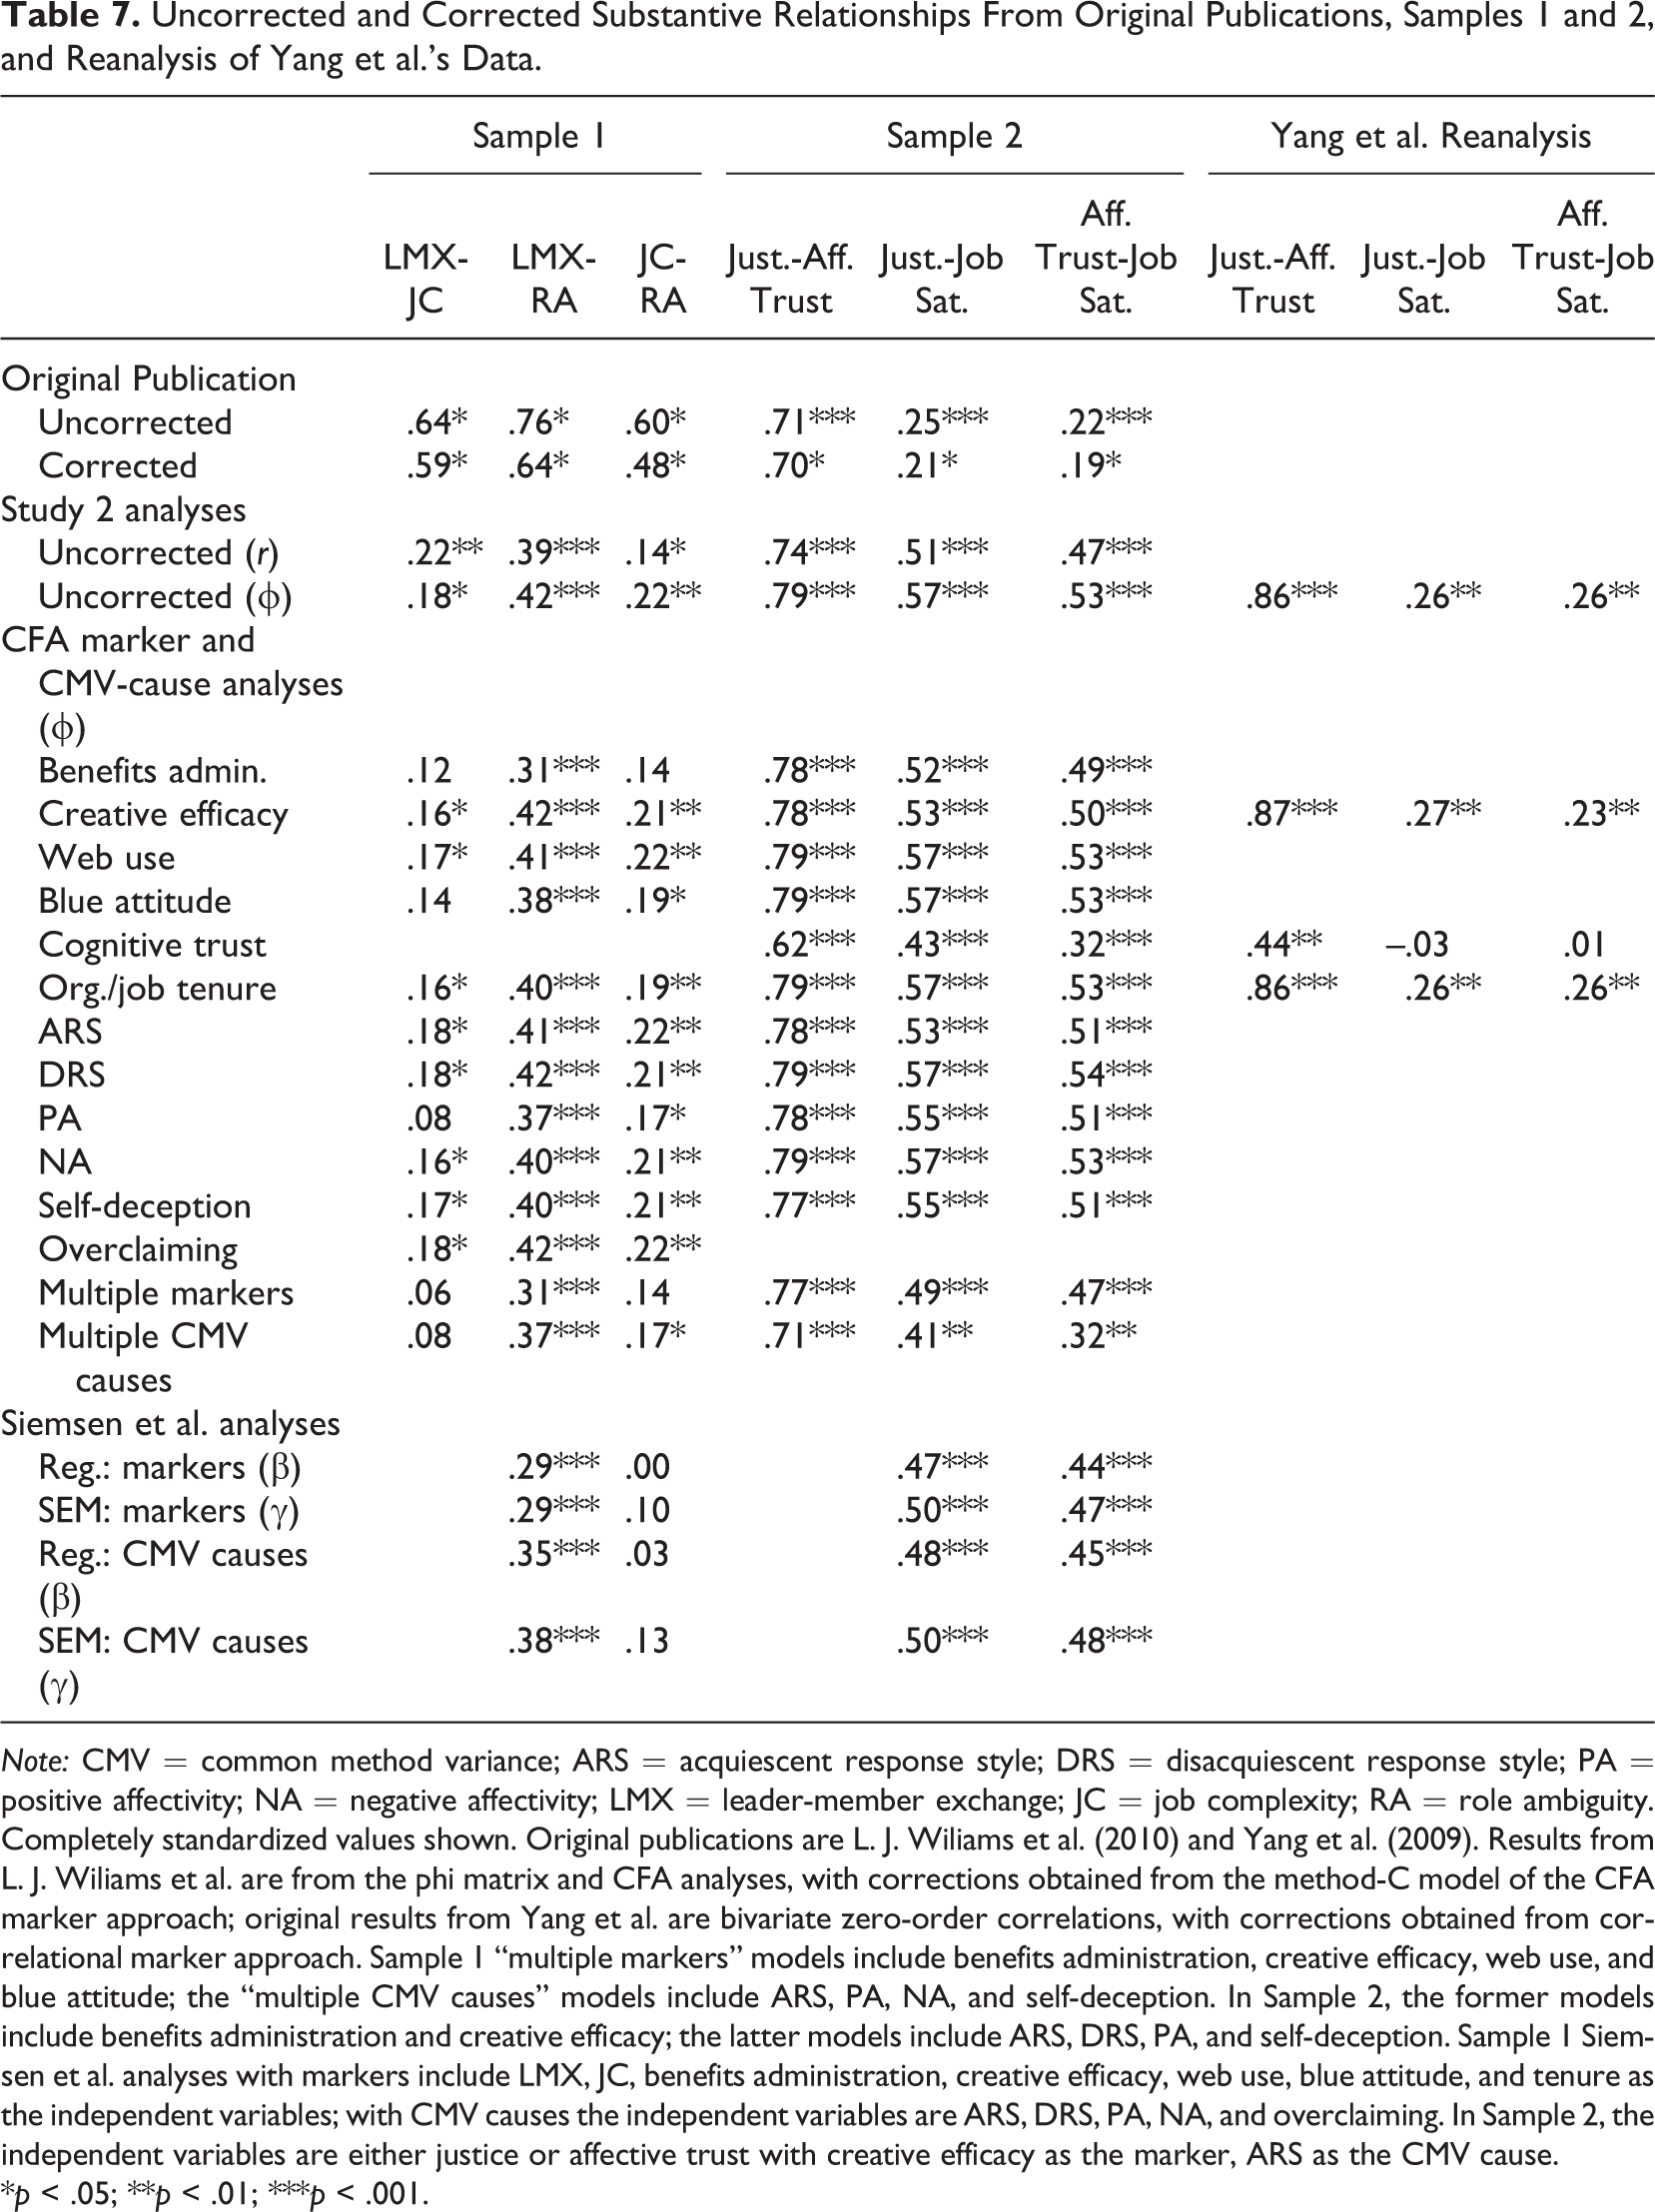
Note: CMV = common method variance; ARS = acquiescent response style; DRS = disacquiescent response style; PA = positive affectivity; NA = negative affectivity; LMX = leader-member exchange; JC = job complexity; RA = role ambiguity. Completely standardized values shown. Original publications are L. J. Wiliams et al. (2010) and Yang et al. (2009). Results from L. J. Wiliams et al. are from the phi matrix and CFA analyses, with corrections obtained from the method-C model of the CFA marker approach; original results from Yang et al. are bivariate zero-order correlations, with corrections obtained from correlational marker approach. Sample 1 “multiple markers” models include benefits administration, creative efficacy, web use, and blue attitude; the “multiple CMV causes” models include ARS, PA, NA, and self-deception. In Sample 2, the former models include benefits administration and creative efficacy; the latter models include ARS, DRS, PA, and self-deception. Sample 1 Siemsen et al. analyses with markers include LMX, JC, benefits administration, creative efficacy, web use, blue attitude, and tenure as the independent variables; with CMV causes the independent variables are ARS, DRS, PA, NA, and overclaiming. In Sample 2, the independent variables are either justice or affective trust with creative efficacy as the marker, ARS as the CMV cause.
*p < .05; **p < .01; ***p < .001.
In most cases and as would be expected from the bias tests, controlling for a single marker or CMV-cause results in minor changes in observed factor correlations. The average correction magnitude across all single markers and CMV-cause variables in Sample 1 is .03 for LMX-complexity, .03 for LMX-ambiguity, and .02 for complexity-ambiguity. In Sample 2, the average correction from single markers (except cognitive trust) and CMV causes is .01 for justice-affective trust, .02 for justice-satisfaction, and .01 for affective trust-satisfaction. Fourteen of the factor correlations shown in Table 7 lose significance or exhibit reduced significance when one or more marker or CMV-cause variables are controlled. Changes in significance occur most frequently for the two smallest substantive relationships (i.e., LMX-complexity and complexity-ambiguity). In Sample 2, only the application of multiple CMV-cause variables decreases significance, and then only for the relationships that include job satisfaction.
Because it is less likely that the moderate LMX-ambiguity relationship in Sample 1 or the comparatively large and strongly significant relationships in Sample 2 would lose or change significance, we calculate 95% and 99% confidence intervals (CIs) around each uncorrected relationship. If the CFA marker or CMV-cause analyses yield corrected estimates that are outside of the CIs of original estimates, this indicates notable changes in relationship magnitudes even without changes in significance. Application of benefits administration and of multiple markers in Sample 1 each decrease the LMX-ambiguity relationship from .42 (95% CI = .31-.52; 99% CI = .27-.55) to .31. Because the corrected values fall on the lower cusp of these CIs, there is the possibility of meaningful differences relative to the uncorrected values.
In Sample 2, cognitive trust reduces the three substantive relationships from .79 (95% CI = .74-.83; 99% CI = .72-.85), .57 (95% CI = .48-.65; 99% CI = .44-.67), and .53 (95% CI = .43-.62; 99% CI = .40-.64) to .62, .43, and .32, respectively. The corrected estimates clearly do not fall within these CIs, indicating meaningful differences between the corrected and uncorrected relationships. We at least partially attribute these changes, however, to the likelihood of shared substantive variance between cognitive trust and the substantive variables. Controlling for multiple CMV causes in Sample 2 reduces the justice-affective trust relationship from .79 (95% CI = .74-.83; 99% CI = .72-.85) to .71. Again, the CIs indicate these relationships are meaningfully different from one another. Although the pattern of results for the reanalysis of Yang et al. are consistent with those in Sample 2, we note that implementing the CFA approach with creative efficacy actually produces a .01 increase in both relationships that include justice.
The Siemsen et al. analyses generate corrected correlations that are more similar in magnitude to those from the multiple marker or CMV-cause models than they are to those from the models that control for only a single marker or CMV cause. Given that SEM accounts for measurement unreliability, the Siemsen et al. SEM analyses yield smaller corrections than do the equivalent regression analyses. As complexity is the substantive variable with the lowest reliability, the differences between the Siemsen et al. regression and SEM analyses are most apparent for the complexity-ambiguity relationship. To broadly summarize the corrected correlations across the Siemsen et al., CFA marker, and CMV-cause analyses, the Siemsen et al. approach generates the least conservative corrections. If these are assumed to be reasonably accurate, it appears that controlling for multiple marker or CMV-cause variables will sometimes be required to achieve corresponding conclusions from the CFA marker approach.
Finally, because of Lance et al.’s (2010) observation that attenuation due to unreliability offsets inflation from CMV, we highlight differences between the uncorrected zero-order (i.e., reflecting relationships unadjusted for unreliability or CMV) and uncorrected factor correlations (reflecting relationships corrected for unreliability only) in Sample 1. Assuming some level of measurement error but in the absence of CMV, one would expect observed factor correlations to be larger than zero-order correlations—indeed, as they are for most of the substantive relationships in both samples. In Sample 1, however, the LMX-complexity factor correlation (.18) is smaller than the corresponding zero-order correlation (.22). Considering the potential for CMV suggests the possibility that CMV inflation in this relationship is greater than the concurrent attenuation due to unreliability. In the other relationships, however, it could be that the opposing effects of CMV and unreliability are more similar in magnitude or that attenuation due to unreliability is greater than CMV inflation. Complexity is the least reliable substantive variable in Sample 1, as well as the one most composed of variance due to the measured CMV-cause variables. The substantive relationships including complexity are also the weakest, as well as those most likely to be affected by application of a marker or CMV-cause variable.
Discussion
When testing for CMV using the CFA marker technique, conclusions about the presence of method variance vary depending on the marker used, and at least part of this variation is due to the degree that substantive and marker variables differentially reflect potential CMV causes. In Sample 1, all markers identify the presence of CMV and all comprise significant CMV-cause variance. In Sample 2, only benefits administration and creative efficacy identify CMV, and these also are the only markers exhibiting significant variance due to the CMV causes. None of the markers (except cognitive trust) identify significant method bias on its own, a finding that is consistent with the conclusions reported in the articles identified in Study 1. Yet, the failure of any one marker or CMV-cause variable to identify bias is not unequivocal evidence that it is not present. Rather, results from the models controlling for multiple markers and CMV causes and from the Siemsen et al. analyses imply the risk of bias in our data.
With only a few exceptions, applying the CFA technique with either a single marker or measured CMV-cause variable does not produce corrected relationships that lose significance or that are meaningfully different from uncorrected relationships. There are at least two related explanations for these minimal observed changes. First, there might truly be insufficient method variance (of the type we measure or otherwise) to appreciably alter observed relationships. Second, consistent with Richardson et al. (2009), the CFA marker approach might not return accurate estimates of true relationships between constructs, especially when CMV is congeneric. As mentioned, our results suggest that any CMV present from a single variable does not, on its own, bias our data. Our results also indicate that CMV asymmetrically affects the substantive and marker variables. For instance, the total reliabilities of LMX and ambiguity are composed of very small percentages and different distributions of the CMV causes. To the degree that LMX and ambiguity share causes of method variance, their relationship will be inflated, but the inflation will be simultaneously neutralized by attenuation from unshared method variance (L. J. Williams & Brown, 1994). Extending this example, the markers exhibit total reliabilities resulting from still other distributions of variance due to the CMV causes. As such, even if LMX and ambiguity shared substantial method variance, a marker like creative efficacy would not necessarily capture their CMV and its application should minimally influence their observed relationship. Given the potential for congeneric method effects, we again underscore the pragmatism of incorporating multiple markers or CMV-cause variables into one’s design.
Looking at the results from still a different perspective, we cannot rule out that some of relationships between the substantive variables and both the markers and CMV-cause variables may reflect nontrivial, shared substantive variance, rather than shared method variance alone. This possibility is perhaps most likely for cognitive trust, which we explicitly include as an example of a nonideal, theoretically related marker. It exists for other variables as well, though. For example, the large proportion of complexity that reflects variance due to PA may not indicate a positive response tendency, but instead, indicate that high PA individuals are perceived to be more desirable job candidates and thus may be selected into objectively more complex and interesting jobs (i.e., consistent with arguments by Spector et al., 1999; Spector et al., 2000). If so, the loss of significance for the LMX-complexity correlation when PA is controlled would not reflect the true, nonbiased relationship between these variables. Because of the way they are measured, we propose that the response styles and overclaiming measures (all of which implicitly capture a behavioral response pattern using items that have little to no substantive meaning relative to one another or other study variables) are perhaps the least likely variables in Study 2 to share theoretical variance with either the substantive or marker variables. Although variables in our study are little influenced by overclaiming, the opposite might be true in studies in which the content or context are more likely to motivate intentional response distortion.
Finally, we note the possibility that observed relationships in Study 2 are composed of CMV that we could not explicitly measure (e.g., due to implicit theories; although, conceptually, this possibility is not as problematic for the Siemsen et al. approach). Yet, even in instances where the marker and substantive variables share significant variance that is not a function of the measured CMV causes, applying the CFA technique again produces comparatively small changes in the magnitudes of substantive relations. Although the foregoing implies that using a nonideal marker might be relatively harmless, the cognitive trust marker illustrates the risks of drawing false conclusions when using a nonideal, theoretically related marker with variables that are likely to be correlated at levels typically found in organizational research.
General Discussion and Conclusions
This article presents results from a review of extant research employing marker techniques and from a primary empirical study of multiple marker variables. Whereas others (Richardson et al., 2009; L. J. Williams et al., 2010) have reviewed work implementing marker approaches, Study 1 covers a wider time span and body of published and unpublished research, considering aspects of marker use and reporting that are not included or have not been treated as comprehensively in prior work. Furthermore, although the studies cited above have respectively used simulation and primary data to explore the utility of ideal and nonideal markers for drawing conclusions about CMV, Study 2 is the first to compare results from multiple prospectively ideal and nonideal markers and to empirically explore the degree to which these markers, both alone and in combination, reflect and potentially control for specific causes of CMV.
To briefly summarize the results of each study, the review demonstrates that researchers have embraced marker techniques as one means of providing evidence that empirical findings are not a function of CMV, but they continue to rely greatly on an arguably less accurate technique (i.e., the correlational approach). They also frequently employ markers of questionable or indeterminate suitability, thereby casting doubt on the conclusions drawn about CMV in their data. The field study, on the other hand, illustrates how important it is to select suitable markers based on explicit expectations that they are theoretically unrelated and similarly vulnerable to CMV relative to other study variables. Supporting the perspective that CMV has congeneric effects (e.g., Spector, 2006), this study provides evidence that variables collected in the same and different contexts are not necessarily uniformly influenced by equivalent method effects, and thus the markers examined sometimes produce different conclusions within and across samples. Despite their variation, the conclusions yielded by each marker or set of markers are largely consistent with the conjecture that those sharing more similar patterns of measured CMV-cause variance with the substantive variables would be the most likely to identify CMV. We expand on these overall findings and their implications for extant and future research below.
A theme alluded to throughout Study 1 and consistent with the reviews cited above is that authors routinely provide deficient information about their markers and findings. This sustained level of inadequate reporting was not fully expected, and it raises the question of why marker technique usage continues to grow without concurrent growth in the quality of the markers applied and of the details provided about them, even after recent publications specifying related best practices (i.e., Richardson et al., 2009; L. J. Williams et al., 2010). Although our data do not enable us to conclusively answer this question, one possibility is that authors are insufficiently grounded in the profuse and sometimes conflicting CMV, measurement, or survey design literatures to build adequate arguments or make suitable choices. Another and perhaps more troubling possibility is that marker techniques are implemented primarily as attempts to satisfy reviewers rather than as thoughtful efforts to truly identify the presence or absence of CMV. In turn, it seems reviewers do not require detailed reporting to be satisfied, or such reporting does not make it out of the review process. The present study, however, adds to mounting evidence that even post hoc techniques, such as the CFA approach, require substantial forethought. In this regard, neither the conceptual arguments built for our sample of markers nor our findings about them suggest the existence of a readily identifiable marker that is applicable in all research.
Building on the latter point, we underscore the variation in findings across the marker, substantive, and measured CMV causes within and between the samples in Study 2. This study particularly illustrates that, in practice, the idealness of a marker is necessarily and deeply constrained by the substantive variables under investigation, as well as by the measures and design through which they are operationalized. Although the importance of selecting theoretically unrelated markers has been previously emphasized, less attention has been given to selecting markers that are true proxies for CMV within a given context and the importance of articulating a conceptual foundation for such expectations. Yet, in the absence of additional data and analyses (such as those presented in Study 2) or further marker-focused research, strong conceptual arguments remain the primary means available for supporting a marker’s suitability and reducing the role of chance when drawing conclusions about CMV from marker analyses.
Another implication of chronic reporting problems is the missed opportunity to collectively build crucial knowledge about CMV in a broad range of research designs in diverse disciplines. As described, most published and unpublished research employing marker techniques reports finding no evidence of CMV or bias. Although some might optimistically conclude from these results that CMV is not problematic in most research, we contend that this considerable literature contributes almost no information about the true nature and prevalence of CMV in real data because of poor marker variable choice and implementation. While this missed opportunity is regrettable, an additional concern is that this extant research might also be dangerously misleading. To wit, our analysis of primary data indicates the potential for bias due to CMV when simultaneously controlling for multiple presumably ideal markers or measured CMV-cause variables, as well as when applying the Siemsen et al. (2010) technique. To the extent that our Study 2 variables, design, and context are broadly similar to those in the reviewed research, this evidence raises the possibility that some of the publications included in Study 1 mistakenly infer CMV or bias is absent.
Finally, inadequate reporting could create a form of moral hazard for researchers. Although a priori procedural remedies have been proposed as superior means for avoiding method effects, CMV is a complex phenomenon that cannot necessarily be eliminated exclusively through design (Lance et al., 2010; Podsakoff et al., 2003; Spector, 1994, 2006). When scholars face legitimate theoretical requirements to collect same-source, same-method data or there are practical needs to do so, they are likely to perceive substantial pressure to provide evidence that their findings are not unduly influenced by CMV. Given the unavailability of prototypical ideal markers to be used across substantive research and the reporting standards that appear acceptable for publication, it would be relatively easy to—either intentionally or unintentionally—employ a marker that confirms CMV is not a problem in one’s data. Rightly or wrongly, hundreds of the studies we reviewed successfully do so. Likewise, when applying a single marker in Study 2, only the most obviously nonideal option (i.e., cognitive trust) indicates the presence of bias.
Recommendations for Researchers and Reviewers
Aside from advice already offered elsewhere, the present research suggests an important recommendation that has received almost no attention in previous work. Namely, as each marker in Study 2 differentially represents the various CMV causes, we posit that it is generally prudent to measure and control for multiple, thoughtfully selected a priori markers than to rely on only one such variable. Although Lindell and Whitney (2001) and L. J. Williams et al. (2010) mention the feasibility of using more than one marker, very few articles in Study 1 did so, and we are unaware of any methodological work directly testing this possibility. When considered in conjunction with results from the Siemsen et al. analyses (i.e., in our own data and from their original study), however, Study 2 results indicate that a single marker is unlikely to have the capacity to reflect all possible CMV causes, and the ability of a single marker to effectively control for the full range of CMV present may decrease as true substantive relationships increase in magnitude (Siemsen et al., 2010). In addition, because doing so is consistent with the latter approach (provided the markers do not exhibit moderate to strong correlations with one another or other substantive variables), collecting multiple markers allows authors to implement both the CFA and Siemsen et al. analyses, and to triangulate between the results provided by each. In instances where the available sample is relatively small and there are concerns about the ratio of parameters to sample size in CFA or SEM, the Siemsen et al. analyses likewise might provide a more practicable alternative for identifying and controlling CMV.
At the same time, another approach suggested by Study 2 is that authors should simply control for multiple measurable CMV causes—and this is an approach (albeit seldom used in our sample of extant research) in which the CFA technique is statistically grounded (e.g., see L. J. Williams & Anderson, 1994). We propose that both of these techniques can be useful, but they also have their disadvantages and may be impractical or inappropriate in certain circumstances. Perhaps the primary advantage of directly measuring potential CMV causes is that doing so enables researchers to expressly identify the kinds of CMV present and to test specific hypotheses about the susceptibility of their substantive data to these types. In addition, the availability of implicit approaches for measuring some presumed CMV causes (e.g., response styles and overclaiming in the present study) could assist researchers in capturing CMV in ways that reduce potential overlap with the substantive content of other study variables. It is not possible, however, to either explicitly or implicitly measure some CMV causes (e.g., implicit theories). In addition, given current theory and evidence, it can be difficult for researchers to accurately distinguish in advance the spectrum of CMV that will be at play in their data. A key advantage of the marker approach is that, with well-chosen markers, it has the potential to capture a much wider range of CMV causes (Podsakoff et al., 2003). That is, because they are proxies rather than specific measures of CMV, markers presumably can detect method variance that is neither expected nor measurable. Nonetheless, it is challenging to select useful markers without advance knowledge of the kinds of CMV likely in one’s data. Measuring either multiple markers or multiple CMV causes also requires adding items (sometimes many) to surveys. Weijters et al. (2008), for example, propose that 42 items are preferred when capturing response styles, and the prospectively ideal markers we examine include three to nine items each.
Given the advantages and disadvantages of each approach, we advocate using the CFA marker technique when researchers (a) can formulate a conceptual foundation for predicting that substantive variables will be similarly influenced by a consistent set of CMV causes, (b) those causes are not all directly measurable, and (c) other nonmeasurable forms of CMV have the potential to be in play. Alternatively, when scholars (a) have strong expectations for CMV due to measurable CMV causes (b) can reasonably argue that those causes are not actually substantive in nature (e.g., in terms of affectivity), and (c) influence from other nonmeasurable forms of CMV seems unlikely, it makes sense to expressly measure the CMV causes rather than their proxies. In reality, though, the most comprehensive and broadly useful approach could be to include both multiple markers and measurable CMV causes—an approach that might be adapted to roughly mimic multitrait-multimethod (MTMM) analyses. Although the practical hurdles of lengthy surveys and highly parameterized models would be heightened under this suggestion, such work would ultimately build a body of meta-analyzable data regarding the effects of CMV on substantive and marker variables. In this way, it would become possible to refine understanding of and theory about CMV and, thus, assist authors in making wise choices about post hoc CMV detection and correction.
An additional practical recommendation suggested by our studies that has received little emphasis in prior work is that, despite Lindell and Whitney’s (2001) advice to use the lowest observed correlation as a proxy for method variance, a marker should have some degree of observed correlation with substantive variables if inflationary CMV is present—a point particularly illustrated in Study 2 (see Tables 4 and 7). If there is no a priori reason to expect a marker and substantive variables to be related and their observed associations are near .00, the logic of marker techniques implies CMV is unlikely to be biasing the relationships upward. If, however, the marker-substantive correlations are large and the assumption of theoretical unrelatedness is plausible, CMV might be substantially inflating truly small relationships—something that will be missed if authors exclusively choose post hoc markers from observed correlations that are at or near .00.
As a final practical recommendation, we note that reviewers and editors have a role in CMV analysis and presentation as well (Pace, 2010). It seems that reviewers often are satisfied with the results of post hoc statistical tests to detect CMV without adequate information about the marker used, or perhaps this information is furnished in the review process but is not included in published articles. Yet, as discussed, such information is critical for the reader to interpret the results of marker analyses. It also seems that reviewers and editors may be willing to accept at face value the claim that the inclusion of a measured CMV cause as a control variable eliminates all concerns about CMV, regardless of whether the authors present any conclusions regarding such variables. Again, Study 2 indicates that, much like individual markers, any one of these variables on its own will not necessarily capture the range of CMV that can be present in data. Depending on the other variables included in the study, in some cases measured CMV causes may likewise capture nontrivial substantive variance instead of method. Reviewers and editors are encouraged to hold authors to the standards given above and in previous work regarding proper choice and reporting of marker variables and measured CMV causes. Recognizing that space is at a premium in most journals, this information could be supplied in online appendices, even if it is not possible to do so in the article itself.
Limitations and Future Research
In Study 1 we were limited to coding only the information reported in each article or dissertation, and many using a marker variable or measured CMV cause report so little about it that we could not judge its efficacy. Thus, a larger number of authors may have used ideal marker variables, but we cannot know. We also were restricted in our ability to code the a priori selection of markers other than in cases where authors explicitly claimed use of an a priori marker. Although we partially gauged marker idealness by looking at these claims and the marker’s format when this information was provided, because of the broad range of research topics in our sample and the minimal information often provided about the markers, we were unable to verify these claims. Finally, as mentioned, our requests for unpublished data including or implementing markers and measurable CMV causes produced no usable responses. Thus, it was impossible to compare published versus unpublished research as extensively as we had originally hoped.
The primary limitation in Study 2 is one that affects all field research and, indeed, is a key reason why CMV continues to capture attention from researchers. Namely, we cannot truly know how much or what method variance distorts substantive relationships or substantive-marker relationships in our data. It therefore remains impossible to ascertain the entirety of what the markers capture when applied using the CFA technique or just how accurate conclusions based on results from this technique are in a single study. Nonetheless, this is the first study that attempts to empirically measure some of the causes of CMV that might distort both markers and substantive variables. An additional challenge is that, just as it is impossible to measure all causes of method variance, we also cannot measure all possible substantive variables and markers. Future research is needed to explore the joint effects of measurable CMV causes in a full range of substantive and marker variables, including those that are more focused on capturing attitudes and the behaviors of self and others.
A final limitation of both studies is that, despite our almost exclusive focus on marker techniques, we do not mean to imply these are the best or only means by which researchers can identify and control for CMV. While the statistical option of MTMM analyses remains the gold standard for partialling method from substantive variance (Lance et al., 2010), this option cannot be operationalized without employing procedural remedies for CMV as well (i.e., actually measuring constructs using different methods). Another statistical option is repeated measure designs with within-person centering as a way of controlling individuals’ response tendencies across multiple observations. Yet, as with marker techniques, these and other alternatives also will not be universally feasible in all research contexts. What is universal, however, is the need for good measurement and research design (Hardy & Ford, 2014). Poor measures, which were observed in a surprising number of Study 1 articles, fail to satisfactorily capture their intended constructs regardless of CMV, but also enhance the potential for method-based distortion.
The forgoing indicates considerable challenges when it comes to selecting appropriate and useful marker variables for a given study, but we contend that these hurdles do not have to be insurmountable. Following the six best practices described earlier is a good starting point for authors wishing to implement the CFA marker technique or directly control for presumed CMV causes. In addition, as previously argued, authors should give careful forethought to selecting markers that will be similarly susceptible to the same causes of CMV as other study variables and draw from existing research on CMV, measurement, research design, and cognitive response processes to clearly articulate the rationale underlying their choices. Following the advice of Schmitt (1994), authors might begin by formulating thorough answers to the following questions when planning a study: In what way might method influence the measurement of the substantive constructs of interest? What is the motivational context in which the data will be collected (e.g., will respondents have a reason to present themselves in a positive light)? And what can be done to measure method effects and provide valid interpretations of substantive results despite the potential presence of such effects? We hope that the description of and rationale for the markers and CMV causes in Study 2, although imperfect, might be helpful in this regard.
Useful future research will include accumulation of substantive studies appropriately applying and reporting marker techniques, but also methodological research focused on marker techniques and CMV causes. For example, applying markers to data in which researchers have attempted to deliberately induce various CMV causes could shed further light on the conditions in which markers effectively function as proxies for CMV. We likewise believe that, just as implicit measures of substantive variables present opportunities for explaining unique variance (and, indeed, represent distinct measurement methods relative to explicit self-reports; Bowling & Johnson, 2013), implicit measures of method itself have the potential to expand our understanding of and ability to detect method effects. In the present study, response styles and overclaiming are examples of implicit approaches to measuring presumed CMV causes. Implicit approaches have been proposed for controlling social desirability as well (De Jong, Pieters, & Fox, 2010). Taking this notion further, measurement techniques taken from neuroscience (e.g., brain imaging, skin conductance tests) open up numerable prospects for understanding the cognitive processes surrounding CMV-distorted responses and also for measuring potential CMV causes like respondent state affectivity. Finally, with the exception of notable studies (i.e., Butts, Vandenberg, & Williams, 2006; Johnson et al., 2011), very little work has considered the role of CMV in higher-level constructs, multigroup settings, or multilevel contexts. Yet these represent far more complex measurement situations that are worthy of dedicated investigation.
To conclude, despite the uncertainty involved and the need for extensive future work, the present research contributes evidence that, when used in an appropriate way, the CFA marker technique can be a viable option for researchers to confront concerns about CMV. Furthermore, with meticulous reporting, future use of this technique might meaningfully contribute to understanding of how method affects measurement, in turn helping to build much-needed theory about the nature and prevalence of CMV.
Footnotes
Acknowledgments
A prior version of this article was presented at the annual Southern Management Association meeting, Fort Lauderdale, FL, November 2012. Thank you to Associate Editor Brian Boyd and three anonymous reviewers for their insightful and helpful comments. We also appreciate the feedback provided by Michael Sturman and Terri Scandura on earlier drafts. We are grateful to Jixia Yang, Kevin Mossholder, and T. K. Peng for generously allowing us to reanalyze their original data.
Declaration of Conflicting Interests
The author(s) declared no potential conflicts of interest with respect to the research, authorship, and/or publication of this article.
Funding
The author(s) received no financial support for the research, authorship, and/or publication of this article.