
Abstract
In recent years, researchers have devoted greater attention to insufficient effort responding (IER), in which participants fail to attend to instructions, do not read item content carefully, or intentionally engage in random responding. While IER is typically considered a purely methodological concern, recent research has begun to examine whether it also has a substantive basis (e.g., personality). Here we extend the nomological network surrounding IER by examining the role of implicit aggression. In three studies, we demonstrate that higher levels of implicit aggression are indeed related to IER even after controlling for previously established correlates of IER. Furthermore, we also demonstrate that IER, as measured by the selection of illogical responses to Conditional Reasoning Tests of Aggression, can predict theoretically relevant behavioral criteria. The theoretical and practical implications of this work are discussed.
Organizational researchers often assume that participants are motivated to respond carefully and honestly, at least within the context of their self-perceptions (e.g., see Stewart, Bing, Davison, Woehr, & McIntyre, 2009). However, research demonstrates that measurement is often confounded by errors and response biases that contaminate responses with construct-irrelevant variance (Messick, 1995). Researchers have recently returned their attention to one of these errors, insufficient effort responding (IER; e.g., Bowling et al., 2016; Credé, 2010; DeSimone, Harms, & DeSimone, 2015; Huang, Bowling, Liu, & Li, 2015; Huang, Curran, Keeney, Poposki, & DeShon, 2012; Huang, Liu, & Bowling, 2015). IER reflects a lack of effort due to inattention or a failure to read items carefully. For example, some participants provide random or invariant responses to survey items (DeSimone, DeSimone, Harms, & Wood, 2018; Krosnick, 1991; Krosnick & Alwin, 1989). Researchers can detect IER using behavioral checks such as timed responses and bogus or instructed items (Johnson, 2005; Meade & Craig, 2012). Other researchers attempt to deter IER by warning participants that engaging in IER will have consequences (Huang et al., 2012).
Until recently, IER-related errors were considered a purely methodological phenomenon. Specifically, when participants exhibit IER, their responses to survey measures may be difficult to interpret as those responses may reflect variance unrelated to the construct of interest. Many researchers view IER as a form of measurement error and consider any reduction in sample size associated with screening participants to be a drawback of survey research. However, it is plausible that IER also has a substantive, motivational component. If IER is related to a lack of motivation to respond carefully, then some variance in careless responding may be attributable to enduring individual differences. In support of this proposition, Bowling et al. (2016) found that IER is (a) consistently exhibited across surveys and (b) significantly and negatively correlated with acquaintance-reported conscientiousness, agreeableness, extraversion, and emotional stability. Similarly, Huang, Liu, et al. (2015, Study 3) reported that IER is related to traits such as core self-evaluations and negative affectivity. Thus, emerging evidence demonstrates that IER may reflect more than simple random measurement error.
IER is not the only response tendency demonstrated to have personality correlates. Investigations of the relationships between individual differences and response styles date back more than 50 years. For example, Couch and Keniston (1960) found that acquiescence is associated with impulsivity and anxiety. Hamilton (1968) suggested that a preference for extreme response options may be associated with ambiguity intolerance or emotionality. Other response tendencies such as social desirability are often considered standalone individual difference variables (Paulhus, 1984; Spector, 2006).
Organizational research stands to benefit from attempts to identify substantive explanations for (or correlates of) response tendencies such as IER. If response tendencies reflect more than simple methodological nuisance variables, researchers should be able to predict and account for these behaviors. Exploring the nomological network surrounding these phenomena will allow researchers to understand their causes, correlates, and consequences. Ultimately, researchers should be able to treat response tendencies as specific behaviors and incorporate them into models to enhance our ability to explain organizational outcomes.
Overview of Current Studies
The purpose of this paper is to investigate the possibility that IER is related to individual differences in aggressive tendencies. Specifically, we focus our hypotheses on the relationship between IER and implicit aggression, defined as a nonconscious cognitive preparedness to harm others (James et al., 2005). Implicit constructs represent drives or needs and have been linked to consistent behavioral trends over time. In contrast, explicit constructs have been linked to immediate choices and behavioral intensity (McClelland, Kostner, & Weinberger, 1989). Previous research on the personality correlates of IER (e.g., Bowling et al., 2016; Huang, Liu, et al., 2015) have focused on explicit measures such as self- or peer reports. Here, we aim to expand the nomological network of IER to include implicit aggression as measured by the Conditional Reasoning Tests for Aggression (CRTA), an indirect implicit measure that is less susceptible to socially desirable responding and intentional faking than self-report measures (LeBreton, Barksdale, Robin, & James, 2007; Wiita, Meyer, Kelly, & Collins, 2020).
In Study 1, we examine the initial question of whether CRTA scores are related to IER in the form of missing or illogical responses on a CRTA using item response theory (IRT) techniques with a large sample. Study 2 extends the findings of the first study by examining the relationship between CRTA scores and two measures of IER, including a traditional IER index from a self-report measure. Finally, Study 3 extends these investigations by examining the ability of IER to predict traffic violations, a criterion that is conceptually related to both insufficient effort (i.e., inattentiveness) and aggression. In generating our hypotheses, we review research on IER, particularly with respect to the possibility that there may be substantive (i.e., trait-driven) components to IER.
Literature Review and Hypotheses
Many factors influence the ability or motivation to respond with effort. A respondent’s ability to respond carefully may be influenced by cognitive ability or the presence of environmental distractions (Goldberg & Kilkowski, 1985; Ludeke & Makransky, 2016). The motivation to respond carefully is related to respondent interest (Meade & Craig, 2012) and personality (Bowling et al., 2016; Huang, Liu, et al., 2015). Here, we propose that individuals with aggressive tendencies may also be more likely to respond carelessly because IER may serve as a behavioral manifestation of aggression. According to the frustration-aggression hypothesis, frustration pertaining to the blockage of goal attainment can lead to aggression, particularly against entities associated with the frustration (Berkowitz, 1989; Dollard, Miller, Doob, Mowrer, & Sears, 1939). Indeed, James et al. (2005) note that “aggressive individuals are predisposed to respond to frustrating situations…with anger, accompanied by desires to inflict harm on the perceived source of the anger” (p. 72).
Compared to nonaggressive individuals, aggressive individuals should be more likely to become frustrated with surveys and questionnaires. Survey research administrators may be perceived as entities associated with frustration (Bing et al., 2007). Research procedures, including lengthy or cognitively demanding surveys, can be viewed as frustrating stimuli that require time, effort, and attention. As Schultz (1969, p. 222) noted, a participant “may want to foul up the experimenter’s research by responding in the ‘wrong’ way…what Masling (1966) called ‘the screw you effect.’…Some subjects resent compulsory participation and might wish to perpetrate revenge on the experimenter.” In this respect, some participants may use IER as a way to retaliate against the researcher.
Additionally, aggressive individuals may be less likely to comply with researchers’ attempts to elicit attentive responses. Individuals who discount societal norms may be unpersuaded by explanations of the societal benefits that may accrue from attentive study participation (James et al., 2005). IER may reflect the aggressive tendencies of individuals who actively or passively discount societal benefits, generate useless data, waste researchers’ time, and detract from the validity or utility of the research. Consequently, we propose that individuals with aggressive tendencies will be inclined to engage in IER. Hypothesis 1: Insufficient effort responding will be positively associated with implicit aggression.
Using the CRTA allows us the opportunity to explore the theoretical mechanisms underlying a link between implicit aggression and IER. CRTA items draw on nonconscious cognitive biases known as justification mechanisms (JMs) to inform item content. The developers of the CRTA wrote items that reflect some JMs that individuals may use to justify aggressive behavior (see James, 1998; James & Mazerolle, 2002). Specifically, the CRTA can be divided into five JM-based subscales (as described in James et al., 2005). Our studies will explore which of these subscales are most strongly linked to IER.
The exploratory nature of our research question stems from the fact that multiple JMs can be theoretically linked to IER. For example, aggressive individuals may see themselves as victims or believe that others have hostile intent. In cases such as these, aggressive individuals may actively or passively retaliate against another party in a manner consistent with the interpersonal dynamic mentioned previously in our description of the frustration-aggression hypothesis. Aggressive individuals may also dismiss social norms and customs, leading them to reject researchers’ attempts to encourage effortful responding by touting the societal benefits of research. Accordingly, JMs focusing on social discounting and the preference for retribution over relationship maintenance are also worth exploring. Research Question: Which justification mechanisms are most strongly related to IER?
As noted earlier, certain personality traits have been empirically linked to IER, including conscientiousness. For example, Bowling et al. (2016) note that conscientiousness is related to “the motivation to be attentive and the motivation to comply” (p. 219). Given the low to moderate correlations typically found between explicit aggression and conscientiousness (Barlett & Anderson, 2012; Sharpe & Desai, 2001), we expect that aggression will contribute to the prediction of IER beyond conscientiousness. Huang, Liu, et al. (2015) found that facets of conscientiousness were related to IER, with achievement striving, dutifulness, and self-efficacy correlating negatively with IER at magnitudes of .40 or above. Therefore, the incremental variance of aggression can be established through comparing aggression to these facets. Hypothesis 2: CRTA aggression scores will explain variance in IER after controlling for facets of conscientiousness.
As noted previously, if IER is influenced by individual differences such as personality, then IER should have utility beyond simple consideration as a methodological nuisance variable. To date, little research has investigated IER as a possible predictor of behavioral outcomes. If IER has a substantive basis, then it should be able to predict behavioral outcomes that are also related to a lack of effort or attention. The presence of such predictive relationships would establish the utility of research expanding the nomological network surrounding IER. Our third study will investigate the comparative criterion-related validity of implicit aggression, conscientiousness, and IER with an outcome theoretically linked to each of these predictors—traffic violations. Previous research has established links between traffic violations and individual differences in carelessness, recklessness, and feelings of obligation to obey the law (West, 1995; Yagil, 1998). While traffic violations may be the result of many factors, repeated violations likely indicate a more stable lack of attention or tendency to disregard rules and laws. For example, such violations may reflect inattentiveness (e.g., failing to notice signs), retaliation against societal norms (e.g., reckless driving), or a propensity to not follow rules (e.g., breaking the law). Thus, we expect that aggression, conscientiousness, and IER may each be valid predictors of such a criterion. As such, we investigate the incremental validity of IER for predicting traffic violations after accounting for implicit aggression and conscientiousness. Hypothesis 3: CRTA distractor scale scores (i.e., IER) will predict traffic violations.
Study 1: Method
Participants and Procedure
Data for Study 1 came from the CRTA response database, which contains 22 data sets collected through independent studies conducted between the years 2000 and 2011. This combined data set included 5,652 participants who completed the current version of the CRTA. 1 Employing the screening technique suggested in the CRTA test manual (James & McIntyre, 2000) would have resulted in eliminating 141 (2.49%) of the participants. However, because the suggested screening technique eliminates participants on the basis of missing and illogical item responses, which are the focus of the current analyses, all participants were retained.
Measure
The CRTA used in Study 1 contains 22 items measuring implicit aggression. Items are written in the style of inductive reasoning problems, and participants are asked to identify the most logical response from four options. Each CRTA item contains one logical “aggressive” response option intended to appeal to participants who are cognitively prepared to rationalize aggressive behavior and one logical “nonaggressive” response option intended to appeal to participants who lack such preparedness. Each item also contains two illogical response options that serve to maintain the façade of the CRTA as a reasoning test but should appear to attentive participants as obviously incorrect. There are multiple reasons why a participant might select an illogical option, including a lack of attention or effort (i.e., IER), misunderstanding of item content, or lack of inferential reasoning ability (James & McIntyre, 2000). 2 Illogical responses are rarely selected (DeSimone & James, 2015) but seem to serve their purpose as participants are rarely able to discern the true nature of the CRTA, making the CRTA more resistant to faking than traditional self-report measures (LeBreton et al., 2007).
The CRTA test manual (James & McIntyre, 2000) suggests scoring the CRTA dichotomously (+1 for logical aggressive responses, 0 for all other responses). However, this scoring system does not differentiate between logical nonaggressive responses, illogical responses, and missing responses. Because our investigation focuses on illogical responses, it is important to differentiate between illogical responses and logical nonaggressive responses. Accordingly, we scored the CRTA trichotomously (see James, 1998). Specifically, aggressive logical responses were assigned a value of +1, illogical responses a value of 0, and logical nonaggressive responses a value of –1. By differentiating between nonaggressive and illogical responses, we are able to determine if the number of distractors chosen correlated with the number of aggressive responses chosen as hypothesized.
For each participant, we computed a total CRTA score (with possible scores ranging from –22 to +22) and five JM-specific subscale scores (James et al., 2005). An internal consistency estimate of .76 was computed for the CRTA using the technique outlined in James and LeBreton (2012). The number of aggressive, nonaggressive, distractor, and missing responses were also computed for each participant. Leaving an item blank or selecting an illogical distractor reduces the possible number of logical aggressive and nonaggressive responses, resulting in a smaller range of possible CRTA/subscale scores. To address this, the number of logical aggressive responses was divided by the total number of logical responses for each participant, yielding a quantity representing the proportion of logical responses that were aggressive (as opposed to nonaggressive), which we refer to as the proportion of aggressive responses (PAR).
Study 1: Results and Discussion
Prevalence of Missing and Illogical Responses
Consistent with previous literature (DeSimone & James, 2015; James et al., 2005), missing and illogical data were rare. Missing item rates ranged from 0.07% (Item 4) to 1.24% (Item 22). Illogical item rates ranged from 0.72% (Item 3) to 4.97% (Item 16). Only 1,572 respondents (27.81%) selected an illogical response, and only 158 (2.80%) had a missing response. There were more illogical responses on the second half of the CRTA than the first half. Specifically, the average percentage of illogical responses per item was 1.69% for the first 11 items and 3.19% for the last 11 items (z = –3.72, p < .05). These findings are consistent with the idea that continued responding may be associated with escalating frustration (Berkowitz, 1989; Dollard et al., 1939). Although frustration may increase over the course of a test, this analysis does not directly link aggression and IER.
Correlations Among Aggressive, Illogical, and Missing Responses
Correlations between CRTA scores, subscale scores, PAR scores, missing responses, and illogical responses can be found in Table 1. Missing responses were uncorrelated with both illogical responses and PAR scores. Illogical responses were correlated with PAR at .29 (SE = .01) and aggression scores at .36 (SE = .01), indicating a positive relationship between IER and implicit aggression. 3 These relationships support Hypothesis 1. Due to the small number of missing responses and the near-zero correlations between aggression and missing responses, the remainder of this paper will focus solely on illogical responses as an indicator of IER.
Descriptive Statistics and Correlations for Study 1 Variables.
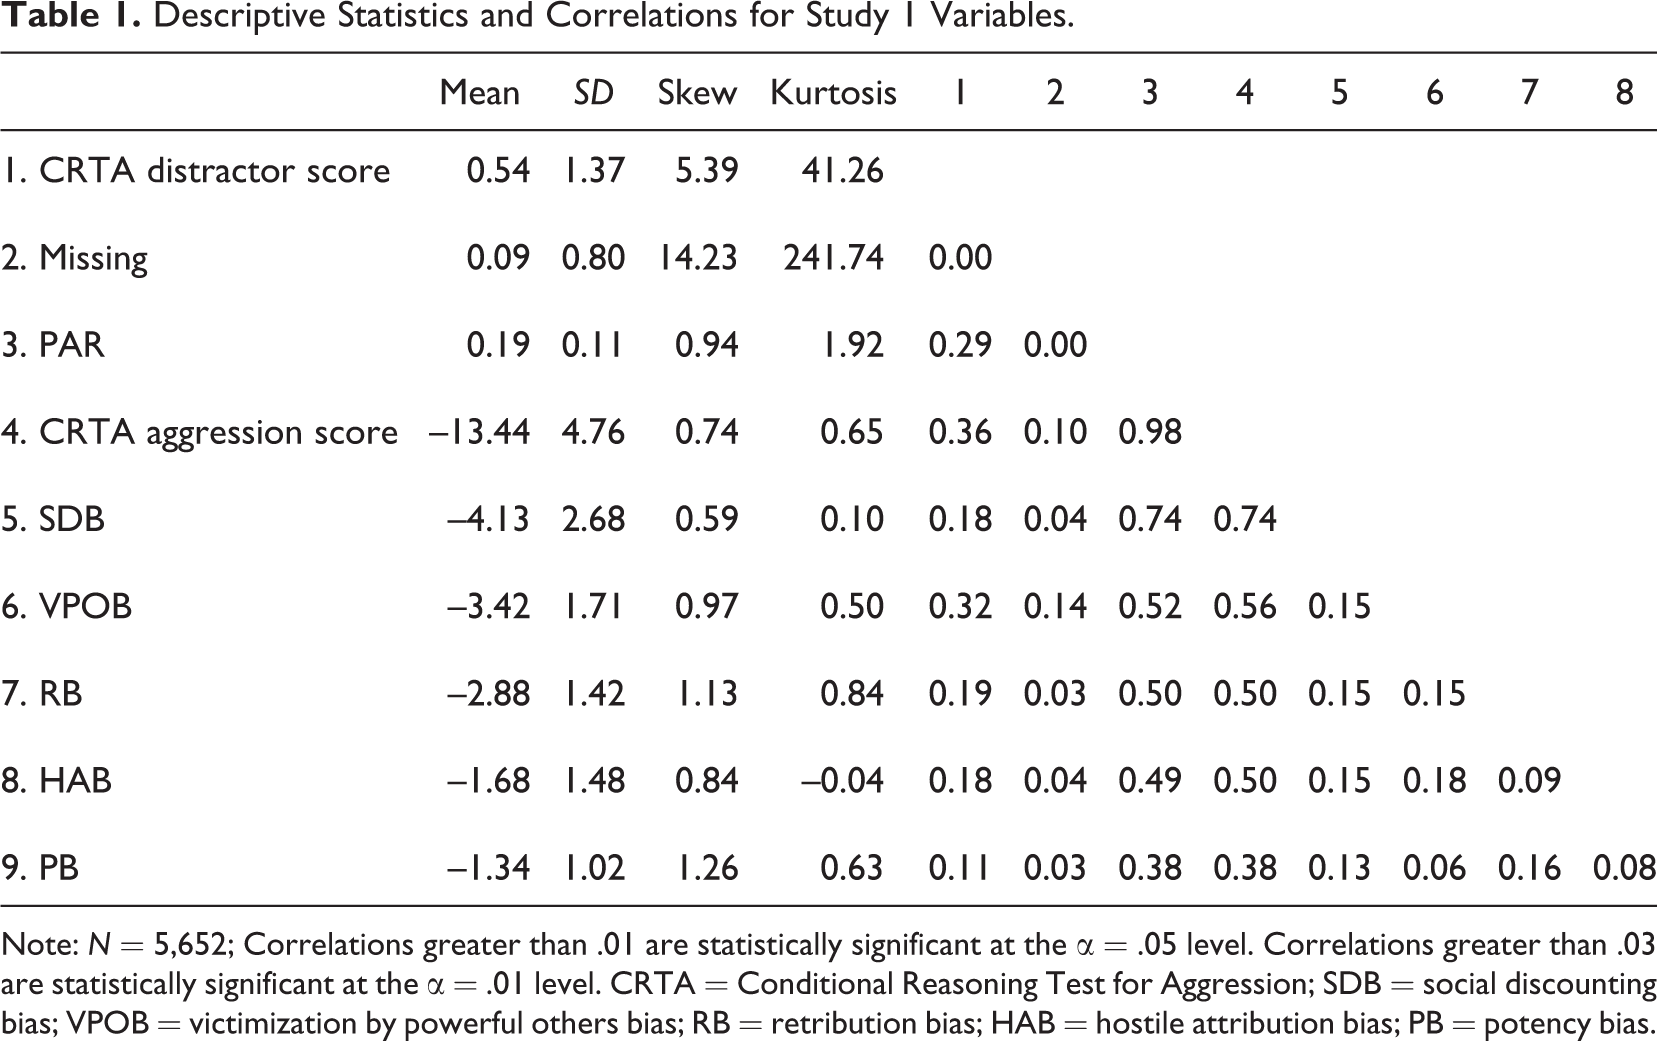
Note: N = 5,652; Correlations greater than .01 are statistically significant at the α = .05 level. Correlations greater than .03 are statistically significant at the α = .01 level. CRTA = Conditional Reasoning Test for Aggression; SDB = social discounting bias; VPOB = victimization by powerful others bias; RB = retribution bias; HAB = hostile attribution bias; PB = potency bias.
To address our research question, we explored the relationships between illogical responses and JM-based subscales. Illogical responses were positively and significantly correlated with all five subscales (rs from .11 to .32, all p < .01), with the victimization by powerful others (VPO) bias demonstrating the strongest relationship. This result is consistent with the idea that some aggressive respondents view the research or researcher as a source of frustration. VPO bias is described by James (1998) as a “tendency to frame self as a victim and to see self as being exploited and taken advantage of by the powerful” (p. 155). Participants with a VPO bias may view research procedures as frustrating or interpret the researcher-participant relationship as power inequity. This finding is intriguing in light of Schultz’s (1969) description of the aforementioned “screw you effect” as the intent of research participants to harm the researcher’s findings. However, replication of these JM-based effects is necessary to further explore the extent to which JMs influence IER.
Influence of the Five or More Missing/Illogical Responses Screen
The CRTA test manual recommends excluding participants with five or more illogical and/or missing responses. However, the presence of a relationship between illogical and aggressive responding suggests that excluding participants who select many illogical responses may remove some of the more aggressive respondents from the data set. To investigate this phenomenon, we split the sample into participants who would be excluded based on this screening technique (n = 141) and those who would be retained (n = 5,511). Excluded participants demonstrated substantially higher (i.e., more aggressive) CRTA scores than retained participants (–4.69 and –13.66, respectively, t[145.53] = –20.35, d = –1.97, p < .01). Excluded participants also had higher PAR scores than retained participants (.34 and .18, respectively, z = 4.67, difference = .16, p < .01). In fact, excluded participants indicated more logical aggressive responses on average than retained participants despite providing logical responses to fewer items (4.46 and 3.95, respectively, t[145.67] = 2.38, d = 0.23, p < .01). Additionally, the correlations between illogical responses and CRTA scores was .51 for excluded participants and .22 for retained participants (z = 3.93, p < .01), and correlations between illogical responses and PAR scores was .57 for excluded participants and .13 for retained participants (z = 6.00, p < .01).
IRT Analysis
DeSimone and James (2015) analyzed the CRTA with multiple IRT models, concluding that a two-parameter logistic (2PL; Birnbaum, 1968) model was superior to one- and three-parameter dichotomous IRT models and a nominal response model (NRM; Bock, 1972) was the most appropriate polytomous model. CRTA items have positive difficulty estimates that suggest negative item skew. While their sample size was large enough to mitigate the undesirable effects of non-normality in the 2PL model (De Ayala & Sava-Bolesta, 1999), the NRM may be the more appropriate model due to both negative item skew and qualitative differences between aggressive, nonaggressive, and illogical responses.
DeSimone and James (2015, Appendix A) note that NRM item characteristic curves reveal flat or monotonically increasing slopes for illogical response options. If illogical responding were related to latent implicit aggression, we would expect illogical response slopes to increase as aggression increases. However, this relationship would be difficult to observe in their analysis due to their reliance on the five or more missing/illogical response screen to exclude participants with many illogical responses, which necessarily restricts the range of illogical responses. We ran the NRM with our full sample to explore whether the inclusion of participants who would normally be excluded when using this screening technique would change the NRM item characteristic curves in accordance with this expectation. For this analysis, we used IRTPRO 4.0, which uses marginal maximum likelihood estimation and models missing responses using a combination of observed data and parameter estimates (Bock & Aitken, 1981; Lord, 1983).
The NRM had an M2(880) value of 2,399.99 (p < .01, root mean square error of approximation = .02), Akaike Information Criterion of 129,259.07, and Bayesian Information Criterion of 129,843.37. Figure 1 contains the total information and standard error curves and an example item characteristic curve for the NRM. Other item characteristic curves are available by request from the corresponding author. Consistent with DeSimone and James’ (2015) results, the nonaggressive response curves decrease monotonically as theta (θ) increases, and the illogical and aggressive response curves increase monotonically as theta increases in all 22 items. Most aggressive response curves increase to their maximum (at θ > 1.5) before decreasing. These findings are congruent with DeSimone and James’s conclusion that the CRTA differentiates best at high levels of implicit aggression but also suggest that the probability of selecting an illogical response increases as latent implicit aggression increases.
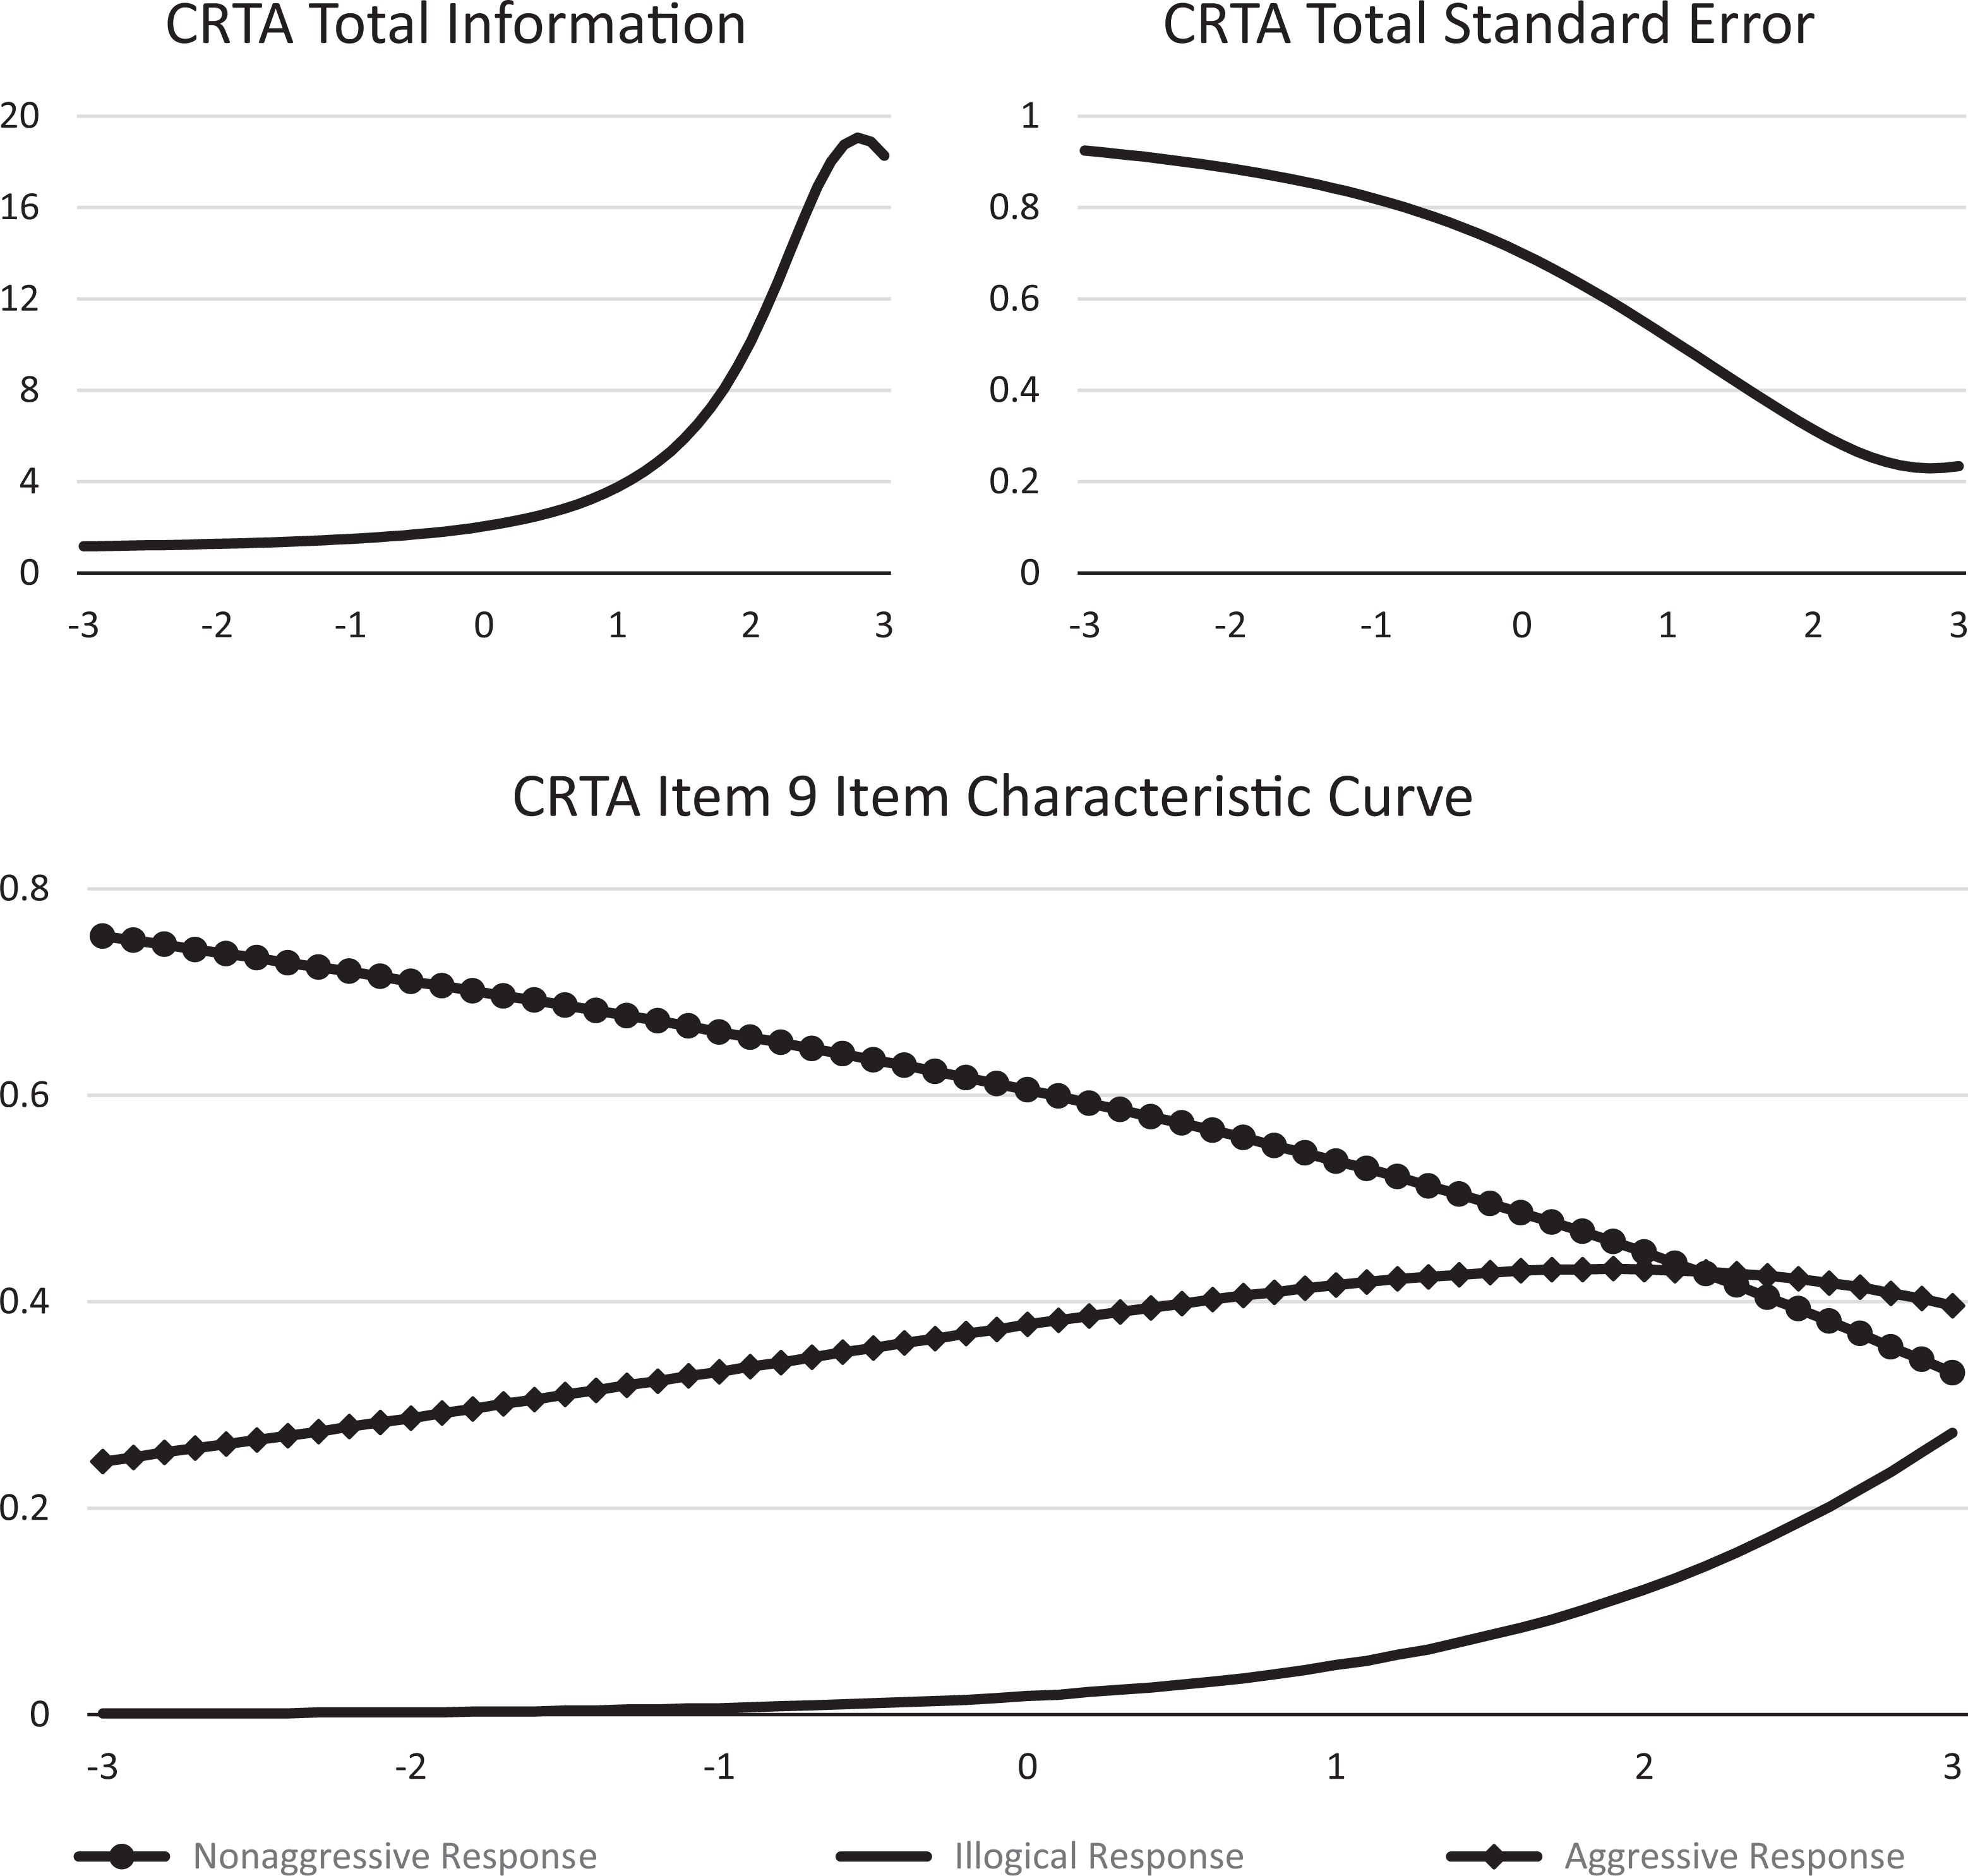
Test-level information/standard error curves and an example nominal response model item characteristic curve for a Conditional Reasoning Test of Aggression item.
Conclusions
Our results suggest that illogical responding on CRTA items is related to latent implicit aggression. Hypothesis 1, suggesting IER and implicit aggression are related, was supported by the positive correlations between IER and both PAR and CRTA aggression scores. The effect size for the relationship between IER and aggression (.29) is consistent with those reported by previous research on other personality traits (e.g., r = –.22 between IER and conscientiousness; Bowling et al., 2016). These observed correlations are different from what we would expect if IER were solely driven by purely random responding (see Appendix). The similar directions of aggressive and illogical response slopes in NRM item characteristic curves also support our contention that IER is related to implicit aggression. Finally, the VPO subscale served as the best JM-based predictor of illogical responding, lending support to the idea that aggressive respondents may view researchers as entities associated with frustration. Based on these results, we conclude that the nomological network surrounding IER contains the construct of implicit aggression.
Ample empirical evidence suggests that CRTA scores predict aggressive behavior (James et al., 2005; James & LeBreton, 2012). Given the relationship between aggression and IER, it is plausible that illogical CRTA responding has explanatory power for predicting both aggressive and careless behavior. Study 2 seeks to replicate the positive relationship between CRTA scale scores and illogical responding and examines the relationship of CRTA aggression and distractor scores with a self-report indicator of IER.
Study 2: Method
Participants
Study 2 recruited pairs (i.e., dyads) of students who knew each other to participate in a survey research study. Participants included 136 students enrolled at a large university in the southeastern United States. They ranged from 17 to 46 years in age (M = 20.27, SD = 4.45) and were 65% female. Participants received extra credit in their courses for participating. Dyadic relationships ranged in acquaintance from 2 months to 35 years (M = 5.45, SD = 6.08). The intraclass correlation coefficient (ICC) for the dyadic report of the amount of time the individuals within each dyad knew each other indicated a sufficient level of agreement (ICC(1) = .95; LeBreton & Senter, 2008).
Procedure and Measures
Participants arrived as dyads and sat on opposite sides of the room when completing their respective surveys. Participants completed a 25-item version of the CRTA, which includes the same 22 CRTA items analyzed in Study 1 as well as 3 additional CRTA items (Bing et al., 2007). An internal consistency estimate of .68 was computed using the technique outlined in James and LeBreton (2012). Consistent with Study 1, the CRTA and its JM-based subscale scores were computed using the trichotomous scoring method. As in Study 1, PAR was calculated as an alternative scoring technique to account for differences in illogical response rates. The CRTA was also scored to assess IER, with illogical distractor responses assigned a +1 and logical responses assigned a 0. The mean item response for this scoring system provided the percentage of illogical distractors chosen by each participant (i.e., the CRTA distractor scale scores). Missing responses to CRTA items were also scored with a +1, but there were only three missing responses (provided by two participants) on the CRTA in this sample.
The CRTA was followed by a self-report survey that included the Personality Research Form A’s (PRF; Jackson, 1968) 20-item aggression scale (α = .66) and two PRF infrequency items as an indicator of IER (i.e., “I have never ridden in an automobile” and “I am able to breathe”). The PRF item response options ranged from 1 (strongly disagree) to 5 (strongly agree), and scale scores were computed via the mean item response such that higher scores indicated higher levels of explicit aggression and IER.
Participants also completed the eight-item NEO-PI-R Achievement Striving scale (Costa & McCrae, 1992) using the same five-option response scale as the PRF (α = .75). Achievement striving is a facet of conscientiousness and has been shown to correlate –.41 with IER (Huang, Liu, et al., 2015). Descriptive statistics and Pearson correlations for all scales can be found in Table 2.
Alphas, Intraclass Correlations, Partial Eta Squared Values, and −2 Log Likelihood Ratios for Focal Study 2 Variables
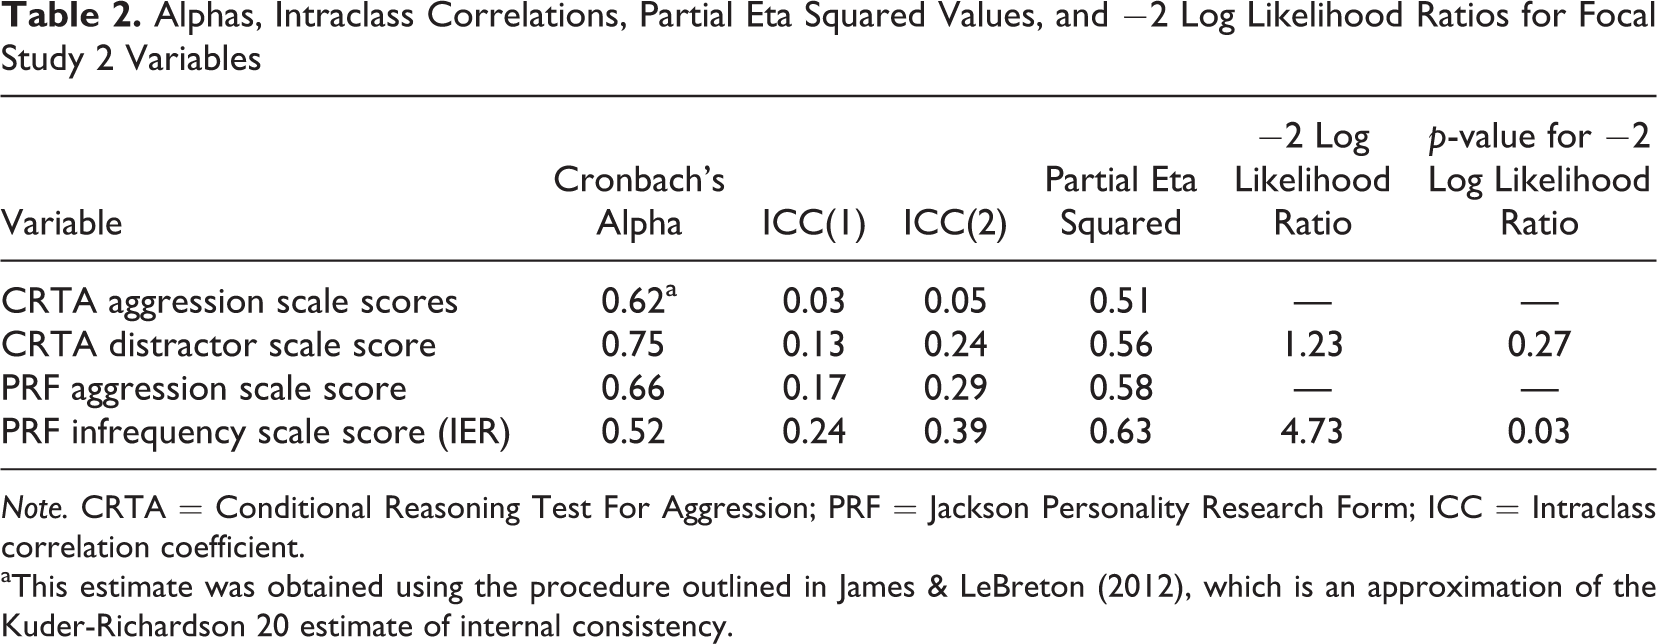
Note. CRTA = Conditional Reasoning Test For Aggression; PRF = Jackson Personality Research Form; ICC = Intraclass correlation coefficient.
aThis estimate was obtained using the procedure outlined in James & LeBreton (2012), which is an approximation of the Kuder-Richardson 20 estimate of internal consistency.
Given the nested nature of the data, all regression analyses were conducted using multilevel random coefficient modeling (MRCM) with the R program (R Core Team, 2016). Here, the nesting of the paired dyads served as a nuisance variable because relational phenomena were not of interest (Krasikova & LeBreton, 2012). However, the nonindependent nature of these multilevel data necessitated the use of MRCM to obtain accurate results (Bliese & Hanges, 2004; Gooty & Yammarino, 2011; Kenny, Kashy, & Cook, 2006). As both members of the dyad completed the exact same questionnaire, fixed slopes within a multilevel modeling framework served as our preferred method of analysis (see Krasikova & LeBreton, 2012, p. 743, Figure 1).
Study 2: Results and Discussion
Illogical item rates ranged from 0% (Item 17) to 8.80% (Item 11). Missing item rates were 0% for most items but 0.7% for Items 11, 12, and 13. Only 2 respondents (1.47%) had one or more missing responses, and 45 respondents (33.09%) selected at least one illogical response. Illogical responses were more common on the first half of the CRTA (first 13 items; 3.09%) than the last half (last 12 items; 2.38%), though this difference was not statistically significant (z = 1.49). Therefore, the results of the first/second half analysis for illogical responding in Study 2 do not support our proposed frustration-aggression framework. We did not conduct a first/second half analysis for missing data because of their low base rate.
Internal consistency reliability estimates (i.e., coefficient alphas), ICC(1), ICC(2), partial eta squared values for the dyadic effect, and –2 log likelihood ratio tests based on the chi-square distribution for the determination of significant dyadic intercept variance (for the relevant variables) are presented in Table 2 for the CRTA and PRF estimates of aggression and IER. As noted earlier, dyadic slopes were not modeled. As the ICC(1) in Table 2 shows, there was clearly a case of dyadic nonindependence in the data as revealed by the fact that 24% of the variance in the Jackson PRF infrequency scale scores was attributable to dyadic membership. Partial eta squared values used to estimate the effect of dyadic membership on the study variables ranged from .63 for the Jackson PRF infrequency scale scores to .51 for the CRTA aggression scale scores. Furthermore, with respect to the infrequency scale score (i.e., IER), the significant –2 log likelihood ratio of 4.73 (p < .05) revealed that the model with random intercepts had a significantly better fit to the data than the model without random intercepts, again supporting the need for MRCM in these analyses.
Correlations Between Aggressive and Illogical Responses
While controlling for the nested nature of the data using MRCM, PAR scores were correlated with CRTA aggression scale scores, as they were in Study 1 (.99, p < .05). Distractor scores correlated with PAR scores at .34 (p < .05) and CRTA aggression scale scores at .42 (p < .05). Additionally, PAR and CRTA aggression scale scores positively correlated with Jackson PRF infrequency scale scores (both .19, p < .05). Taken together, these results provide further support for Hypothesis 1, suggesting that implicit aggression is positively related to IER.
Surprisingly, IER assessed by CRTA distractor scale scores was not significantly correlated with IER assessed by the Jackson PRF infrequency scale (.07, ns). This suggests a qualitative difference between IER expressed by PRF infrequency item responses and IER expressed by the selection of CRTA distractors. Although consistent with research demonstrating that IER can take multiple forms (DeSimone et al., 2018; Meade & Craig, 2012), this result is surprising given the fact that both forms of IER could plausibly be related to inattentiveness. The small relationship between these forms of IER is also surprising given their common correlation with implicit aggression as assessed by CRTA scores.
To address our research question, we again assessed the correlation of each JM-based subscale with CRTA distractor scale scores. All relationships were positive and statistically significant (see Table 3). We also correlated each JM-based subscale with the PRF infrequency index. Only VPO bias (r = .23, p < .05) was a significant predictor of infrequency scale scores, although potency bias approached significance (r = .14, p < .10).
Descriptive Statistics and Correlations Among Study 2 Variables.
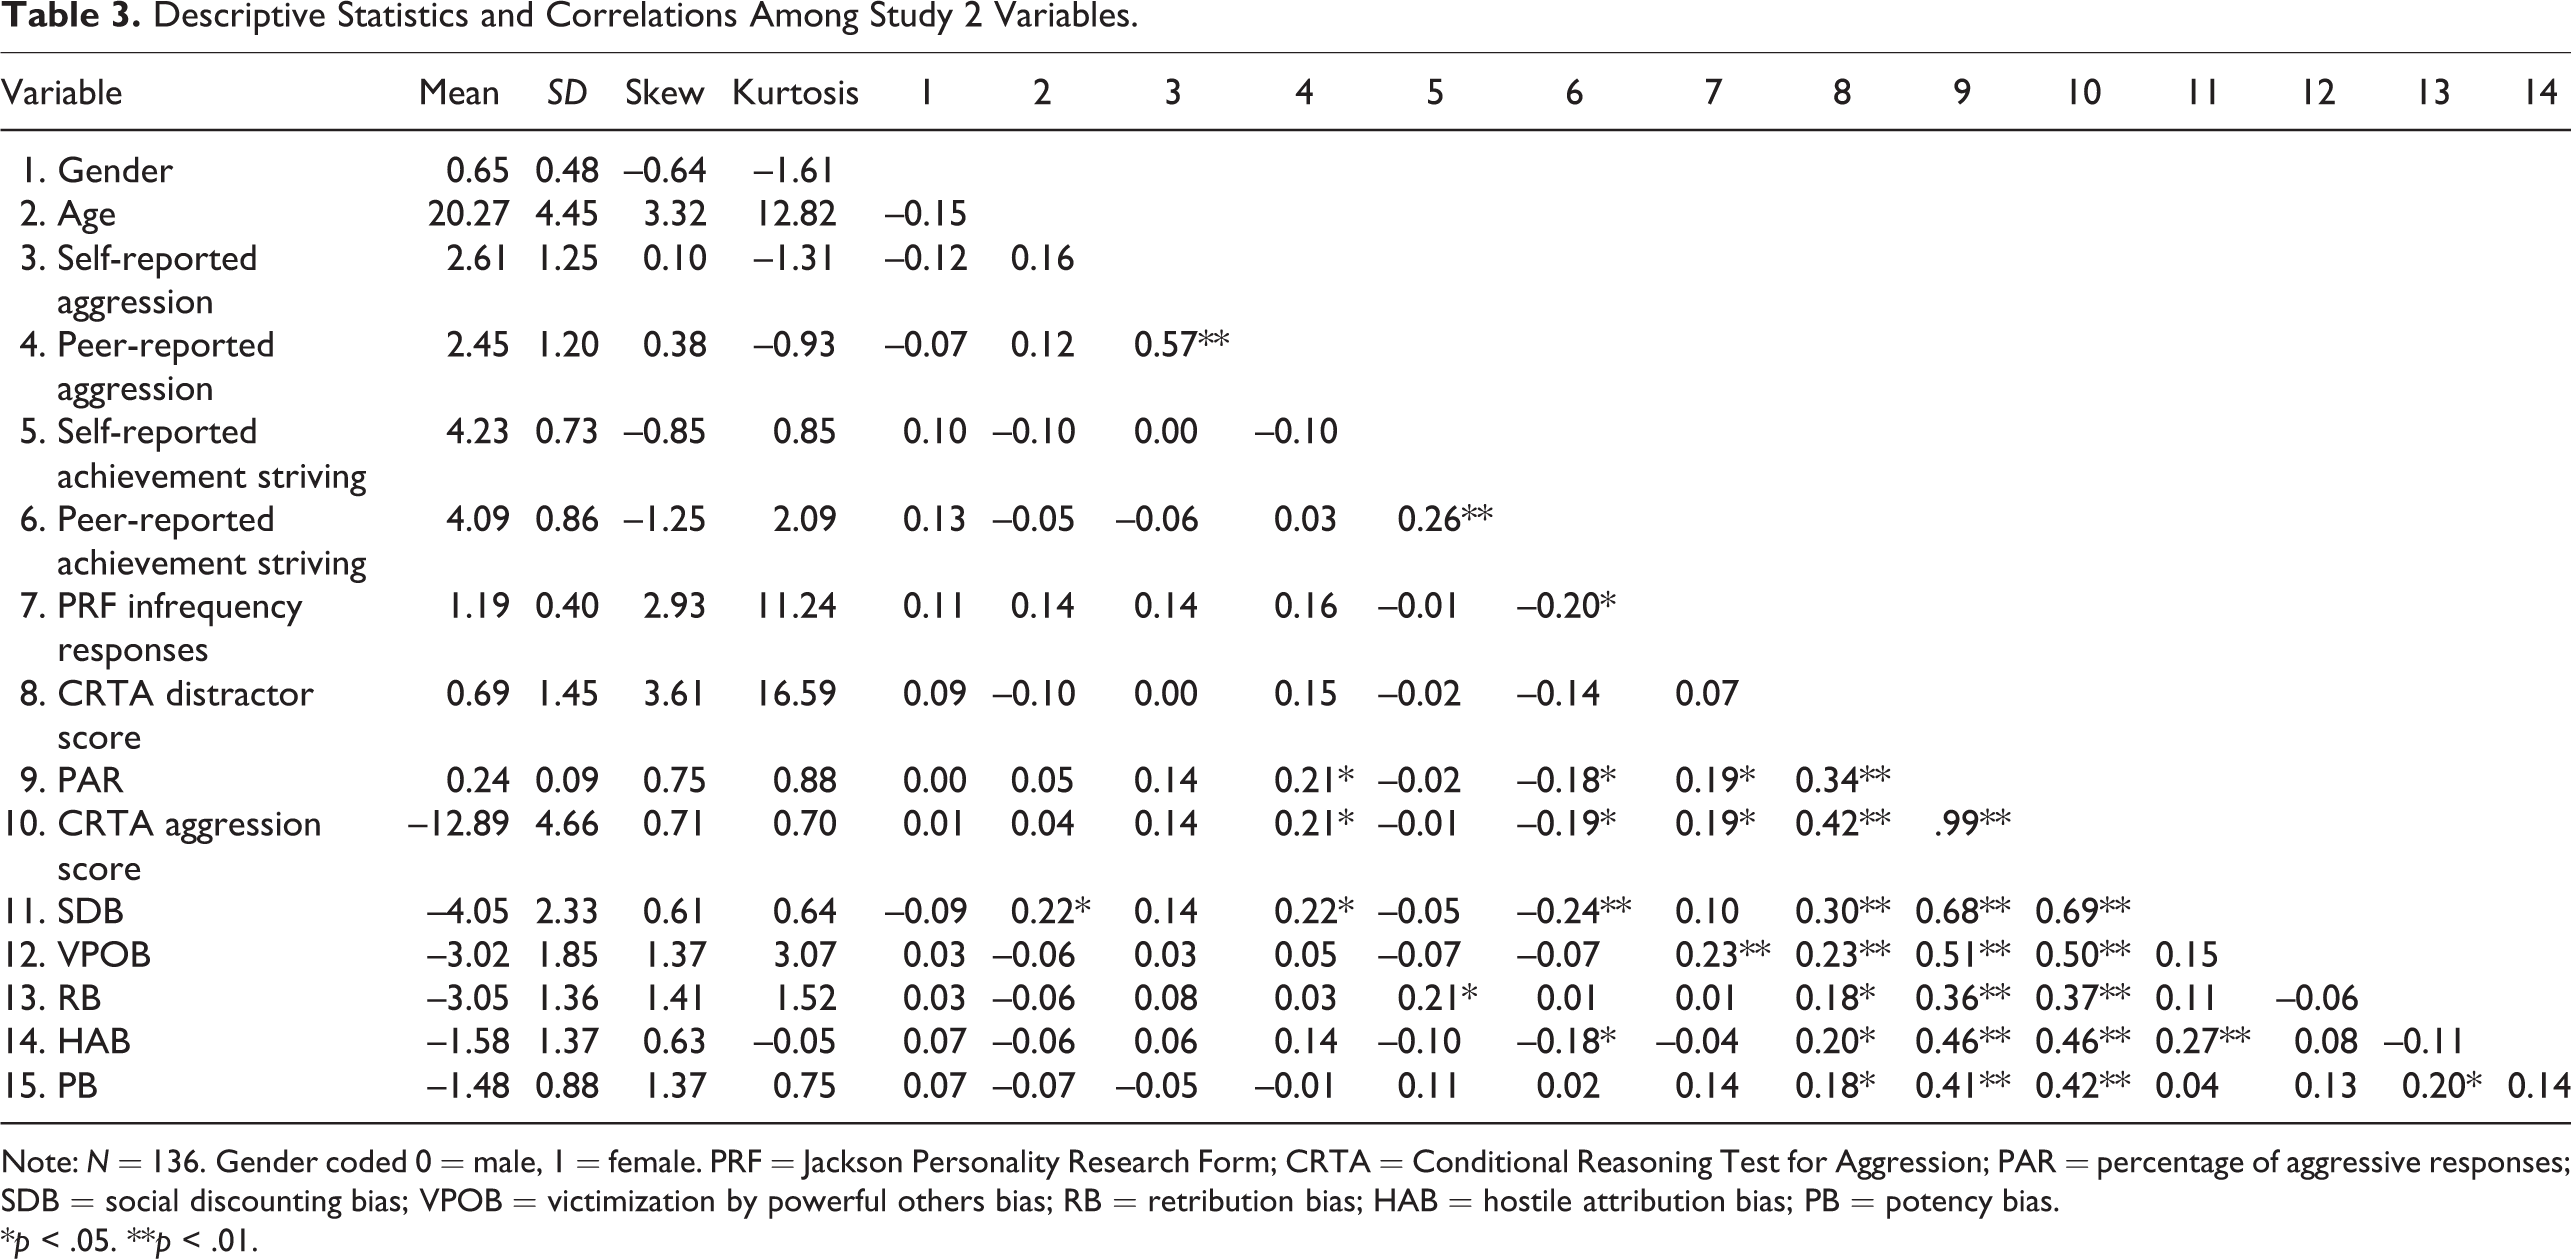
Note: N = 136. Gender coded 0 = male, 1 = female. PRF = Jackson Personality Research Form; CRTA = Conditional Reasoning Test for Aggression; PAR = percentage of aggressive responses; SDB = social discounting bias; VPOB = victimization by powerful others bias; RB = retribution bias; HAB = hostile attribution bias; PB = potency bias.
*p < .05. **p < .01.
Relationship of IER to Achievement Striving and Aggression
To address Hypothesis 2, we regressed, via MRCM, both IER indices on PRF aggression, NEO-PI-R achievement striving scores, and CRTA aggression scale scores. When predicting CRTA distractor scale scores, CRTA aggression scale scores were a statistically significant predictor (β = .42), but PRF aggression (β = .08) and NEO achievement striving (β = .03) were nonsignificant. We found a similar pattern of results for PRF infrequency scores, with CRTA aggression scale scores as a statistically significant predictor (β = .21), while PRF aggression (β = –.09) and NEO achievement striving (β = –.03) were nonsignificant.
To leverage the strengths of our dyadic data, we examined the relationship of IER with self- and peer-rated personality. Since our first two hypotheses focused on implicit aggression, these investigations of the relationships of IER with explicit aggression and achievement striving (i.e., self- and peer-rated variables) were exploratory in nature. The PRF infrequency scale correlated –.01 (ns) with self-rated achievement striving, –.20 (p < .05) with peer-rated achievement striving, .14 (ns) with self-rated aggression, and .16 (p < .10) with peer-rated aggression. The CRTA distractor scale score correlated –.02 (ns) with self-rated achievement striving, –.14 (ns) with peer-rated achievement striving, .00 (ns) with self-rated aggression, and .15 (p < .10) with peer-rated aggression.
The relationships between IER and explicit personality variables reveal two informative trends for subsequent IER research. First, relationships between IER and peer-rated personality were stronger than relationships between IER and self-rated personality. As noted in the introduction (and previous IER research; see Bowling et al., 2016), if participants engage in IER, their standing on self-rated variables may be untrustworthy as their responses are influenced by construct-irrelevant variance. Relying on peer-rated variables may circumvent this problem. Second, relationships between implicit aggression and IER were stronger than relationships between explicit aggression (either self- or peer-rated) and IER, indicating additional support for Hypothesis 1 that implicit aggression is part of the nomological network of IER.
Conclusions
Overall, the Study 2 results indicate that implicit aggression is capable of predicting IER. This relationship exists for two uncorrelated operationalizations of IER and remains statistically significant after holding constant the effects of explicit aggression and achievement striving. The only JM-based subscale that significantly predicted both forms of IER was the VPO bias, which was also the strongest JM-based predictor of distractor scale scores in Study 1. Hence, this consistent result lends additional credence to the idea that implicitly aggressive individuals who engage in IER may do so as the result of perceptions of victimization or power inequity.
The .07 relationship between the two forms of IER examined in Study 2 has implications for the understanding of IER. Specifically, IER may take multiple forms or be multidimensional itself. Additionally, the results of this and other studies (e.g., Bowling et al., 2016; Huang, Liu, et al., 2015) suggest that IER may be multiply determined. The collective evidence suggests that IER may be more complex than previously thought. If this is the case, then researchers who treat IER as a nuisance variable may be missing an opportunity to leverage these relationships in the service of better understanding behavioral and organizational phenomena.
Since IER may be multiply determined, CRT distractor scale scores may not only be a manifestation of aggression but perhaps also the result of a lack of conscientiousness (Bowling et al., 2016) or proclivity for inattentiveness (Huang, Liu, et al., 2015). Study 3 extends the first two investigations by determining if IER as operationalized by CRTA distractor scale scores can predict traffic violations, an outcome that is plausibly related to aggression, conscientiousness, and inattentiveness.
Study 3: Method
To investigate the criterion-related validity of CRTA distractor scores, we reanalyzed data originally published in Bing et al. (2007). In their second study, Bing and his colleagues focused on the relationship between aggression and traffic violations. Here, we focus instead on the predictive ability of IER by investigating whether CRTA distractor scores can predict a theoretically relevant criterion variable above and beyond aggression and conscientiousness.
Participants and Procedure
Participants were 225 undergraduate students (49.1% female, mean age = 19.69 years) recruited from upper-level management courses at a large university in the southeastern United States. Participants were offered extra credit in their courses in exchange for their participation in a study investigating campus activities and campus life. In addition to completing a CRTA, they also completed the angry-hostility and dutifulness facets of the NEO-PI-R (Costa & McCrae, 1992) and provided demographic information. With participants’ permission, GPA, ACT scores, and the criterion, traffic violations, were obtained from university records.
Measures
In contrast to the paper-and-pencil format CRTAs used in Studies 1 and 2, this study used a Verbal-Visual CRTA (VCRTA). In this version of the CRTA, a television displays the full text of each CRTA item while a recorded voice reads the text accompanied by an evocative picture depicting a central aspect of the information provided in each item’s stem. CRTA and VCRTA scores have demonstrated a correlation of .82 when administered 2 months apart (see James et al., 2005). However, the VCRTA contains only 14 items in contrast to the longer paper-and-pencil version. JM-based subscores cannot be computed for the VCRTA because of the smaller number of items and lack of factor analytic evidence. Additionally, the VCRTA only contains one illogical response option, whereas the CRTAs used in Studies 1 and 2 contained two.
VCRTA aggression scale scores were coded using the trichotomous scoring technique and summed such that higher scores indicate higher levels of implicit aggression (M = –8.94, SD = 3.95). A VCRTA internal consistency estimate of .82 was computed using the technique outlined in James and LeBreton (2012). VCRTA distractor scale scores were calculated as in Study 2 (i.e., illogical distractors as +1, aggressive and nonaggressive responses as 0). The mean number of illogical distractors chosen by each participant was 0.22 (SD = 0.83), and the KR-20 estimate for VCRTA distractor scale scores was .74.
The angry-hostility and dutifulness facets of the NEO-PI-R (Costa & McCrae, 1992) were administered alongside the VCRTA. These facets reflect subscales of neuroticism and conscientiousness, respectively. Bing et al. (2007) administered these facet scales using a dichotomous true/false response format. Higher scores on the angry-hostility scale indicated higher levels of explicit aggression (M = 4.93, SD = 1.81), and the KR-20 was .64. Higher scores on the dutifulness scale indicated higher levels of dutifulness (M = 6.13, SD = 1.52), and the KR-20 was .53. Both internal consistency estimates are somewhat low, which may reflect the fact that careless respondents were present in the data set (DeSimone et al., 2018). We did not attempt to improve internal consistency estimates by applying additional data quality screens due to our use of archival data and the fact that IER is a focal variable in this study. As a result, we encourage readers to interpret any results that rely on the use of these facet-level scales with some caution.
The traffic violations criterion was obtained from the university’s records office approximately 2 years after the predictor data were collected. The majority of the sample (73.3%) had at least one traffic violation, and the number of violations ranged from 0 to 47 (M = 3.87, SD = 5.25). According to Bing et al. (2007), this actuarial record primarily contained serious moving violations (e.g., reckless driving) and serious parking violations (e.g., parking in front of fire hydrants or loading zones). Minor parking violations were less likely to be included as they were removed from university records after approximately 2 months. For legal reasons, the records office was not willing to disclose the nature of specific violations. Nevertheless, the accrual of multiple violations, regardless of severity, may reflect elevated levels of deviance or carelessness. Although far from perfect, both moving and parking violations (whether minor or major) are arguably related to carelessness when driving.
To test Hypotheses 2 and 3, we ran hierarchical regressions to predict VCRTA distractor scale scores (Hypothesis 2) and traffic violations (Hypothesis 3). In each regression, we began with a baseline model that included our control variables (age, gender, ACT scores, and GPA) and NEO angry-hostility scores. To test Hypothesis 2, we specified two subsequent models in which we added NEO dutifulness scores (Model 2) and VCRTA aggression scale scores (Model 3). To test Hypothesis 3, we specified three subsequent models in which we added VCRTA aggression scale scores (Model 2), NEO dutifulness scores (Model 3), and VCRTA distractor scale scores (Model 4). In each hierarchical regression, we assessed incremental validity by examining the change in R2 (ΔR2) associated with the addition of each predictor.
In addition to the hierarchical regressions, we explored the relative importance of the focal predictors in each model using relative weight analysis (RWA; Tonidandel & LeBreton, 2011). We supplemented our RWA results with an analysis of joint variance analysis (JV; Schoen, DeSimone, & James, 2011) to explore the potential combined effects of dutifulness and aggression for predicting IER and traffic violations.
Study 3: Results and Discussion
Table 4 reports the correlations between all variables in Study 3. We again examined the base rate of missing responses and illogical responses on the VCRTA. Missing item rates were 0% for most items but 0.4% for Items 6, 8, and 9 and 0.9% for Item 11. 4 Illogical item rates ranged from 0.4% (Item 5) to 4.0% (Item 11). Twenty-five respondents (11.11%) selected at least one illogical response, and only five (2.22%) had one or more missing responses. The average percentage of illogical responses per item was 1.3% for the first half of the test (i.e., the first 7 items) and 1.8% for the second half. Although the direction of this result was consistent with our frustration-aggression framework, the difference was nonsignificant (z = 1.06). VCRTA distractor scale scores correlated with PAR scores at .53 (p < .01) and VCRTA aggression scale scores at .45 (p < .01). These correlations provided additional support for Hypothesis 1.
Descriptive Statistics and Correlations Among Study 3 Variables.
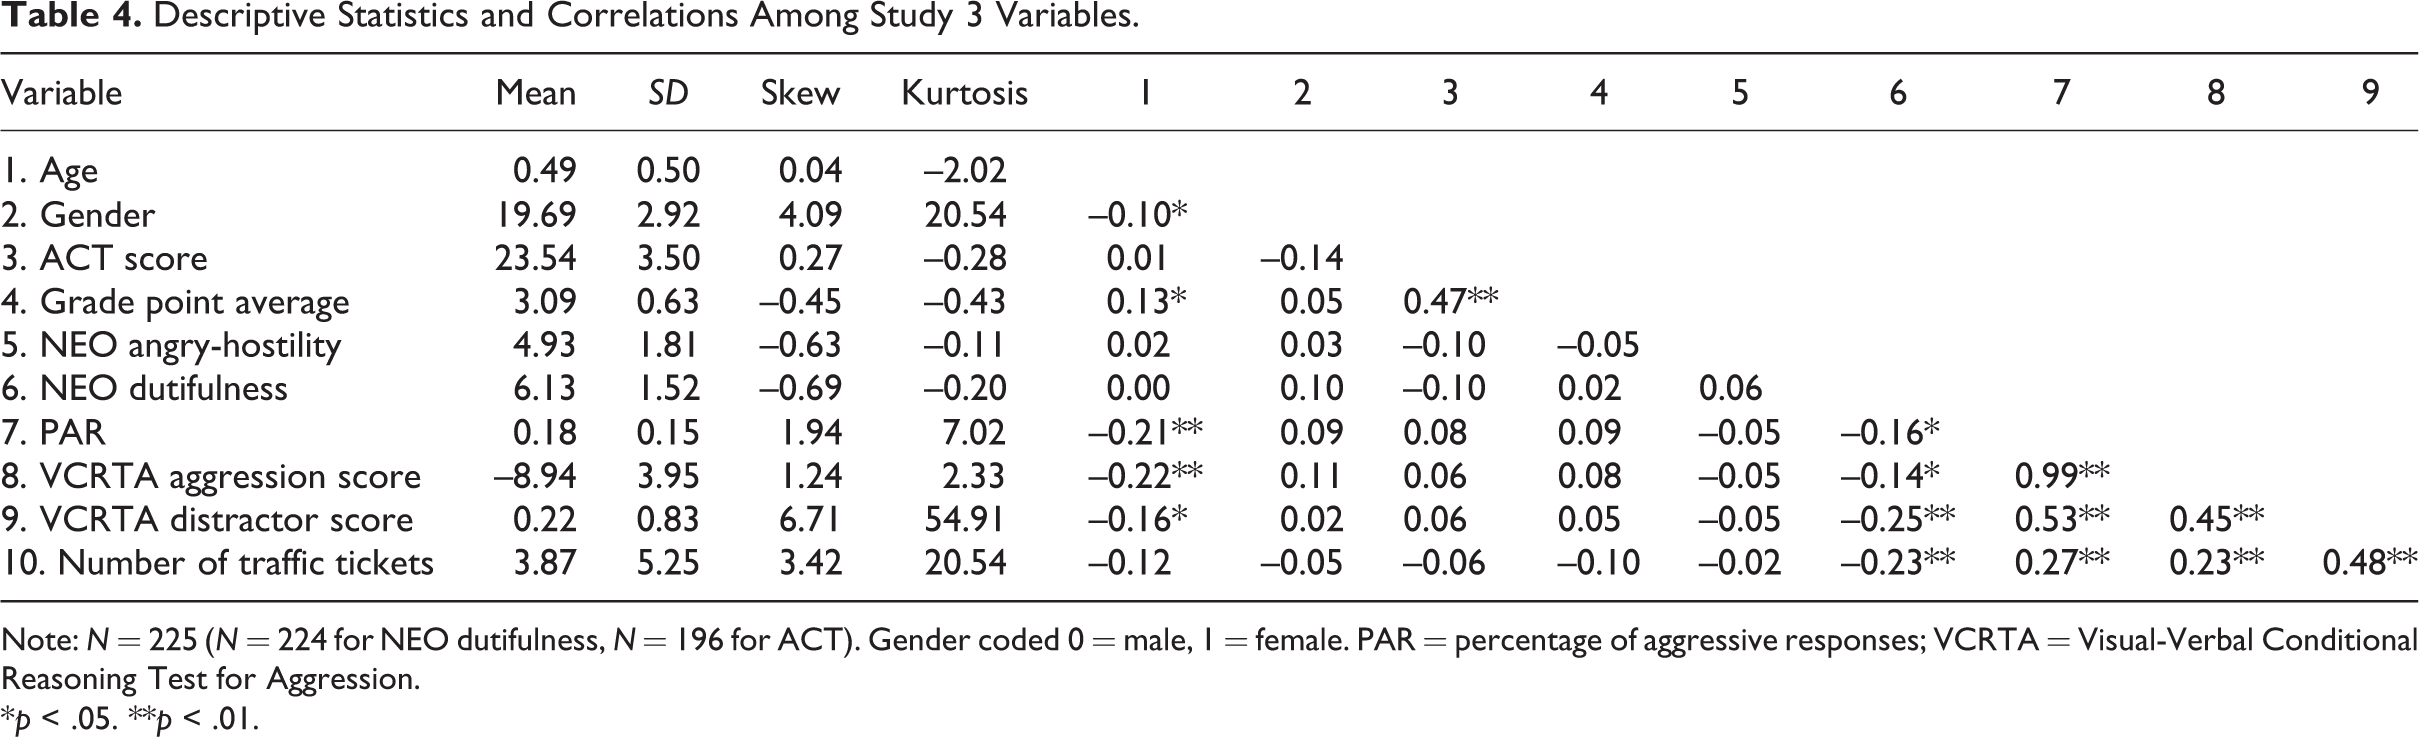
Note: N = 225 (N = 224 for NEO dutifulness, N = 196 for ACT). Gender coded 0 = male, 1 = female. PAR = percentage of aggressive responses; VCRTA = Visual-Verbal Conditional Reasoning Test for Aggression.
*p < .05. **p < .01.
The Effects of Aggression and Dutifulness on IER
Previous research has demonstrated that the link between aggression and IER is not likely attributable to intelligent persons being both more logical and less aggressive in their responses to CRTA items (James et al., 2005). Here, with the VCRTA, we had the opportunity to test this relationship empirically as we had access to participants’ GPA and ACT scores, both of which are related to intelligence. Neither ACT scores nor GPA were significantly correlated with dutifulness, implicit aggression, or VCRTA distractor scale scores.
To directly address Hypothesis 2, we conducted a hierarchical regression analysis as specified previously (see Table 5). Entry of GPA, ACT scores, angry-hostility scores, gender, and age in Model 1 produced a nonsignificant R2 of .04. The entry of dutifulness scale scores on Model 2 led to a significant increase in R2 (ΔR2 = .07, p < .05; β = –.27, p < .05). This finding is consistent with previous research demonstrating the relationship between conscientiousness and IER (Bowling et al., 2016; Huang, Liu, et al., 2015). Finally, the entry of the VCRTA aggression scale scores in Model 3 led to a significant increase in R2 (ΔR2 = .10, p < .05; β = .33, p < .05). These results support Hypothesis 2, leading to the conclusion that implicit aggression is capable of predicting IER even after accounting for alternative explanations such as intelligence and dutifulness. Dutifulness is related to IER, but implicit aggression explains incremental variance beyond this facet of conscientiousness.
Study 3 Hierarchical Regression for VCRTA Distractor Scores.
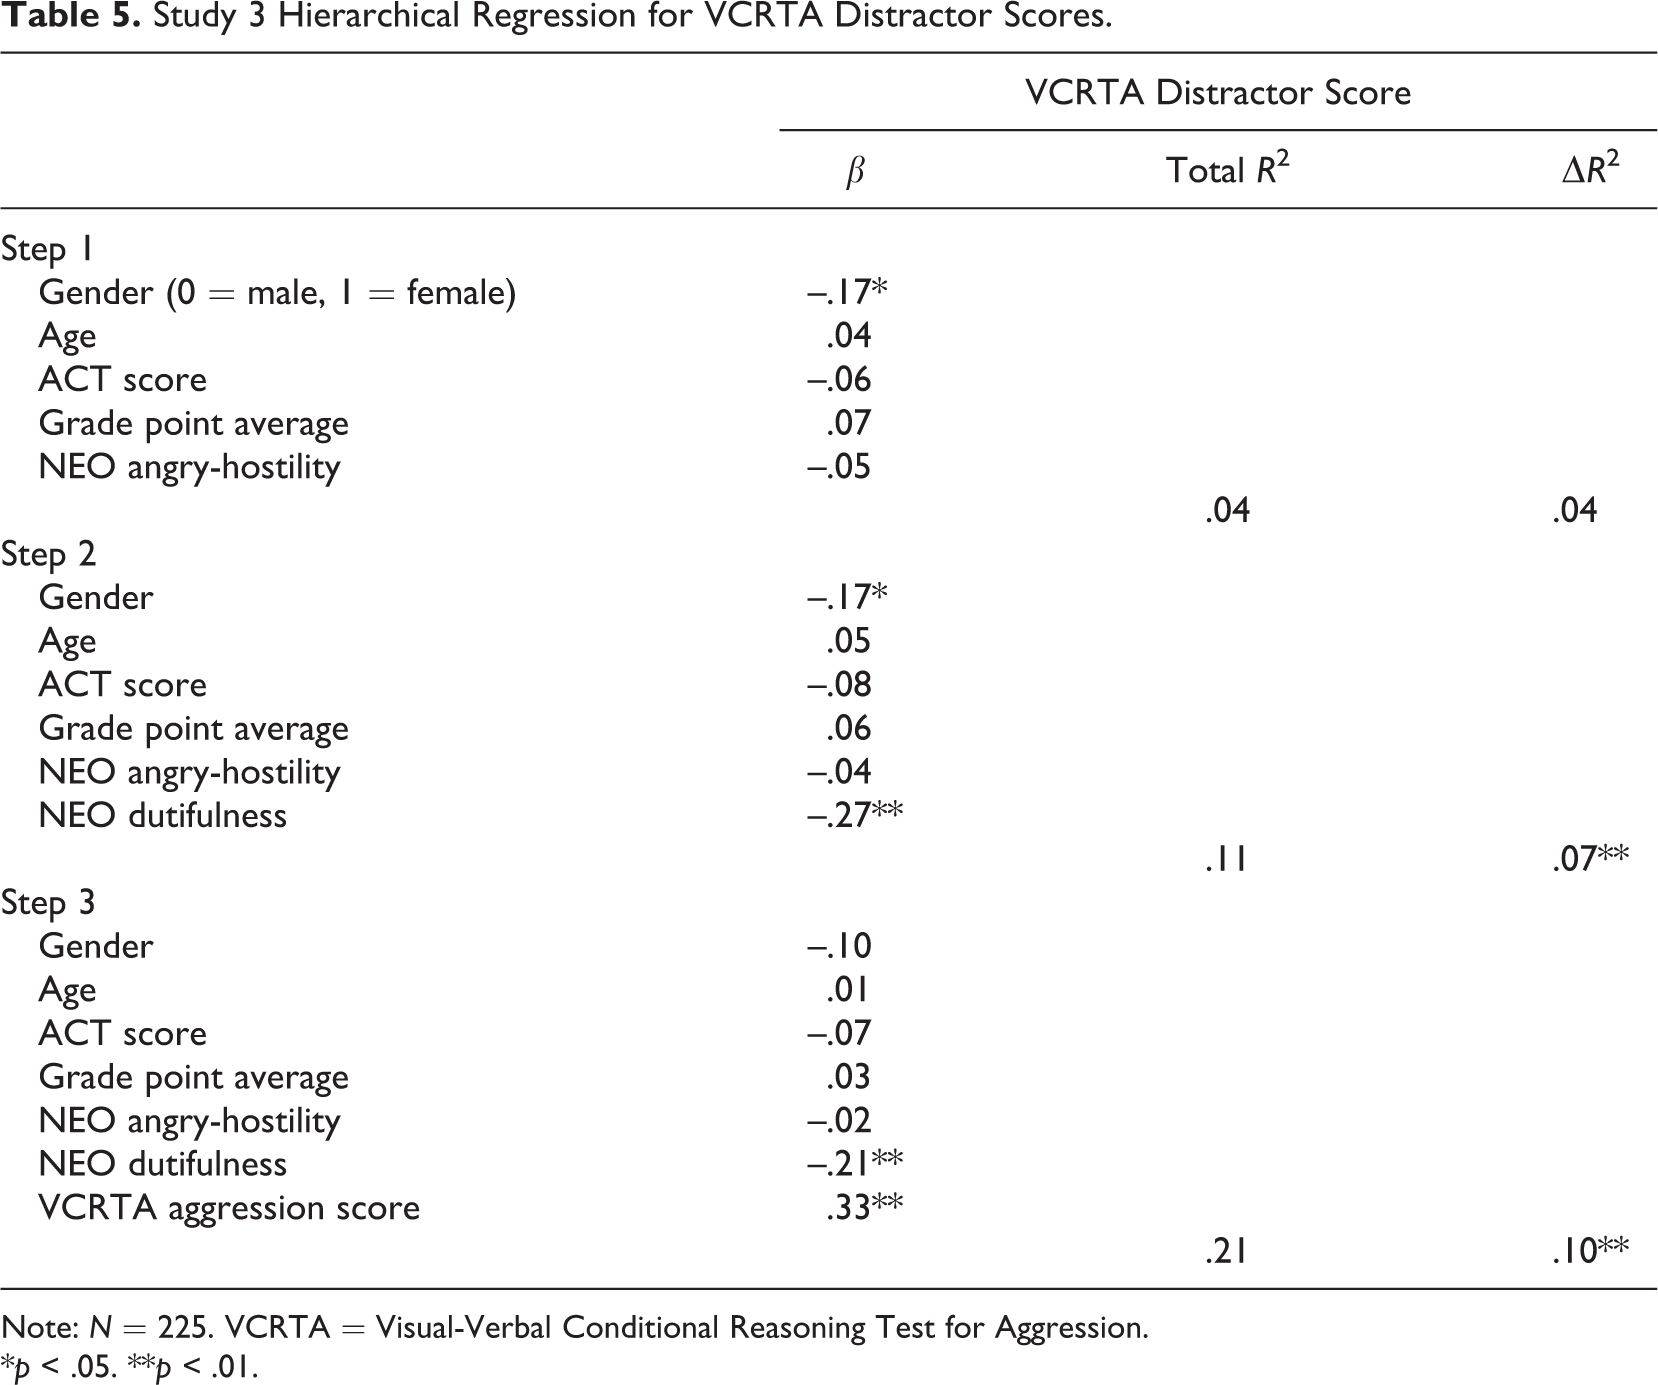
Note: N = 225. VCRTA = Visual-Verbal Conditional Reasoning Test for Aggression.
*p < .05. **p < .01.
We conducted an RWA and JV using the correlations between implicit aggression, dutifulness, and distractor scale scores (the criterion) from Table 4. Aggression scale scores had a relative weight of 79.6%, while dutifulness scores had a relative weight of 20.4%. The unique effect of implicit aggression was significant (.18, 95% CI [.04, .32]), but neither the unique effect of dutifulness (.04) nor the joint effect of both predictors (.03) was significant. These results suggest that implicit aggression plays a prominent role in predicting IER.
Criterion-Related Validity of VCRTA Distractor Scale Scores
We were able to replicate Bing et al.’s (2007) results in that traffic violations were correlated with VCRTA aggression scale scores at .23 (p < .05) and with NEO Angry-Hostility scores at –.02 (ns). Bing et al. focused on the role of implicit aggression in predicting these violations, but the present research added an investigation of the roles of IER and conscientiousness as both should be related to careless behavior (e.g., inattentiveness while parking or driving). Traffic violations were correlated with VCRTA distractor scale scores at .48 (p < .05) and NEO dutifulness scores at –.23 (p < .05). The positive relationship with IER and negative relationship with dutifulness suggest that the traffic violations criterion is plausibly related to carelessness. Additionally, the relationship between IER and traffic violations provides support for our third hypothesis and suggests that VCRTA distractor scale scores may have predictive utility for real-world outcomes related to carelessness.
Our hierarchical regression predicting traffic violations (see Table 6) revealed that Model 1 again produced a nonsignificant R2 (.02). The addition of VCRTA aggression scale scores in Model 2 led to a significant increase in R2 (ΔR2 = .06, p < .05; β = .24, p < .05), as did the entry of dutifulness scale scores in Model 3 (ΔR2 = .05, p < .05; β = –.23, p < .05) and the entry of VCRTA distractor scale scores in Model 4 (ΔR2 = .19, p < .05; β = .50, p < .05). In Model 4, the beta weights for dutifulness (–.12, ns) and VCRTA aggression scale scores (.04, ns) decreased in magnitude and were no longer statistically significant when modeled simultaneously with VCRTA distractor scale scores.
We conducted another RWA and JV using the correlations between implicit aggression, dutifulness, distractor scale scores, and tickets (the criterion) from Table 4. Relative weights were 9.7% for implicit aggression, 13.7% for dutifulness, and 76.6% for distractor scale scores. In the JV, only the unique effect of distractor scales scores was significant (.15, 95% CI [.07, .23]). The unique effects of implicit aggression (.00) and dutifulness (.01) as well as all four joint effects were nonsignificant.
Study 3 Hierarchical Regression for Traffic Tickets.
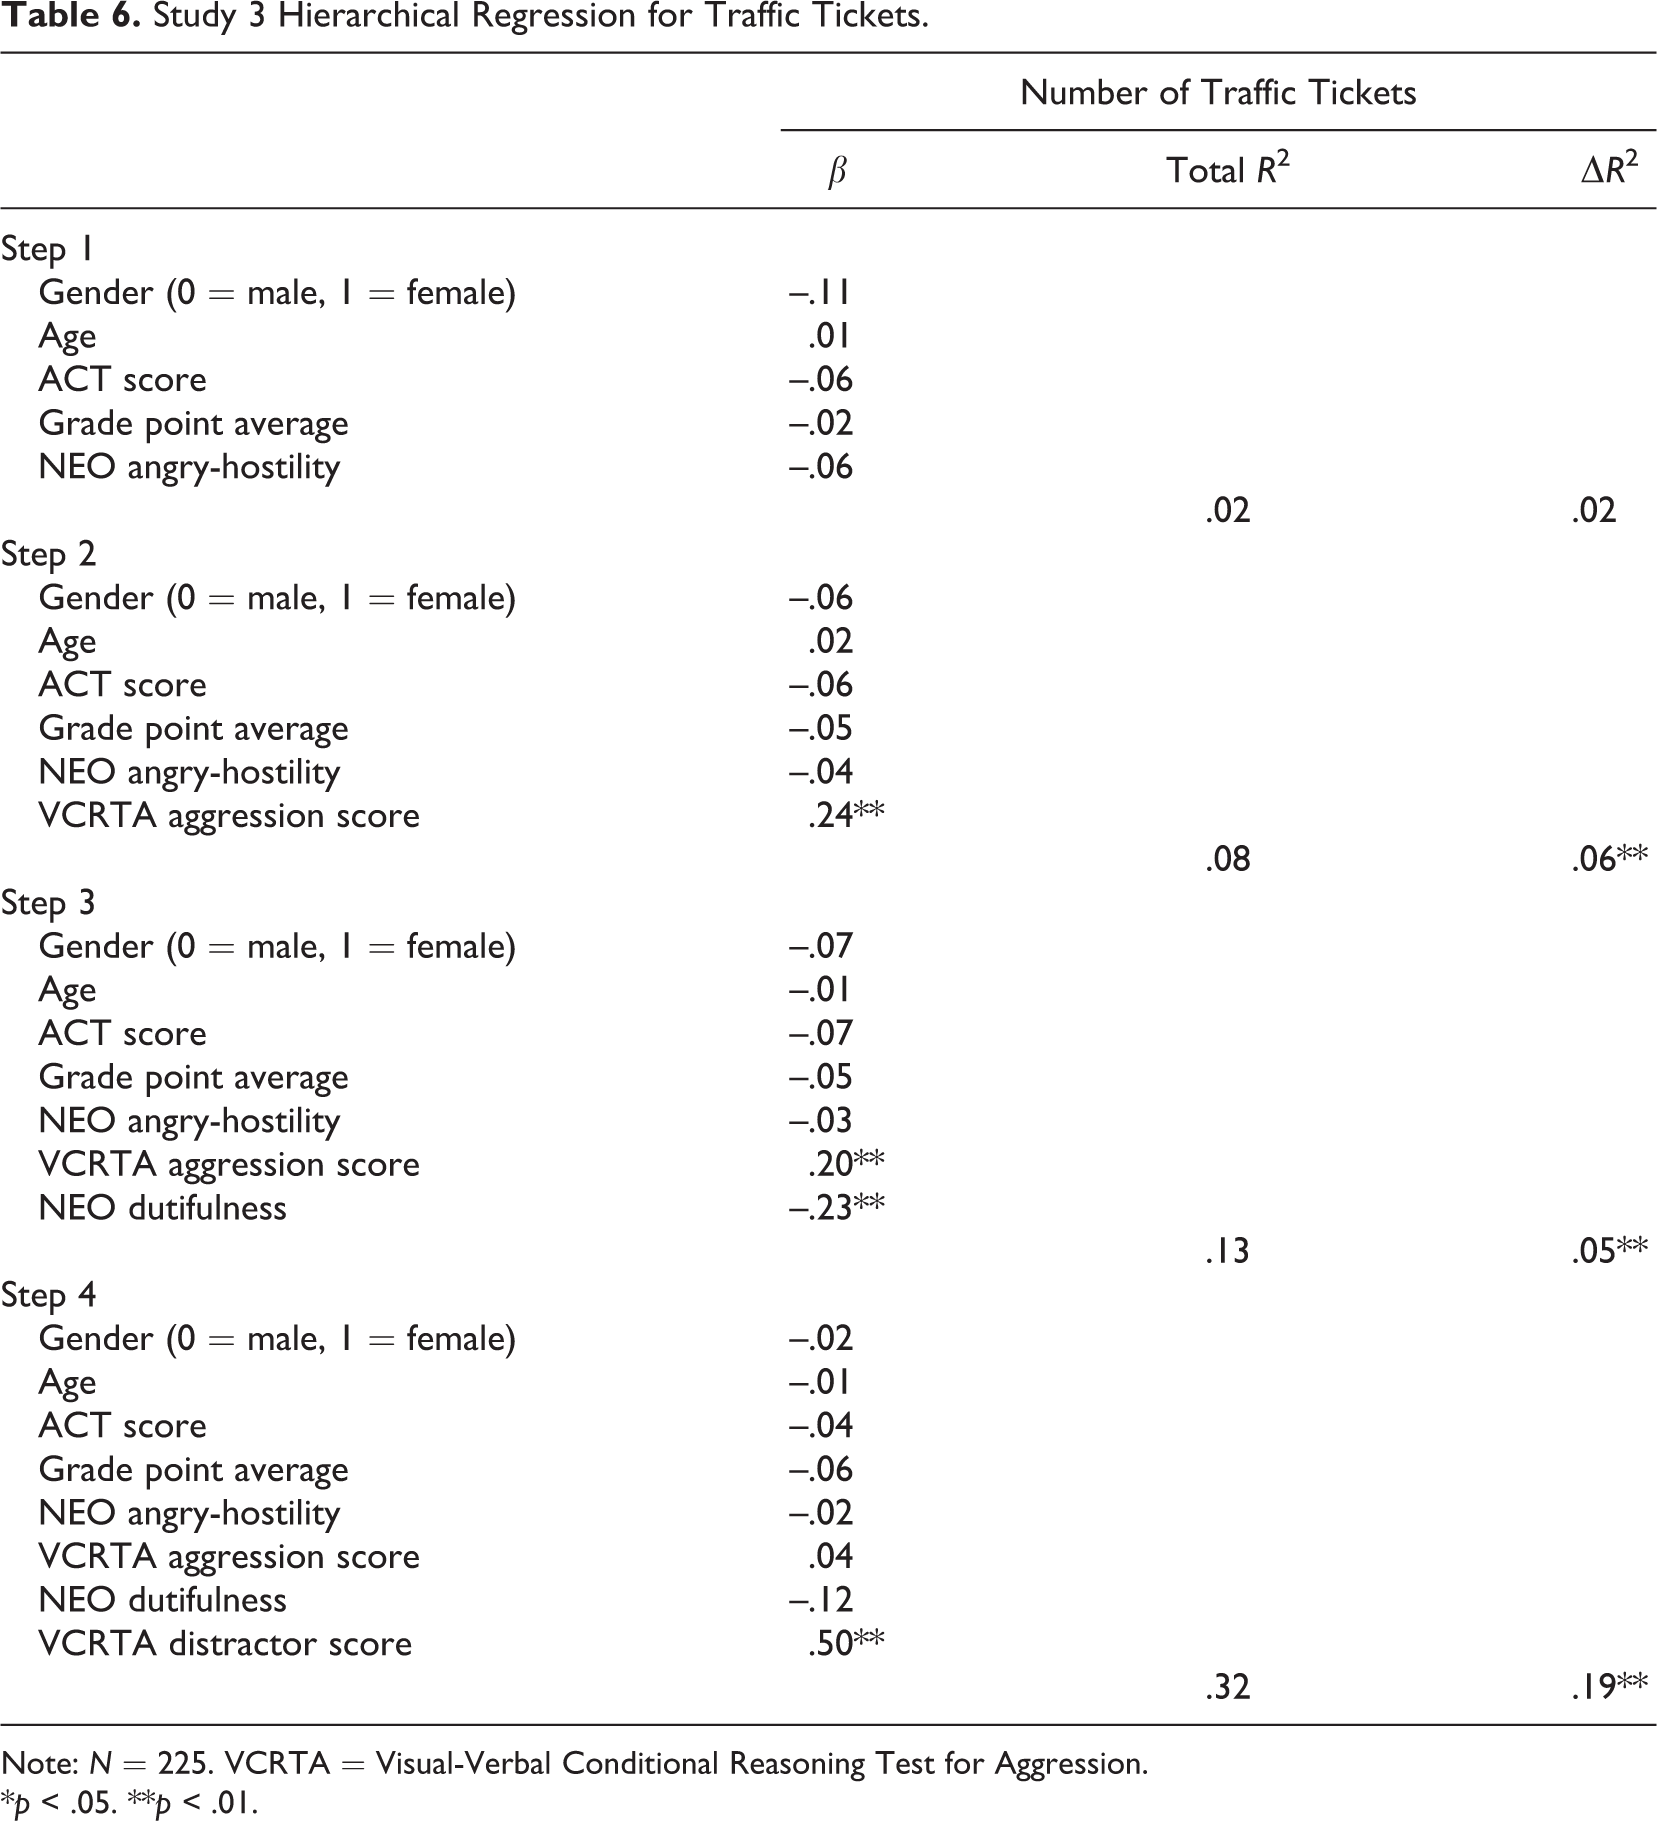
Note: N = 225. VCRTA = Visual-Verbal Conditional Reasoning Test for Aggression.
*p < .05. **p < .01.
In sum, Study 3 provides evidence to support all three hypotheses. VCRTA distractor scale scores are related to both implicit aggression scores and traffic violations. Both of these relationships exist after controlling for self-reported dutifulness. Relative importance indicators provide further support for our hypotheses by demonstrating that (a) aggression plays a stronger role than dutifulness in predicting IER and (b) IER plays a stronger role than aggression or dutifulness in predicting traffic violations. Consequently, this study demonstrates that IER is empirically related to implicit aggression and may serve as an effective predictor of real-world criteria. This finding is important because it establishes the potential for IER to serve as more than just a nuisance variable or methodological indicator of response quality. In some cases, researchers may find it fruitful to treat IER as a substantive variable of interest for the purposes of building theoretical models and predicting criteria.
General Discussion
Evidence from our three studies indicates support for our three proposed hypotheses. Implicit aggression is positively correlated with IER across three samples and two different measures of IER. This finding is novel and important in that it supports the idea that some participants may respond randomly or inattentively in an effort to undermine the research process. Although IER may serve as a form of aggressive behavior for some participants, we certainly make no claim that all IER is aggressive in nature. Study 3 replicates previous findings that conscientiousness is also related to IER, which is consistent with the tendency for conscientious individuals to be attentive and more likely to follow instructions. While IER may take multiple forms, our findings indicate that both implicit aggression and conscientiousness are predictors of IER. Therefore, with respect to Hypothesis 1, we conclude that IER is most likely multiply determined but that implicit aggression is one useful determinant of IER.
Until recently, researchers have not attempted to empirically examine the correlates of IER. As a result, there is no theory elucidating the reasons for our observed relationships. In our introduction, we argued that implicit aggression may be related to IER due to the frustration-aggression hypothesis (Berkowitz, 1989; Dollard et al., 1939) or Masling’s (1966) “screw you” effect. One purpose of our research question was to explore the differential effects of theory-rich JMs on IER. While multiple JMs were related to each IER index examined in Studies 1 and 2, only the VPO bias demonstrated a significant effect across both studies and both operationalizations of IER. When a participant has high implicit aggression, the perceived power dynamic between researcher and participant may play a role in determining whether that participant exhibits IER. Other JMs may play a role in predicting specific forms of IER as well. For example, potency bias was not statistically related to distractor score selection in Study 2 but was related to the PRF infrequency index. Other JM-based subscales such as the hostile attribution bias demonstrated the reverse trend. We are hesitant to draw strong theoretical conclusions on the basis of a largely exploratory set of analyses but encourage future research to continue investigating theoretical mechanisms that may explain IER.
Implicit aggression seems to be a stronger predictor of IER than conscientiousness (at least the achievement striving and dutifulness facets), as evidenced by higher correlations and relative importance indices. Studies 2 and 3 support Hypothesis 2 in that implicit aggression is capable of predicting IER after controlling for facets of conscientiousness. However, the fact that implicit aggression outperforms conscientiousness in these studies does not negate the importance of conscientiousness in the nomological network of IER. This is particularly true given the weak relationship between implicit aggression and conscientiousness. Therefore, we conclude that although both conscientiousness and implicit aggression may be important determinants of IER, implicit aggression was a stronger predictor in the present studies.
Finally, Study 3 supports our third hypothesis by establishing the criterion-related validity of IER for predicting traffic violations. Importantly, zero-order correlations suggest that multiple variables (i.e., implicit aggression, dutifulness) are also capable of predicting this criterion, but IER remains a statistically significant predictor even after accounting for these effects. Taken together, the results of these three studies further elucidate the nomological network surrounding IER.
Practical Implications
If participants do not pay attention while responding to survey questions, their responses likely reflect construct-irrelevant variance as opposed to their true standing on the construct(s) of interest. Prior research suggests using IER indices as screening techniques intended to identify participants who are not attentive during the survey process (Curran, 2016; Huang et al., 2012). The present set of studies does not negate this reasoning but suggests a complementary line of reasoning that IER may be relevant to other variables of interest. As an example, if a respondent indicates strongly agree response option for every item on a balanced extraversion test, it may be unwise to interpret that respondent’s extraversion score. However, the fact that they exhibited “straightlining” (Schonlau & Toepoel, 2015) may be related to other constructs of interest.
Recognition of IER-relevant constructs may have important implications for measurement. For example, CRTA respondents who select more illogical responses tend to be higher in implicit aggression, but the NRM information characteristic curves and simulations reported in the Appendix suggest that this relationship cannot be explained solely by the phenomenon of random responding. These results demonstrate that CRTA scores reflect implicit aggression but also may reflect aggression-related IER for some respondents. As a result, removing participants who select many illogical responses may remove some aggressive respondents from a sample, restricting the range of latent implicit aggression in the sample. Similarly, removing participants who exhibit IER on a measure of conscientiousness may eliminate low-conscientiousness respondents. The relationship between IER and other constructs not explored in the present studies requires further theoretical and empirical consideration. For many constructs, eliminating respondents on the basis of IER is less likely to restrict range or mitigate the generalizability of results.
The use of IER-based screening techniques necessitates careful consideration of the potential consequences to subsequent data analysis. These problems are reminiscent of the missing not at random (MNAR; Newman, 2014; Rubin, 1976) category of missing data. MNAR data are undesirable in that the probability of missing data depends on unobserved missing data values. Correlations between IER and a study’s constructs of interest may present an intractable problem for data analysis and interpretation. When IER is plausibly correlated with a study’s focal construct, we suggest that researchers report and compare results both before and after applying IER-based data screens. Continuing to investigate the nomological network surrounding IER will better inform researchers about the relative benefits and drawbacks to using IER assessment as a screening tool.
Although the presence of IER may hinder the interpretation of focal variables in a study, the present studies demonstrate that IER may be a meaningful variable in se. Some response sets and styles have been linked to individual differences (Couch & Keniston, 1960; Spector, 2006), and missing responses have been modeled as a separate response category in IRT (Moustaki & Knott, 2000). In these cases, researchers opted to treat response behaviors as variables capable of being modeled. Accordingly, we propose that neglecting to attend to survey items is an observable behavior that is both conceptually and empirically related to other characteristics and behaviors of an individual. In light of this finding, we turn our attention to the implications of our findings for understanding the nature of IER.
Implications for Theory and Recommendations for Future Research
To our knowledge, Study 3 is the first examination of the relationship of IER with a behavioral criterion. Traffic violations are certainly not the only potential behavioral outcome associated with IER but are appropriate as proof of concept given their association with both carelessness and aggression (see Bing et al., 2007). We suspect that many other behavioral and organizational criteria may also be associated with IER. For example, carelessness in survey responding may be associated with carelessness in job performance, IER may predict violations of organizational norms, and a willingness to provide inaccurate responses may be associated with low levels of integrity. We encourage future researchers to investigate such relationships.
The present studies demonstrate that implicit aggression is a correlate of IER. Previous research (Bowling et al., 2016; Huang, Liu, et al., 2015) has demonstrated that other personality variables such as conscientiousness are correlates of IER. While aggression and conscientiousness are neither mutually exclusive nor exhaustive, they have very different implications for the nature of IER. The link between conscientiousness and IER suggests that individuals who do not prefer order and who prefer not to follow rules will be more likely to respond carelessly to survey items. However, there may be other reasons why individuals engage in IER. The link between IER and aggression suggests that some IER may reflect a desire to cause harm to the researcher or research results. Whether this behavior stems from frustration with the research process (as suggested by the frustration-aggression hypothesis) or perceptions of power inequity (as suggested by the empirical link to the VPO bias), we hope that such aggressive rationalizations are less prevalent among respondents than IER based on a lack of conscientiousness. Nevertheless, our results suggest that a subset of respondents who engage in IER may do so as the result of aggressive tendencies.
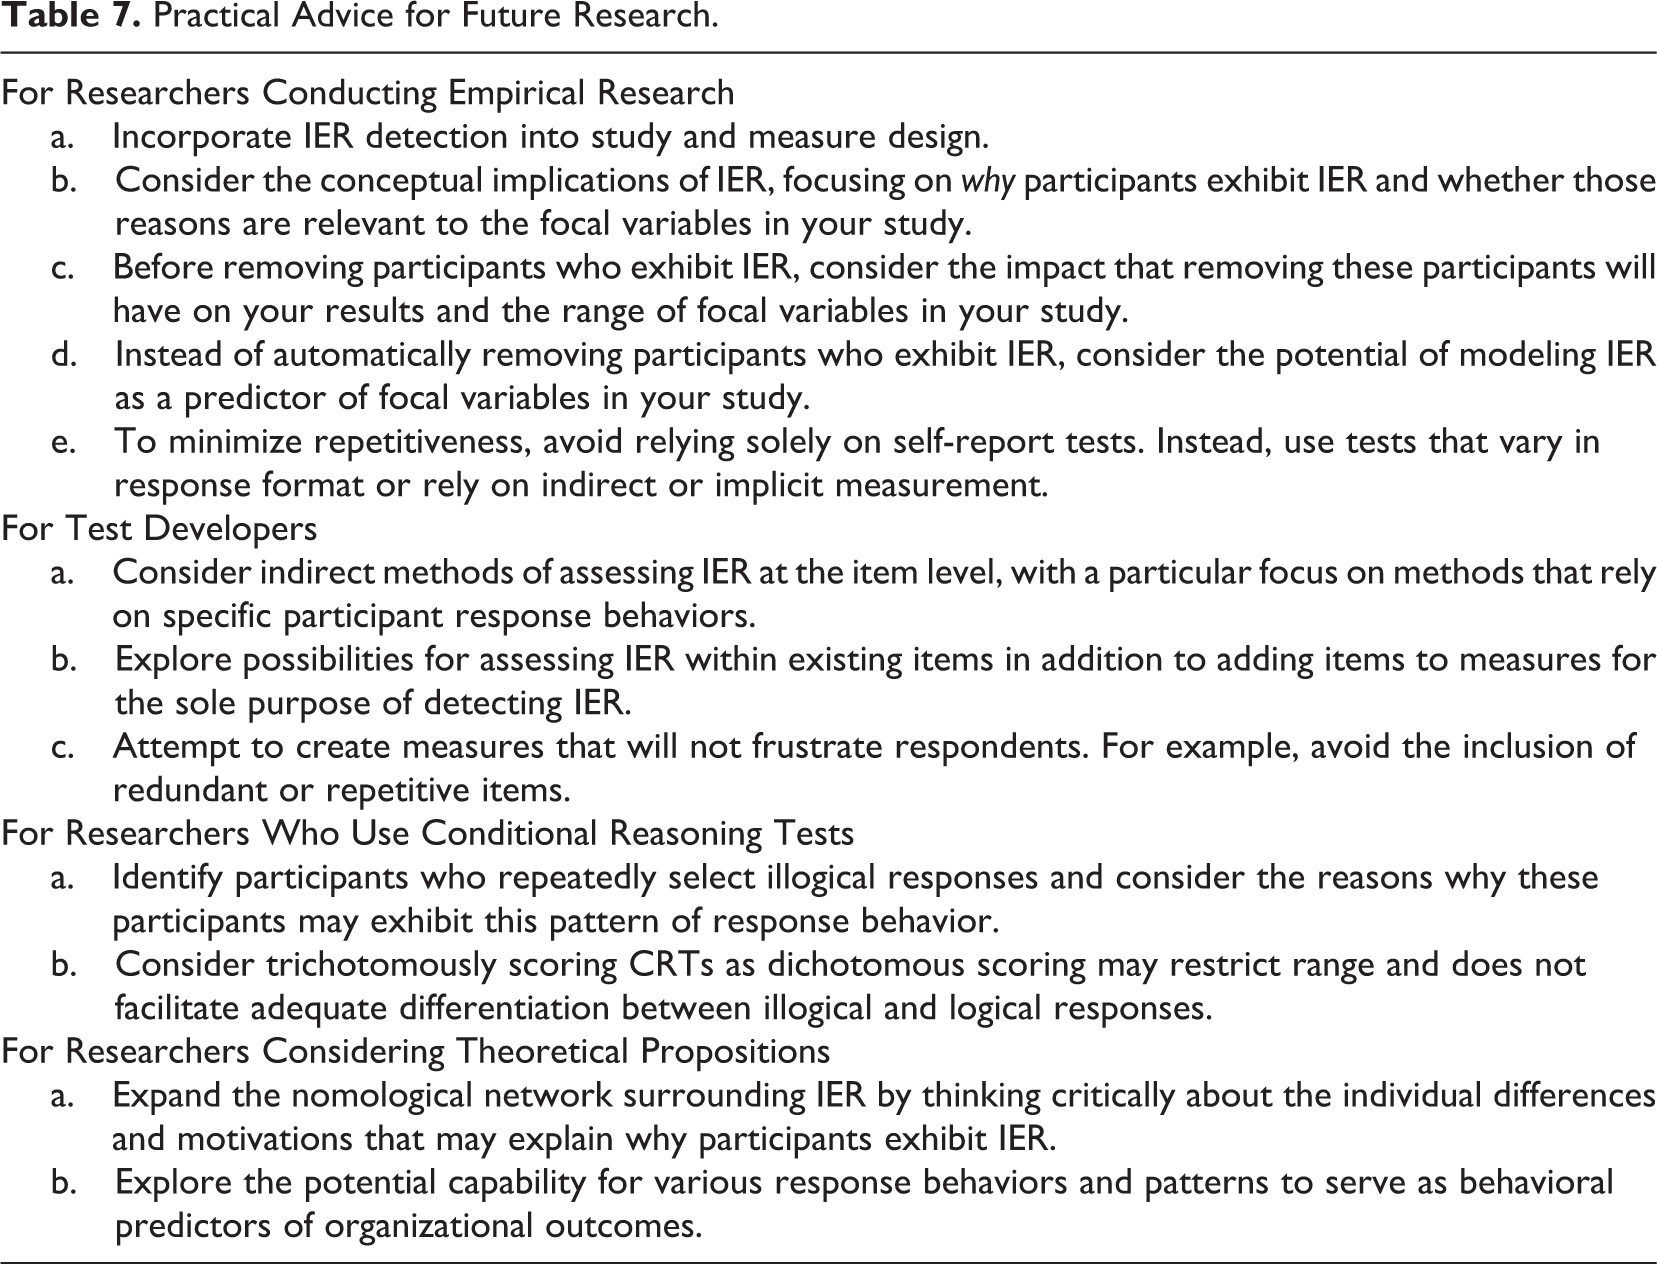
Table 7 lists considerations for future researchers interested in the practical implications of the present studies. In particular, we encourage researchers to think critically about the nature of IER by considering the reasons why some participants choose to respond inattentively. We also encourage test developers to incorporate behavioral IER indices into measures. Conditional reasoning tests contain a built-in IER detection mechanism through the inclusion of implausible distractors. Perhaps other test formats (e.g., situational judgment tasks) could attempt to employ similar IER detection techniques. Some item formats may not be as conducive to this form of IER detection, but we encourage researchers to explore ways to incorporate behavioral indicators of IER into existing measures, particularly if they can do so without adding additional items solely focused on IER detection (e.g., bogus or instructed items).
Practical Advice for Future Research.
Future research should continue to explore the antecedents and consequences of IER. If IER is multiply determined, then there are likely a variety of correlates, each of which may vary in prevalence or strength of association. For example, high levels of implicit aggression as assessed by the CRTA tend to be somewhat uncommon in the general population (DeSimone & James, 2015), but the present results across three studies and nearly 6,000 participants indicate a robust association with IER. Low levels of conscientiousness may be more common but demonstrate a weaker effect according to relative importance indicators.
When exploring the antecedents and consequences of IER, researchers should take into consideration the nature of IER. Meade and Craig (2012) found two latent classes of careless responders: inconsistent (e.g., random responders) and invariant (e.g., straightliners). DeSimone et al. (2018) found that response patterns corresponding to these two classes differentially affect the psychometric properties of a test, noting that interitem correlations decrease in the presence of inconsistent responding and increase in the presence of invariant responding. The correlates of inconsistent and invariant responding may differ as well. For example, inconsistent (or random) responders may be higher in impression management than invariant responders, perhaps because they believe that random responding will give the appearance of careful responding.
Limitations
The current research primarily operationalized IER as the repeated selection of illogical response options on CRTAs. The PRF infrequency scale used in Study 2 relies on similar logic (i.e., endorsement of inaccurate item content). Reliance on a single class of IER detection limits the generalizability of the relationship between aggression and IER. Nevertheless, we hope our research inspires future investigations of this relationship. We also hope our demonstration of the predictive utility of illogical responses will inform future conditional reasoning research and inspire test developers to attempt to create measures that incorporate IER detection into items.
The current studies primarily focused on implicit aggression. Although this trait proved capable of predicting IER beyond explicit aggression and conscientiousness, many additional traits could be examined alongside implicit aggression. For example, Bowling et al. (2016) proposed that agreeableness is theoretically associated with lower IER due to its association with kindness. If some aggressive individuals intend to undermine research, perhaps agreeable individuals may attempt to help research by attentively responding. One advantage of using the CRTA to examine implicit aggression was the availability of JMs to help inform the underlying causes of IER. We encourage future research to investigate facets of traits (e.g., altruism and compliance as facets of agreeableness) to better understand why participants exhibit IER.
Finally, the present research focused exclusively on individual differences in the prediction of IER. We did not systematically consider situational factors such as test length, environmental distractions, or research setting. Although we accounted for intellectual ability in Study 3, none of our studies included factors related to respondent interest or motivation. As noted previously, research has only just begun to explore the nomological network surrounding IER. Although a single study cannot model all factors related to IER, we hope that this paper inspires additional research probing the antecedents and consequences of careless responding. Like many response behaviors researched before it, IER can serve as much more than a methodological nuisance variable used to eliminate low-quality data. Respondents who provide low-quality data may be inadvertently providing researchers with a high-quality behavioral indicator of effort.
Conclusion
Across three studies and approximately 6,000 participants, we demonstrate the presence of a relationship between implicit aggression and IER and establish the predictive utility of IER for predicting a behavioral criterion. Implicit aggression is just one of multiple correlates of IER, but a relatively important one given its predictive strength even after accounting for other known correlates such as conscientiousness. We hope we have advanced the understanding of IER’s nomological network, and we encourage future research to continue examining the causes and consequences of IER.
Footnotes
Appendix
Authors’ Note
The fourth author of this paper, Mark N. Bing, passed away during the revision process. Throughout his career, Mark contributed substantially to work on conditional reasoning and research methodology. We will miss his steadfast dedication to high-quality research. We are grateful for his friendship as well as his contributions to this paper and our field. Therefore, we dedicate this paper to his memory. We also acknowledge the mentorship of Lawrence R. James that allowed for this research. An earlier version of this paper received the Best Conference Paper Award from the Research Methods Division of the Academy of Management at the 2017 annual conference.
Declaration of Conflicting Interests
The author(s) declared no potential conflicts of interest with respect to the research, authorship, and/or publication of this article.
Funding
The author(s) received no financial support for the research, authorship, and/or publication of this article.