
Abstract
Objectives
The aim of this study was to analyse how demographics (breed, age, sex, neutering status), health and the environment (access to environmental features, weather and emotional state of the owner) affect the quality of life (QoL) of cats as measured by the Feline Quality of Life (FelQoL) questionnaire and its associated instrument. The result of this analysis was used to investigate the validity of the FelQoL questionnaire and instrument to inform pet owners and clinicians on the quantitative effects of different factors on feline wellbeing.
Methods
Responses from 1324 cat owners in the USA and UK were collected and used to compute the wellbeing dimensions characterised by FelQoL and to identify the demographics, health and environment of pet cats. Participants were clients of Banfield Pet Hospital, participants in the Bristol Cat Study or Mars employees. Statistical analysis was used to assess how demographics, health and environment affect the wellbeing scores and to further evaluate the validity of FelQoL.
Results
Results showed the effects of sex, age, health and environment on feline QoL that were compatible with clinical expectations and previous findings. Reference intervals that can be used to identify expected feline QoL across different circumstances and highlight potential causes of reduced wellbeing were also produced.
Conclusions and relevance
Our analysis suggests that FelQoL may be able to provide guidance on factors causing reduced feline wellbeing. FelQoL can also be used by cat owners to track QoL at home, instigating more intentional veterinary consultations when the wellbeing of a cat decreases even without obvious illness or injury. Further research, including targeted analysis of specific diseases and the exploration of longitudinal changes in FelQoL scores within individual cats over time will have the potential to assist with screening and quantification of effects of various factors on wellbeing and monitoring of targeted health plan interventions.
Plain language summary
This study examines how a cat’s breed, age, sex, health and living conditions affect its quality of life, which refers to a cat’s overall happiness and wellbeing. Understanding how different factors affect cats’ quality of life helps veterinarians and pet owners make better decisions to care for their cats. The researchers used the Feline Quality of Life (FelQoL) questionnaire to collect data from 1324 cat owners in the USA and UK. The questionnaire provides information on seven areas of cat happiness and wellbeing. They also gathered details about the cats’ demographics, health and living environments. These data were used to understand how different aspects of a cat’s life affect its quality of life. The researchers found that age, health and environment significantly impact a cat’s quality of life. For example, older cats and those with health problems were less active and social, while cats with access to places to perch were more active. These findings show that the FelQoL questionnaire is useful for assessing a cat’s wellbeing. The study highlights various factors that can affect a cat’s quality of life and offers suggestions for pet owners to improve their cats’ lives. This study emphasises the need for tools like FelQoL to better measure cats’ quality of life. By understanding what affects their happiness and wellbeing, owners and vets can collaborate to help cats live better lives.
Keywords
Introduction
This is the second paper of a two-part series on the development of the Feline Quality of Life (FelQoL) questionnaire. This paper focuses on the association between pet demographics, health and the environment on quality of life (QoL) scores. More details on the context, development and statistical validation of FelQoL can be found in part 1. 1
QoL of human and non-human animals is defined as their combined physical, mental and emotional wellbeing.2–4 QoL assessments are widely used in evaluating human wellbeing5–11 and are becoming increasingly important in feline medicine12–15 to build a holistic view of wellbeing, encompassing physical health, nutrition, exercise, social interaction and environmental enrichment.12–19
Despite the availability of several QoL questionnaires for pets3,14,16,18–22 and active efforts to promote wellbeing discussions during consultations, 23 usage of general QoL questionnaires to assess the overall wellbeing of a pet in veterinary practice is still limited. Recent research in the UK indicates that although one-third of veterinarians are aware of their existence, few (<4%) use them. 24 Additional time required during consultations was reported as the main barrier, 24 in line with similar research for humans.25–27 Perceived resistance from pet owners was reported as another key factor. 24
Given these findings, it is important to determine whether QoL questionnaires provide value for both veterinarians and pet owners. This could be achieved by demonstrating that these questionnaires (1) improve the experiences of both parties before, after and during consultations and (2) encourage greater pet owner engagement. The FelQoL questionnaire and its associated instrument 1 were developed with both aspects in mind. To provide benefits associated with veterinary consultations, wellbeing scores would need to support identification of potential issues. As such, the instrument must meet qualitative expectations (eg, decreased mobility with age or disease) and provide quantitative measures of the impact of endogenous factors (associated with the cat itself, like age or sex) and exogenous factors (environmental) on feline wellbeing. If these two conditions are met, QoL scores could be used to narrow the list of potential factors affecting cat wellbeing.28,29 To engage pet owners and avoid survey fatigue, 30 the questionnaire needs to be easy to answer and quick to complete. Furthermore, insights to support their cat’s wellbeing are likely to be valued.
This paper explores the effects of several endogenous and exogenous factors on feline wellbeing as assessed by FelQoL 1 and provides indications on how these findings might be used to support veterinary professionals and support staff in improving cat wellbeing.
Materials and methods
Questionnaire development and data
Details on the data collected and development of the FelQoL instrument are outlined in part 1 of our two-part series. 1
The final questionnaire consists of 37 items, which are used to compute seven QoL domain scores (Table 1). Additional questions that did not contribute to domain scores were included only for validation and stratification purposes. These included questions on demographics, health, environment (including weather) and on the overall QoL of the owner and their cat. Information on environment and weather were collected using multiple-choice questions (Figures S9 and S10 in the supplementary material). To minimise any anchoring effect, 31 the owner was asked about feline QoL at the beginning of the questionnaire and their own QoL at the end.
The seven domains of the instrument with their description and relevance
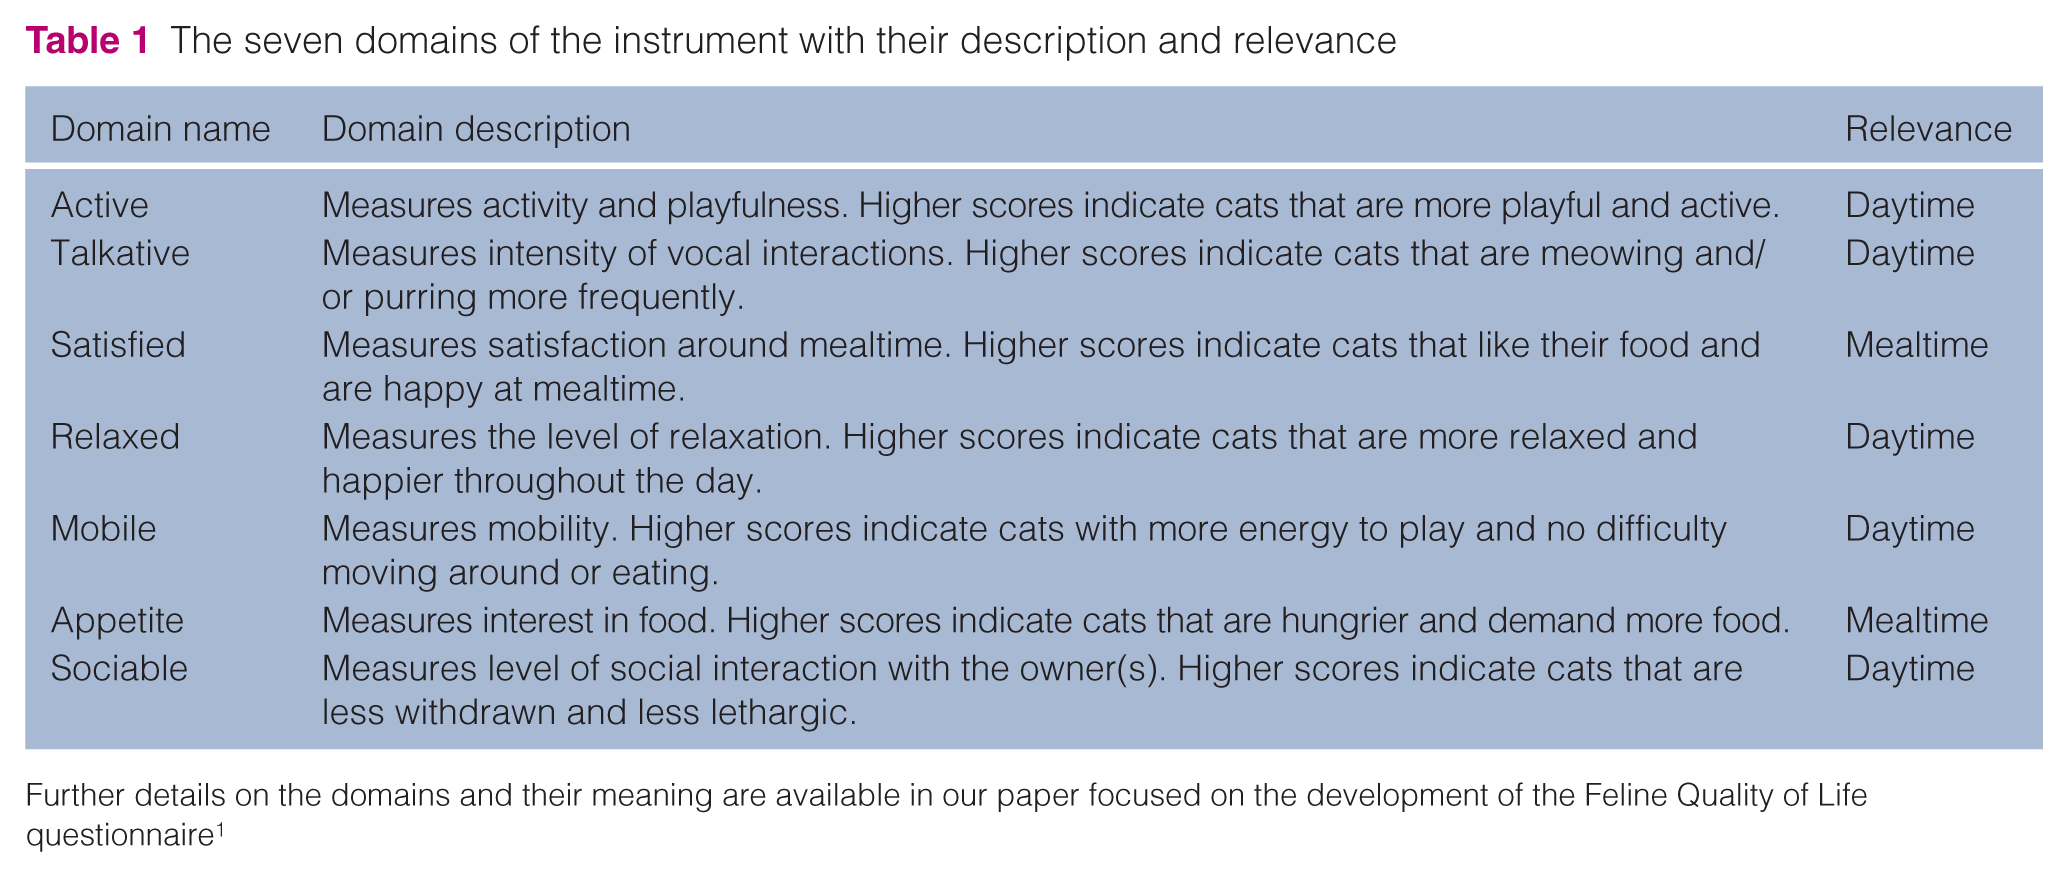
Further details on the domains and their meaning are available in our paper focused on the development of the Feline Quality of Life questionnaire 1
Scores for each domain were computed by using the FelQoL instrument, which was developed using factor analysis. Briefly, factor analysis specifies the number of domains, then it identifies the best mapping from item scores to domain scores, so that each domain captures coherent variations in groups of items. The mapping is constructed in a data-driven way by identifying patterns in the item scores across many questionnaire responses. Each item is assigned a weight for each domain.
For each domain, only a small number of items have weights large enough to meaningfully contribute to the domain score. These high-weight items can therefore be used to characterise the domain. The domain score is computed by (1) multiplying the value of each item by its domain-specific weight, (2) summing the weighted item values and (3) normalising the result to a scale in the range of 1–7.
Factors analysis does not assign a name to an identified domain, but it is common practice to review items in each domain and assign a name to describe the overarching theme of the domain. This adds a degree of arbitrariness but simplifies discussion and interpretation. For example, the Mobile domain of FelQoL is not a direct measure of the mobility of the cat, but indicates a concept related to mobility based on items within that domain that tend to describe mobility, such as ‘difficulty moving around’, ‘lacking energy to play’ or ‘wobbly’. For this reason, it is inappropriate to compare the Mobile score of FelQoL with a different mobility score obtained using other instruments or scales.
In addition to developing the instrument and deriving meaningful domain scores, we sought to assess its robustness and to better understand how environmental, health and demographic factors relate to feline wellbeing. Therefore, additional pet-related data were collected.
Owner-reported pet health
To evaluate the sensitivity of the FelQoL instrument, the question ‘Has your cat been diagnosed with any medical condition by a vet?’ was included, which obtained information on owner-reported health conditions. If the owner answered positively, a follow-up question provided a list of possible categories: heart, dental, digestive, kidney, skin, obesity, parasitic infestation, orthopaedic problems (only for respondents from the Bristol Cat Study) and other conditions. Multiple answers were allowed. For ‘other conditions’, there was the option to specify these in a free-text box.
The list of diseases was selected from reported common conditions,32,33 with additional ones suggested by veterinary co-authors and experts from the Waltham Petcare Science Institute and Mars Veterinary Health. The list was designed to explore the sensitivity of FelQoL to common disease categories and is not exhaustive.
Keywords listed by owners for ‘other conditions’ were mapped by the authors, which included veterinarians and experts in feline medicine. Some were mapped to existing categories while others were used to create new ones (eg, endocrine problems). Keywords for diseases occurring only in small numbers of cats (<3) or that were difficult to map without additional context were mapped to the ‘other’ category (Table S1 in the supplementary material).
Collecting data on the health condition of a pet by directly asking the pet owner via a questionnaire has the advantage of being easy to obtain; however, there are limitations. For example, a cat may be suffering from conditions that have not yet been diagnosed. Hence, we cannot be completely sure that a cat described as healthy in this study is indeed free from ailments, which could lead to that cat being wrongly classified as healthy. Furthermore, even if a condition is indicated, we are not asking about the severity of the condition, which limits our ability to effectively explore how severity of a condition affects feline behaviour and wellbeing. Notwithstanding these limitations, we expect pet owners to be aware of the general wellbeing of their pets; therefore, this question provides a good approximation of the cohort of pets that are either generally ‘healthy’ or affected by specific conditions.
Statistical methodology
QoL scores were computed using the FelQoL instrument. 1 Spearman’s rank correlation was used to explore relationships in the data when appropriate. Statistical testing was performed using the t-test, ANOVA or correlation tests. The Wilcoxon rank-sum test and Kruskal–Wallis test were also used to confirm our conclusions. All P values were computed using two-tail tests. When mentioned, P value adjustment was performed using the Holm–Bonferroni method, considering the number of tests performed in a single figure. Analysis and statistical testing were performed using the R statistical software version 4.2.2 34 and tidyverse. 35
Statistical comparisons were designed to explore whether different demographics and the presence/absence of certain factors resulted in different QoL domain values.
Lower limits for the domain scores in the majority (95%) of reported healthy cats were obtained by considering the 5th quantile for each domain when the analysis was restricted to cats with no owner-reported health conditions.
Following established practice,36,37 cats were classified into four life stages: adult (1–6 years), mature adult (7–10 years), senior (11–14 years) or super senior (15+ years). Cats without a valid life stage were excluded from any analysis that included life stage information, resulting in 837 presumed healthy and 404 classified as non-healthy cats.
Results
Effect of breed, sex, age and neutering
The Active and Satisfied domains differed significantly across breed (ANOVA P <0.001; Figure S1 in the supplementary material), with longhair cats scoring low for Active (mean 4.0) and Satisfied (mean 5.5), Siamese cats scoring high for Active (mean 4.4) and Maine Coon cats scoring high for Satisfied (mean 5.7). These differences remain visible when only presumed healthy cats are considered, although with less statistical significance, suggesting a potential interplay of breed and health (Figure S2 in the supplementary material).
As older cats are more likely to have medical conditions, to better assess the effect of age, we looked at differences in domain scores across life stages in cats without owner-reported health conditions and found a strong and statistically significant decrease in Active, Mobile and Sociable domains with increasing age (Figure 1 and Figure S3 in the supplementary material). By using arithmetic means to characterise average cats in different age groups, we noticed that mature adult or senior cats (aged 7–14 years) had 11% and 14% lower scores for Active, 2% and 5% lower scores for Mobile, and 2% and 3% lower scores for Sociable compared with adults (aged 1–6 years). Even stronger effects were found for super senior cats (aged ⩾15 years) – that is, 26% lower scores for Active, 17% lower scores for Mobile and 9% lower scores for Sociable.
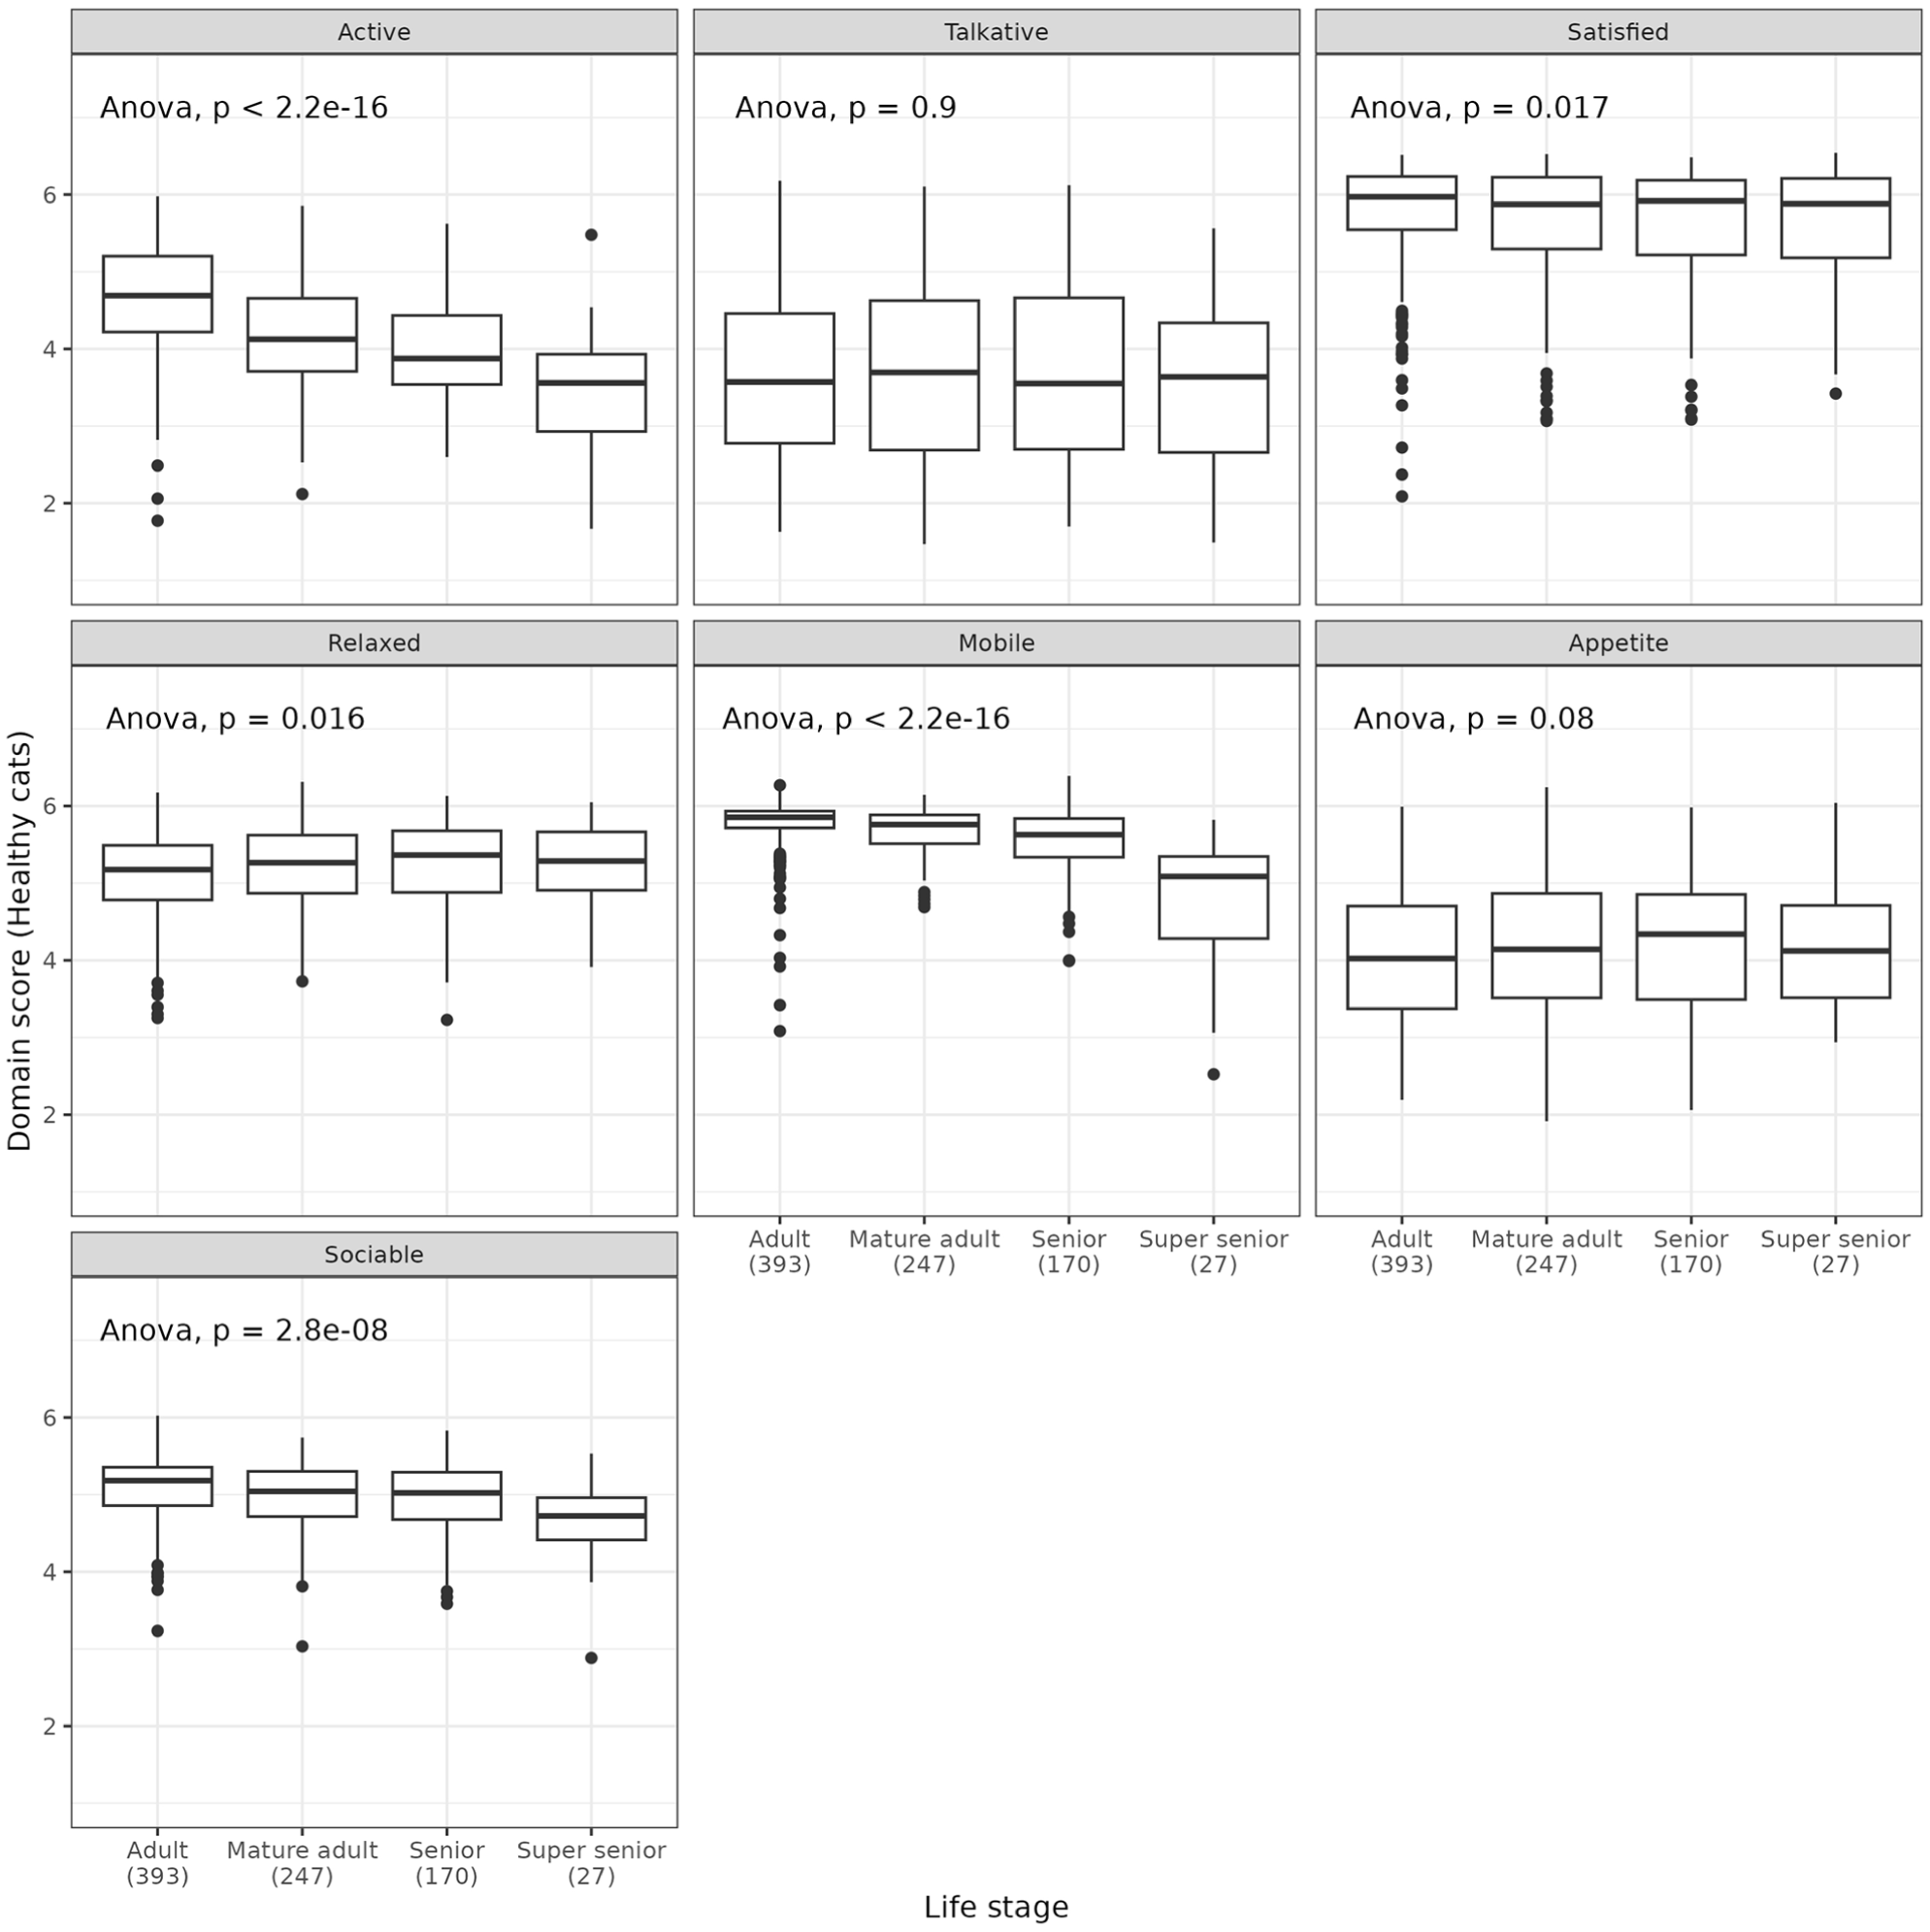
Domain scores across life stages for presumed healthy cats. Domain scores are reported on the y-axis and the life stage is reported on the x-axis. P values from ANOVA are reported. Numbers in parentheses indicate the number of cats in each group
Supporting feline healthy aging is an important goal of veterinary science. Since domain scores tend to decrease with age, we sought to identify a minimal value for a cat to be perceivably healthy across different life stages. To this end, we defined minimum domain score thresholds corresponding to the lowest 5% of scores among owner‑reported healthy cats, such that 95% of this population scored above them (Table 2). Cats scoring below these thresholds fall outside the range observed for most owner‑reported healthy cats and may require closer monitoring to detect early signs of declining health or wellbeing.
Lower limits for the domain scores in the majority (95%) of reported healthy cats*
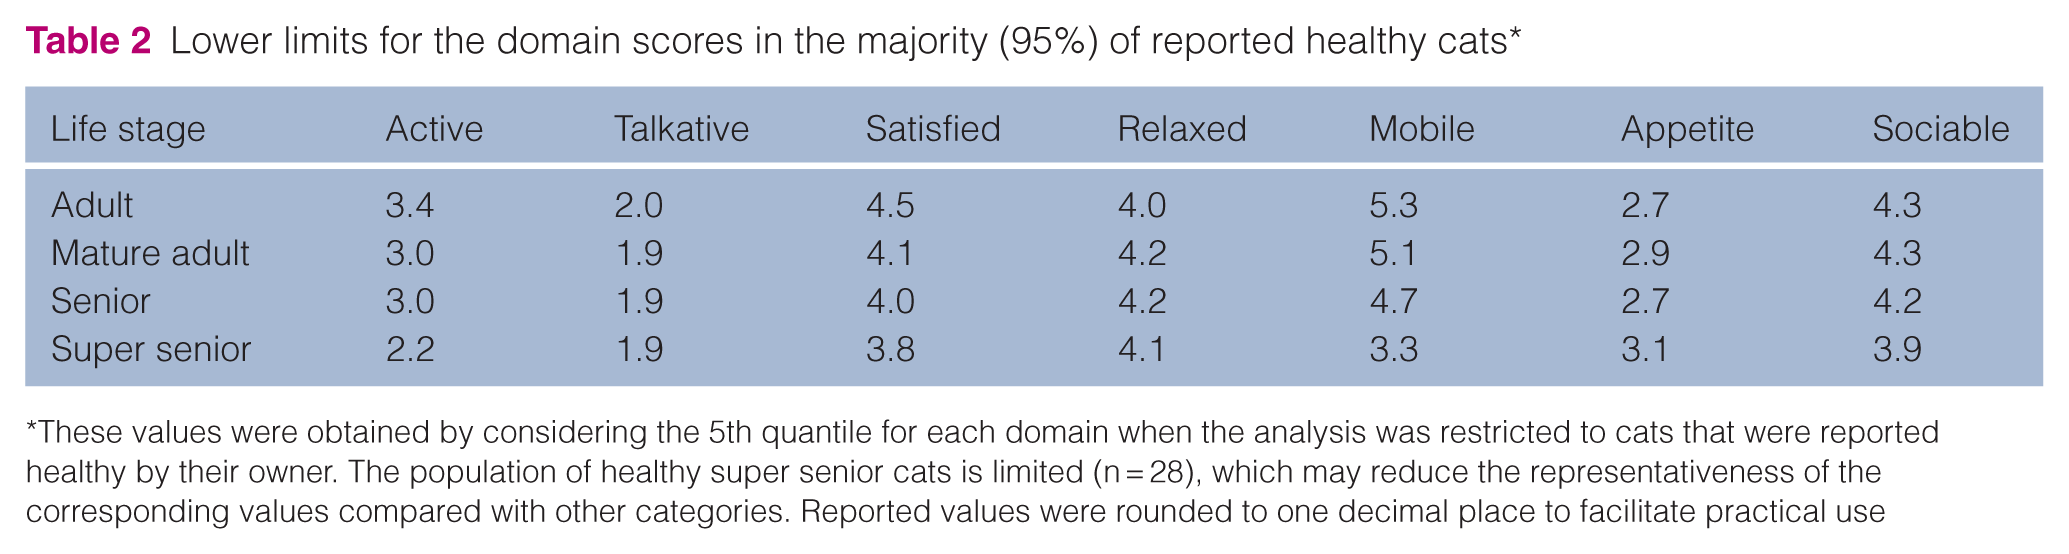
These values were obtained by considering the 5th quantile for each domain when the analysis was restricted to cats that were reported healthy by their owner. The population of healthy super senior cats is limited (n = 28), which may reduce the representativeness of the corresponding values compared with other categories. Reported values were rounded to one decimal place to facilitate practical use
The Appetite domain was significantly higher (t-test P <0.0001) in males (mean 4.1) vs females (mean 4.3) and the Active domain was significantly higher (t-test P <0.001) in entire (mean 4.9) vs neutered (mean 4.2) (see Figures S4 and S6 in the supplementary material). These differences remain visible and statistically significant when only presumed healthy cats are considered (Figures S5 and S7 in the supplementary material).
Effect of owner-reported health conditions
Our data included 414 (31%) cats with at least one owner-reported health condition, 887 (67%) reported to be ‘healthy’ and 23 (2%) for which the owner was unsure. The rarest conditions affected nine cats and the most common 110 cats (Figure S8 in the supplementary material). The same cat could be associated with multiple conditions.
To assess the impact of different owner-reported health conditions, we explored whether those affected cats had different QoL scores compared with presumed healthy cats (Figure 2) across each domain.
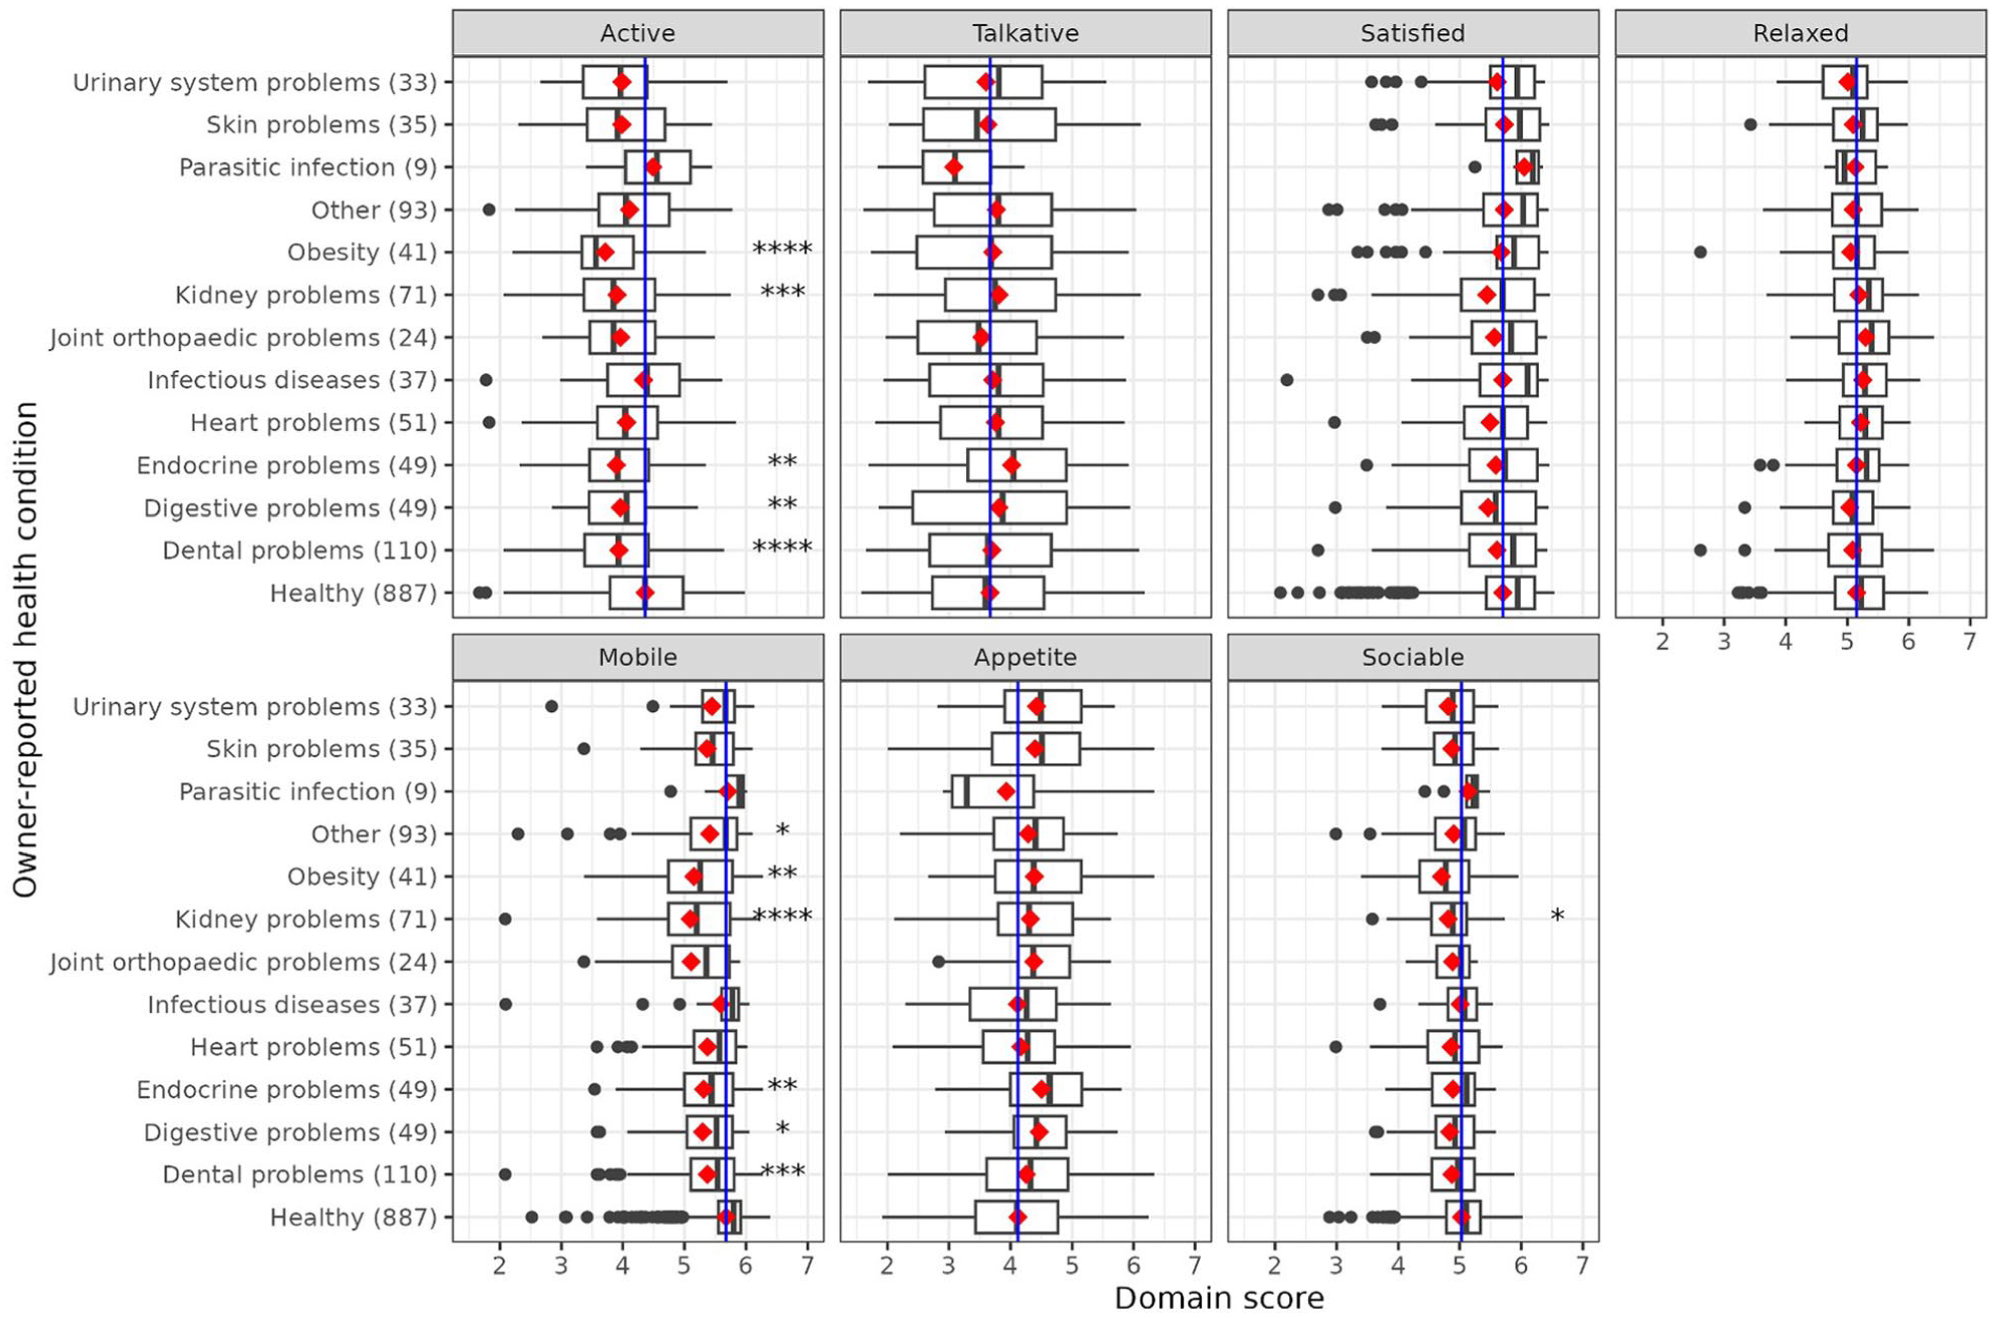
Distribution of domain scores for owner-reported diseased and healthy cats. The y-axis shows the owner-reported health condition of the cat. Reported healthy cats are plotted at the bottom. The other categories contain cats with the owner-reported condition and zero or more additional owner-reported conditions. A standard asterisk system is used on the right to indicate the level of statistical significance (*p < 0.05, **p < 0.01, ***p < 0.001, ****p <0.0001) from a t-test comparing reported healthy cats with each owner-reported condition after adjustment for all the comparisons in the figure. In addition to the boxplot (reporting the 1st and 3rd quartile in addition to the median), a red diamond indicates the mean of the distribution. The vertical blue line indicates the mean of the distribution of the scores for reported healthy cats. Note that the same cat can be present across multiple categories if affected by multiple owner-reported conditions
Statistically significant decreases (t-test adjusted P <0.01) in Active domains were present for owner-reported dental, digestive, endocrine or kidney problems, and obesity (Figure 2).
The Mobile domain showed statistically significant decreases (t-test adjusted P <0.05) with owner-reported dental, digestive, kidney or endocrine problems, and obesity (Figure 2).
The Sociable domain displayed statistically significant decreases for owner-reported kidney problems (t-test adjusted P <0.05) (Figure 2).
The Appetite, Talkative, Satisfied and Relaxed domains did not show statistically significant changes associated with the medical conditions considered.
Non-healthy cats would be expected, on average, to have domain scores below the healthy norm that we derived previously (Table 2). This should be particularly true for cats with multiple health conditions. To assess this, we calculated the percentage of cats with single and multiple conditions whose scores fall below the healthy norms (Figure 3).
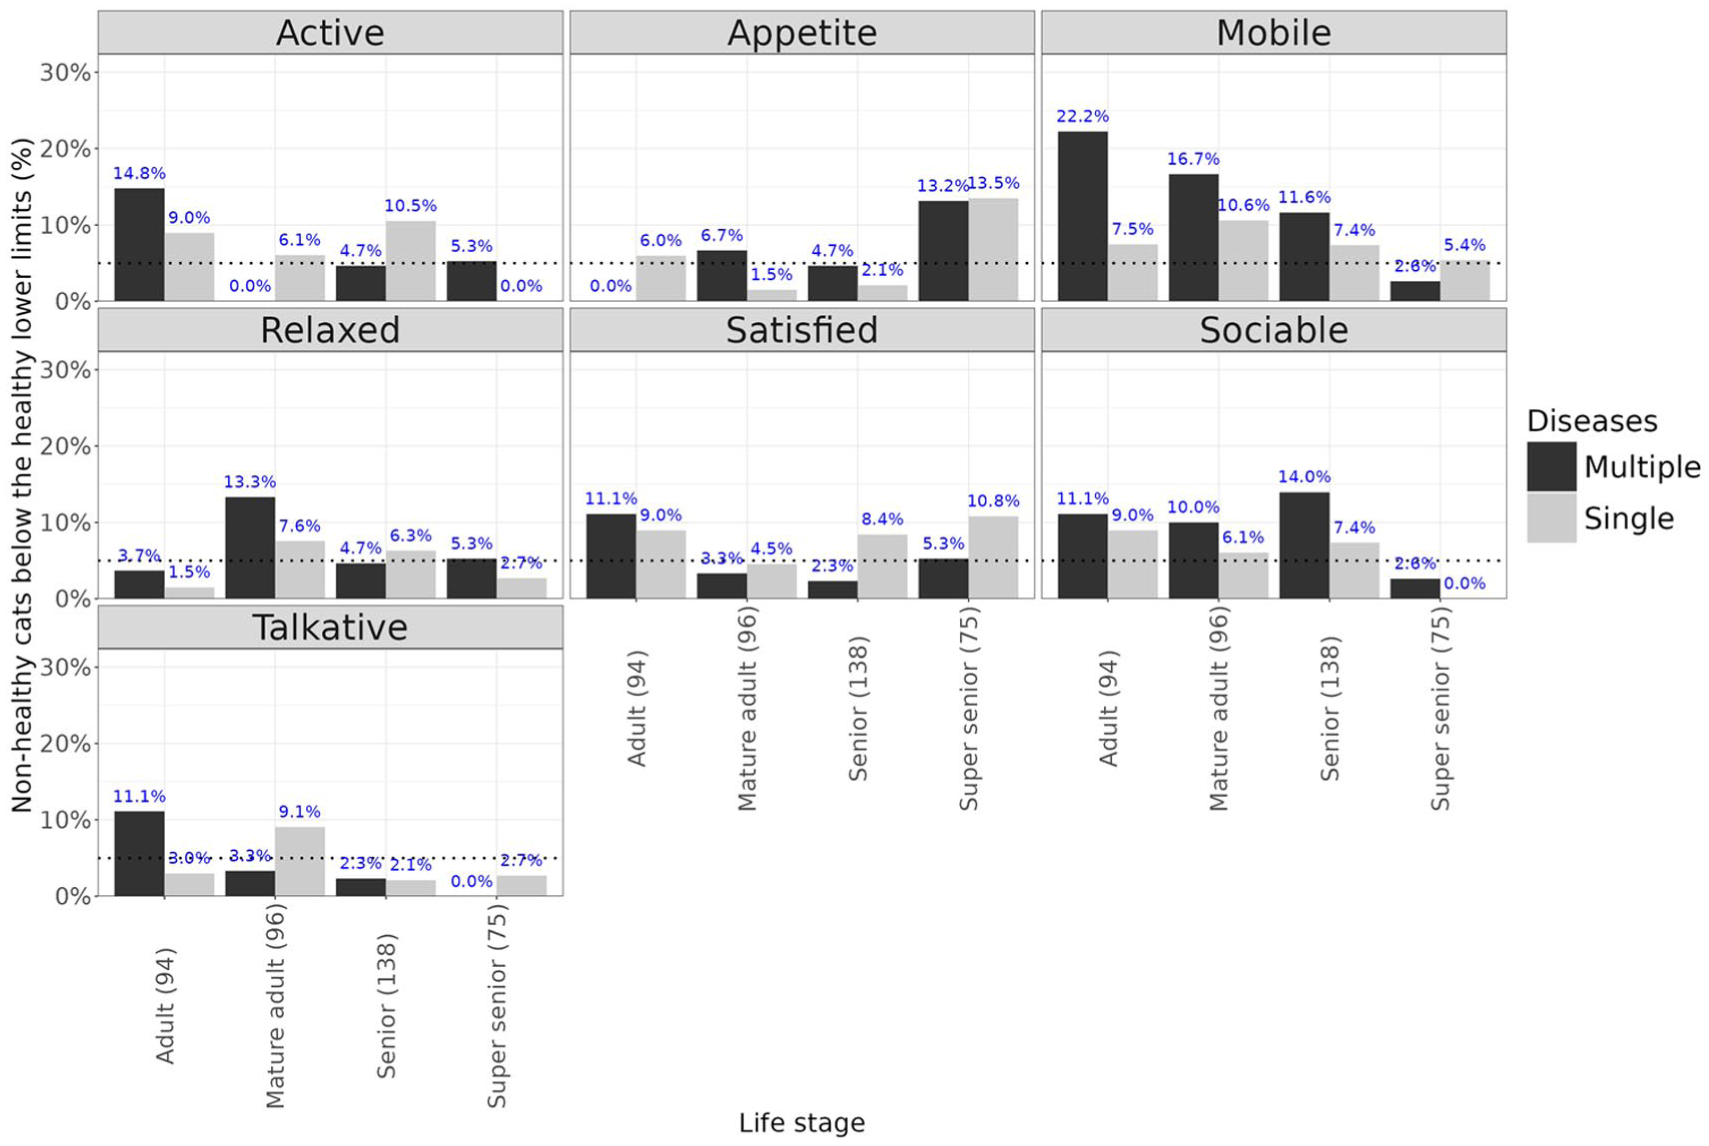
Percentage of cats with at least one owner‑reported disease that fall below the healthy lower limits shown in Table 2. Cats were categorised into two groups: those with a single condition (single, light grey) and those with two or more conditions (multiple, dark grey). For each bar, the corresponding percentage is shown as blue text above the bar. A dotted line indicates the expected percentage (5%). Numbers in parentheses indicate the number of cats in each group
Large percentages (up to 22%) of non-healthy cats have values below healthy norms for the Mobile and Sociable domains. For the other domains, the results are mixed, with a large percentage (approximately 15%) for some life stages but not others. Compatible with expectations, the percentages are generally higher for cats having multiple diseases compared with cats with only one (Figure 3).
Effect of environmental features
When looking at the environmental features considered (Figure S9 in the supplementary material), the presence of a cat flap, garden and places to perch was associated with a statistically significant difference for at least one domain (Figure 4).
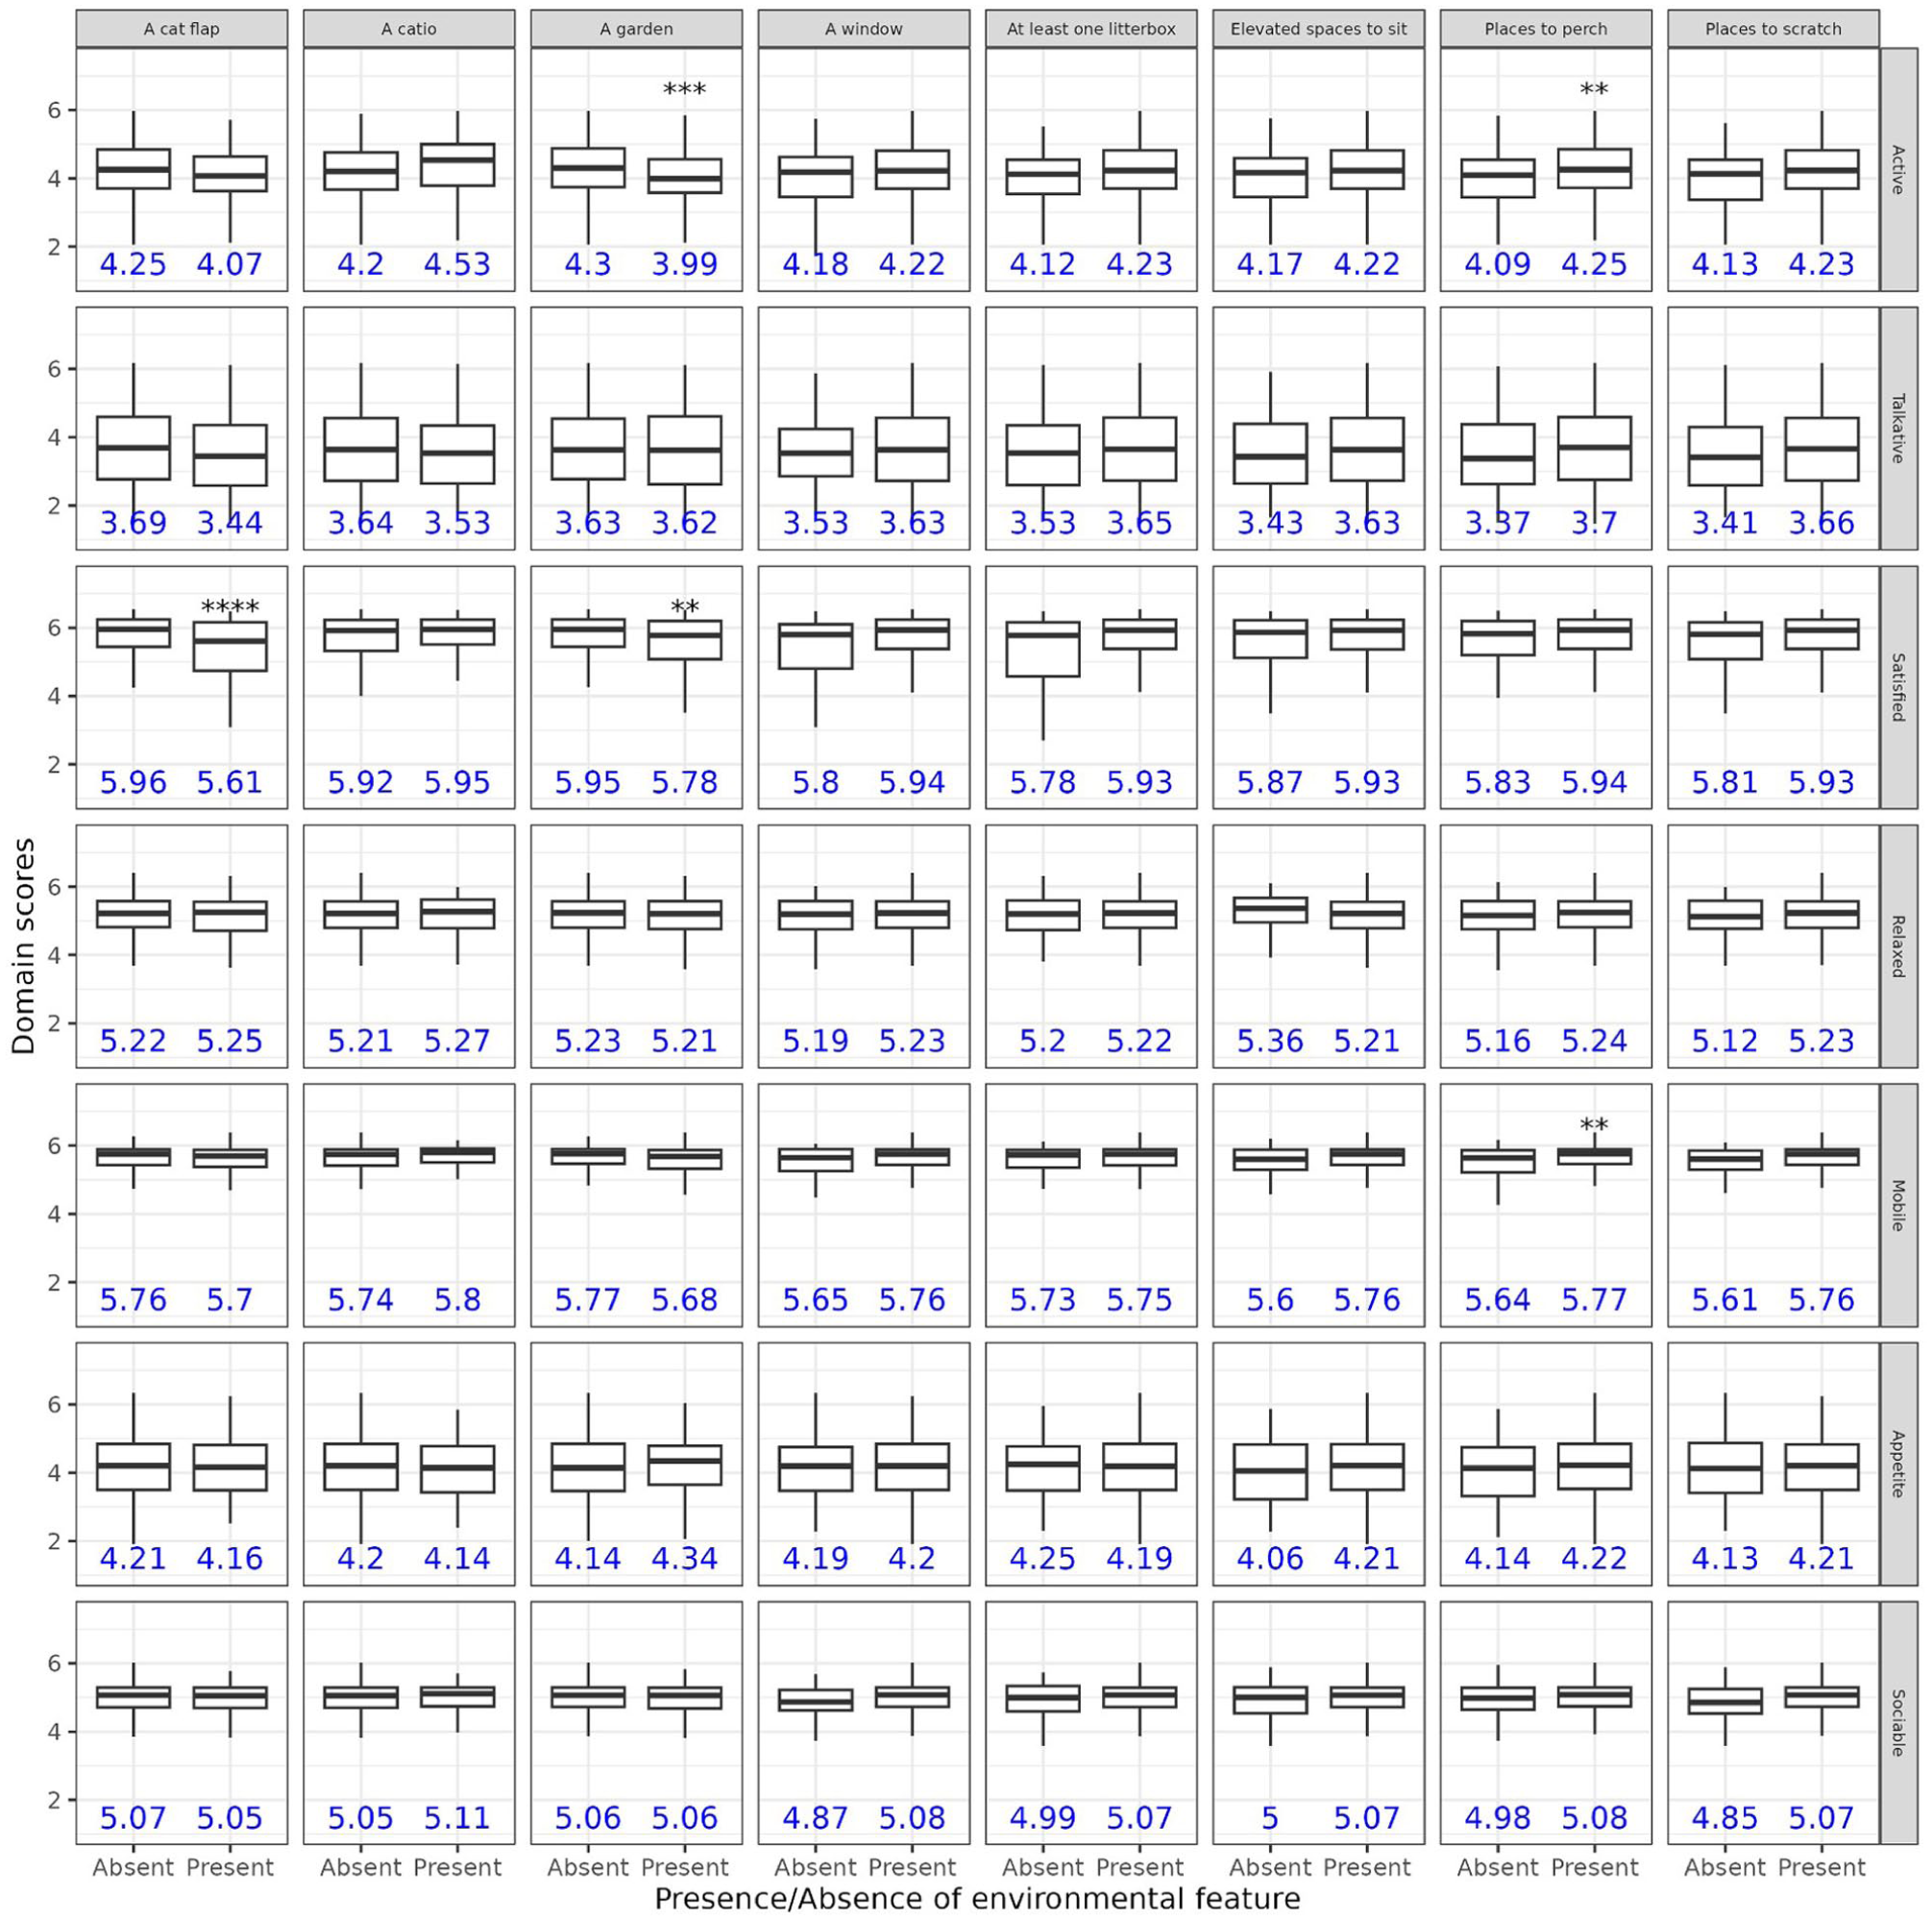
Effect on the domain scores (vertical panels) of a presence/absence (x-axis) of subset of environmental features (horizontal panels) for owner-reported diseased and healthy cats. A standard asterisk system (*p < 0.05, **p < 0.01, ***p < 0.001, ****p <0.0001) is used on the top of the panel to indicate the level of statistical significance from a t-test comparing cats with vs without the feature after adjustment for all the comparisons in the figure. Note that the same cat can be present across multiple categories if living in an environment with multiple environmental features present when the questionnaire was compiled. Only environmental features for which at least one unadjusted statistically significant difference (unadjusted P <0.05) was observed are plotted. The blue text indicates the median of the distributions
The presence of places to perch resulted in statistically significant (t-test adjusted P <0.01) increases for the Active and Mobile domains. The presence of a garden or a cat flap resulted in statistically significant (t-test adjusted P <0.01) decreases for the Active and Satisfied domains (Figure 4).
When restricting the analysis to presumed healthy cats, the direction of these effects is retained, and the associations with the presence of a garden and a cat flap remain statistically significant (Figure S10 in the supplementary material).
Effect of weather
Previous research has identified changes in pet behaviour associated with weather patterns, and we sought to explore whether FelQoL domains were sensitive to this variation. Therefore, scores of cats exposed to a given weather condition were compared with scores of cats not exposed to that condition. It is worth highlighting that cats can be exposed to multiple conditions at once and that there is a degree of subjectivity in how the weather is evaluated by their owner. For this reason, these results need to be interpreted with caution.
When looking at the weather features considered (Figure S11 in the supplementary material), no significant differences were present after P value adjustment (Figure 5). Restricting the analysis to presumed healthy cats yielded similar results, with only a weakly statistically significant (P <0.05) increase in the Active domain for Mild weather (Figure S12 in the supplementary material).
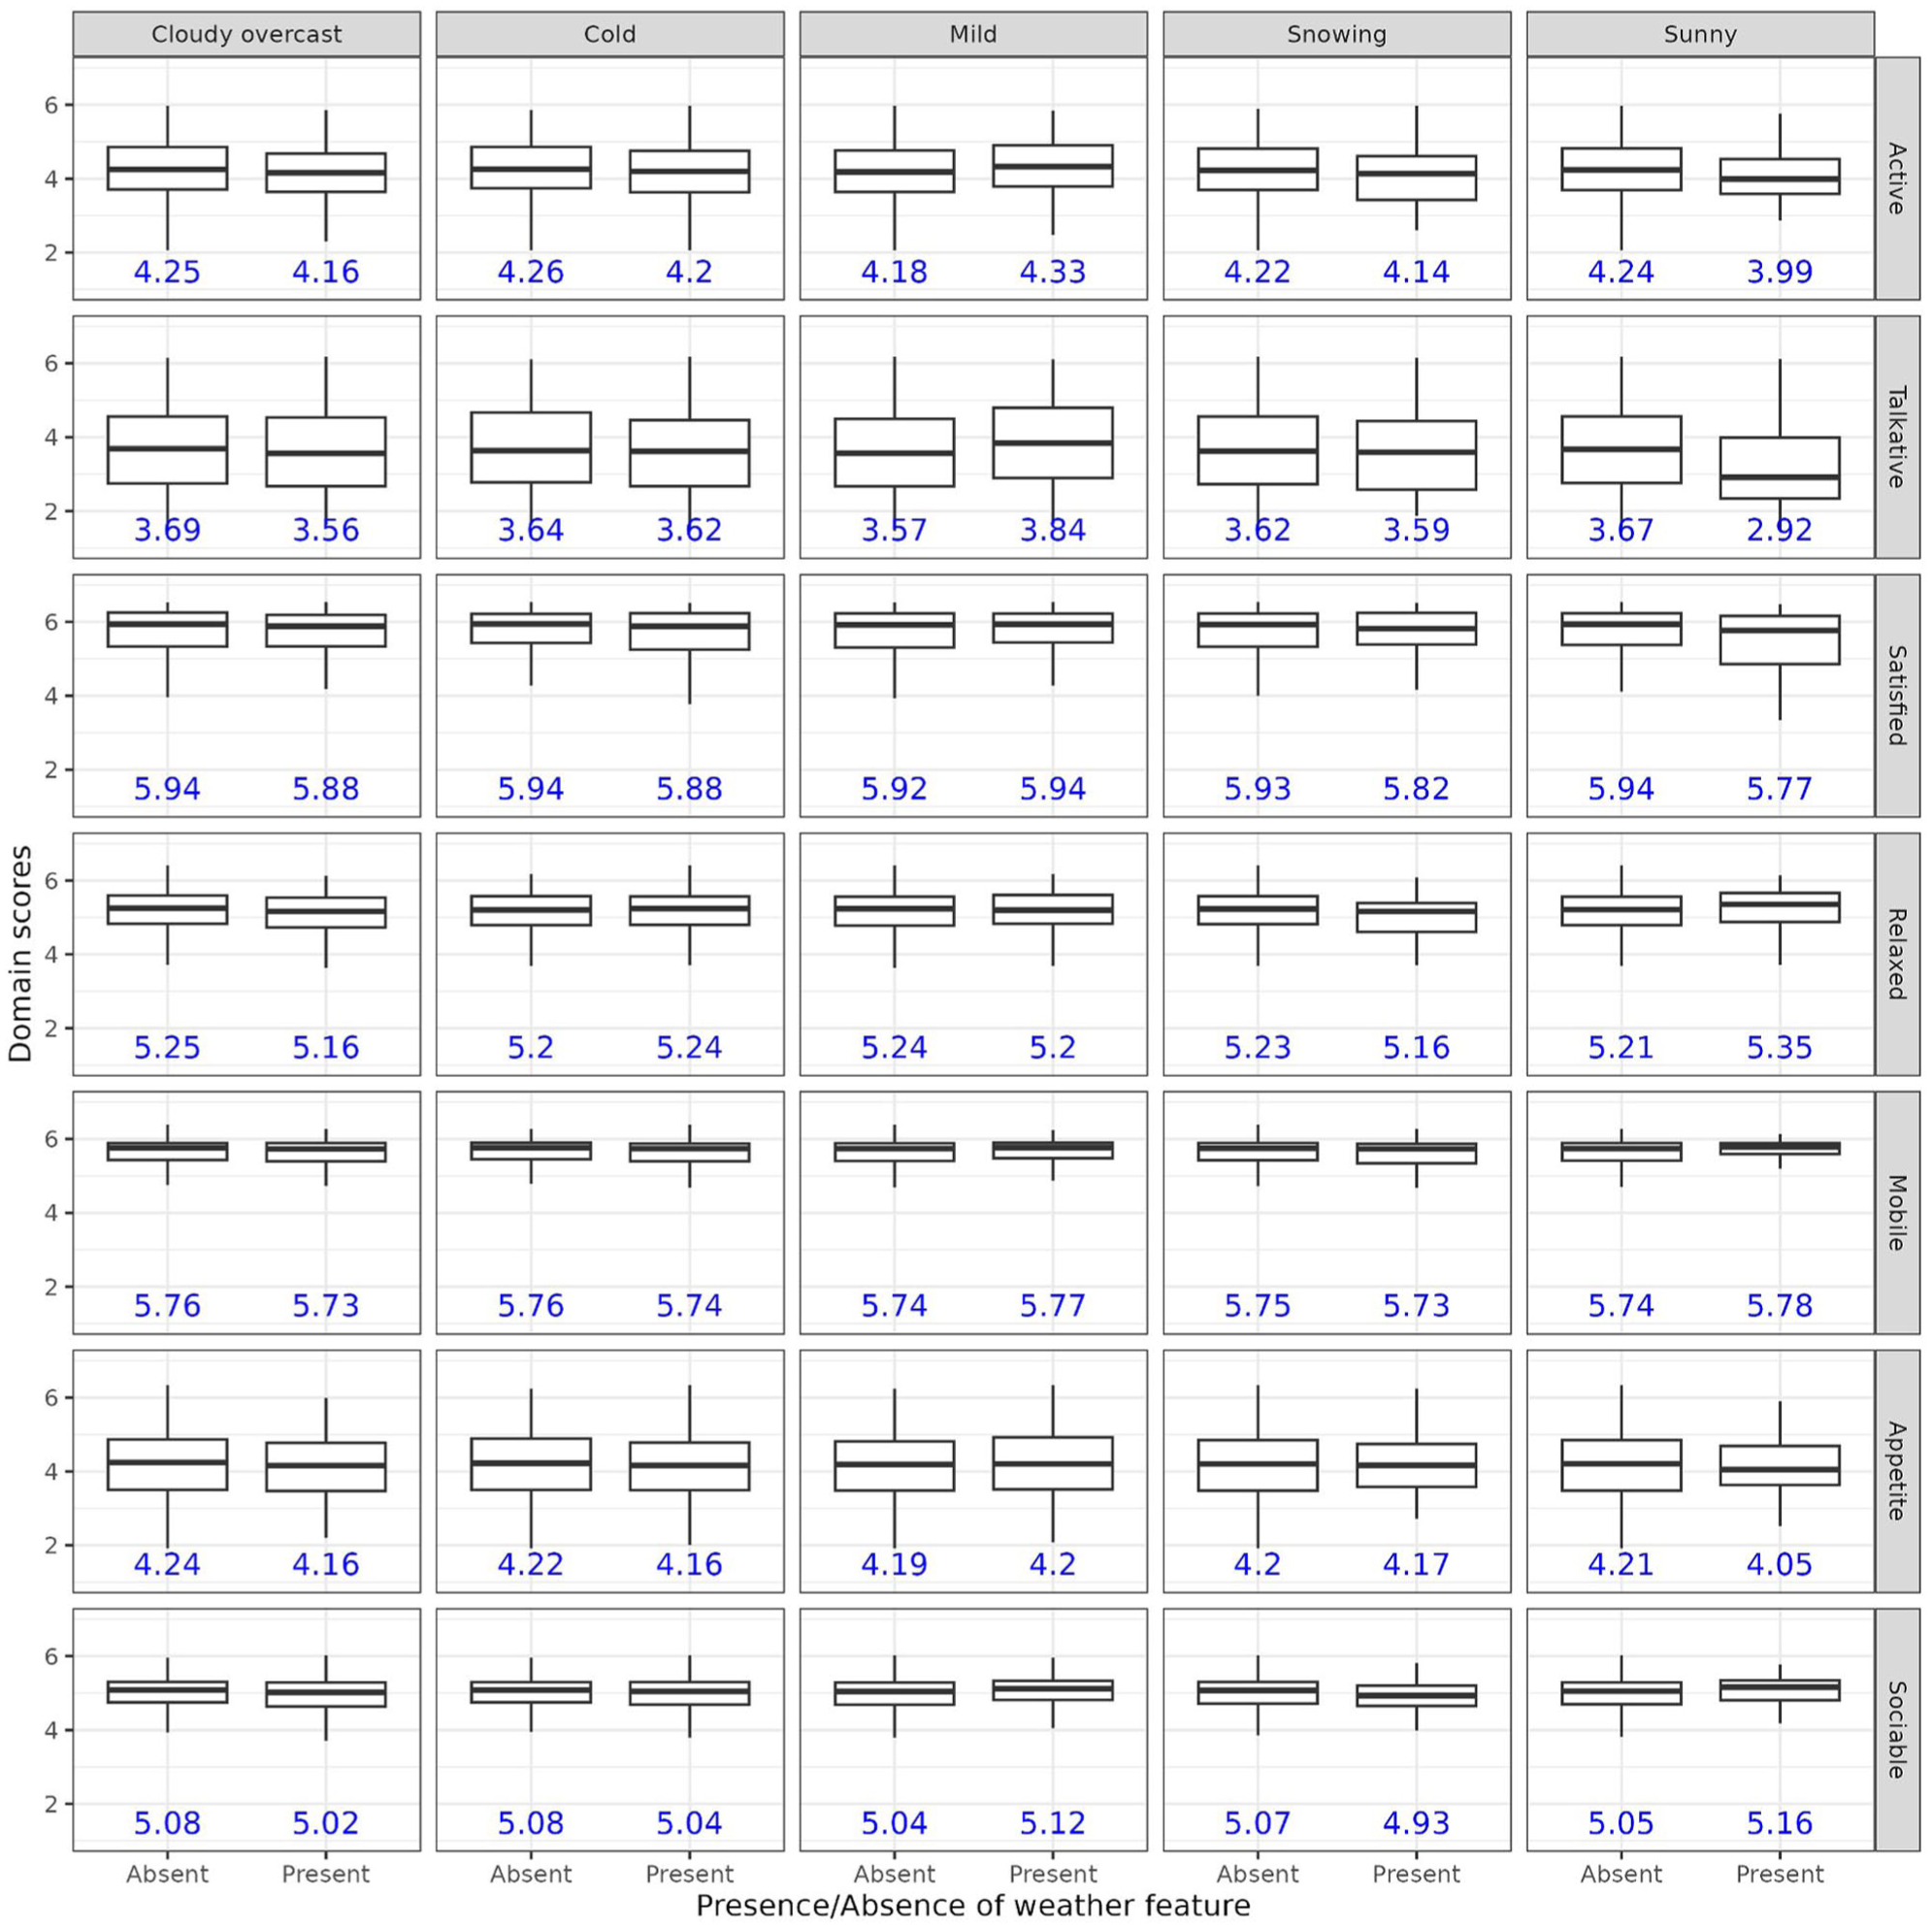
Effect on the domain scores (vertical panels) of a presence/absence (x-axis) of subset of weather features (horizontal panels) for owner-reported diseased and healthy cats. No significant difference was observed after adjustment. Note that the same cat can be present across multiple categories if multiple weather features were present when the questionnaire was compiled. Only environmental features for which at least one unadjusted statistically significant difference (unadjusted P <0.05) was observed are plotted. The blue text indicates the median of the distributions
Effect of owner quality of life
As part of the questionnaire, the owner was asked to evaluate the QoL of themselves and their cat on a scale of 1–100. Note that this value represents a subjective evaluation of the perceived QoL and should not be confused with a more objective score obtained by evaluating the physical and emotional wellbeing of a pet and their owner by trained professionals or other validated tools.
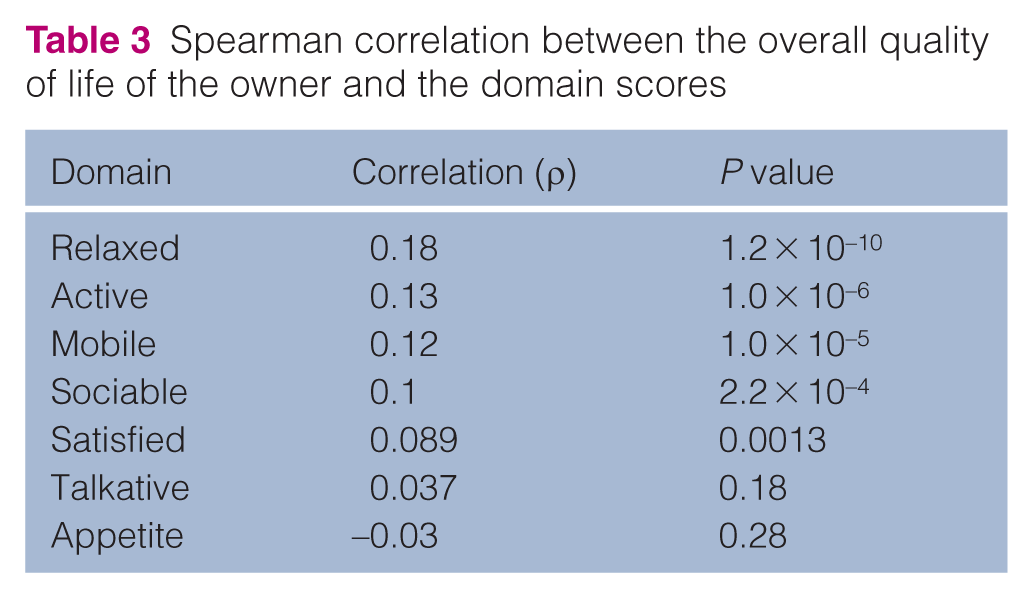
Very weak (0.1 < ρ < 0.18), although statistically significant (P = 0.00022), correlations were observed between the owner QoL and the Active, Relaxed, Mobile and Sociable domain scores of their cats (Table 3). A weak (ρ = 0.38) but highly statistically significant correlation (P <0.0001) was found between owner QoL and the overall QoL of their cats.
Spearman correlation between the overall quality of life of the owner and the domain scores
Discussion
Reliable measurement of feline QoL is highly valuable for monitoring wellbeing and can guide strategies for its improvement, yet such measurement remains challenging. Even when pet owners are asked to assess QoL from a wellbeing perspective, there is no explicit consensus on how individual feline behaviours should quantitatively contribute to QoL.
A widely adopted solution is to use structured questionnaires in which multiple human assessors report the frequency of behaviours plausibly associated with feline wellbeing. Statistical analysis can then identify coherent patterns in these responses and derive corresponding QoL domains, defined as latent groupings of related behaviours that represent distinct aspects of feline wellbeing, creating an implicit consensus that depends on, but is not limited to, the assessor population.
Our paper used the FelQoL questionnaire and associated instrument to explore how different factors are associated with changes in feline wellbeing.
Differences in feline QoL as measured by the FelQoL domains were observed with demographics (breed, sex, age and neutering status) and owner-reported information on the living environment. These differences were present even when focusing only on healthy cats. We did not detect an effect of weather conditions after P value adjustment, and the association between owner QoL and cat QoL, although generally highly significant, was weak.
Although further research is needed to fully assess the value of FelQoL, particularly to better clarify the effect of confounding factors on the effect measured, our initial exploration identified several results that aligned with expectations, suggesting that the FelQoL instrument may provide helpful insights in evaluating the impacts of changes in cats’ health or home environments. For example, it is commonly accepted that aging is associated with various alterations in feline behaviour38–40 and the results were compatible with expectations that mobility, activity and sociability decrease.38,41
Observed effects of the physical environment indicate that environmental enrichment, such as places to perch, are associated with significant differences in specific FelQoL domain scores, suggesting that they may influence the cat’s physical behaviour as observed by the owner. The observed effects are also in line with previous research.42–44 Interestingly, cats that had access to a garden or a cat flap had lower scores related to activity and meal satisfaction. The most plausible explanation is that cats who are predominantly active outside (hence appearing less active when their owner is present) may supplement their diet by hunting or obtaining food from neighbours (hence appearing less satisfied). It should be kept in mind that some environmental features may have been added by the owners in response to their cat’s behaviour, and more focused research will be needed to confirm the temporal nature of these effects. It is also worth noting that cats that spend significant time outside may not be assessed as effectively compared with indoor cats as their owners may see them less. Further work focused on assessing the level of human–cat interaction needed to properly use FelQoL will clarify this aspect.
Although some differences were observed, there were no significant associations between the weather and cat behaviour.
When looking at disease effects, we used owner-reported health problems, an approach that is not without limitations. First, some conditions are known to be under-reported, for example, periodontal disease, which require probing under general anaesthesia for true accuracy. 45 Moreover, the current data set lacks information on when or how a disease has been diagnosed, its progression and any past or present treatments. While accepting these limitations, the results provide some initial guidance and some consistency with veterinary professionals’ expectations,46,47 including the effect of dental problems on the Mobile and Active domains, which are related to the mobility and activity of a cat.48–50 Pain and reduction in appetite (and energy) are both potential contributors. It also worth pointing out that owner-perceived difficulties in eating (as measured by the ‘difficulties in eating at mealtime’ item) were clustered together with more mobility-focused items, such as ‘wobbly’ or ‘difficulties moving around’, when factor analysis constructed the Mobile domain. 1 Since factor analysis is a data-driven approach, this is an indication of the association between eating difficulties and limited mobility as perceived by the pet owner. Although the effect of difficulties in eating is small compared with other items more focused on physical mobility, further analysis is warranted to fully evaluate how eating and mobility issues contribute to the Mobile domain across different scenarios and to better understand how FelQoL should be used in the presence of serious eating problems. Further analysis could be of value in providing evidence to owners of the significant effects of poor oral health on QoL, justifying interventions and demonstrating postoperative improvement that anecdotally is often long-lasting or permanent.
Obesity and osteoarthritis were also associated with significantly lower scores for Active and Mobile, as expected.46,51
Several diseases – including digestive, kidney and endocrine problems – resulted in a significantly lower Mobile score, suggesting this might be a surrogate for lethargic behaviour.
Given the importance of characterising healthy aging in cats,41,52,53 we provided a preliminary table with lower limits for QoL scores across the different domains (Table 2). Notably, many cats, particularly those in older life stages, may be suffering from highly prevalent age-related diseases that are not recognised, including dental disease and osteoarthritis. Such conditions may unfortunately be normalised as ‘part of aging’ but can be treated and at least mitigated. Further studies where cats are followed over long periods of time, with such diseases being more thoroughly investigated and diagnosed, will assist in differentiating QoL effects of age-related physiological deterioration from those of specific disease conditions in isolation or combination. Future work focused on specific diseases or conditions may also provide wider utility for this approach in feline medicine, including earlier detection and monitoring of both progression and treatment responses.
Furthermore, it is worth stressing that the information on the cats’ health condition was obtained from the cat owners. Hence, future work supported by a more precise characterisation of feline health will be needed to refine the values described in Table 2.
As a healthy social relationship with the owner is one of the five pillars of a healthy feline environment, 54 we also investigated whether the owner’s overall QoL had any association with FelQoL. The effect of pet ownership on human wellbeing is also an active research topic,55,56 with variable reports of positive or neutral effects.57–59 Our data indicated a weak correlation between human and feline QoL. However, our data are not sufficient to elucidate the primary cause of this, with human QoL affecting the perception of feline QoL (emotional egocentricity60,61) and feline QoL influencing human QoL57,58 being both plausible contributors. Notably, only a weak correlation was observed when considering owner QoL and the different FelQoL domain scores. This may suggest that by focusing on specific aspects of cat behaviour, FelQoL may allow an owner to take a more detached view. Overall, these findings suggest the potential of FelQoL to support research in this area.
Conclusions
Improving the QoL of cats is a central goal of feline medicine, for which tools are needed that can assess it with minimal effort and generate actionable insights.
This was also our approach for the FelQoL instrument, which was designed to be completed by pet owners independently in approximately 10 mins and has been statistically validated to ensure internal consistency.
To explore the application of FelQoL in a clinical context, we further decided to evaluate how objective variations in cat health and environment were associated with changes in domain scores. Our analysis identified several effects that are compatible with expectations, such as in the context of aging, but the effect of medical conditions and the environment has been more limited.
Our analysis suggests that FelQoL may have value in supporting feline wellbeing – for example, in tracking how well a cat is aging or to monitor a cat’s wellbeing after environmental, dietary or medical interventions. The latter has not been explored here but is an important aspect that will need to be covered in future work.
More focused data collection, with a stronger focus on different medical conditions, a more precise characterisation of different potential confounding factors and a focus on longitudinal data collection for a given cat, will be needed to ensure FelQoL is appropriate for use in a clinical context.
Supplemental Material
Figure S1. Domain scores across breeds.
Figure S2. Domain scores across breeds for presumed healthy cats.
Figure S3. Domain scores across life stages for presumed healthy cats.
Figure S4. Domain scores by sex for presumed healthy and non-healthy cats.
Figure S5. Domain scores by sex for presumed healthy cats.
Figure S6. Domain scores by neutering status for presumed healthy and non-healthy cats.
Figure S7. Domain scores by neutering status for presumed healthy cats.
Figure S8. Number of cats with different owner-reported health conditions.
Figure S9. Percentage of cats with different environmental features.
Figure S10. Effect of environmental features on presumed healthy cats.
Figure S11. Percentage of cats exposed to different weather conditions.
Figure S12. Effect of weather conditions on presumed healthy cats.
Table S1: Keyword mapping into disease categories.
Footnotes
Acknowledgements
The authors would like to thank Ester Bijsmans, Anthea Davies, Geert De Meyer, Zack Ellerby, Serina Filler, Aarti Hogan, Urslaan Youhan, Yeun Li, Darren Logan, Alex Mepham, Carina Salt, John Rawlings, Cecile Vanel and Daniel Waller for valuable discussions and feedback on the project. We thank all survey respondents for donating their time to advance welfare science.
Author note
The data set collected is not publicly available due to restrictions imposed on usage by the consent collected. The data set is available from the corresponding author on reasonable request provided that this request does not conflict with legal requirements around data usage and protection.
Supplementary material
The following files are available as supplementary material:
Figure S1. Domain scores across breeds.
Figure S2. Domain scores across breeds for presumed healthy cats.
Figure S3. Domain scores across life stages for presumed healthy cats.
Figure S4. Domain scores by sex for presumed healthy and non-healthy cats.
Figure S5. Domain scores by sex for presumed healthy cats.
Figure S6. Domain scores by neutering status for presumed healthy and non-healthy cats.
Figure S7. Domain scores by neutering status for presumed healthy cats.
Figure S8. Number of cats with different owner-reported health conditions.
Figure S9. Percentage of cats with different environmental features.
Figure S10. Effect of environmental features on presumed healthy cats.
Figure S11. Percentage of cats exposed to different weather conditions.
Figure S12. Effect of weather conditions on presumed healthy cats.
Table S1: Keyword mapping into disease categories.
Conflict of interest
LA, JPK, AH, TS and TK are employed by Mars Petcare. LDR, NS and NE are employed by Mars Veterinary Health, a provider of veterinary services, which is part of Mars Petcare.
Funding
The authors received no financial support for the research, authorship, and/or publication of this article.
Ethical approval
The work described in this manuscript involved the use of non-experimental (owned or unowned) animals. Established internationally recognised high standards (‘best practice’) of veterinary clinical care for the individual patient were always followed and/or this work involved the use of cadavers. Ethical approval from a committee was therefore not specifically required for publication in JFMS. Although not required, where ethical approval was still obtained, it is stated in the manuscript.
Informed consent
Informed consent (verbal or written) was obtained from the owner or legal custodian of all animal(s) described in this work (experimental or non-experimental animals, including cadavers, tissues and samples) for all procedure(s) undertaken (prospective or retrospective studies). No animals or people are identifiable within this publication, and therefore additional informed consent for publication was not required.
References
Supplementary Material
Please find the following supplemental material available below.
For Open Access articles published under a Creative Commons License, all supplemental material carries the same license as the article it is associated with.
For non-Open Access articles published, all supplemental material carries a non-exclusive license, and permission requests for re-use of supplemental material or any part of supplemental material shall be sent directly to the copyright owner as specified in the copyright notice associated with the article.