
Abstract
Objectives
The central aim of this study was to develop a questionnaire that can be used to assess the combined emotional and physical wellbeing of pet cats – that is, to evaluate their quality of life (QoL). Using answers to this questionnaire, we then aimed to develop a statistically validated and robust algorithm (an instrument) to derive a set of reproducible QoL dimensions for evaluating and comparing the wellbeing of cats.
Methods
Responses from 1324 cat owners in the USA and UK were collected and used to identify key cat QoL dimensions using well-established approaches. Statistical analysis was used to evaluate the extent to which our algorithm produced comparable results when used across different populations of cats (validity and robustness). Furthermore, data from 385 cats were collected again after 2 weeks to evaluate the extent to which scores of the QoL dimensions varied over time (reliability).
Results
A data-driven analysis was used to develop an instrument with seven QoL dimensions across daytime and mealtime behaviours: Active, Talkative, Satisfied, Relaxed, Mobile, Appetite and Sociable. Statistical analysis confirmed the robustness, validity and reliability of the instrument.
Conclusions and relevance
The Feline Quality of Life questionnaire and its associated instrument evaluated cat QoL across seven dimensions and allowed exploration of wellbeing across different cat demographics and health conditions. The questionnaire can be used by pet owners interested in better understanding the wellbeing of their cat and by veterinary professionals to gather information that complements in-clinic health assessments.
Plain language summary
This study is about a questionnaire called the Feline Quality of Life (FelQoL) that helps pet owners understand their cats’ quality of life, which refers to a cat’s overall happiness and wellbeing. It can be difficult to know how well a cat is doing, especially at the vet when cats often feel scared. This can make it challenging for vets and owners to help them. There is not much scientific information about what makes cats happy. This study aims to change that by creating an easy tool to find and measure cats’ quality of life, helping to improve care. The researchers created a short questionnaire about the quality of life of cats. They asked 1324 cat owners to answer it and used their responses to identify what really matters for cats’ happiness and wellbeing. The study found several areas that contribute to a cat’s quality of life: being active, talkative, satisfied, relaxed, mobile, having a good appetite and being sociable. Most cats were seen by their owners as having a good quality of life. The questionnaire was also tested to ensure it works well in different situations. The FelQoL questionnaire helps pet owners and vets check and improve their cats’ happiness and wellbeing. By looking at different areas, like how active or social a cat is, owners can work with their vets to make improvements. This tool also helps cat owners and vets communicate better about cats’ needs.
Introduction
The importance of evaluating the wellbeing of pets has long been recognised by veterinary professionals.1,2 The World Small Animal Veterinary Association, British Small Animal Veterinary Association and American Veterinary Medical Association have all stressed its importance in veterinary practice for optimising animal welfare and assisting with treatment decisions.3–5
This is particularly critical for cats, with stress being a recognised problem for both cats and their owners when attending veterinary clinics.6–8 Behaviour observed during the veterinary visit is therefore less likely to accurately reflect how the pet behaves at home, making diagnoses of some physical and behavioural issues challenging.9,10 Even in the context of Cat Friendly Practices,11,12 the ability to monitor cat wellbeing is helpful to track and optimise practices. In addition, research suggests that pet owners are interested in discussing the general wellbeing of their pets,13,14 supporting the importance of this concept for more engaging veterinary consultations.
Extensive research supports the ability of people to assess the emotional states of other people.15–19 Less research is available for animals, 20 but there are indications that humans are capable of assessing the emotional state of pet dogs21,22 and pet cats.22,23 It is therefore reasonable to expect carers to have the capacity to accurately evaluate the physical and emotional states of their companion animals with the assistance of targeted questionnaires.
Scientific literature usually classifies wellbeing questionnaires into two categories: specific and generic. Specific questionnaires evaluate the progression of certain diseases (once diagnosed) and can support end-of-life decisions.24–27 Generic questionnaires are aimed at measuring the overall wellbeing of pets regardless of their underlying health conditions.28–32 These questionnaires are less capable of measuring problems associated with specific medical conditions but have the advantage of being applicable regardless of the health condition of the pet. Therefore, they can be used to compare the wellbeing of potentially heterogeneous pet populations. Although not designed for this purpose, generic questionnaires provide evidence on reduced quality of life (QoL) of pets and can therefore support conversations around general pet welfare across their lifespan, as well as end-of-life decisions.
Generic wellbeing questionnaires have improved our understanding of the wellbeing of cats.28,30,32,33 However, typically limited numbers of animals (100–200) were utilised during questionnaire development and limited information on pet demographics and/or environmental factors were collected. Furthermore, questionnaires that are not easy and quick to complete may result in bias and limited scalability, if only the most engaged pet owners utilise them.
To overcome these limitations, this study aimed to develop an easy-to-use, succinct and accurate general cat wellbeing questionnaire, which can be completed in less than 10 mins and be used to evaluate well-defined wellbeing dimensions, facilitating assessment of the results by pet owners and clinicians. 34
This is the first paper of a two-part series on the development of the Feline Quality of Life (FelQoL) questionnaire. This initial paper focuses specifically on the development and statistical validation of FelQoL. Additional details on the association between pet demographics, health and the environment on QoL scores can be found in part 2. 35
Materials and methods
Questionnaire
A long prototype questionnaire with 65 items was derived by considering all the questions used in previous research28,30–32 and was modified through the addition and removal of questions, based on recommendations from co-authors with backgrounds in veterinary medicine and animal behaviour (TS, TK, LDR), to ensure that key daytime and mealtime behaviours were captured.
Responses from 232 participants to this prototype questionnaire were used to exclude items identified as uninformative or redundant. Exploratory factor analysis was then performed, and additional items were removed if found without a clear association to either physical or emotional wellbeing concepts, resulting in a questionnaire with 37 items. One question was added to better characterise the meal satisfaction domain resulting in 38 questions. This approach is in line with previous work.28,29,33
The core of this shorter questionnaire is composed of a set of 38 simple questions (conventionally called items) requiring the pet owner to evaluate on a scale from 1 to 7 how well an adjective or action describes their cat. Using this questionnaire, data were collected from more than 1300 cat owners across the UK and USA. Readers interested in having access to the prototype or final questionnaire can get in touch with the corresponding author.
Additional questions on the physical health, living environment and demographics of cats were also included to improve cat characterisation. Finally, the cat owner was asked to indicate with a number from 1 to 100 the overall QoL of themselves and of their cat. All questions were optional and completion time was recorded. Details on these questions are available in a separate publication of this two-part series where we analysed how physical health, living environment and demographics are associated with changes in feline QoL. 35
Written informed consent for research purposes in the context of cat QoL was obtained from the owner or legal custodian of all animals described in this work before allowing the participant to proceed to complete the questionnaire. When respondents were contacted directly via email, we had previously collected consent from them to be contacted for research purposes, either as part of previous interactions or as part of this initiative.
The questionnaire was approved by the Faculty of Health Sciences Research Ethics Committee, University of Bristol (reference 12065).
Data collection
Three data collection efforts were used to test the questionnaire.
First, internal test data collection (Table 1) was conducted by sending an email with a link to an electronic version of the questionnaire done in Typeform (https://www.typeform.com/) to 167 UK- and USA-based Mars employees who had previously agreed to be contacted; 95 completed the survey (internal test data set).
Characteristics of the data sets across the data collection efforts
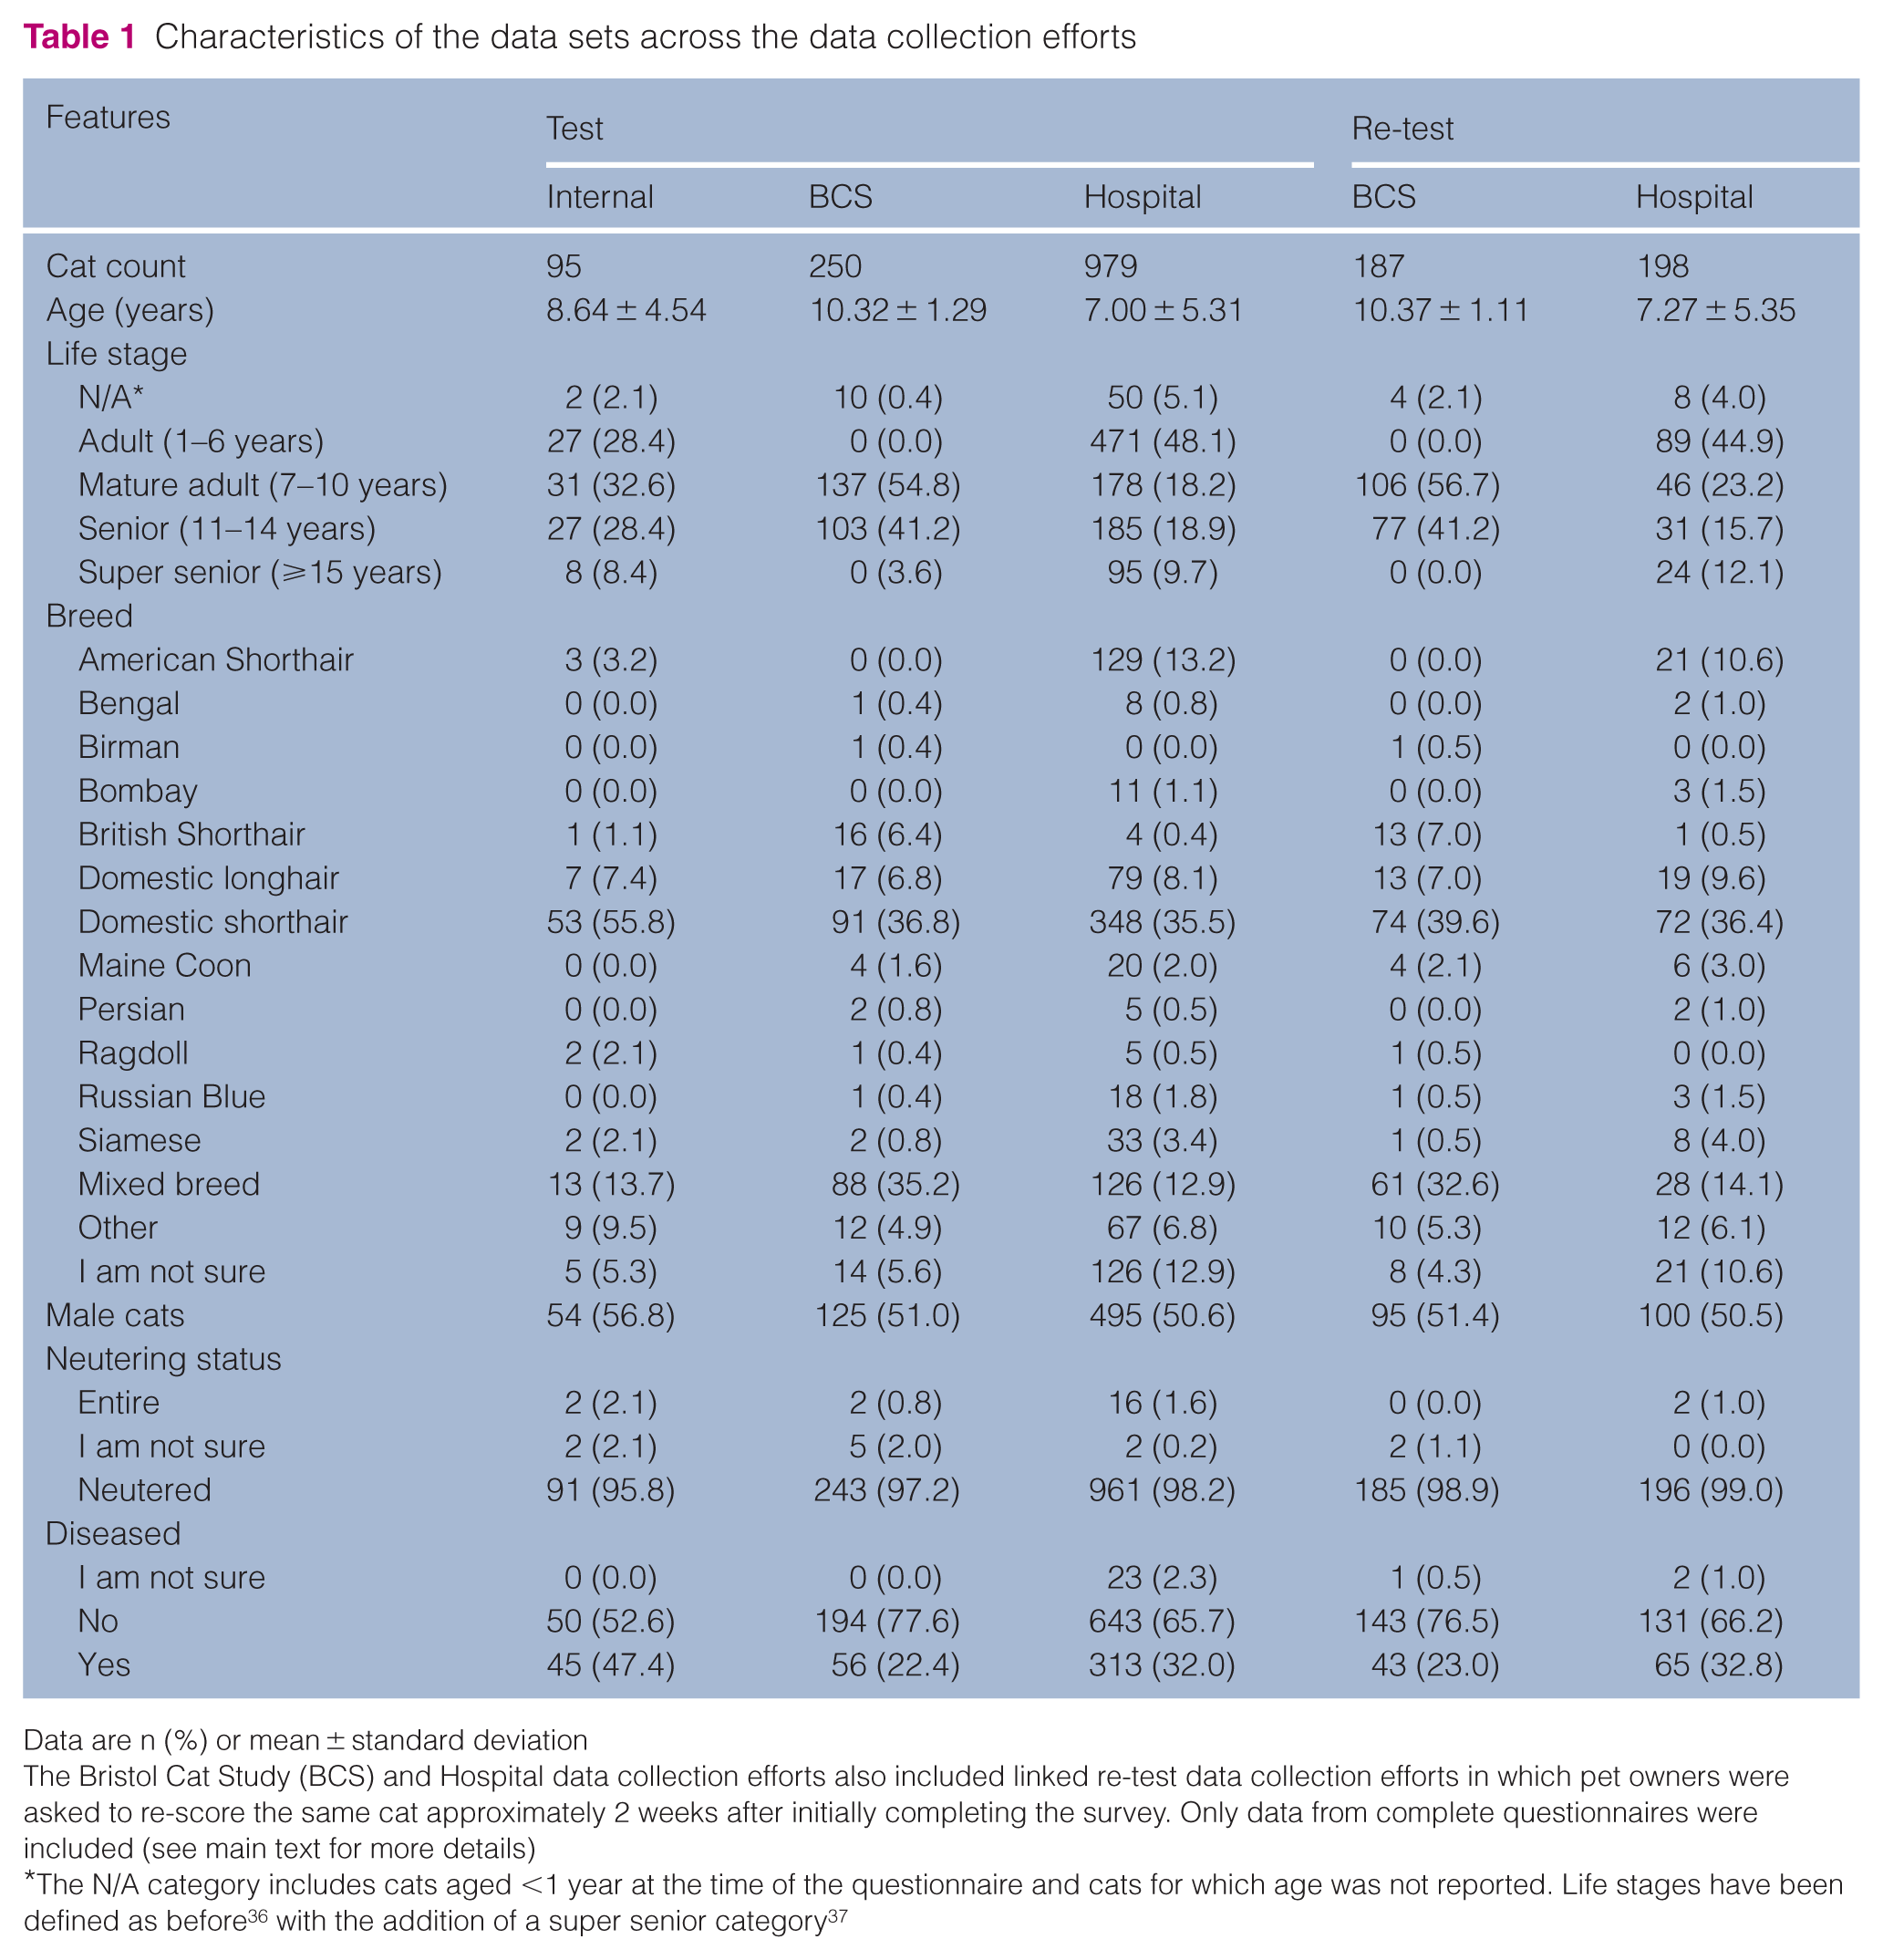
Data are n (%) or mean ± standard deviation
The Bristol Cat Study (BCS) and Hospital data collection efforts also included linked re-test data collection efforts in which pet owners were asked to re-score the same cat approximately 2 weeks after initially completing the survey. Only data from complete questionnaires were included (see main text for more details)
Second, Bristol Cat Study (BCS) test data collection (Table 1) was conducted by replicating the questionnaire created for the internal data collection and sending an email to UK-based participants of the BCS. 38 A total of 289 participants opened the link and 250 completed the questionnaire (BCS test data set). In total, 232 participants agreed to be contacted to retake the questionnaire. A new link was sent to them approximately 2 weeks after the initial response: 191 opened the link and 187 completed the questionnaire (BCS re-test data set). Data were collected directly by the University of Bristol and anonymised before analysis.
Third, Hospital test data collection (Table 1) was conducted directly by the Banfield Pet Hospital. The hospital created a copy of the questionnaire used for the internal data collection and sent an email containing a link to this questionnaire to randomly selected USA-based cat owners who had previously opted in to be contacted for scientific research. A total 1328 participants opened the link and 979 completed the questionnaire (Hospital test data set). In total, 810 participants agreed to retake the questionnaire. A new link was sent to them approximately 2 weeks after the initial response: 221 opened the link and 198 completed the questionnaire (Hospital re-test data set). Data were collected directly by the Banfield Pet Hospital and anonymised before analysis.
Excluding questionnaires with incomplete information on demographics and those where the owner did not reach the end, a test data set with 1324 questionnaires and a re-test data set with 385 was obtained.
Instrument development and statistical analysis
Instrument development and statistical analysis were performed using R statistical software (version 4.2.2) 39 with function from Tidyverse 40 and the R psych package. 41 The fa function was used to perform factor analysis.42,43 This approach combines the answers to the items into a set of dimensions (called domains or factors). We imposed oblique rotation (rotate = ‘oblimin’) and allowed incomplete observations (missing = TRUE) with no imputation (impute = ‘none’). This approach allows correlation between the domains – that is, between the different wellbeing dimensions.
The number of domains was estimated from data using the fa.parallel and nfactors functions, which suggested the presence of six to eight factors. When deriving domain scores, median imputation was used for items with missing values.
To identify the most meaningful instrument for clinical practice, we derived instruments with six, seven and eight domains; three co-authors with a veterinary background (TK, TS, LDR) were independently asked to indicate which version resulted in domains characterised by the most meaningful and coherent group of items. All of them indicated that the version with seven domains was preferable.
Before computing the domain scores, items with a negative connotation (Table 2) were reversed by applying the transformation y = 8 – x, to make sure that the analysis would reflect which items contribute positively or negatively to wellbeing. Note that domain scores are computed by multiplying each item by domain-specific weights that are obtained as part of factor analysis. Domain scores were unnormalised so that the score would be in the range of 1–7. 29
The seven domains of the instrument with their description, associated items and relevance

As customary, domains are ordered top to bottom by decreasing proportion of variance explained. Associated items are defined as those with a strong association to the domain (loadings <–0.35 or >0.35). A ‘-’ indicates that the item contributes negatively to the domain (hence the scale is reversed before it is used to compute the score of the domain). Items in bold are those with the highest weight in the domain. Domains were classified as daytime (D) or mealtime (M) depending on whether the majority of the items were daytime or mealtime. If no clear majority was present, the domain was classified as daytime, as that is more general
Several measures of reliability were computed. The Tucker Lewis Index of factoring reliability,
44
also known as the non-normed fit index, which indicates how well the model derived from factor analysis matches the relationships found in the data, was computed by fa. Cronbach’s alpha (α),45,46 a measure of internal consistency describing the extent to which all the items measure the same concept,
47
was computed using the omega function. Omega total (
The robustness (ie, the ability of the analysis to identify the same domains when using different data sets) of the instrument was estimated by deriving subset instruments (ie, instrument based on subsets of the data) for the different data collection efforts (separating the test vs re-test collections when available) and then extracting their loadings. For each domain, the loadings of the final instrument were correlated to those of the subset instruments. A high correlation indicates that the score of the domain is computed consistently in the final instrument vs the subset instrument, and therefore that the domain structure is robust to change to the subset of data used.
Robustness analysis was further extended by taking the data used to compute the final instrument and splitting it randomly into two data sets containing 75% and 25% of the data. Two instruments were then obtained using the two data sets. Pearson’s correlation between the loadings of the domains of the two instruments was computed as above. This procedure was repeated 100 times to evaluate the potential effect of outliers and biases in the data.
Re-test analysis (often called test-retest reliability) was aimed at understanding the extent to which domain scores remain constant over time for the same pet. To conduct this analysis, for each domain, we computed the correlation of scores for the test vs re-test data sets of the BCS and Hospital data collection efforts (see ‘Results’ for more details on the collection efforts). Higher values indicate more consistent domain scores across time.
An accompanying application programming interface to compute domain scores from items was also developed. Interested users can contact the authors to discuss access options.
Missing values
Owners were instructed to score as many items as possible but were given the option to skip questions if they were unable to answer.
In the test data set, most owners (74%) scored all the items, a few (22%) skipped one to three items and only a small percentage (4%) skipped four or more. This supported the general usability of the questionnaire.
Most items had a very low percentage of missing values (<2%), with the notable exception of the item ‘reluctant to go outside’, which had 18% of missing values (Figure S1 in the supplementary material). As a first approximation, we assumed that a missing score for the item was associated with indoor-only cats (ie, cats without outdoor access). To verify this assumption, we computed the percentage of cats having access to a garden, catio or areas beyond the garden in cats with a missing score for ‘reluctant to go outside’ (Figure S2 in the supplementary material). Analysis indicated that only a minority of cats without a score (between 2% and 11% depending on the feature) have access to these features, indicating that our hypothesis was likely correct and the item is mostly associated with indoor cats.
As the intent was to develop a widely applicable questionnaire, this question was removed resulting in a final questionnaire (FelQoL-Q37) with 37 items instead of 38, which was used to derive the instrument. After removing this question, 83% of questionnaires did not contain any missing values and only 3% contained four or more.
Results
Completion time
More than 50% of pet owners completed the full questionnaire (which included demographic questions) in less than 9 mins. This time was reduced to less than 4 mins when only item questions were considered. More details on the completion time are available in Table S2 in the supplementary material.
Cat demographics
The demographic overview provided by Table 1 indicates good coverage of different feline life stages. Most cats were neutered and approximately half were female. Domestic shorthair and longhair are the most common breed in the USA and UK; this was also the case in our data. A large percentage of cats (72%) were reported by their owners as having not been diagnosed with any condition by a veterinarian and were presumed healthy.
Domains
Our analysis indicated the presence of seven domains (see ‘Materials and methods’), which represent QoL dimensions. The domain scores were computed via a statistically validated algorithm (an instrument)34,42,43 based on factor analysis. The domains are described in Table 2 along with a list of items with a strong association to the domain (ie, with loadings <–0.35 or >0.35). The seven domains cover physical wellbeing (Active, Mobile), emotional wellbeing (Relaxed, Sociable), meal satisfaction (Satisfied, Appetite) and communication (Talkative). All but one domain (Talkative) closely matched those produced during the development of a previously developed dog QoL instrument. 29
The distribution of scores varied substantially across the domains (Figure 1), indicating that different baseline values are to be expected for each. The domains were mostly uncorrelated, except for Active, Mobile and Sociable, for which a moderate to large correlation (>0.4) was present (Table S1 in the supplementary material).

Distribution of the unstandardised scores (y-axis) across the domains (x-axis) for the three base data collection efforts combined
To evaluate potential biases in cats with and without outdoor access, we also compared domain scores of pets that scored ‘reluctant to go outside’ vs pets with missing values (Figure S3 in the supplementary material). Except for the Satisfied domain, differences were non-significant (P >0.01). In the case of Satisfied, the difference was significant (P <0.001), but the effect was limited: a median score of 5.89 when the item was present vs a median score of 6.03 when the item was missing (ie, a 2% difference). Overall, these findings suggest that the question has a limited impact on the domain scores and can be removed to improve the generalisability of the questionnaire. This result does not indicate an absence of an effect of outdoor access; rather, if such an effect exists, it appears to be captured by other items within the questionnaire. Indeed, our results indicate that differences are present between cats with and without outdoor access. 35
Robustness and reliability
Domains were shown to be robust across multiple data collection efforts (Table 3, Figure 2), across random data splits and in healthy vs diseased cats (Figures S4, S5 and S6 in the supplementary material). The analysis was found to be reliable, with a good agreement of the inferred relation between the items and the data (Tucker Lewis Index = 0.87) and good internal consistency (Cronbach’s α = 0.88,
Pearson’s correlations of factor loading for the combined analysis (ie, the final instrument) and the different data collection efforts (‘combined vs data collection’), and correlation of the linked base and re-test data collection efforts (‘test vs re-test’)
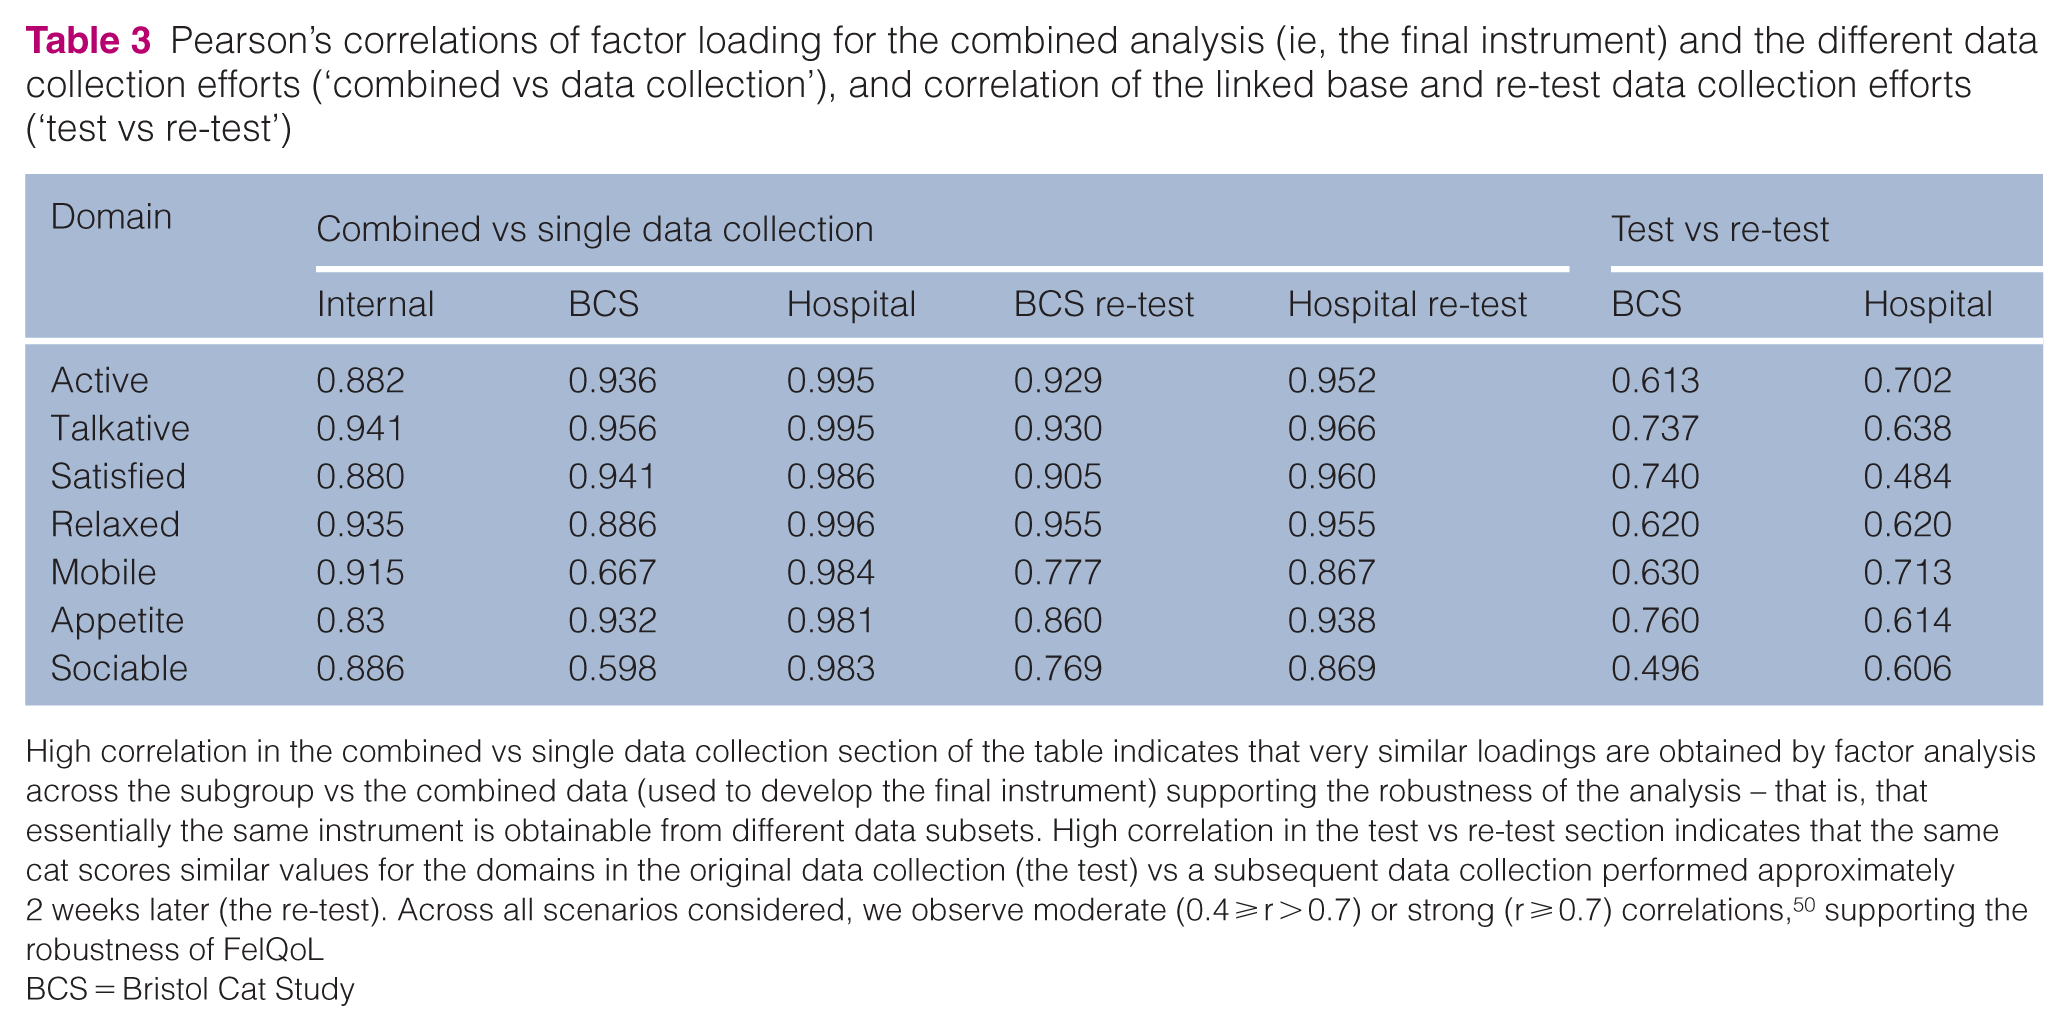
High correlation in the combined vs single data collection section of the table indicates that very similar loadings are obtained by factor analysis across the subgroup vs the combined data (used to develop the final instrument) supporting the robustness of the analysis – that is, that essentially the same instrument is obtainable from different data subsets. High correlation in the test vs re-test section indicates that the same cat scores similar values for the domains in the original data collection (the test) vs a subsequent data collection performed approximately 2 weeks later (the re-test). Across all scenarios considered, we observe moderate (0.4 ⩾ r > 0.7) or strong (r ⩾ 0.7) correlations, 50 supporting the robustness of FelQoL
BCS = Bristol Cat Study

Heat maps showing the weights across the items (y-axis) and domains (x-axis) in the final instrument (Combined) and in the different data collection efforts (other facets). This analysis was performed before reversing the score of any item (see ‘Materials and methods’). BCS = Bristol Cat Study
Conceptual validation
The collection of demographic data allowed us to explore the variation in domain scores across demographics and health conditions. This additional analysis, reported in part 2 of the series, 35 indicated, among other results, a decreased physical wellbeing with age or when diseases were present, as expected.
Discussion
In designing FelQoL, we aimed to develop a pet owner-friendly questionnaire capable of measuring different QoL dimensions of pet cats in a statistically sound way.
Most owners required less than 10 mins to complete the questionnaire. Interestingly, time further decreased during the re-test (Table S2 in the supplementary material), possibly because of pet owners becoming familiar with the content and interface. Potential future usage of the questionnaire across multiple time points (eg, for welfare monitoring purposes) might require even less time, suggesting a good scalability of the instrument.
The average scores for the Satisfied, Relaxed, Mobile and Sociable domains were high, with limited overall variability (Figure 1). This suggests that the average cat owner in our study perceives their cats to be emotionally and physically healthy, with good mealtime satisfaction. This is expected as most cats assessed were not diagnosed with any medical conditions.
It is possible that cat owners may have considered their pets to be more satisfied, relaxed, mobile and sociable than they actually were. 51 However, it has been demonstrated that humans can describe the emotional state of animals20–22 and that women, young people and those with professional feline experience are particularly able to correctly rate emotional state in cats. 23 Overall, this suggests that owner perception is useful and that additional pet owner education on cat behaviour may further improve the instrument’s accuracy.
Another explanation for the high values could be self-selection bias – that is, owners who would have scored low values for their cats related to these domains decided not to complete the survey. However, as shown in the second paper of the series, cats with low scores for the Satisfied, Relaxed, Mobile and Sociable domains can be found in the data sets – for example, when they are older or affected by certain medical conditions 35 – suggesting the effect of such bias to be limited.
Finally, when factor analysis was applied to different populations of cats present in our data (different collection efforts, healthy and diseased cats, random subsets) the same domains, associated with the same items, were obtained. This supported the notion that domains are not a consequence of biases in the data (eg, unhealthy cats displaying lower mobility scores) but emerge naturally from the data across different scenarios, further supporting the validity of our analysis.
When considering variation of domain scores over a 2-week period as part of the re-test analysis, some variability can be observed, with seven moderate and five strong correlations. This variability suggests that some factors can have a visible effect on feline wellbeing in a relative short time. Nonetheless, some trends are visible with daytime domains having consistently higher correlation (0.61–0.76) than mealtime domains (0.48–0.74). This indicates that domains associated with wellbeing are more stable over time than meal satisfaction and interest, which is to be expected, eg, because of changes in diet or food intake.
Conclusions
Robust tools to evaluate feline Quality of Life (QoL) are important for a holistic view of their wellbeing. The FelQoL questionnaire was developed with this in mind. Designed for quick completion by cat owners, it facilitates evaluating wellbeing independently of a clinical visit (eg, before or after). This is important as the behaviour of cats at home is the most relevant and is likely to differ from that in a clinical setting.
Statistical validation indicated that the instrument recapitulated well the relationships present in the data (reliability), produced consistent results when the same cat was re-evaluated (test-retest reliability) and could be derived consistently when using different populations of cats (robustness). Conceptual validation is covered in the second paper of the series. 35
Statistically validated tools like FelQoL, which can evaluate QoL across different scenarios, can support clinicians and owners in accurately assessing cat welfare, diagnosing health conditions, structuring complex judgements around that wellbeing and assisting the choice of the best care pathways.
Finally, the short time required to complete the questionnaire, and the generality of the approach used, make FelQoL amenable to being deployed at scale to collect data across different cat populations and to compare their wellbeing. This also empowers owners to routinely monitor their cats’ wellbeing, which is critical to promote good welfare, and has the potential to improve veterinary care by improving owner participation and engagement.
As more data are collected using FelQoL, further analysis will be necessary to confirm its reliability and robustness across scenarios not considered as part of our current data collection efforts.
Supplemental Material
Figure S1. Percentage of missing responses across the different items.
Figure S2. Relation between missingness of ‘reluctant to go outside’ and selected environmental features.
Figure S3. Effect of scoring ‘reluctant to go outside’ on the domain scores.
Figure S4. Heatmaps of loadings for an exemplary random split.
Figure S5. Correlation of loadings between the random splits.
Figure S6. Heatmaps of loadings for presumed healthy and diseased cats.
Figure S7. Scatterplot of domain scores across the test and re-test data collections.
Table S1. Pairwise Pearson correlation between domains.
Table S2. Completion time (in minutes) for the different data collection efforts.
Supplemental Material
Supplemental Material
Footnotes
Acknowledgements
The authors would like to thank Ester Bijsmans, Anthea Davies, Geert De Meyer, Zack Ellerby, Serina Filler, Aarti Hogan, Urslaan Youhan, Yeun Li, Darren Logan, Alex Mepham, Carina Salt, John Rawlings, Cecile Vanel and Daniel Waller for valuable discussions and feedback on the project. We thank all survey respondents for donating their time to advance welfare science.
Author note
The data sets collected are not publicly available due to restrictions imposed on usage by the consent collected. Data sets are available from the corresponding author on reasonable request provided that this request does not conflict with legal requirements around data usage and protection.
Supplementary material
The following files are available as supplementary material:
Figure S1. Percentage of missing responses across the different items.
Figure S2. Relation between missingness of ‘reluctant to go outside’ and selected environmental features.
Figure S3. Effect of scoring ‘reluctant to go outside’ on the domain scores.
Figure S4. Heatmaps of loadings for an exemplary random split.
Figure S5. Correlation of loadings between the random splits.
Figure S6. Heatmaps of loadings for presumed healthy and diseased cats.
Figure S7. Scatterplot of domain scores across the test and re-test data collections.
Table S1. Pairwise Pearson correlation between domains.
Table S2. Completion time (in minutes) for the different data collection efforts.
Conflict of interest
LA, JPK, AH, TS and TK are employed by Mars Petcare. LDR, NS and NE are employed by Mars Veterinary Health, a provider of veterinary services, which is part of Mars Petcare.
Funding
The authors received no financial support for the research, authorship, and/or publication of this article.
Ethical approval
The work described in this manuscript involved the use of non-experimental (owned or unowned) animals. Established internationally recognised high standards (‘best practice’) of veterinary clinical care for the individual patient were always followed and/or this work involved the use of cadavers. Ethical approval from a committee was therefore not specifically required for publication in JFMS. Although not required, where ethical approval was still obtained, it is stated in the manuscript.
Informed consent
Informed consent (verbal or written) was obtained from the owner or legal custodian of all animal(s) described in this work (experimental or non-experimental animals, including cadavers, tissues and samples) for all procedure(s) undertaken (prospective or retrospective studies). No animals or people are identifiable within this publication, and therefore additional informed consent for publication was not required.
References
Supplementary Material
Please find the following supplemental material available below.
For Open Access articles published under a Creative Commons License, all supplemental material carries the same license as the article it is associated with.
For non-Open Access articles published, all supplemental material carries a non-exclusive license, and permission requests for re-use of supplemental material or any part of supplemental material shall be sent directly to the copyright owner as specified in the copyright notice associated with the article.