
Abstract
A response surface analysis of data from factorial experiments is used to determine the effect of different design factors on the low-velocity impact response of the honeycomb sandwich structures. A low-cost, out-of-autoclave manufacturing process is utilized to manufacture aerospace quality honeycomb sandwich panels. CYCOM® 5320 out-of-autoclave prepreg and FM® 300-2M are used as facesheet and adhesive, respectively. The out-of-autoclave process uses the vacuum bag pressure, thus, avoiding costly tooling and making the process more economical. A completely randomized design is used while manufacturing and testing the samples. Three design factors: angle difference between successive prepreg layers, number of prepreg layers, and number of adhesive layers, are selected as experimental variables. Each variable is considered at three levels, yielding a 33 factorial design. To investigate the effect of the experimental variables on the three response variables: energy absorbed (X); peak contact force (Y) and maximum deflection (Z), a low-velocity impact test is conducted. Analysis of variance and response surface techniques are used to analyze the data. The significant design factors for each response variable are identified using analysis of variance. Response surface analysis is carried out and the resulting regression models are employed to quantify the behavior of each of the response variables in response to changes in the design factors. The regression models are verified with the confirmation test results and both are in close agreement.
Keywords
Introduction
The honeycomb sandwich construction is one of the most valued structural engineering innovations developed by the composites industry. Sandwich composites consist of two thin facesheets with high stiffness and high strength and a core with low density and low stiffness. Because of their high bending stiffness, low thermal conductivity, resistance to aerodynamic load, insulation from sound, and capability to form large structures, honeycomb sandwich structures have wide applications in the aerospace industry [1]. Used extensively in aerospace and many other industries, the honeycomb sandwich provides low weight to stiffness ratio, durability and production cost savings over conventional materials.
Even though the high potential of sandwich structures is well acknowledged [2–4], their use in large primary aircraft structures has been limited. Sandwich structures are currently still at a lower level of functional and structural integration in the aerospace industry. In case of airliners, the use of sandwich structures is limited to aerodynamic fairings, covers, doors, and control surfaces [5]. One of the main drawbacks of these high-performance structures is their relatively poor resistance to localized impact loading such as tool drops, hail, and strikes on low flying objects during the life of a structure [6–8]. Throughout the lifetime, the composite may be subjected to many impacts. These impacts could be a result of something dropped on the composite or a rock being thrown at a vehicle or plane as it travels down a road or runway. Currently, many composite structures that are subjected to fatigue are overdesigned to account for the lack of knowledge about their properties [9]. A predominant failure mechanism in sandwich structures is the de-bonding of the composite facesheets from the core structures. In general, this type of de-bonding is initiated by impact damage on the surface and propagated by a flexural load where the damaged area is subjected to compression or cyclic fatigue [10]. Impact damage consists of complex mixtures of delamination, matrix cracking and damage, and fiber failure. Richardson and Wisheart [11] provided an extensive description of the occurrences of each type of failure mode. A number of studies have investigated the low-velocity impact response of the sandwich structures and an excellent review is given by Abrate [4]. Vaidya et al. [12] reported the low-velocity impact responses of foam-filled three-dimensional (3-D) integrated core sandwich composites with hybrid facesheets. The authors showed that the sandwich composite laminates with S2-glass/epoxy facesheet and hybrid facesheets exhibited considerable improvement in the load-carrying capability. Horrigan et al. [6] conducted experimental and theoretical investigations on low-velocity impact response of a Nomex honeycomb sandwich structure with glass fiber-reinforced epoxy resins. The authors observed that a soft, compliant projectile results in shallow crushing of the core, whereas hard bodies create deeper damage that conforms to the shape of the projectile. Charles and Guedra-Degeorges [13] observed that the dent depth around the impact point increases with impact energy until a maximum value is reached.
Design of experiments (DOEs) methods are frequently used to optimize processes and to improve the performance of the final part. Usually, experiments are performed to gain insight into a process so that conclusions and decisions can be made to improve processes and to reduce waste, defects, and cycle time. Statistically appropriate factorial experiments make it possible to test several process input variables simultaneously in order to assess the effect of each on the process output. Furthermore, statistically valid experimental designs allow us to capture the greatest amount of information in the fewest experimental runs. In case of composite manufacturing there are many variables such as temperature, pressure, soaking time, heat-up rate, cool-down rate, and the geometrical dimensions of the part that affects the performance of the part. Lacy et al. considered different parameters such as core density, core thickness, and number of facesheets to optimize the design of sandwich structures using response surface analysis [14]. It has been observed that process control is rather difficult due to a high number of process parameters involved. The study of different variables is more important in honeycomb sandwich construction as the honeycomb cores and some facing materials are directional with regard to mechanical properties and care must be taken to ensure that the materials are orientated in the panel to take the best advantage of this attribute [10]. Thus, a study using DOE will aid process optimization, which should result in getting minimum number of defects on the final product.
Although much research already exists on the study of low-velocity impact of sandwich panels and composite laminates, new configurations are continually being developed and need to be characterized because prediction of the effects of low-velocity impact damage are difficult. For this reason, experimental investigations of low-velocity impact behaviors of sandwich panels should be performed to characterize their damage to identify the effect of different design variables. Such experiments will yield data appropriate for fitting multifactor regression models that would help determine optimum combinations of design factors that would maximize performance of the composite. This paper illustrates the application of factorial experiments and response surface analysis of low-velocity impact response of sandwich panels and presents results for the honeycomb panels under study. In the present work, a completely randomized full factorial experiment design is conducted with three factors, each at three different levels and two replications. A total of 54 samples are made using out-of-autoclave (OOA) manufacturing process and then subjected to low-velocity impact loading of 6 J of energy using an Instron impact test machine. Three response variables are considered and significant factors are identified for each response. A regression analysis is carried out to predict the response variable at different levels of the design variables. The regression model is validated with the experiment results. The regression model reported in the present work is highly useful in predicting the low-velocity impact behavior of customized sandwich panels, making the use of sandwich structures more cost effective.
Materials and manufacturing
Materials
CYCOM® 5320 T40-800B carbon prepreg of 145 g/m2 density and 33% resin content is used as facesheet for the sandwich construction. CYCOM® 5320 is a toughened epoxy resin prepreg system designed for OOA manufacturing of primary structural applications. Because of its lower temperature curing capability, it is also suitable for prototyping where low-cost tooling or vacuum-bag-pressure-only curing is required. Kevlar honeycomb of 3.175-mm cell size, 72-kg/m3 density from M.C.Gill Co. is used as the core. FM® 300-2M film adhesive with a nominal density of 145 g/m2 (0.030 lb/f2) and nominal thickness of 0.13 mm (0.005 in.) is used for bonding the facesheet and the honeycomb core.
Manufacturing
Honeycomb sandwich composite panels have been manufactured using OOA manufacturing process. The schematic of the bagging procedure employed for the OOA process is shown in Figure 1. Initially an aluminum mold is prepared by sanding, to avoid any surface defects. A mold release agent is applied and a fluorinated ethylene propylene (FEP) release film is laid on the mold. The prepreg layers that were cut to the required dimensions and orientations are laid on the mold. Rollers along with hand pressure are used to press the prepregs against the mold starting from one corner of the prepreg and moving progressively toward the other. This process is repeated for all the prepreg layers of bottom facesheet to remove entrapped air as well as folds or wrinkles. Then the honeycomb core that is already wrapped with adhesive film on all sides is introduced on top of the bottom facesheet. For the top facesheet, prepreg layers are laid on the core one after the other and applied with hand pressure to avoid formation of voids in between the layers. After each layer of the prepreg is laid, the facesheet is pressed against the core side walls and bottom facesheet to form the shape. Thin glass tows are laid along the four corners of the panel to better distribute the vacuum. A FEP release film followed by breather material is placed on top of the sandwich and sealed using a vacuum bag. A vacuum line is connected to the vacuum pump and checked for any leaks. A two-stage vacuum pump with high capacity is used to manufacture these panels. The set-up was maintained under vacuum for 12 h. A high-temperature free-standing post cure cycle followed by medium temperature cure, recommended by the prepreg manufacturer, is used for curing the composite parts. The whole set-up is heated to 121°C (250°F) and held for 2 h. The part is de-molded and post-cured at 177°C (350°F) for 2 h. All the samples are made under similar conditions and by the same operator to avoid the effect of nuisance variables on the response of the sandwich panel.
Schematic of OOA bagging procedure for sandwich structures. OAA: out-of-autoclave.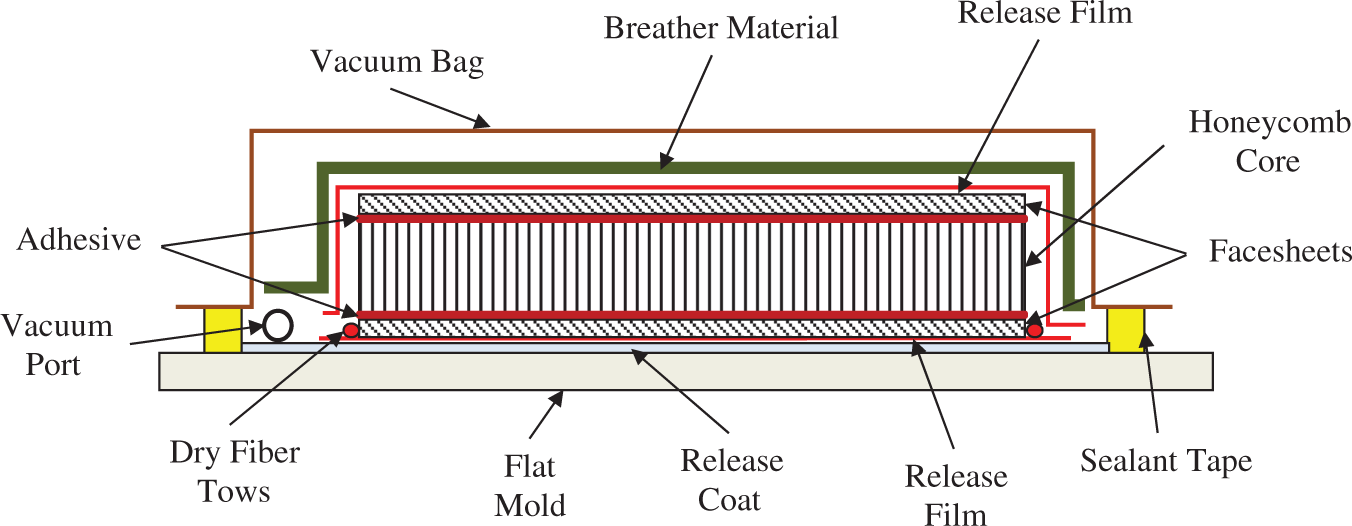
Experiment design
Several analytical and experimental studies have been conducted to understand the initiation and growth of impact damage and identifying the governing parameters. Composite manufacturing process is a complex process that involves large number of variables corresponding to the geometry of the sample such as orientation and number of plies, process variables such as cure cycle, vacuum levels, ramp rate and vacuum application time, and choice of material. Impact response of composites are affected by numerous factors including the properties of constituent materials, fiber volume fraction, size, thickness, stacking sequence, and lay-up orientation of the laminate, impact variables such as impact energy, impactor and angle of impact, and thermal, environmental conditions. Thus a wide range of possible processing variables can be identified for any composites manufacturing technique. In this work, three experimental variables, angle difference between successive prepreg layers, number of prepreg layers, and number of adhesive layers are chosen; these are considered to be the most likely factors to affect the response, from the preliminary study of the different factors. Figure 2 gives the overview of the structure of the experiment carried out, listing out the experimental variables, controlled variables, nuisance factors, and response variables.
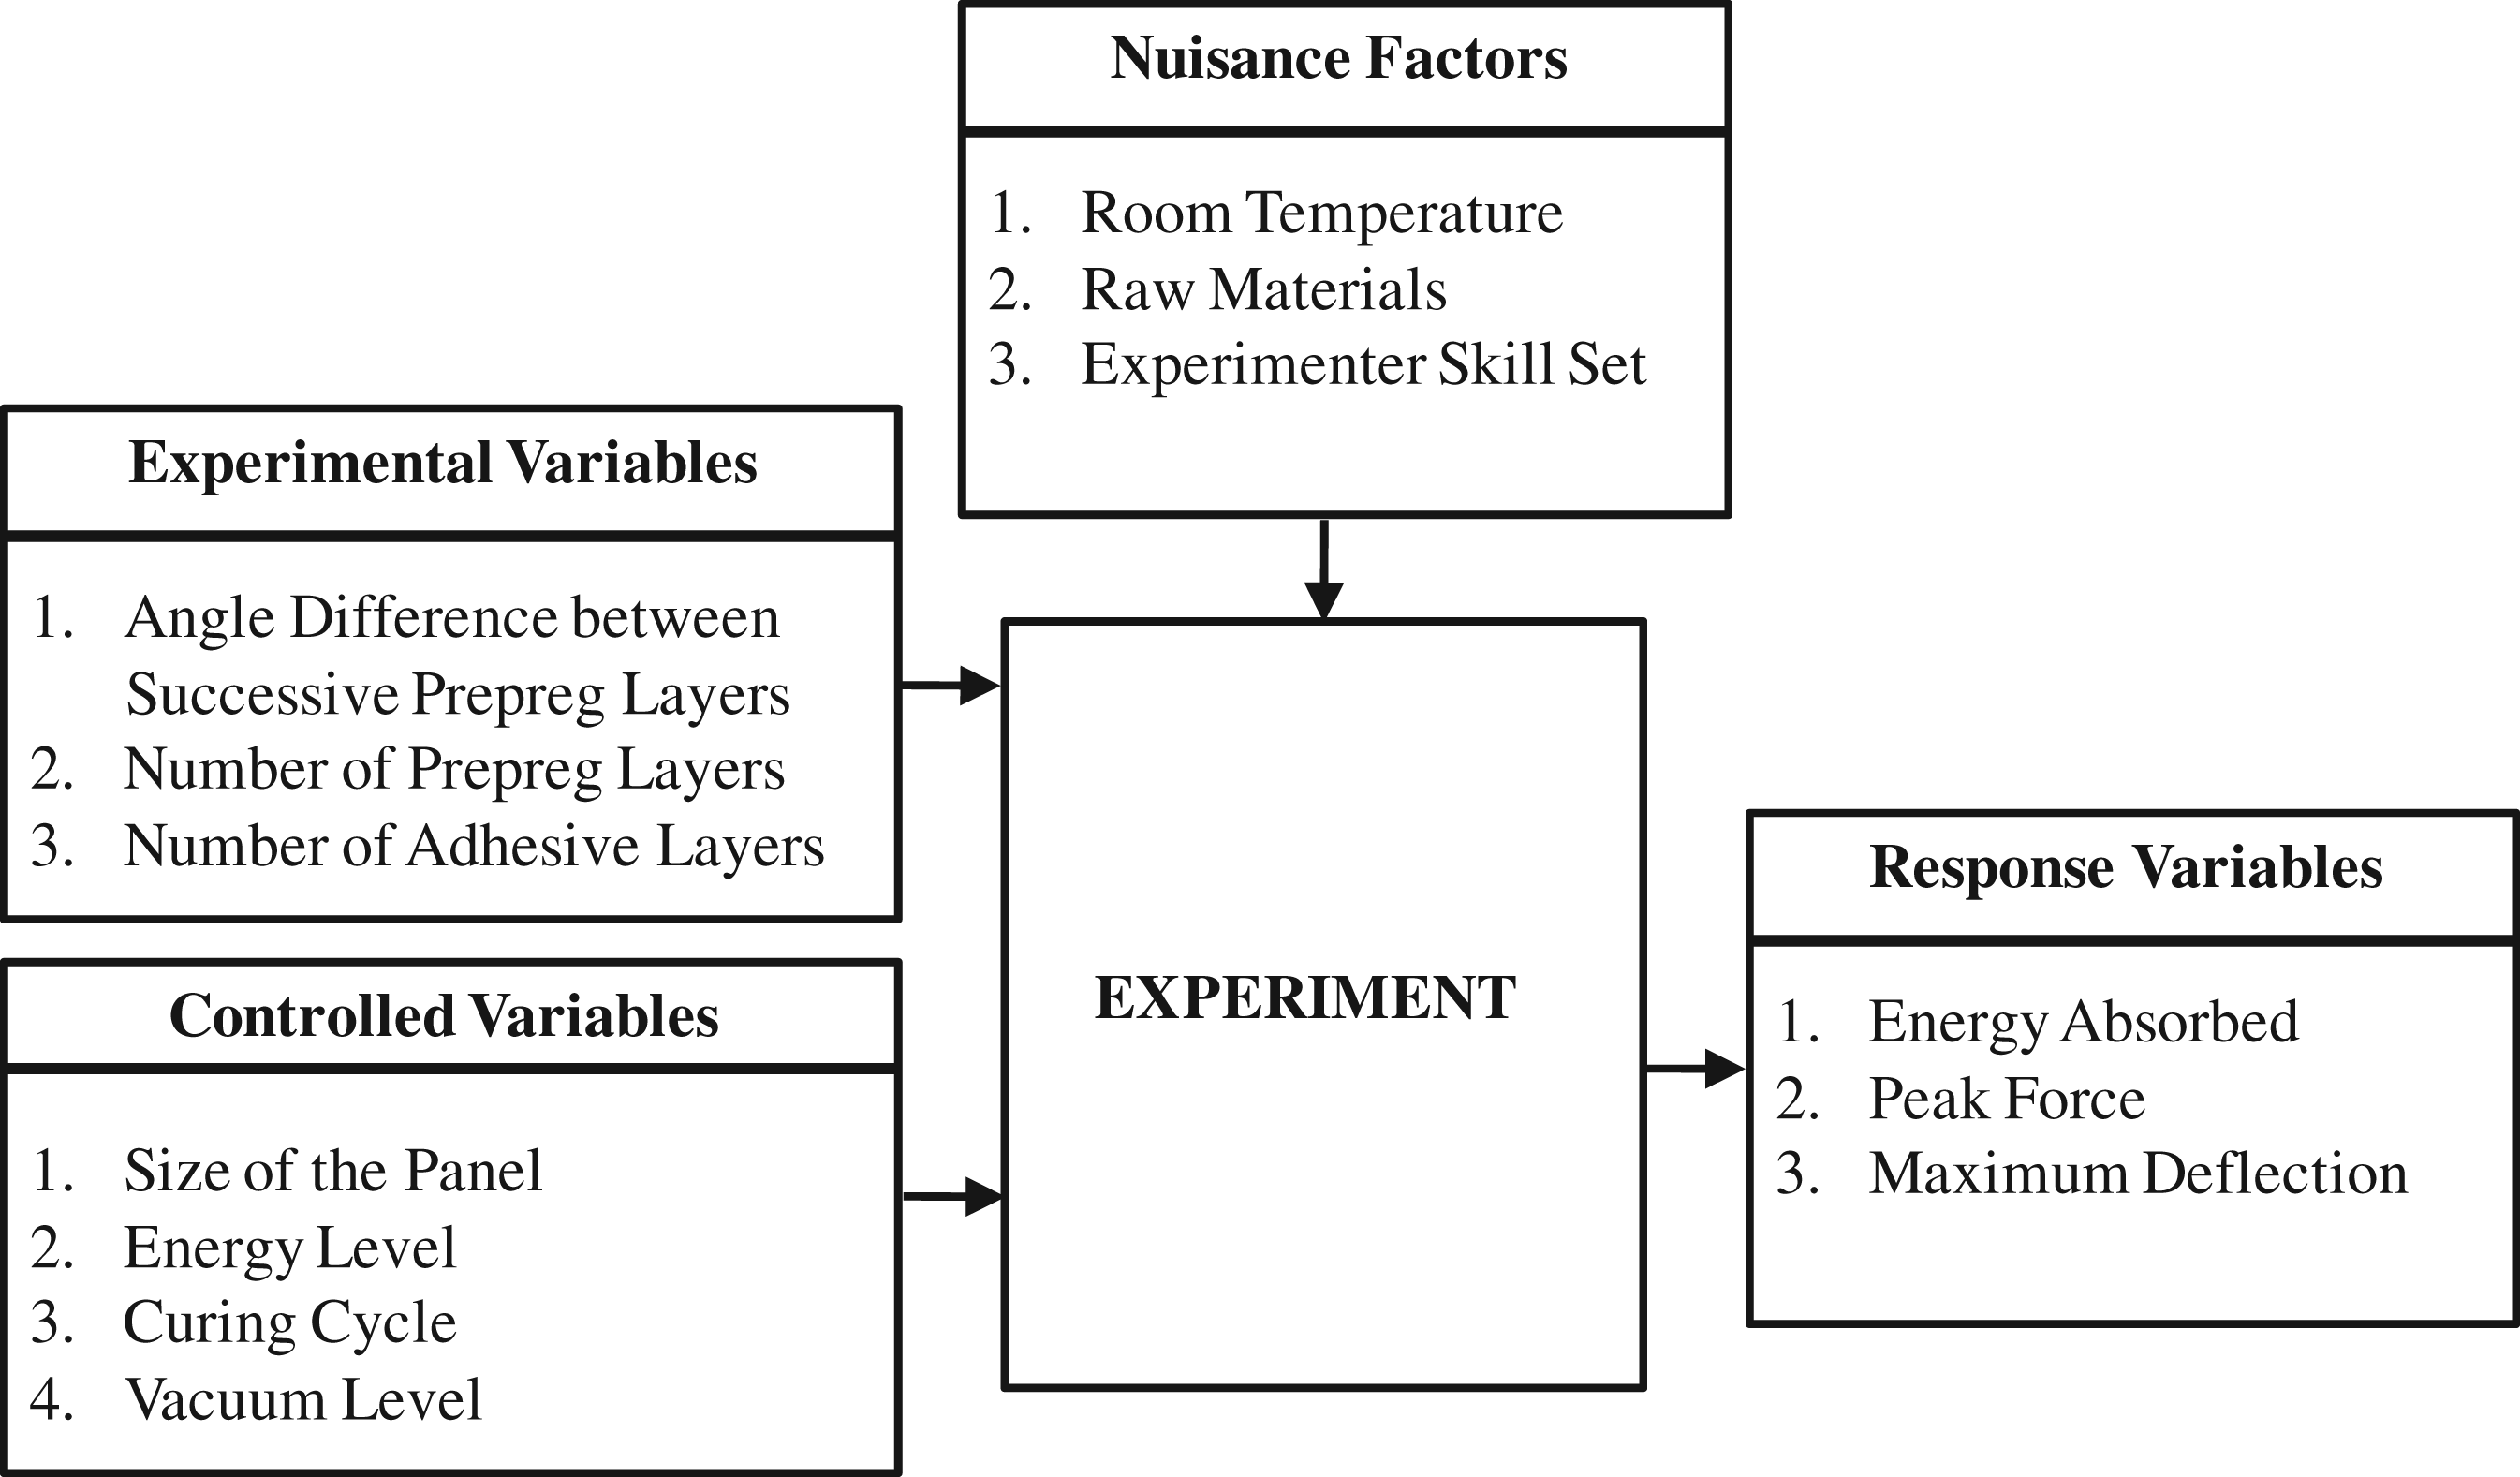
Experiment structure.
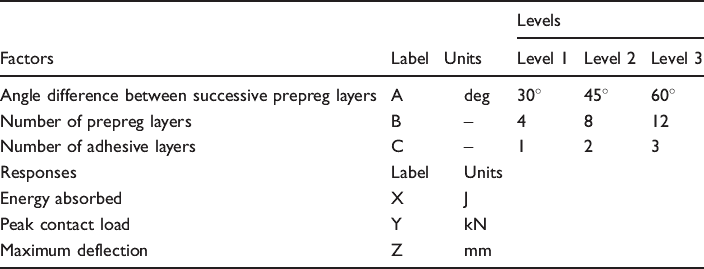
Factors, level ranges, and response variables
Design of experiment matrix listing the factors and their responses. a
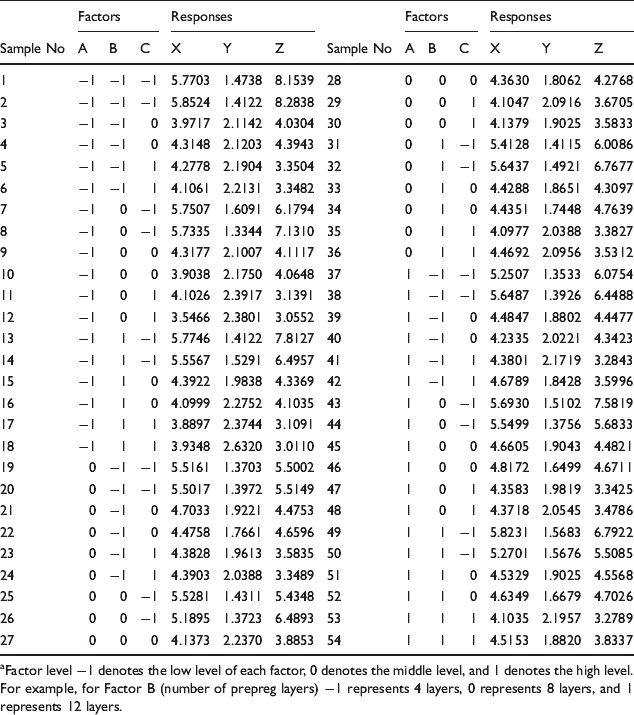
Factor level −1 denotes the low level of each factor, 0 denotes the middle level, and 1 denotes the high level. For example, for Factor B (number of prepreg layers) −1 represents 4 layers, 0 represents 8 layers, and 1 represents 12 layers.
Testing
A Dynatup Instron model 9250 impact testing machine with an impulse control and data acquisition system is used to evaluate the low-velocity impact characteristics of sandwich panels. Figure 3 shows the schematic of the impact testing machine. The impact test instrument has a motor and twin screw-drive for rapid crosshead retrieval after impact. The impulse control and data acquisition system includes an impulse software controller panel for test set-up and a high-speed impulse signal conditioning unit. The fixture used in the testing contains two steel plates with cut-outs of size 76 mm (3 in.) × 127 mm (5 in.). The impactor had a hemi-spherical end of diameter 12.7 mm (0.5 in.) with a mass of 6.48 kg. Specimens of size 76.2 mm (3 in.) × 76.2 mm (3 in.) are clamped in the support fixture along the perimeter. The impact energy is calibrated to zero by keeping the impactor tip touching the test panel. The impactor mass was then raised to the desired drop height corresponding to the energy of impact. All the experiments were conducted at a fixed energy level of 6 J to observe the effect of design variables (experimental variables). The energy level was selected such that it causes a maximum dent depth yet without penetrating any of the samples. Each specimen is selected randomly and clamped in the fixture. The impactor was dropped onto the clamped specimen. As the impactor makes contact with the specimen, the impulse control data acquisition system is triggered to start acquiring the data for the energy absorbed (X), peak contact force (Y), and maximum deflection (Z).
Low-velocity impact testing machine.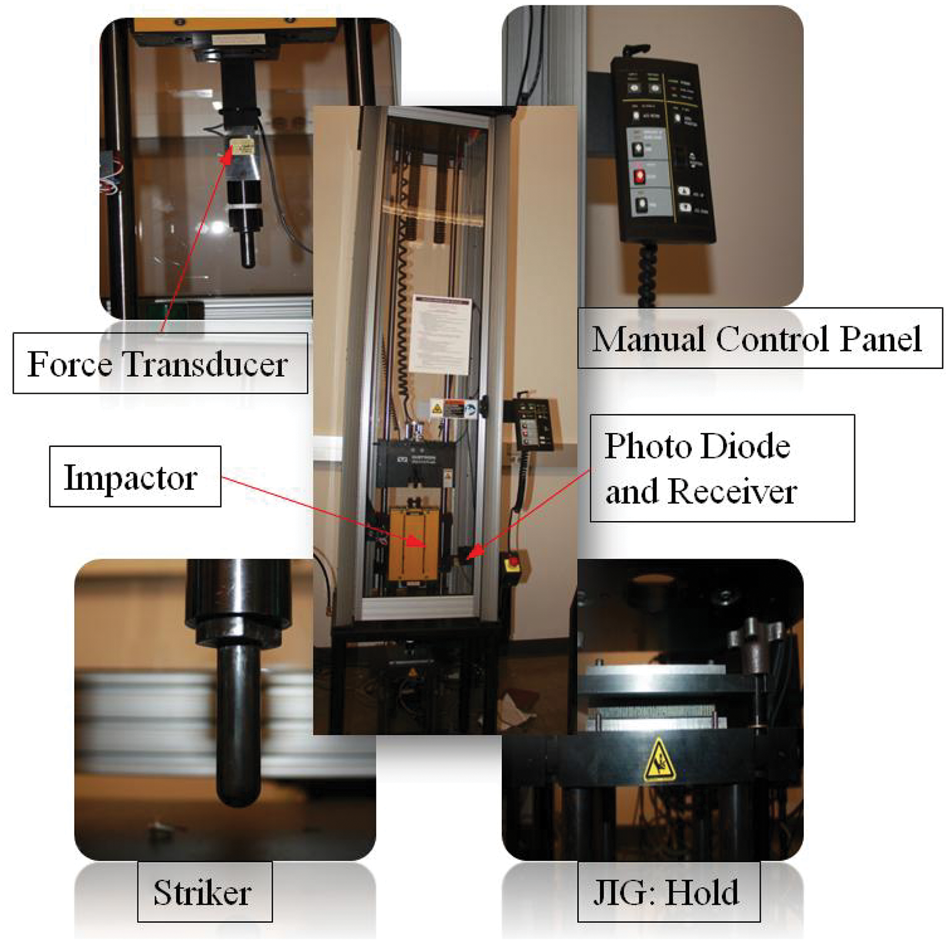
Results and discussion
Low-velocity impact characteristics
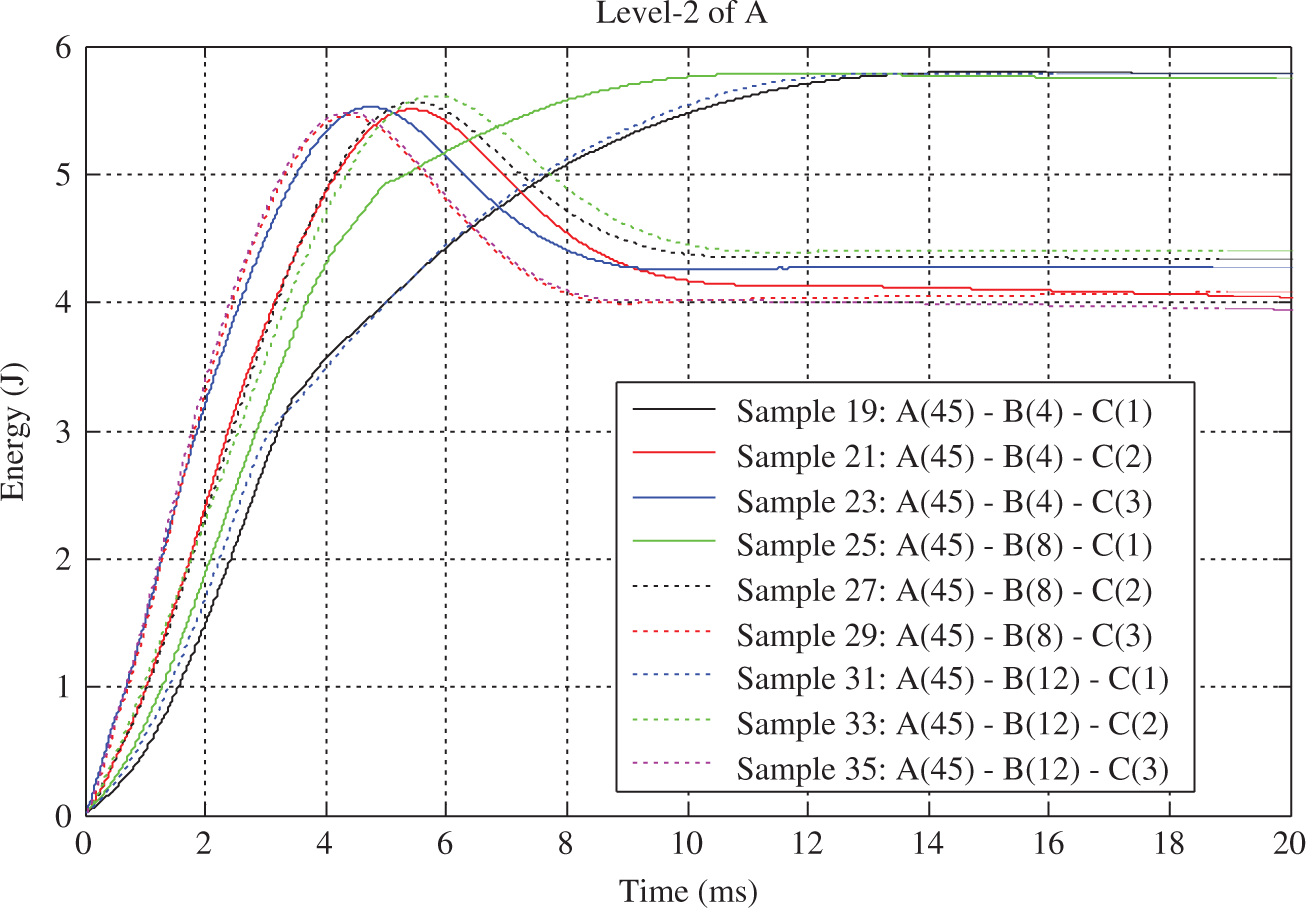
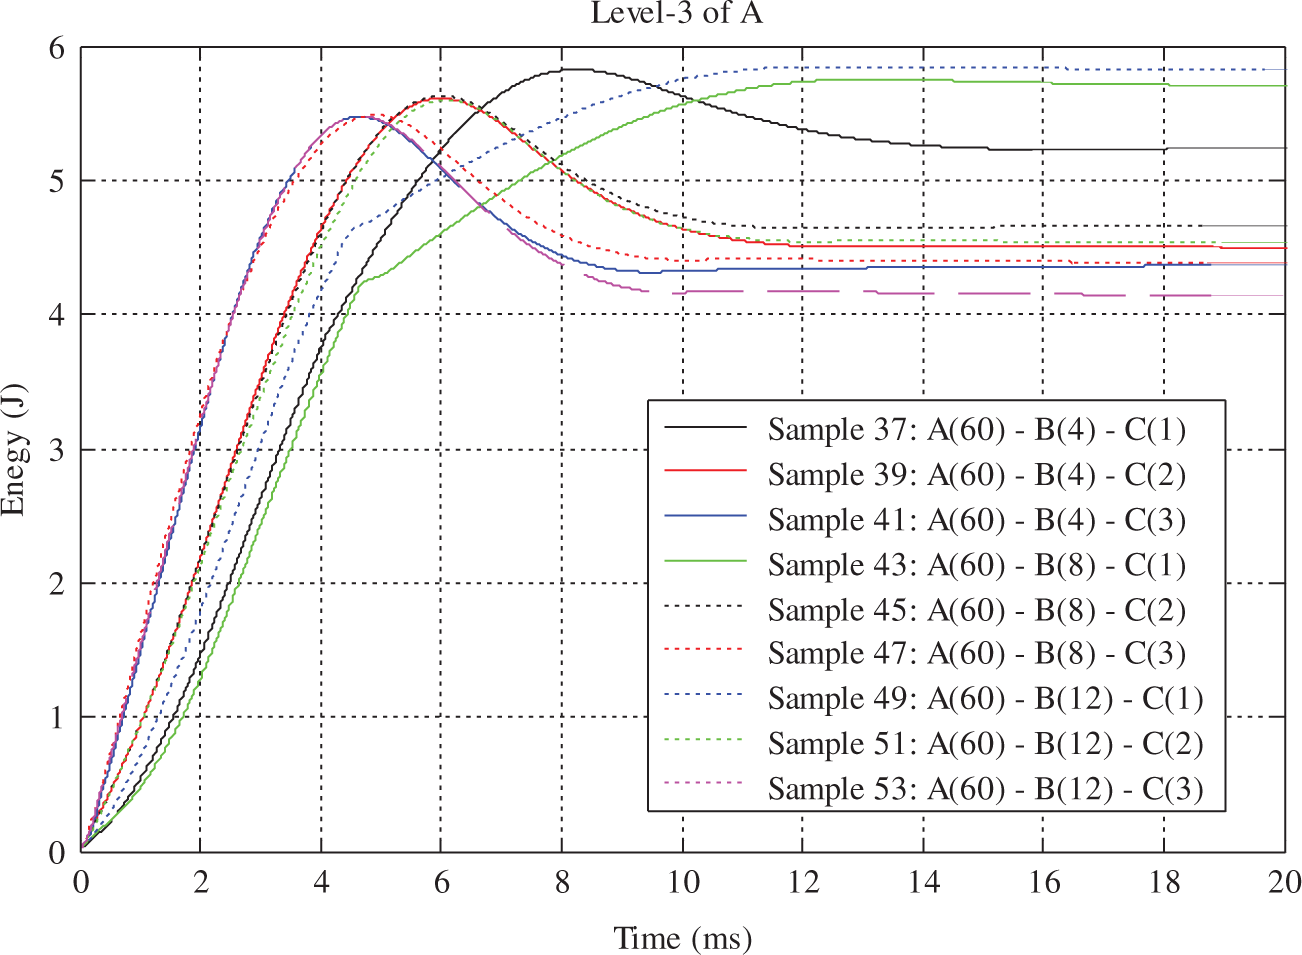
The response data for the three main response variables considered in the present study are obtained by energy (X) versus time and peak contact force (Y) versus deflection (Z) plots. The energy history curve gives the energy absorbed by the honeycomb sandwich sample. Energy (X) as a function of time for all the samples excluding the repeated samples is shown in Figures 4 to 6. The repeated samples are excluded from Figures 4 to 6 for the presentation purposes. The ascending portion of the curve indicates the energy absorbed (X) by the sample and the unloading portion of the curve indicates the energy given back by the sample to the impactor due to the reaction force. The flat portion of the curve represents the net energy absorbed by the sample. It can be observed from the Figures 4 to 6 that the samples with one layer of adhesive layer, that is, the samples with factor C at level 1 have a less elastic portion and high-impact energy absorption. This behavior can be attributed to the presence of less number of adhesive layers. The failure started with de-bonding of the core and the facesheet. The samples failed in de-bonding and further application of load caused the higher damage instead of rebounding of the impactor.
Energy versus time for level 1 of factor A. Energy versus time for level 2 of factor A. Energy versus time for level 3 of factor A.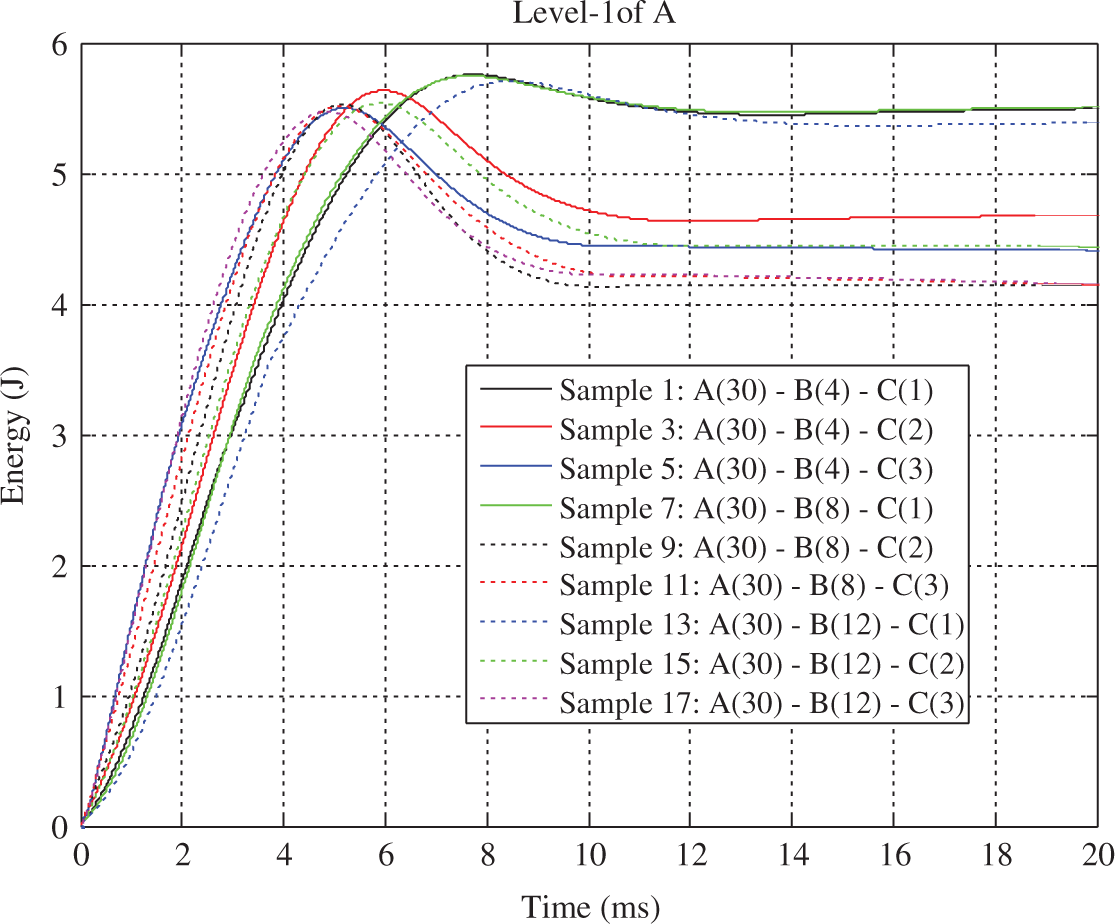
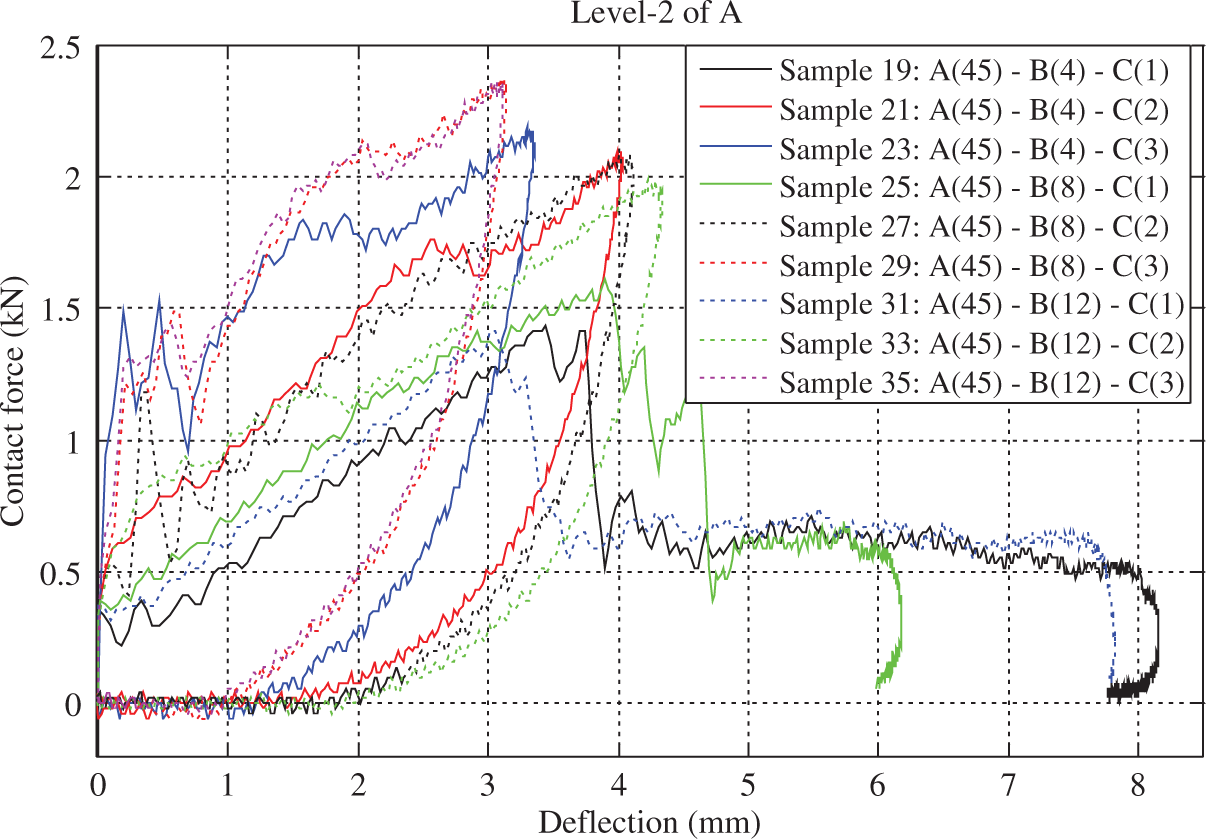
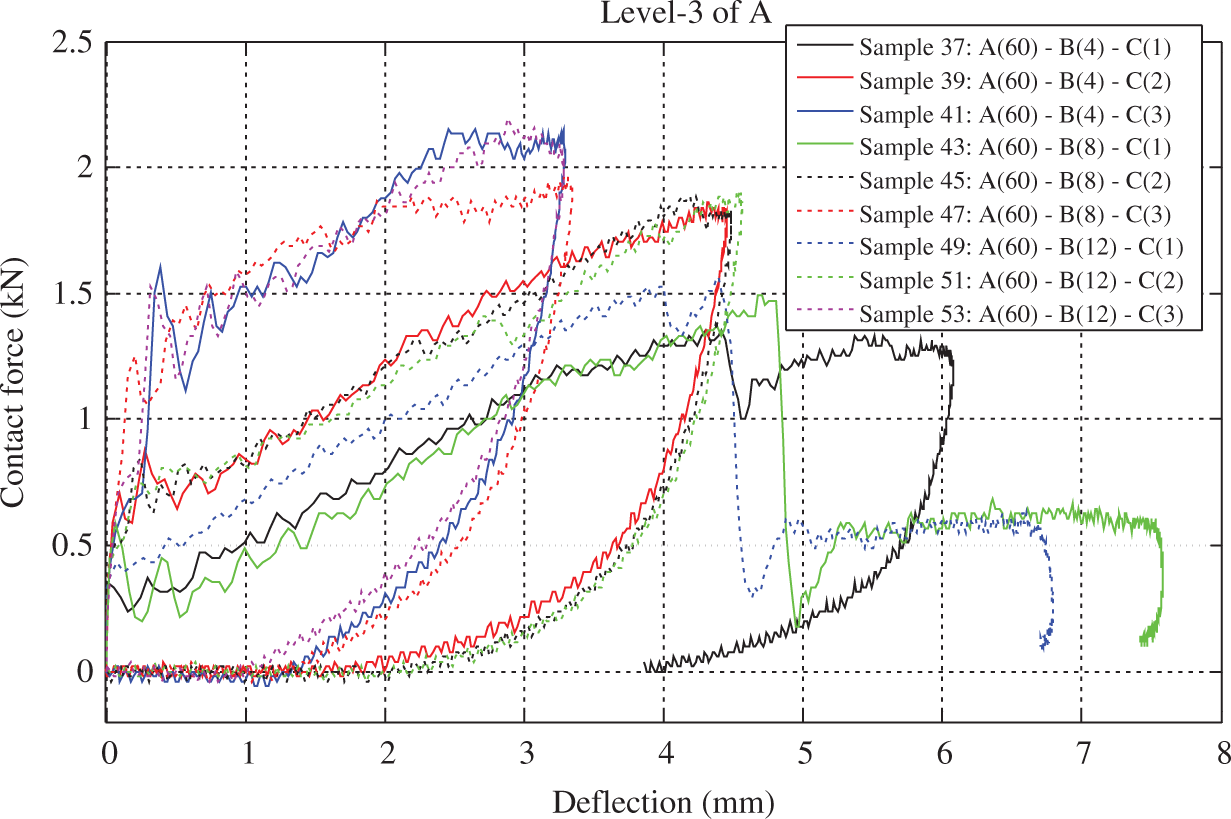
Contact force (Y) as a function of deflection for the sandwich specimens is shown in Figures 7 to 9. As observed in these figures, the repeated rise and fall of the contact force (Y) reveal that failures occur successively in facesheet and core materials during impact event. The contact force (Y) versus deflection (Z) response up to the first peak indicates an elastic response up to that point. Once the load reaches the first peak value, there is a sudden drop in the load, which indicates the damage initiation in sandwich panels. The first load drop is due to the first type of failure such as delamination or fiber breakage in outer facesheet made of composite laminate. The successive rise and drop in the load is due to the loading and failing of the layers of the facesheets. The contact force (Y) versus deflection (Z) curves are closed ones as the impactor bounces back to the normal position unless the impactor penetrates the samples through core. We can observe a trend in the contact force (Y) versus deflection (Z) results that the samples with less number of adhesive layers even though with higher number of facesheets, could not take high contact forces. Moreover, the samples with a single layer of adhesive have more damage, that is, deflection, which is permanent and the plots show that the impactor did not return to the neutral position. This reveals that the samples failed in de-bonding and did not have the strength to send the impactor back to the zero position. The same trend can be observed in Figures 7 to 9.
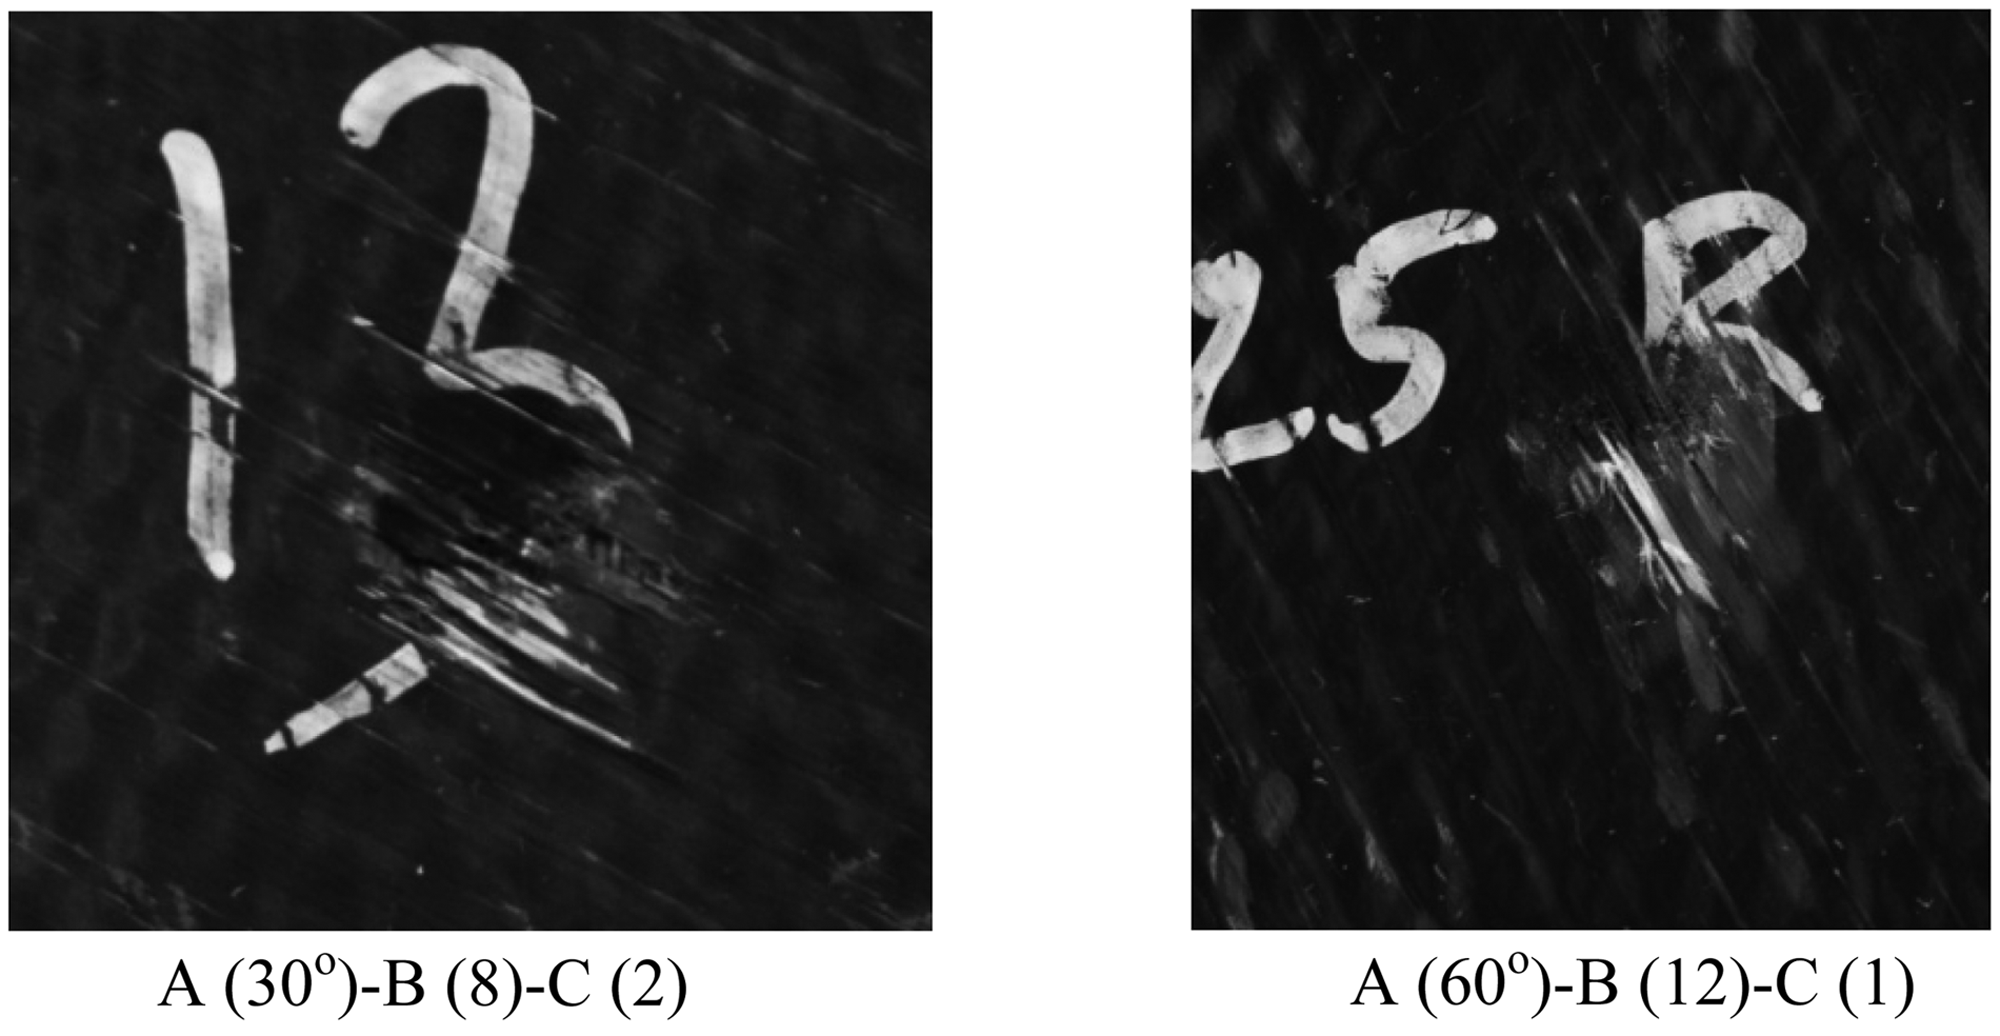
Peak contact force versus deflection for level 1 of factor A. Peak contact force versus deflection for level 2 of factor A. Peak contact force versus deflection for level 3 of factor A. Damaged samples after low-velocity impact test.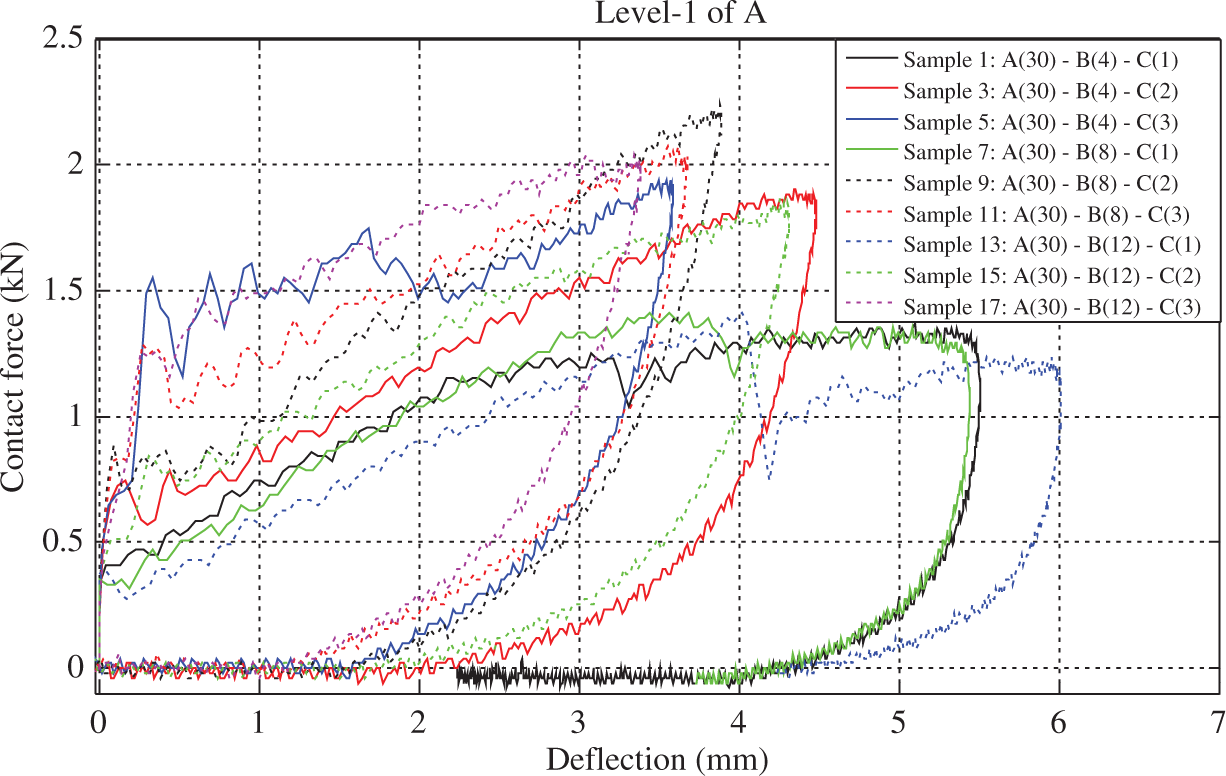
Damage analysis
In general, low-velocity impact damage of core panels with composite faces is limited to the top surface, the face/core interface, and the core. The lower face remains generally undamaged. A number of different failure modes such as delamination in the impacted facesheet, matrix cracking and the fiber breakage, de-bonding in the face/core interface, and core crushing (permanent deformation) in a region of impact, and so on have been identified [7]. The honeycomb sandwich samples after impact tests are shown in Figure 10 and experimental variables for each sample are listed. The failed samples are observed to have delamination, de-bonding of the face/core interface, and core crush. It can be observed from the Figure 10 that the damage is predominantly in the direction of the top facesheet layer. Core crushing is observed only in the samples with four facesheet layers. The extent of damage is decreased as the number of facesheet layers is increased.
Residual plots for the energy absorbed.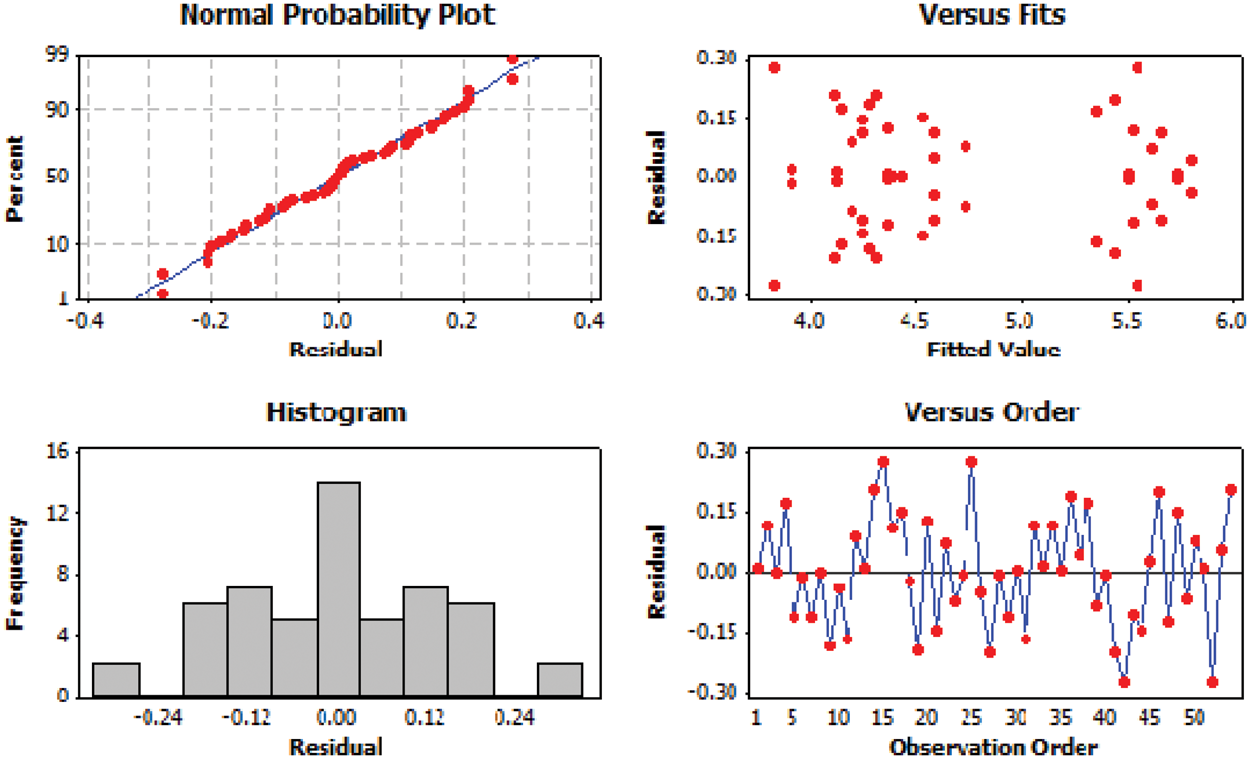
Statistical analysis
A significance level of α = 0.05 is used in the statistical analysis to determine significant variables. A value of 0.05 implies that the null hypothesis is rejected at most 5% of the time when it is in fact true. In the statistical results reported in this study, p values associated with each test are given. A p value of 0.05 or less signifies that the corresponding effect or variable has a statistically significant effect on the response variable.
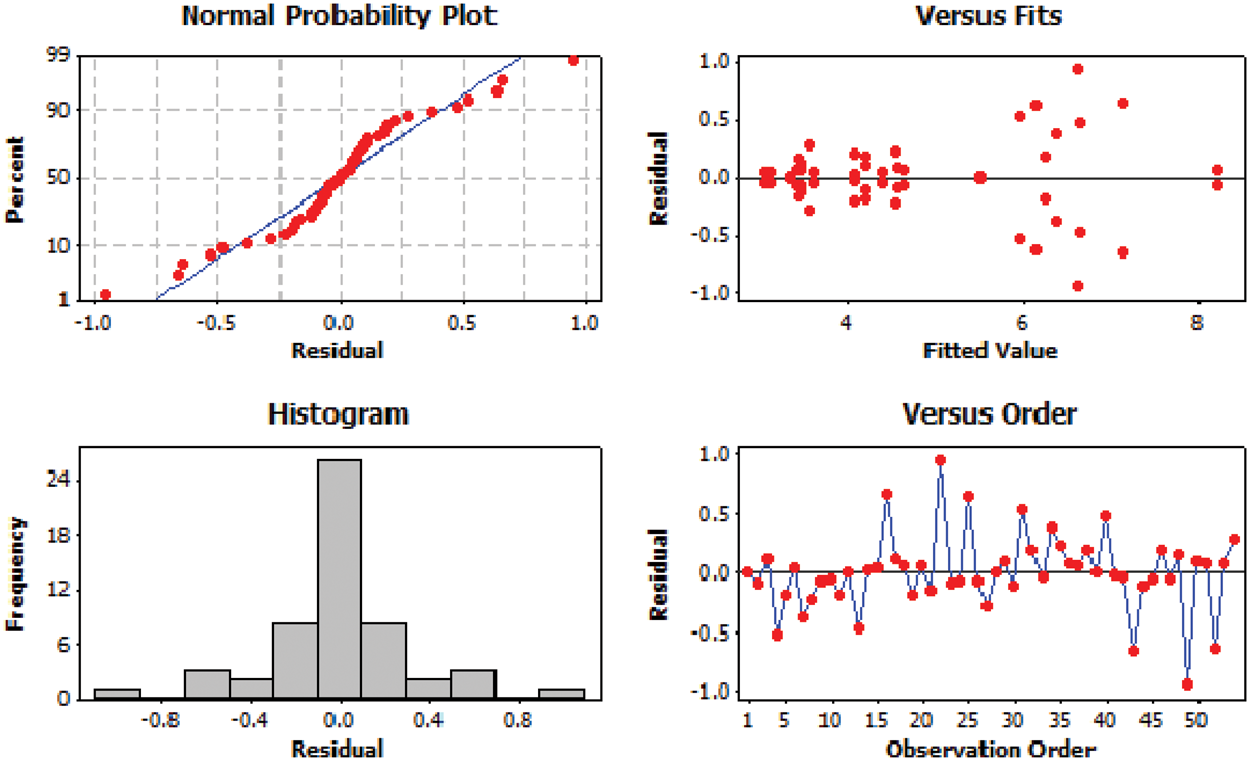
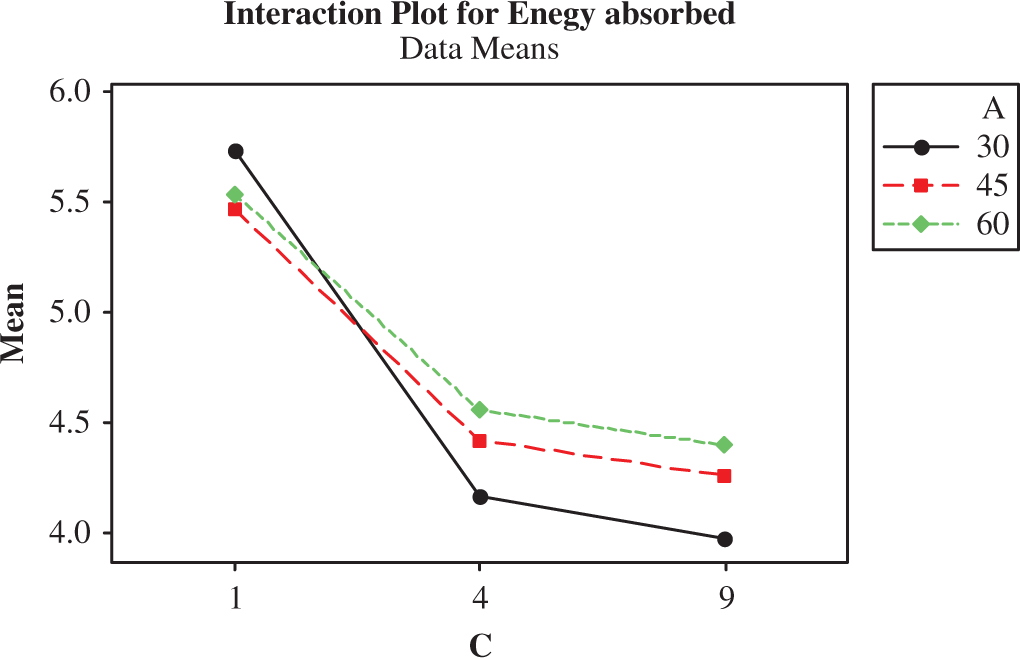
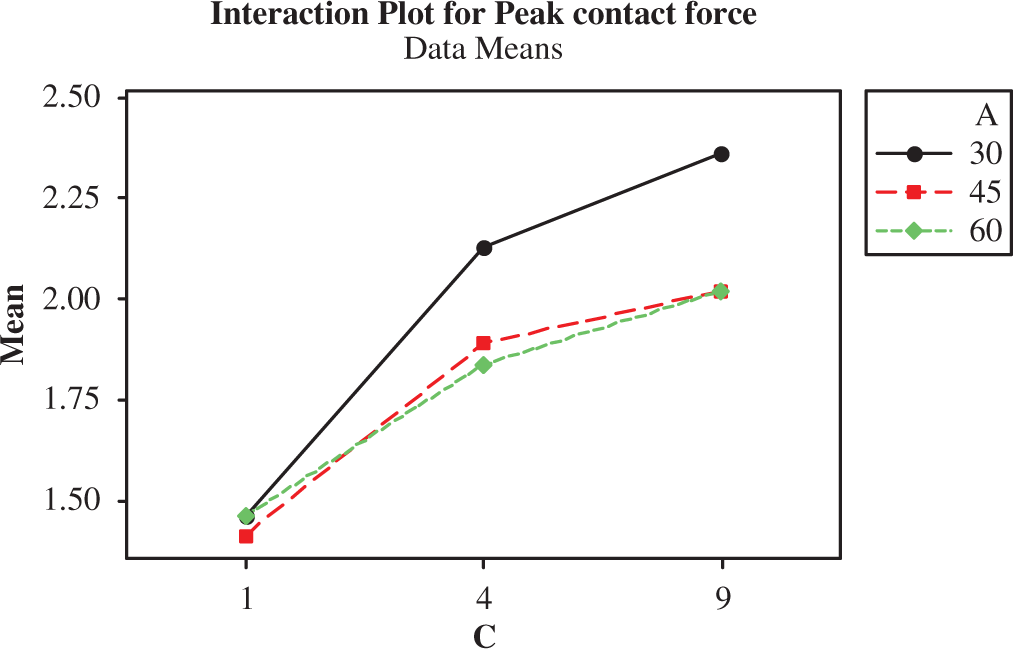
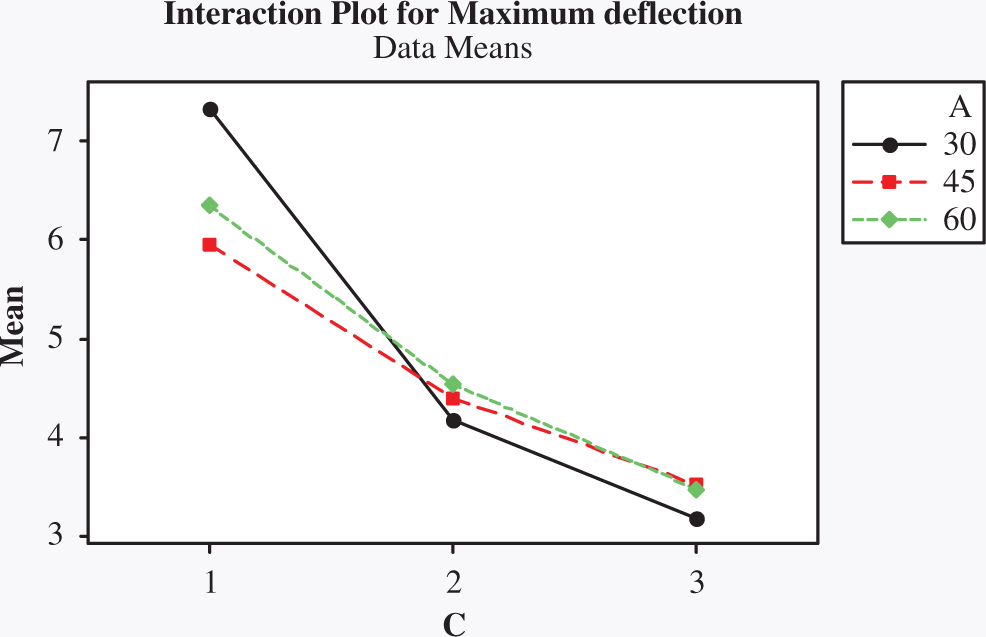
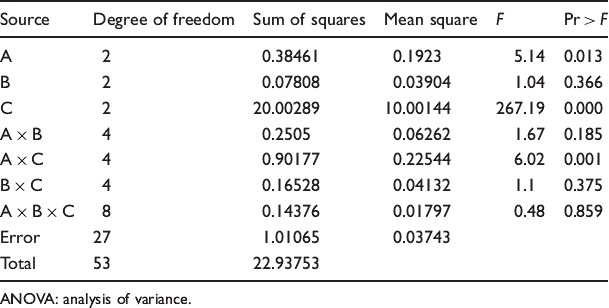
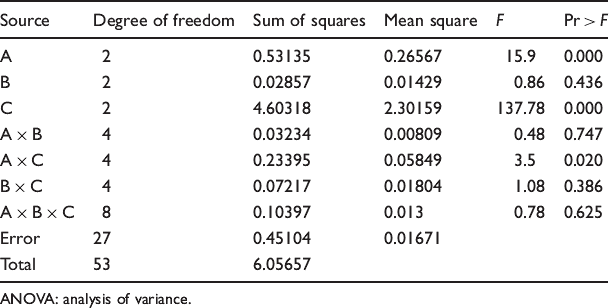
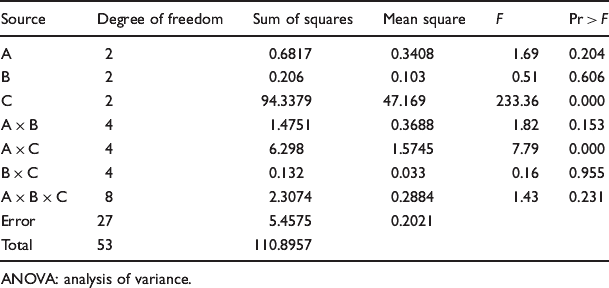
Tests of normality are performed on the residuals to ensure the underlying assumption of normally distributed experimental error. The residuals from a fitted model are the differences between the responses observed at each combination values of the experimental variables and the corresponding prediction of the response computed using the estimated model. The normal probability plots and the histogram of the residual plots given in Figures 11 to 13 indicate that both the normality assumption and the equality of variance across experimental units are not violated as the experimental data are closely in line with the fitted line. The analysis of variance tables are generated using “MINITAB 15,” statistical analysis software, for all the response variables. It can be observed from the Tables 3 to 5 that the three factor interactions for all the three response variables are insignificant. As the three-way interaction is insignificant, the statistically appropriate procedure is to look at the two-way interactions. It can be observed that only A × C (angle difference × number of adhesive layers) interaction is significant in the analysis for each of the three response variables. The A × C interaction effect is shown in Figures 14 to 16. The figures show the response data for all three response variables, energy absorbed (X), peak contact force (Y), and maximum deflection (Z), against factor C for each of the three levels of factor A. It can be observed that the three lines corresponding to three levels of factor A are intersecting each other revealing the significant interaction between these two factors. What this interaction indicates is that the way factor C affects the response is different across the levels of factor A.
Residual plots for the peak contact force. Residual plots for the maximum deflection. Interaction plot for energy absorbed. Interaction plot for peak contact force. Interaction plot for maximum deflection. ANOVA table for energy absorbed (J) ANOVA: analysis of variance. ANOVA table for peak contact force (kN) ANOVA: analysis of variance. ANOVA table for maximum deflection (mm) ANOVA: analysis of variance.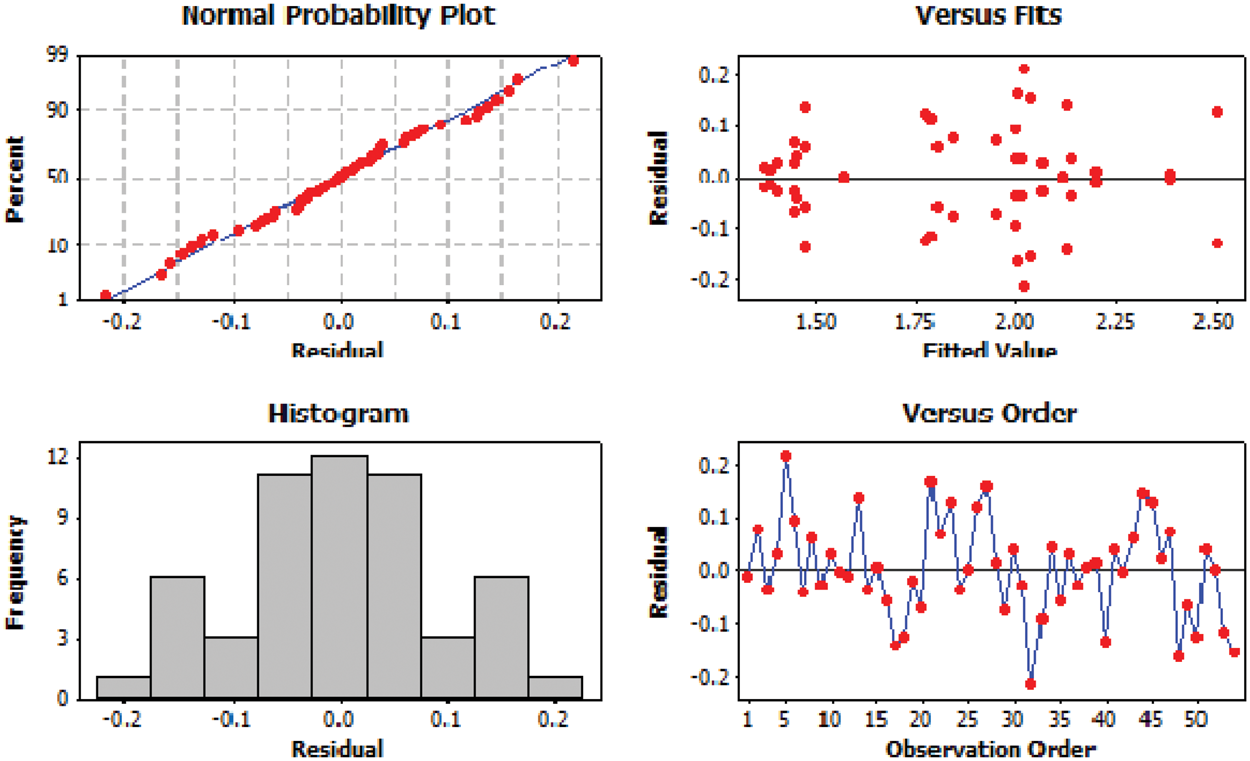
Regression analysis
Coefficients of regression model for energy absorbed. a
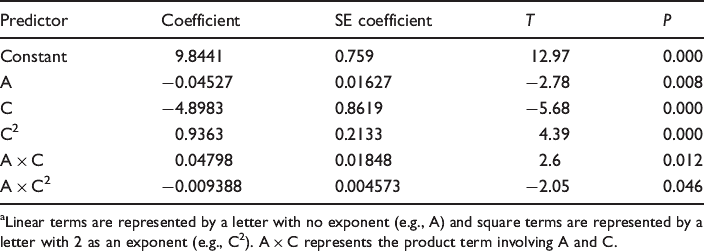
Linear terms are represented by a letter with no exponent (e.g., A) and square terms are represented by a letter with 2 as an exponent (e.g., C2). A × C represents the product term involving A and C.
Coefficients of regression model for peak contact force. a
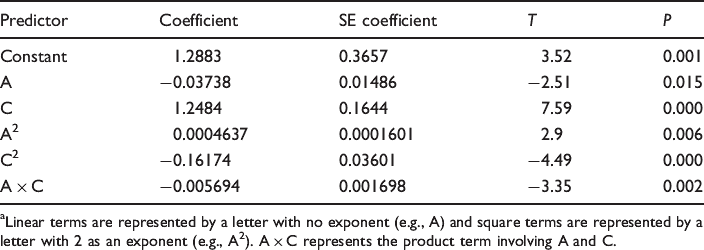
Linear terms are represented by a letter with no exponent (e.g., A) and square terms are represented by a letter with 2 as an exponent (e.g., A2). A × C represents the product term involving A and C.
Coefficients of regression model for maximum deflection. a
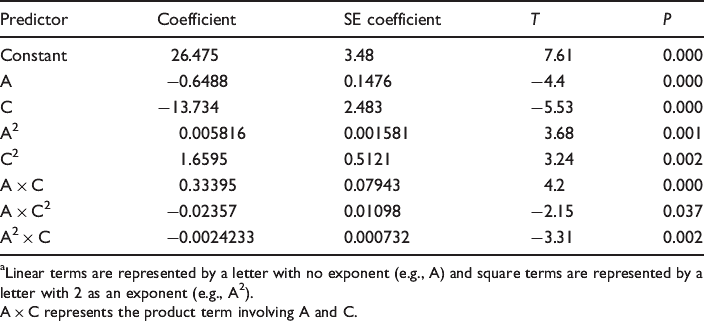
Linear terms are represented by a letter with no exponent (e.g., A) and square terms are represented by a letter with 2 as an exponent (e.g., A2).
A × C represents the product term involving A and C.
The fitted regression model for energy absorbed (X) is,

R2 = 91.1%; Adjusted R2 = 91.3%
The fitted regression model for peak contact force (Y) is,

R2 = 87.7%; Adjusted R2 = 86.4%
The fitted regression model for maximum deflection (Z) is,

R2 = 91%; Adjusted R2 = 89.6%
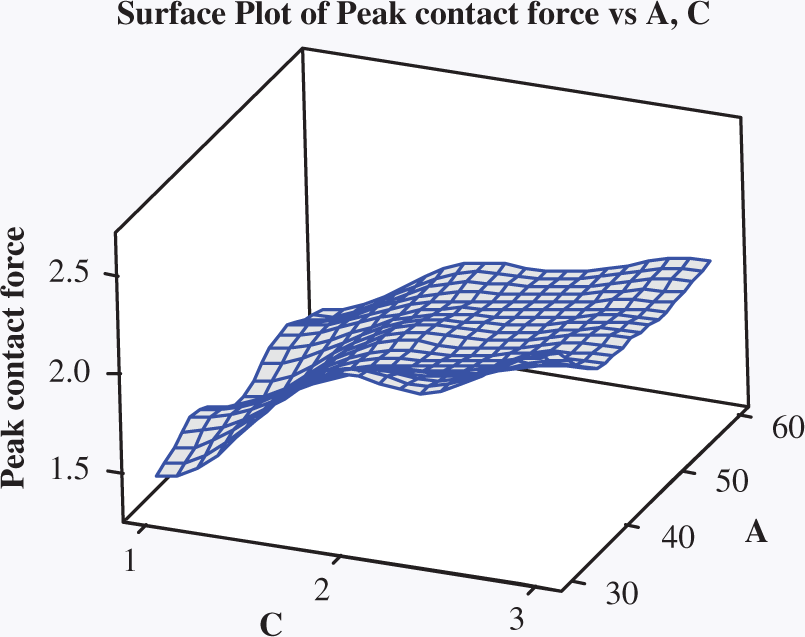
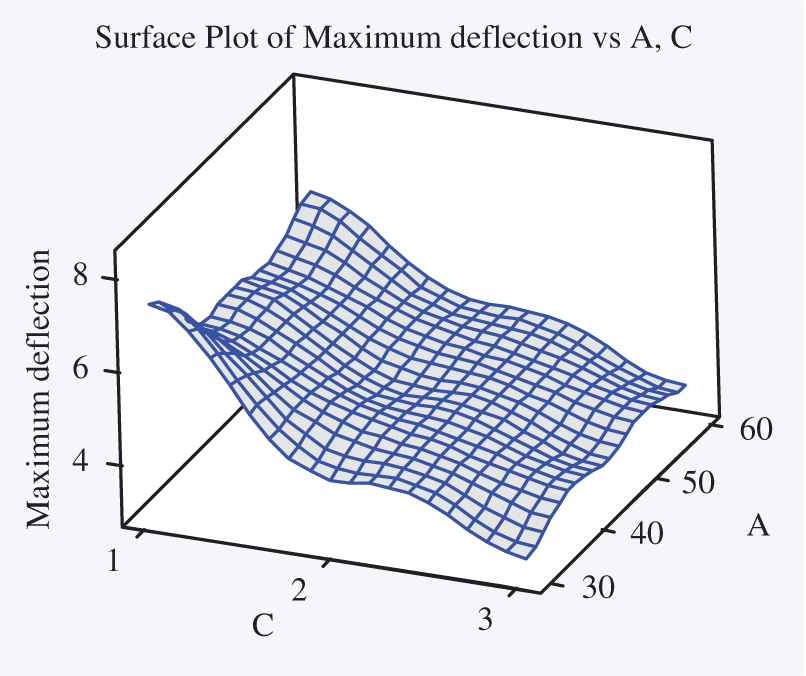
The response surface for all three responses, that is, energy absorbed (X), peak contact force (Y), and maximum deflection (Z) are shown in Figures 17, 18, and 19, respectively, which represent the graphical form of equations (1), (2) and (3), respectively. The responses are plotted against the factors A and C keeping the factor B constant at the average value in Figures 17, 18, and 19, respectively. The detailed regression models for all the three response variables are shown in Tables 6 to 8. In simple or multiple linear regression, the value of the coefficient for each coded independent variable gives the size of the effect that variable is having on the dependent variable, and the sign on the coefficient (positive or negative) gives the direction of the effect. The SE coefficient listed in Tables 6 to 8 is an estimate of the standard deviation of the coefficient. A p value less than 0.05 indicates that the real, underlying value of the coefficient falls within 95% confidence interval.
Response surface plot for energy absorbed. Response surface plot for peak contact force. Response surface plot for energy maximum deflection.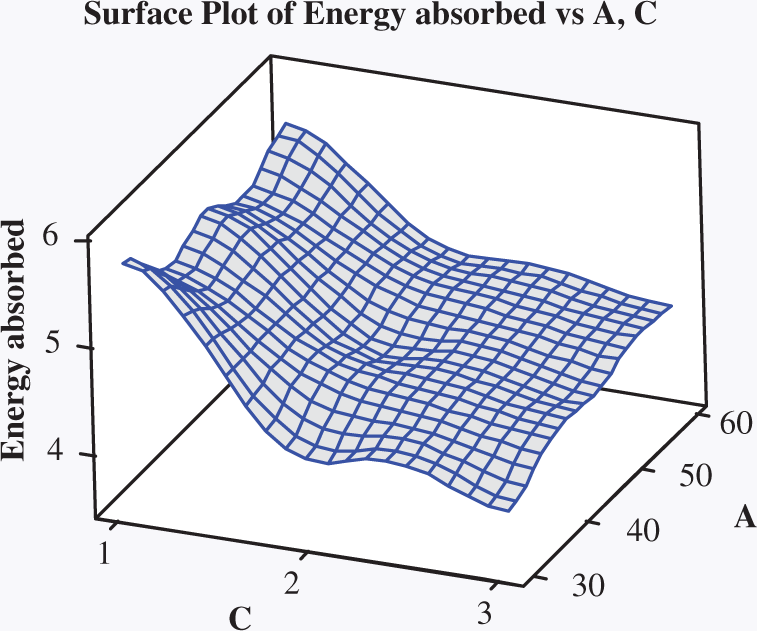
Confirmation test
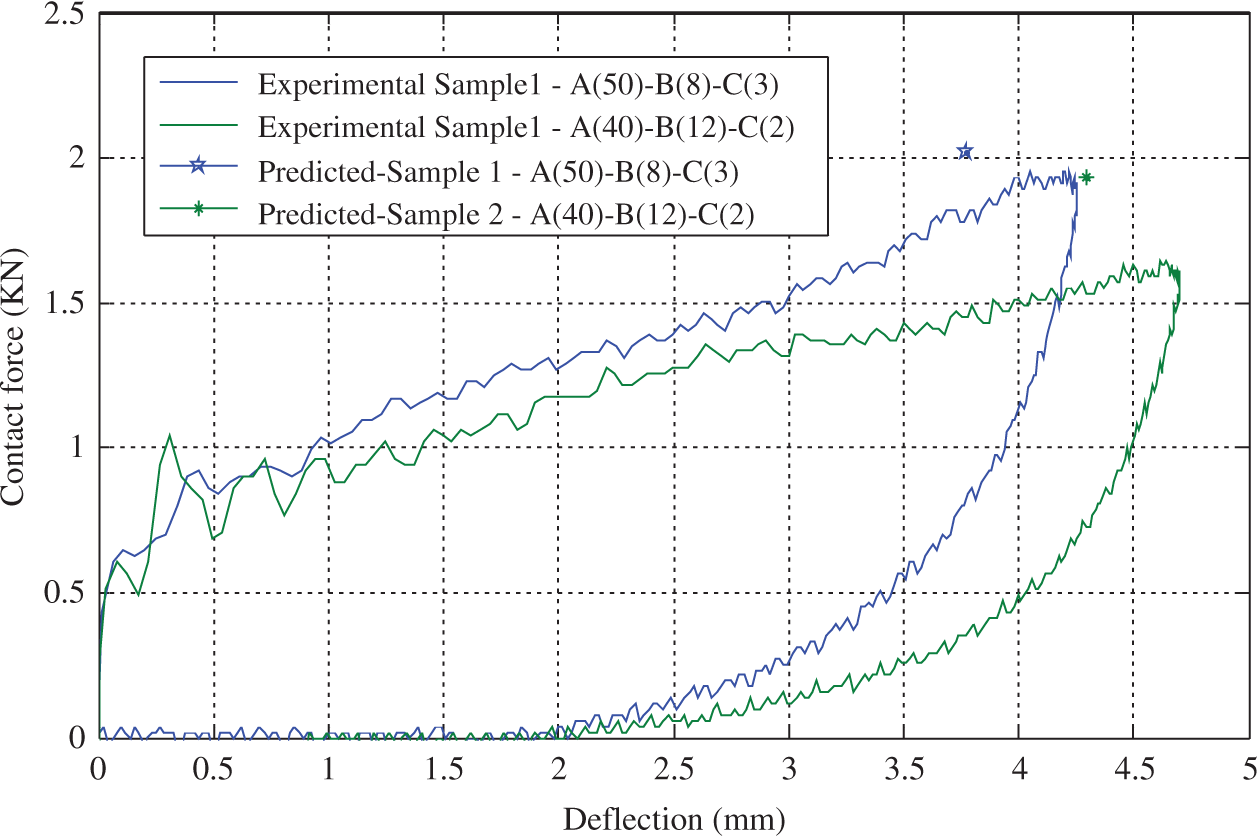
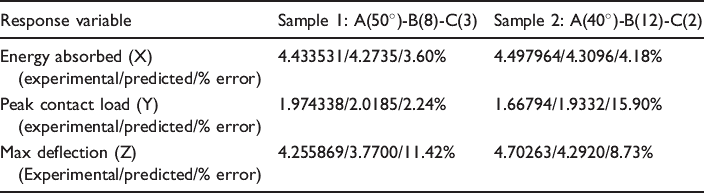
The confirmation runs are done to validate the empirical models generated by the regression analysis. The confirmation runs are made under the same operating conditions as that of the original samples. As the optimum combination of the experimental factors for each response variable is different, two general configurations are considered for manufacturing the confirmation samples. The sample configurations are given in Table 9. The values of the three factors for confirmation samples are taken such that they fall in between the levels considered in the study. For sample 1 the factor A is 50°, B is eight prepreg layers and C is three adhesive layers. Similarly for sample 2, the factor A is 40° angle difference, B is 12 prepreg layers, and C is 2 adhesive layers. The low-velocity impact test results for the confirmation samples are shown in Figures 20 and 21. The figures also show the comparison of the empirical model with the test results. It can be observed from Figures 20 and 21 and Table 9 that the empirical model is matching closely with the test results.
Energy versus time results of confirmation test. Peak contact force versus deflection results of confirmation test. Comparison of regression model with confirmation test results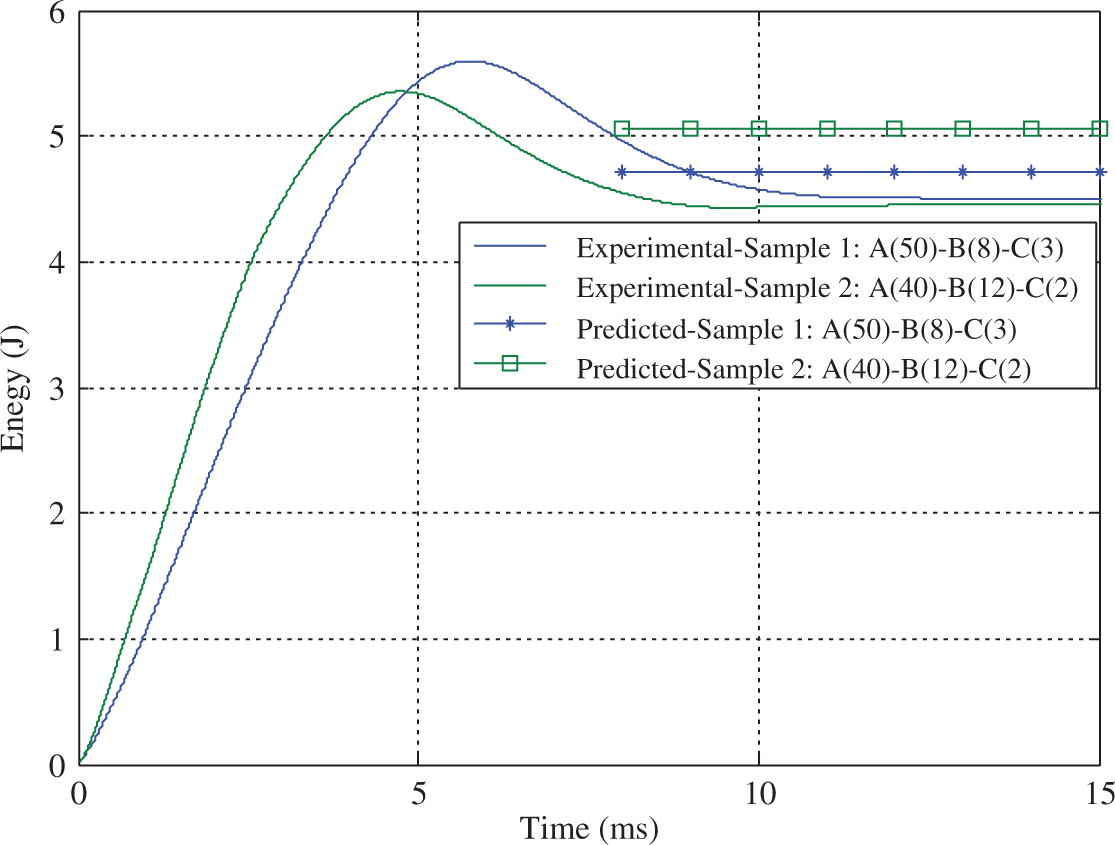
Conclusions
A cost effective vacuum bag pressure only OOA process is used for manufacturing high-quality honeycomb sandwich panels. Low-velocity impact tests are conducted on the carbon fiber prepreg facesheet sandwich panels at an energy level of 6 J. It is observed that the number of adhesive layers had great effect on the impact response of the sandwich panels. DOE method is applied to the response data to identify the significant factors and generate an empirical model for future usage. The results indicate that the factors A (angle difference between successive prepreg layers) and C (number of adhesive layers) along with A × C interaction are the most significant factors for the response variables, energy absorbed (X), and peak contact force (Y). But only C and A × C are significant factors for the response variable maximum deflection (Z). A regression analysis is carried out and regression models are developed for all the three response variables, energy absorbed (X), peak contact force (Y), and maximum deflection (Z). The regression models are verified with the confirmation test results and are in good agreement. There is scope to include more process variables in studies such as these, including material-dependent variables such as honeycomb characteristics, moisture content, and vacuum levels.
Footnotes
Funding
This research received no specific grant from any funding agency in the public, commercial, or not-for-profit sectors.