






Abstract
Keywords
Introduction
Under the international trend of constantly replacing obsolete items with new ones, high-tech employees are required to actively conduct product research and development. They work in a fast-paced and stressful environment with irregular hours, and often need to work in shifts or perform overtime work. Because of their unhealthy lifestyles, such as a lack of activity and an unhealthy diet, these employees have become a high-risk group for obesity and other chronic diseases. According to a survey in Taiwan, the prevalence of overweight and obese adults is 45.4%, and 39.2% of workplace employees are overweight. The rate of overweight and obese adults has continued to increase in the past decade (Health Promotion Administration Ministry of Health and Welfare (MOHW), 2017). Based on the above information, it is reasonable to presume this group will have a relatively high proportion of overweight and obese individuals. Does this phenomenon contribute to the morbidity rate of Obstructive Sleep Apnea (OSA)? High-tech employees are the mainstream talents important for national economic development, and close attention needs to be given to their needs. Being overweight or obese can lead to serious health consequences and is a global public health issue in the 21st century (Tuomilehto et al., 2013).
OSA is a common sleep disorder characterized by the obstruction of the upper airway during sleep, resulting in periodic and repetitive hypopneas or apneas. At least 9% to 38% of the adult population suffers from this disease and is increasingly recognized by the public (Jonas et al., 2017; Senaratna et al., 2017). Several recent studies have pointed out that OSA is related by multifactorial risk factors including obesity, gender, genetic predispositions, lifestyle, and certain comorbidities (Fietze et al., 2019; Senaratna et al., 2017). Numerous empirical studies have shown that being overweight or obese is regarded as an independent and important risk factor for OSA. In fact, there is a 10-fold risk of OSA for a person with a BMI >29 kg/m2, and it is estimated that 58% of moderate to severe OSA is due to obesity (Hamilton & Joosten, 2017; Tuomilehto et al., 2013).
At present, most clinicians underestimate the impact of OSA on public health problems, and many patients with OSA have not yet been diagnosed. A survey of the prevalence of OSA in the United States has estimated that 60–80% of the public is accompanied by undiagnosed OSA (Carter & Watenpaugh, 2008). If the patient has coexisted with undiagnosed and untreated OSA for several years, such long-term exposure to cardiovascular risk may result in multiple chronic diseases, which lead to decreased effectiveness of treatment and increased medical expenditures (Hirsch Allen et al., 2015). Furthermore, multiple chronic diseases derived from OSA will cause increased cases of sick leave for employees in the workplace, reduced work productivity, and may even result in public safety risks, with the impacts extending to family or social crises (Boese et al., 2014). In summary, the current relevant study on overweight and obese high-tech employees with OSA is still lacking, and the few previous studies on the OSA of workplace employees are based on questionnaire screenings. Therefore, it is necessary to use more accurate physiological tools to explore the status of OSA in this group and its important risk factors. This study aimed to explore the distribution of undiagnosed OSA among overweight and obese employees in high-tech workplaces, determine the predicting factors of overweight and obese employees with OSA, and examine the status of the severity of OSA and identify the influencing factors of the differing severity of OSA among overweight and obese employees in high-tech workplaces.
Material and Methods
Study Design and Participants
A descriptive cross-sectional study design was employed. Convenience sampling was adopted, and participants were recruited from a large-scale electronics industry in central Taiwan that had 5 branches and more than 5000 employees. Of those, there are 3380 white-collar employees, including administrative supervisors, managers, and engineers. Their main responsibilities are contacting and developing semiconductor related products with domestic and foreign companies. Average working hours are 40–48 h per week. On the other hand, 2314 are blue-collar employees, including technicians, warehouse staff, and drivers, all of which are highly demanding jobs with average work shifts of 48 h per week. Based on the MOHW in Taiwan (2017), a BMI between 24 kg/m2 and 27 kg/m2 is considered overweight, while a BMI greater than 27 kg/m2 is considered obese. The inclusion criteria were: (i) between 21 and 65 years old; (ii) BMI greater than ≧ 24 kg/m2 or an abdominal circumference ≧ 90 cm for males and 80 cm for females; and (iii) voluntary participation in this study. The exclusion criteria included participants who had been diagnosed with OSA and were receiving treatment, those with a mental disorder, severe disease, or drug addiction, verified by occupational nurses during an annual health examination.
GPower3.1.9.2 software was used to estimate the sample size and perform statistical tests on the multivariate logistic regression. According to the results of (Franklin & Lindberg, 2015) on the prevalence of OSA in men and women (37% and 20%, respectively), the odds ratio was calculated as 2.35, and α was set to be.05. In consideration of the limited previous research available on high-tech ethnic groups, the power was set to 0.90; therefore, the ideal sample size was 432. After accounting for a 15% attrition rate, the final recruited number was 500. Two could not be reached or refused to undergo further OSA examination for personal reasons; 7 underwent the OSA examination which produced no result owing to improper operation or mechanical errors and refused to take a retest. In the end, the number of valid participants was 491 (Figure 1). . Flow of study selection processes.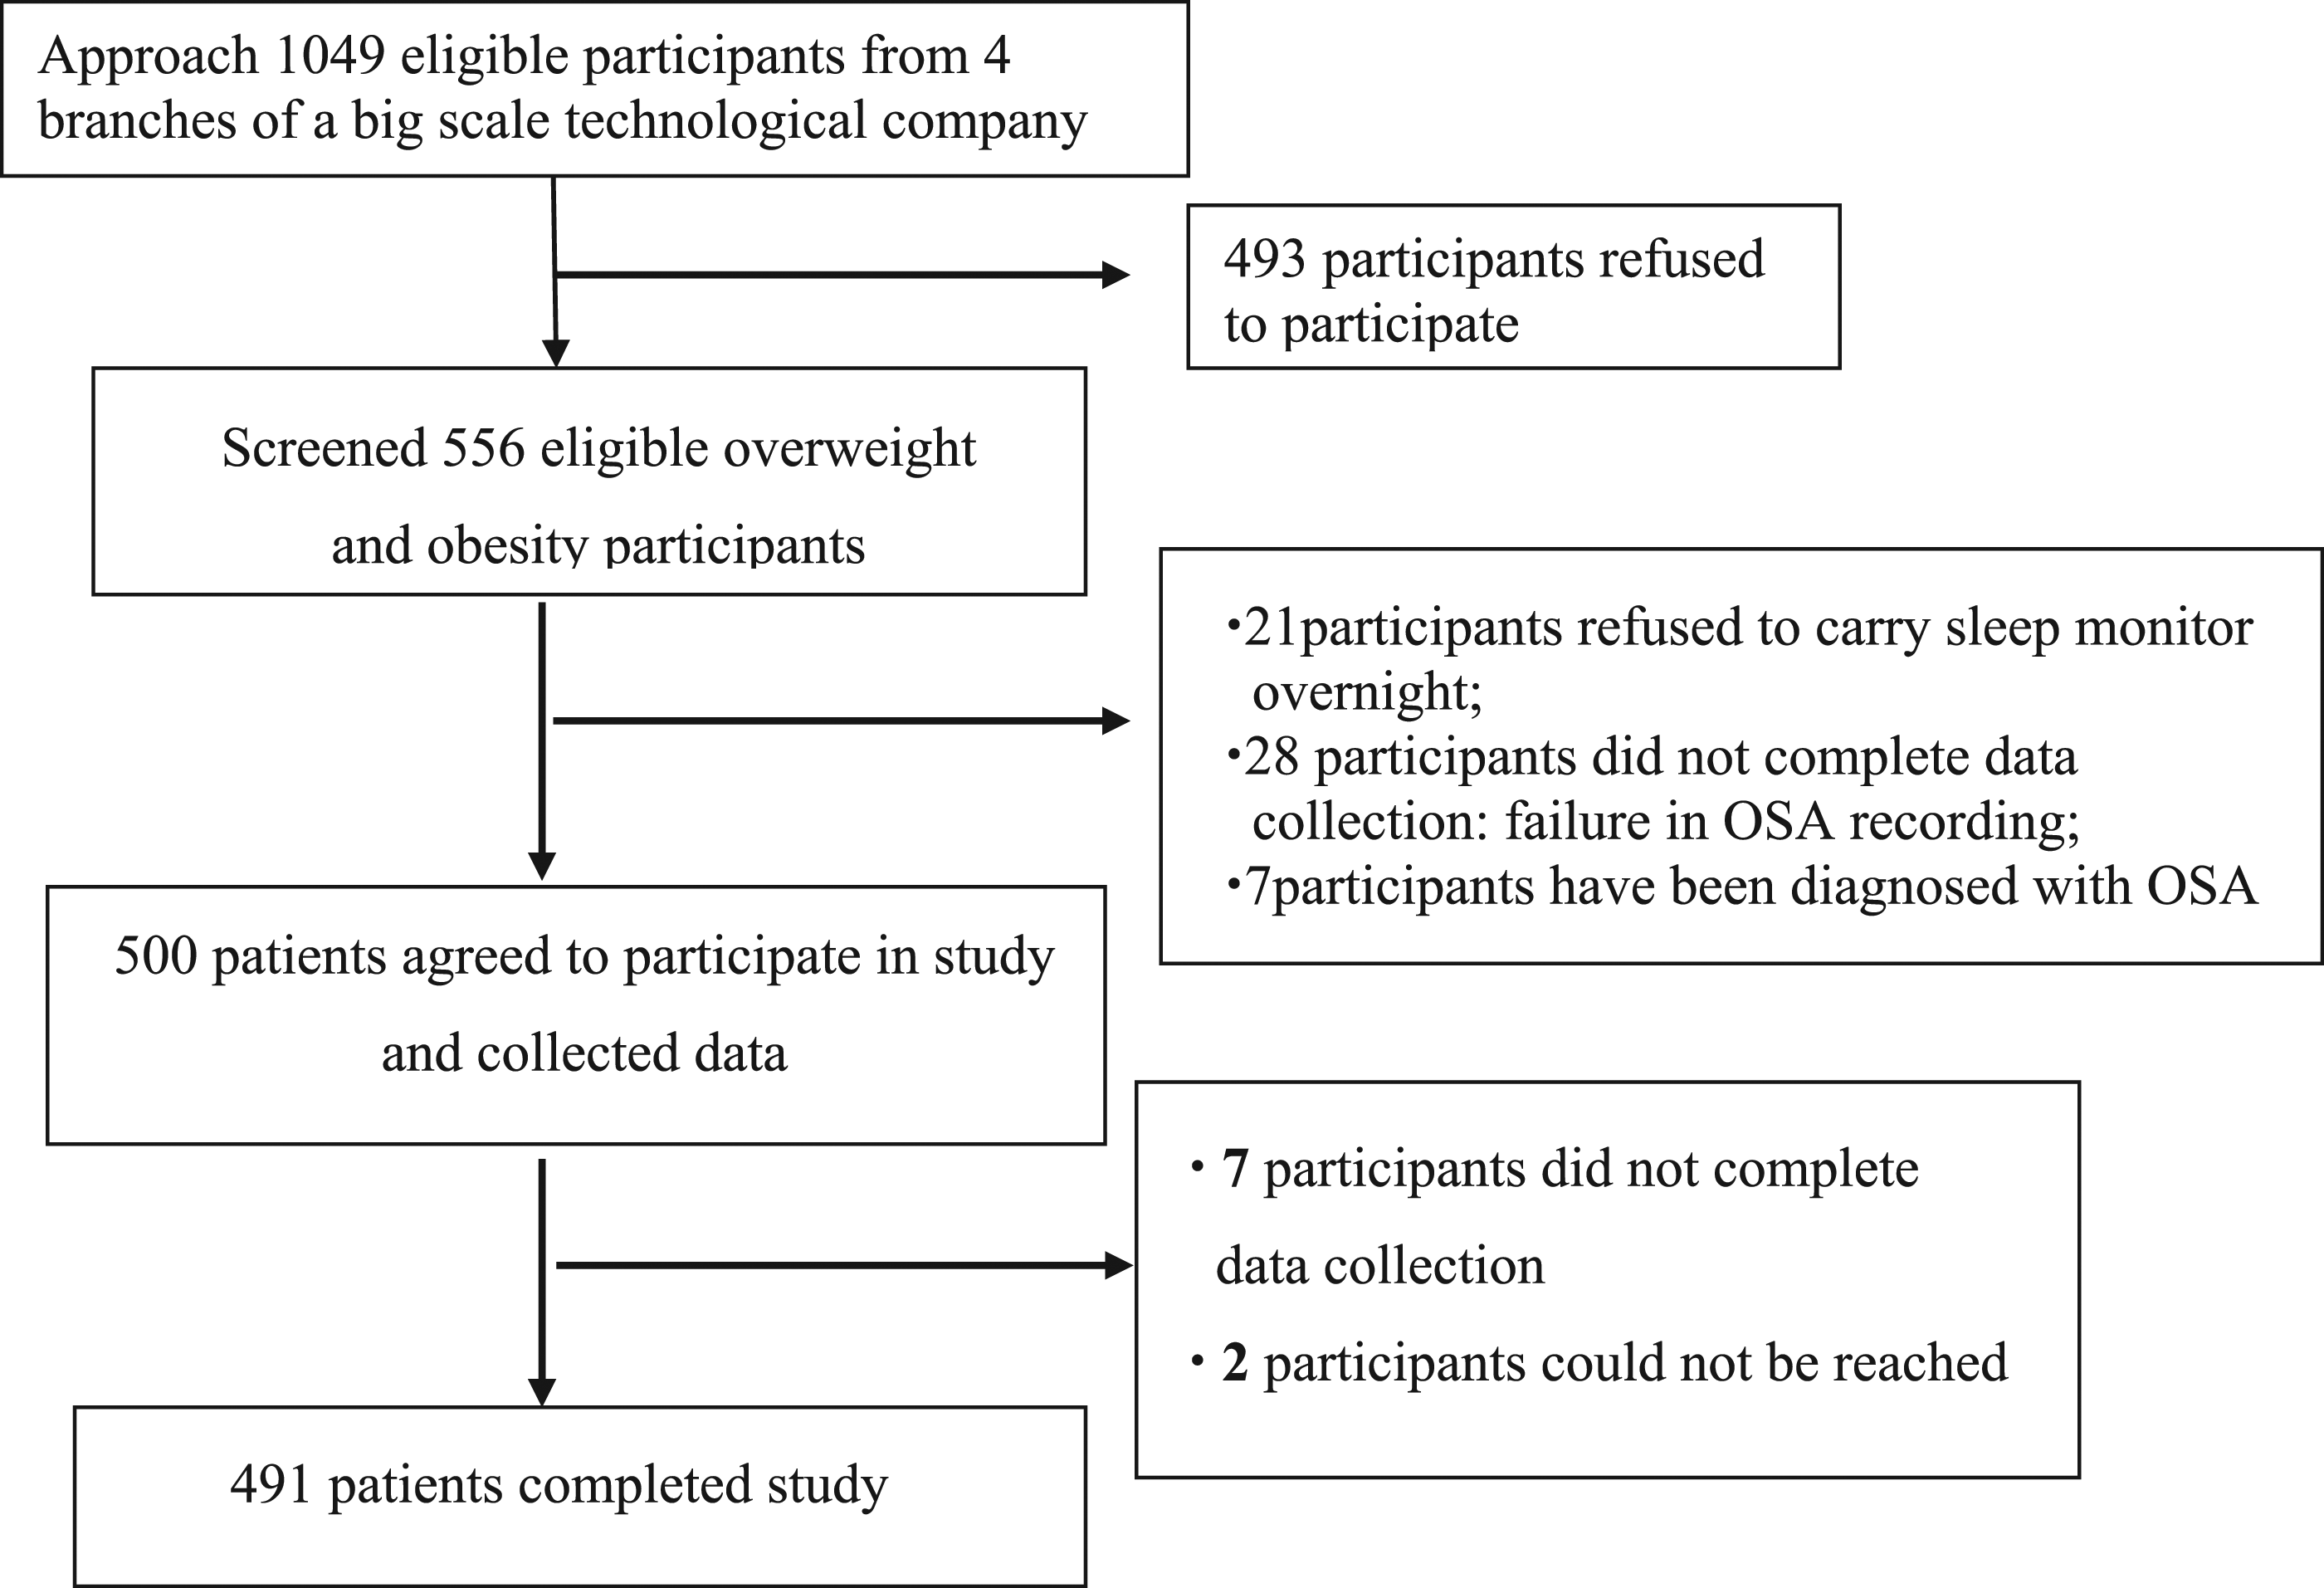
Measurements
Health-Demographics Variables
The demographic data included age, gender, body height, weight, BMI, body fat, neck circumference, waist circumference, blood pressure, smoking and drinking habits, shift work, and the presence of chronic disease.
Chinese Version of the Epworth Sleepiness Scale
The CESS assesses the severity and frequency of an employee’s sleepiness while performing common daily activities, such as “sitting and reading.” It contains 8 items, which are rated using a 4-point scale, with scores ranging from 0 (“would never doze”) to 3 (“high chance of dozing”); the total score can range from 0 to 24 points. In our study, according to Buysse et al. (2008), excessive daytime sleepiness was defined as the score of CESS >10, and the value of CESS ≦ 10 was considered no daytime sleepiness.
Chinese Version Pittsburgh’s Sleep Quality Index
The CPSQI, a self-report of sleep disturbances over the preceding month, was employed in this study. It contains 19 questions divided into 7 major components: sleep latency, subjective sleep quality, sleep duration, sleep efficiency, sleep disturbances, use of sleeping medication, and daytime dysfunction. Each component is equally weighted using 0 to 3 points and the total score of all 7 components ranges from 0 to 21. “Poor sleep” is defined as a CPSQI score greater than 5.
Beck Depression Index
The BDI is a 21-item, self-rated inventory for assessing the severity of depression. Participants select the most suitable item based on their true feelings in the last week. Each question is scored with a Likert scale ranging from 0 to 3 and a total score ranging from 0 to 63. The BDI scores are classified as normal range (0 to 13), mild depression (14 to 19), moderate depression (20 to 28), and severe depression (29 to 63).
Portable Home Sleep Monitoring Device
A portable home sleep monitoring device, ApneaLink®, (ResMed, Sydney, Australia) was used to measure OSA. This device has a unique breath sensor that employs 2 channels to detect insufficient respiratory airflow and paused breathing from the nasal passages, snoring, blood oxygen saturation, and amount of time spent on sleep posture, such as supine and non-supine positions (Stehling et al., 2017). The home portable sleep monitoring device provides objective physiological indicators for the assessment of OSA to supplement the deficiencies of self-reported questionnaires. An ideal wear time of 4 hours is required to obtain a valid evaluation (Erman et al., 2007).
The Apnea Hypopnea Index (AHI), which denotes to the frequency of apneas and hypopneas per hour during sleep, was used to examine the state of apnea (Jonas et al., 2017). In this study, OSA was defined as the value of AHI greater than 5 events/hr. Participants were defined as having mild, moderate, and severe OSA if they had AHI 5-14 events/hr, 15-30 events/hr, and >30events/hr, respectively (Jonas et al., 2017).
Validity and Reliability
The CESS, CPSQI, and BDI have been widely applied in various fields (Fietze et al., 2019; Hsu et al., 2018; Soler et al., 2017). All the instruments had been translated from the English to the Chinese version, and a well-established validation report as well as the reliability in previous research. In this study, the Cronbach alpha for internal consistency of CESS, CPSQI, and BDI were .80, .74, and .75, respectively. In addition, the home portable sleep monitoring devices had been verified for 100% sensitivity and 87.5% sensitivity specific respectively in identifying OSA (Patel et al., 2007).
Data Collection Processes
Eligible employees who agreed to participate were told that it was necessary to wear an at-home breathing monitor overnight for one night, and they could go to bed at their usual bedtime. Importantly, 4 hours of recording time was required for all participants, and written consent was obtained. Appointments were made for a suitable time to collect data, and the demographic data, CPSQI, CESS, and BDI were provided for completion. Also, waist circumference, weight, and blood pressure were measured after completing the questionnaires. Finally, the time at which participants received the at-home portable sleep monitor was arranged after the above information had been completely collected, simple instructions were provided, and the precautions were clearly explained. The summary report regarding to AHI and the level of OSA with automatic scoring will be generated by ApneaLink software, and the trained researcher will interpret the results to each participant the day after completing the test. The data were collected from August 2019 to July 2020.
Ethical Considerations
This study was approved by the institutional review board of a medical center in northern Taiwan (IRB-201802318B0A3). The purposes of this study and the participants’ rights as well as obligations were clearly explained to the participants by the researchers. This study was confidential and anonymous.
Data Analysis
Statistical analysis was performed using SPSS 24.0 (IBM Inc., USA) for Windows. The internal consistency of the PSQI, CESS, and BDI were evaluated by Cronbach’s α, and descriptive statistical analysis was used to examine the distribution of various variables. An independent t-test and Chi-square test were employed to evaluate the associations between the demographic data and OSA, and to select influence factors that exhibited a correlation coefficient of p < .05 when AHI was >5. Subsequently, a multivariate logistic regression analysis was conducted to identify the factors that affect overweight and obese employees with OSA. Next, the factors that influenced OSA severity were determined. A chi-square test and a one-way analysis of variance were adopted to examine the associations between various demographic data and OSA severity levels, and the factors that exhibited a significance of p < .05 were identified as candidates. Subsequently, multinomial logistic regression analysis was used to find the major influence factors for each OSA severity level. The statistical significance with two-tailed test was set at p <.05.
Results
Characteristics of the Participants
The mean age of the participants without OSA and that of the participants with OSA were 34.6 ± 8.5 and 38.6 ± 8.3 years old, respectively. The distribution of OSA revealed that 60.5% (n = 297) of the overweight or obese participants were found to have concomitant OSA, and the average AHI was 19.73 ± 18.14. According to the OSA severity standard, for those participants with OSA, 58.9% (n = 175) had mild OSA, 22.6% (n = 67) had moderate OSA, and 18.5% (n = 55) had severe OSA. Age, BMI, blood pressure, neck circumference, waist circumference, gender, daytime sleepiness, AHI, snoring times, and habitual drinking were all found to be significantly correlated with OSA (p < .05).
Predictors of Overweight and Obese Employees with OSA
The results showed that OSA and age (OR = 1.08; 95% CI, 1.05–1.11), neck circumference (OR = 1.15; 95% CI, 1.03–1.29), snoring (OR = 1.01; 95% CI, 1.00–1.01), and habitual drinking (OR = .52; 95% CI, .28–.95) reached a significant correlation (p < .05). This indicated that these variables were the main factors affecting OSA and that the older the age, the higher the risk of OSA, for each unit increase in age, the higher the risk of OSA by1.08 times. Also, the larger the neck circumference, the higher the risk of OSA; for each unit increase in neck circumference, the risk of OSA increases 1.15 times. The participants with a higher number of snoring instances had a higher risk of OSA; for every unit increase in snoring time, the risk of OSA increases 1.01 times. Finally, the OR value for habitual drinking was .52 and lower than 1, meaning that the risk of developing OSA was 0.52 times for participants who engaged in habitual drinking compared to those who did not.
Predictors for Different Severity Levels of OSA
Characteristics of the Participants by Obstructive Sleep Apnea Severity (n = 491).

Note. OSA: M ± SD (mean ± standard deviation) or count (percentage); NC: Neck circumference; WC: Waist circumference; Obstructive Sleep Apnea; CESS: Chinese Epworth Sleepiness Scale; DBP: Diastolic blood pressure; SBP: Systolic blood pressure; PSQI: Pittsburgh Sleep Quality Index; BMI: body mass index;*<.05, ***<.001.
Influencing Factors for Overweight and Obesity with Different Severities of Obstructive Sleep Apnea.
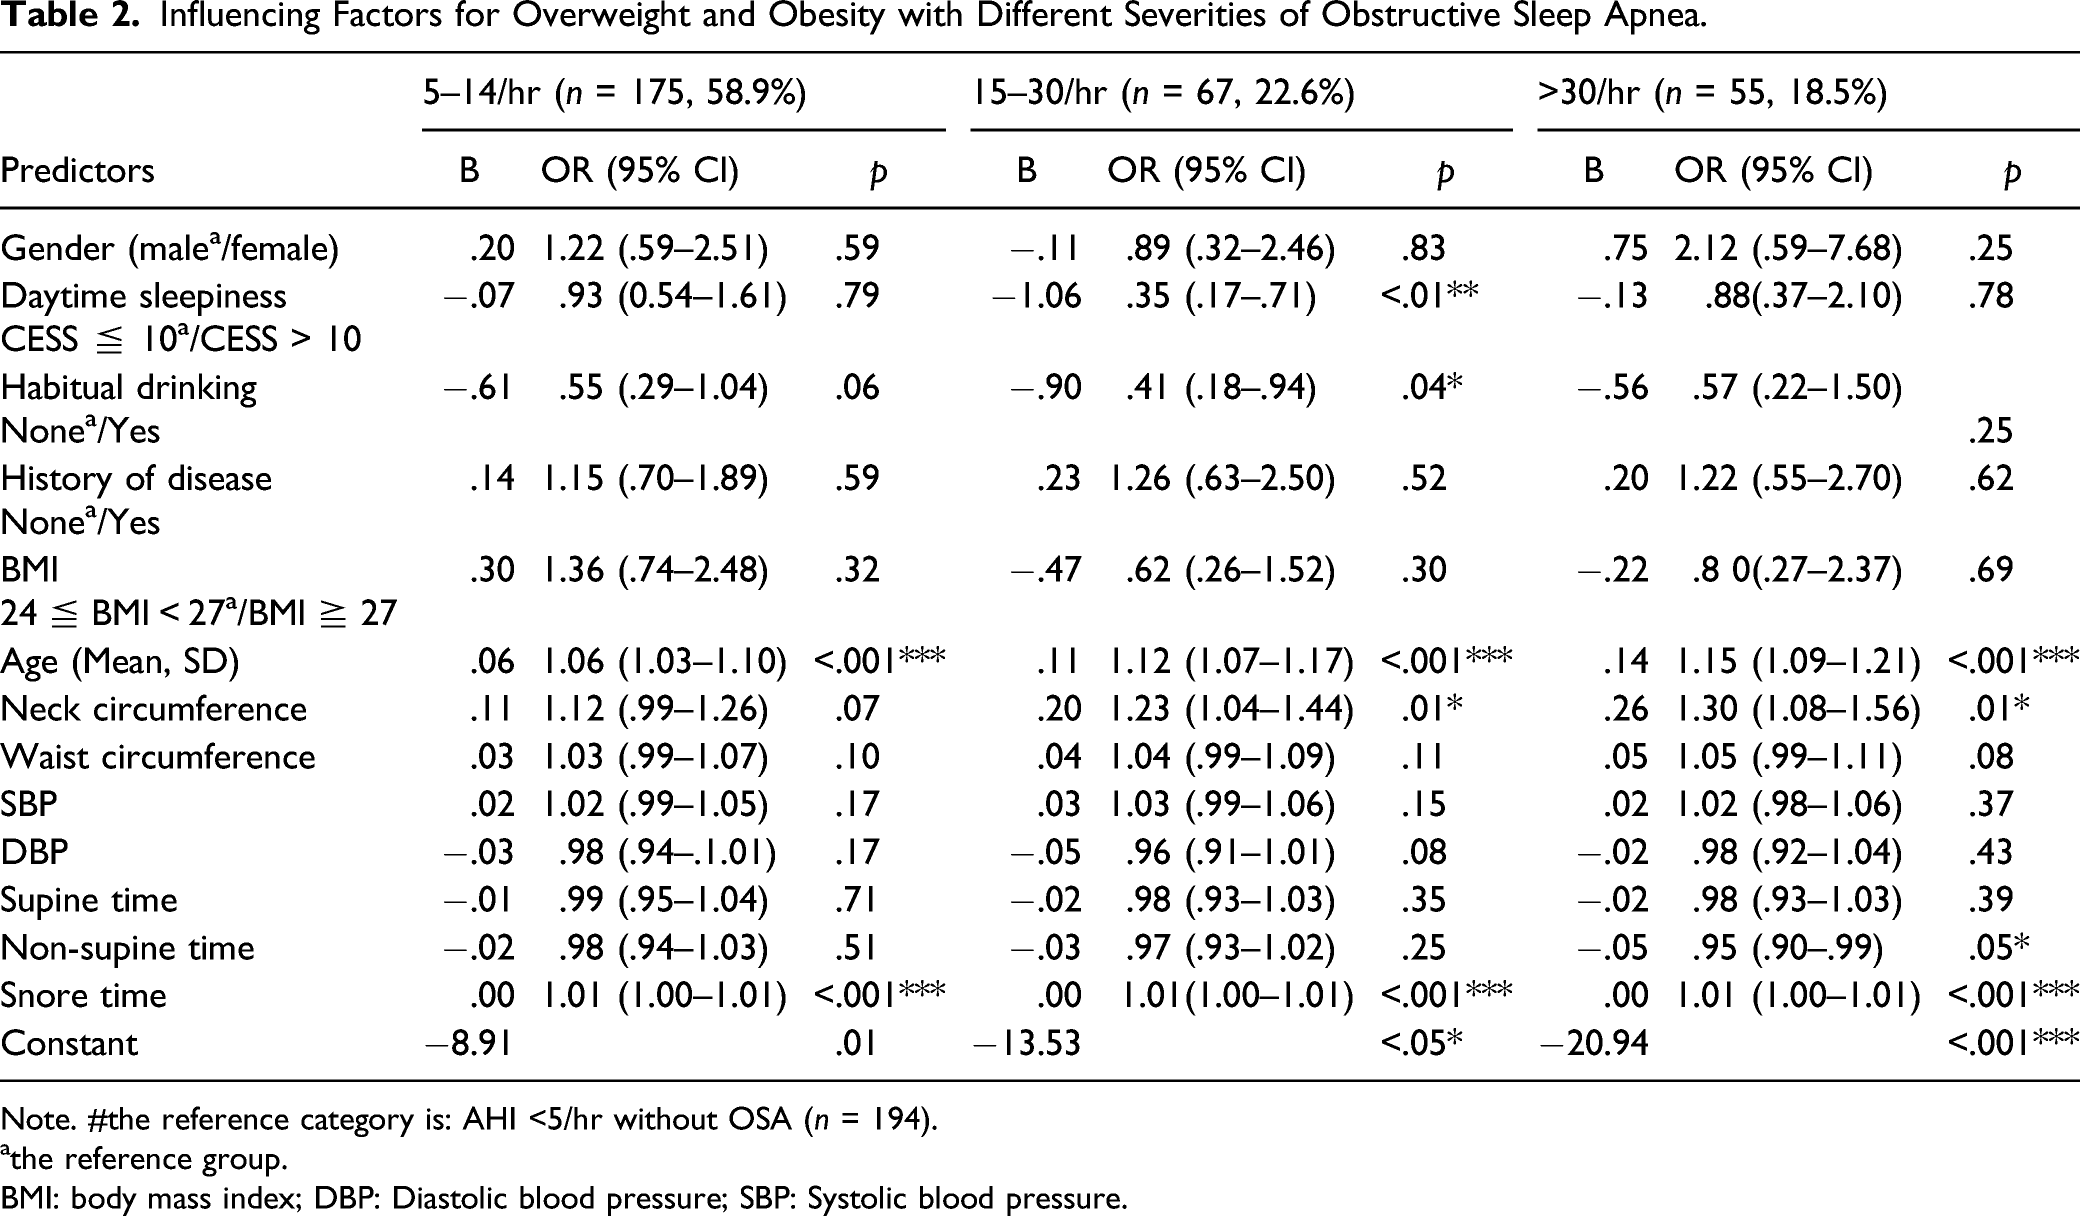
Note. #the reference category is: AHI <5/hr without OSA (n = 194).
athe reference group.
BMI: body mass index; DBP: Diastolic blood pressure; SBP: Systolic blood pressure.
Discussion
To our knowledge, this study was the first using a portable sleep monitor to investigate the status of OSA and its impact factors on overweight and obese employees in the high-tech industry. The results showed that OSA was detected in 60.5% of the participants, of which 58.9% had mild OSA and 41.1% had moderate or severe OSA. Currently, few studies investigated the prevalence of OSA for employees in different occupational fields. Professional drivers are in a high-risk group for OSA (Schwartz et al., 2017; Silva et al., 2021), the prevalence of OSA among drivers ranges from 26% to 41% (Schwartz et al., 2017). Another OSA screening for healthy employees in the workplace found a prevalence of 37% (Eijsvogel et al., 2016). The results of our study showed that the prevalence of OSA among employees in high-tech workplaces is higher than that found in previous studies on workplace employees. There are a number of reasons for this.
First, compared with healthy adults in the workplace, the participants in our study were all overweight and obese high-tech employees. This may have influenced the measurement values, echoing the results of many previous studies that have found that being overweight or obese are important risk factors for adult OSA (Dong et al., 2020; Nousseir, 2019). In addition, different OSA diagnostic criteria would affect the results. Our study defined the OSA standard based on AHI >5 events/hour, while some studies set greater than 15 events per hour as an indicator. Moreover, the use of different tools to detect OSA is another influencing factor. Relevant studies in the past mostly used questionnaires to collect subjective symptoms of OSA, such as snoring frequency or sleep apnea, which may underestimate real conditions such as snoring and hypopnea. Our study used an at-home portable monitor to detect sleep apnea or hypopnea and avoid reference bias in the information provided by patients or their relatives. The OSA status of the participants might be reflected more realistically. Another issue worthy of consideration is that AHI was automatically calculated by dividing the numbers of sleep apneas or hypopneas by the total recorded time through an at-home portable sleep monitor, whereas PSG obtained the calculated AHI based on the total time after the participant had fallen asleep. From this point of view, using an at-home portable sleep monitor could result in underestimating the results of AHI (Cheliout-Heraut et al., 2011). Namely, the prevalence rate of OSA should be higher for the high-tech industry employees in our study.
In our study 58.9% of high-tech employees were found to have mild OSA. Karhu et al. (2021) stated that if patients with long-term apnea do not receive treatments, their OSA would be aggravated by prolonged exposure to deoxygenation saturation concentration. A study on the natural evolution of apnea found that even if there is no increase in BMI, patients with mild to moderate OSA tended to develop severe OSA after an average of 17 months (Pendlebury et al., 1997). Leppänen et al. (2017) also echoed the finding that mild OSA could develop into a more serious situation over time. However, several studies pointed out that 80–90% of patients with OSA have not been diagnosed (Fietze et al., 2019). This highlights the need for health care providers and administrative directors who formulate health policies to face this public health issue and provide early screening for high-risk groups and effective management for OSA. These managements can improve different degrees of OSA, particularly mild OSA, to prevent derived multiple chronic diseases.
The results of our study showed that age, snoring, neck circumference, and drinking habits are important factors affecting the development of OSA in overweight and obese employees. Some empirical studies have shown that age and OSA are significantly and strongly correlated (Fietze et al., 2019; Leppänen et al., 2017). Our study found that age is significantly correlated with both the susceptibility of and the severity of OSA, which is consistent with the results of most previous studies. OSA occurs more frequently in people over the age of 40 and it has a high prevalence in men aged 45–64 years and women over 65 years of age (Leppänen et al., 2017). Fietze et al. (2019) targeted 1264 adults between 20 and 81 years of age for OSA-related research and provided a one-night PSG test. They also found that the incidence of OSA in participants aged 60 years old or older is significantly higher than that in those under 60 years of age. Additionally, Leppänen et al. (2017) pointed out that the duration of apnea increases with age for mild and moderate OSA. The results of our study are consistent with the above studies. The average age of the participants with mild, moderate, and severe OSA is 37.1, 40.5, and 41.1 years old, respectively. The related physiological mechanism could be explained as follows. The sensitivity of oxygen and CO2 ventilation decreases with age, and this phenomenon would increase the duration of airway obstruction. In addition, as people age, the changes in upper respiratory tract nerves and muscles also increase the severity of airway obstruction (Leppänen et al., 2017). In contrast, a study has stated that OSA has a non-linear relationship with age and that the prevalence reaches the highest peak at about 65 years of age, after which it stabilizes or even declines (Huang et al., 2018).
It is worth noting that the average age of the participants who were screened for OSA in our study was 38.6 years old. Compared with the results of previous related studies, we found a relatively young age of incidence age. This may have occurred because the population involved in previous studies were mostly middle-aged and elderly people. In contrast, participants of our study worked in the high-tech industry, their age group was younger than that of employees in other industries, yet they all had a BMI >24 kg/m2, and 38.4% (n = 114) of the participants had chronic diseases. These conditions could explain the high risk of OSA when the participants were still young, and some employees do not have OSA-related knowledge. Workplace supervisors need to be more sensitive to the trend of younger OSA groups and pay attention to this issue.
Snoring is another important factor affecting OSA and is significantly associated with different OSA severities in our study. About 90% to 95% of OSA patients experience snoring. Habitual snoring is considered a precursor of OSA and a significant risk factor for OSA (Rodrigues et al., 2010). There was a high chance of people experiencing loud snoring to develop moderate to severe OSA (Rodrigues et al., 2010). As the frequency of snoring intensity augmented, the AHI gradually increased. The results of our study were similar to those in the above research. With a higher frequency of snoring, the AHI score was higher and the OSA was more severe. Our study used an at-home sleep device to detect the frequency of snoring but did not use a snoring detector (decibels) to detect the intensity of snoring. Therefore, it did not analyze the relationship between snoring intensity and OSA or determine the cut point of OSA for snoring intensity. These perspectives could be analyzed in future research.
Studies have confirmed that anthropometric data such as neck circumference (NC), waist circumference (WC), and waist-to-hip ratio (WHR) are related to OSA (Cho et al., 2016; Nousseir, 2019; Tom et al., 2018). Cho et al. (2016) conducted a systematic review and included 2966 adults to discuss differences in race, OSA, and obesity-related characteristics. The results indicated that OSA may not be related to BMI, WC, or WHR; only NC was strongly associated with OSA, and no difference was found between Asians and Caucasians. In addition, Tom et al. (2018) explored the association between WC, NC and OSA among 59 OSA patients. The results of Tom’s study revealed that besides BMI as a risk factor affecting OSA, the WC and NC are more correlated with the severity of OSA compared with BMI in OSA subjects. We also found that NC was significantly associated with AHI. Participants with more severe OSA tended to have a larger neck circumference, with average neck circumferences of 40.11 cm, 41.01 cm, and 42.64 cm for cases of mild, moderate, and severe OSA, respectively. Our result is consistent with Ahbab et al. (2013), who found that the NC with severe OSA is significantly higher than that of patients with non-severe OSA. Ahbab et al. concluded that NC is an independent risk factor for severe OSA and confirmed that the neck circumference is a more representative indicator for OSA risk assessment.
Drinking is another important risk factor for OSA, and it aggravates the severity of OSA and prolongs the duration of apnea (Choi et al., 2016; Simou et al., 2018). Drinking reduces the genioglossal muscle tension and causes the patient’s upper respiratory tract to collapse easily, thus increasing the resistance of the upper respiratory tract airflow (Simou et al., 2018). The timing of drinking and habitual excessive drinking are the main keys to increasing the risk of or exacerbating OSA. Compared with people who do not drink alcohol or only drink small amounts of alcohol, alcoholics are 25% more likely to develop OSA (Choi et al., 2016; Simou et al., 2018). Choi et al. (2016) pointed out that after adjusting for age, AHI, and BMI, light and heavy drinkers have 2.06 and 2.11 times the risk of developing severe OSA compared with non-drinkers.
The evidence that drinking affects the risk of OSA is still inconsistent. A small number of studies have found no association between drinking and the risk of OSA (Simou et al., 2018). Simou et al. (2018) conducted a systematic review and meta-analysis related to alcohol consumption and OSA, the results showed that the average intake of alcohol per week for patients with OSA was higher by 2 units per week, which was not statistically significant compared with those without the habit of drinking. Heavy drinking (equivalent to a blood concentration >0.075 g/dl) significantly aggravates OSA, while the negative impact of lower concentrations (0.5–1.0 kg/body weight) on OSA is unclear (Choi et al., 2016). The results of our study showed that drinking is significantly negatively related to OSA and the risk of moderate OSA, which is inconsistent with previous research results. However, the drinking time, volume, frequency, or type of alcohol were not examined in our study. The data were only collected by self-reporting questionnaires, and the lack of objective evaluation criteria for drinking habits may have limited the interpretation of the results. Further rigorous research is needed on whether drinking a small number of low-alcohol drinks one hour before going to bed can reduce the risk of OSA. Future studies can define alcohol intake more clearly and use standardized measurements to analyze the correlation between drinking and OSA and develop effective treatment strategies.
The results of our study also found that sleeping position was an important factor affecting severe OSA, which was similar to the findings of many previous studies on the correlation between sleeping positions and OSA (Eiseman et al., 2012; Menon & Kumar, 2013). In a cephalometric study, Menon and Kumar (2013) pointed out that when OSA patients lie in supine position, the uvular width increases to shorten the distance between the uvula and the wall of the pharynx, which narrows the retroglossal breathing channel, decreases the lung capacity, and increases the upper airway resistance. Our study found that participants with severe OSA, the average percentage of lying on the side was significantly negatively correlated with OSA (OR = .95; 95% CI = .90–.99; p = .05). In other words, when the patients lay longer on their side, their AHI score tends to be lower. This result is consistent with De Vrie et al. (2015), who suggested that changing the sleeping position to lying on the side is a simple and feasible strategy for reducing AHI, especially for patients with mild to moderate OSA. As many as 81.5% of our participants were found to have mild to moderate OSA, thus, providing related preventive strategies such as providing relevant information about lying on the side, might prevent the patients’ development of severe OSA.
Many empirical studies confirmed that obesity and OSA are strongly correlated, and that BMI is an important risk factor affecting OSA (Dong et al., 2020; Nousseir, 2019). Surprisingly, our study found that BMI and OSA were not statistically significantly associated, which was inconsistent with the findings of many previous studies. The possible reasons are as follows. First, one empirical study indicated that more than 50% of people with a BMI >30 kg/m2 have concomitant OSA, of which 25% have severe OSA (Nousseir, 2019). In our study, 75.1% of the participants had a BMI between 24 kg/m2 and 29 kg/m2, and the participants with a BMI >30 kg/m2 accounted for 24.9%. Compared with previous related studies, the average BMI of the participants was low, which may have affected the significance of the association with OSA. Additionally, the uniqueness of ethnic anatomies, such as craniofacial abnormalities or jaw recession, is also an important key to assessing the risk of OSA (Jehan et al., 2017). Research on the relationship between race and OSA has shown that compared with Caucasians, most East Asian people are non-obese but have severe OSA, and it has been revealed that the Asian ethnic group has a high prevalence of OSA. This difference may be because the mandibles of many East Asians are more protruding. Therefore, obesity may not be the main risk factor for OSA in many Asians. Along with the above conclusions, the OSA-related symptoms of many Asian patients may be ignored if they are not obese. This could lead to an increase in undiagnosed OSA (Lam et al., 2007).
The results of our study found that sleep quality was not significantly associated to OSA, which is inconsistent with work by Sasaki et al. (2013). A possible reason is that, although more than half (58%) of the participants in our study reported poor sleep quality, the average PSQI score of those without OSA was 6.31, and the average PSQI score of those with OSA was 6.83. The poor sleep quality of these people was mild, and there was no significant difference. Moreover, the sleep information was taken from the questionnaire and could not truly reflect the events during the sleep process, such as sleep fragments caused by the interruptions to breathing. This may have caused the reality of poor sleep to be underestimated. Furthermore, general sleep disturbances often occur in the age group greater than 40 years old. Our participants were young and may not have shown the correlation between sleep quality and OSA. However, it is worth noting that many participants stated they went to bed at 1–2 am every night and stayed on their smartphones for an average of 30–60 min before going to sleep. These overweight and obese high-tech employees lacked and ignored sleep hygiene. Poor sleep can derive OSA, cause sleep disruptions, and increase appetite, weight, and the severity of OSA (Nousseir, 2019). Health care providers should thoroughly evaluate the negative impact of this vicious circle and provide improvement strategies.
Excessive daytime sleepiness (EDS) was not significantly associated with OSA in our study; however, there was a significant correlation between moderate OSA and EDS, which is inconsistent with the findings of many studies. Lang et al. (2017) pointed out that EDS is significantly associated with OSA and is a common and important symptom of OSA patients seeking medical advice. However, although EDS is one of the important symptoms for identifying OSA, the incidence of EDS is low in the evaluation of EDS for people with OSA, as only 13% of them complain of daytime sleepiness (Fietze et al., 2019). The CEDS was used to examine the EDS of the participants in our study. Overall, 28.7% of the participants reported EDS, while 31% of the participants with OSA complained of EDS. Some researchers have questioned the sensitivity of the CEDS in evaluating OSA. For example, when different genders are evaluated, it is necessary to consider the deviations caused by their physiological differences, such as women’s EDS due to cycle changes. Therefore, although EDS is widely used in various fields to examine excessive daytime sleepiness, it is unsuitable for detecting EDS derived from OSA (Fietze et al., 2019). More sensitive and specific scales are needed to provide objective physiological measurements to detect EDS status more accurately.
Study Limitations
Several limitations in our study should be considered. First, the cross-sectional with descriptive study design was unable to establish the inference of causalities. Further longitudinal studies are encouraged to elucidate the differences between the variables of OSA and the trends in their changes among overweight employees in the high-tech industry. Second, since our participants were recruited from one large-scale electronics industry, the results of our study might not be a generalization of the entire overweight employee population working in high-tech industries. Finally, self-reporting for sleep situations might lead to inaccurate date for certain key information such as actual total sleep duration or waking times. For future studies it is recommended to use simple objective measurement tools to examine more sleep dimensions during sleep.
Conclusions
In our study, an at-home portable sleep monitor was used to examine the status of OSA in undiagnosed overweight and obese employees. More than 60% of the overweight and obese high-tech workplace employees were found to have OSA, of which approximately 81.5% had mild to moderate OSA. We found that age, neck circumference, snoring, and drinking were important risk factors for predicting OSA in overweight and obese high-tech employees. In addition, age and snoring showed a significant correlation in predicting OSA of different severities. OSA has become a public health challenge that cannot be underestimated; OSA is a preventable disease, the healthcare administrator should actively educate and promote OSA-related information for employees in the workplace, promote high-risk OSA groups to adopt screening based on at-home sleep breathing apparatus instead of the self-reporting questionnaire, and construct and provide an appropriate OSA care model.
Footnotes
Acknowledgments
We would like to thank all those who participated in this study.
Declaration of Conflicting Interests
The author(s) declared no potential conflicts of interest with respect to the research, authorship, and/or publication of this article.
Funding
The author(s) disclosed receipt of the following financial support for the research, authorship, and/or publication of this article: This study was funded by the Ministry of Science and Technology, ROC (MOST 108-2314-B-255-005).
Authors Contributions
Study design: HCH, MHL and CNH; data collection and analysis: PRH and MHL; and manuscript preparation: HCH, MHL, CNH.
