
Abstract
Background:
Previous studies on different periacetabular osteotomy approaches for correction of hip dysplasia disagree on the time course of normalisation of muscle function postoperatively, some stating that especially hip flexor function is not fully normalised after 12 months.
Purpose:
The purpose of this study was to evaluate hip function during walking before, and 6 and 12 months after minimally invasive periacetabular osteotomy.
Methods:
Using conventional 3D inverse dynamics followed by static optimisation, we calculated hip net joint moment and angular impulse, as well as individual muscle forces and hip joint contact force, during walking for 32 patients with hip dysplasia and 32 matched controls.
Results:
None of the extensor and abductor measures were significantly different between controls and patients tested preoperatively, nor between any of the 3 time points patients were tested. For all of the flexor measures, patients’ preoperative values were lower than controls’, but had increased to values above the controls 6 months postoperatively.
Conclusion:
Hip muscle function during walking seemed normalised after 6 months after minimally invasive periacetabular osteotomy, while joint contact force did not fully normalise until 12 months postoperatively, perhaps because the hip joint structures need a longer time to heal than the muscles and a potential pain alleviating strategy was still in effect.
Trial registry:
Movement pattern in patients with hip dysplasia https://clinicaltrials.gov/ct2/show/NCT01344421, NCT01344421.
Introduction
Hip dysplasia is characterised by reduced acetabular coverage of the femoral head,1,2 and has been associated with pain and the development of early secondary osteoarthritis.3–5
Surgical procedures comprising different pelvic osteotomies have been developed for treatment of hip dysplasia, e.g.6–9 but in the last 20 years, the Bernese periacetabular osteotomy (PAO) has been the preferred procedure. 10 Several of the developed approaches for the Bernese PAO, including the most frequently used modified Smith-Petersen iliofemoral approach, require fairly extensive incisions and may require dissection of entire muscle insertions.11–17 However, in 2003 a minimally invasive, trans-sartorial approach was developed with the objective to minimise soft tissue damage. 2
The clinical and functional outcome of PAO is routinely assessed radiologically and by various hip questionnaires.16–22 While the latter might address both pain and gait function, the assessment is subjective, hence a more objective, functional assessment in the form of biomechanical gait analysis is warranted. 23 Several gait analysis studies have been conducted in patients with hip dysplasia,1,9,18,19,23–26 but only 3 PAO studies have been longitudinally designed with comparisons of analysis results obtained pre- and postoperatively (Table 1).
Results from previous preoperative-postoperative studies applying gait analysis.
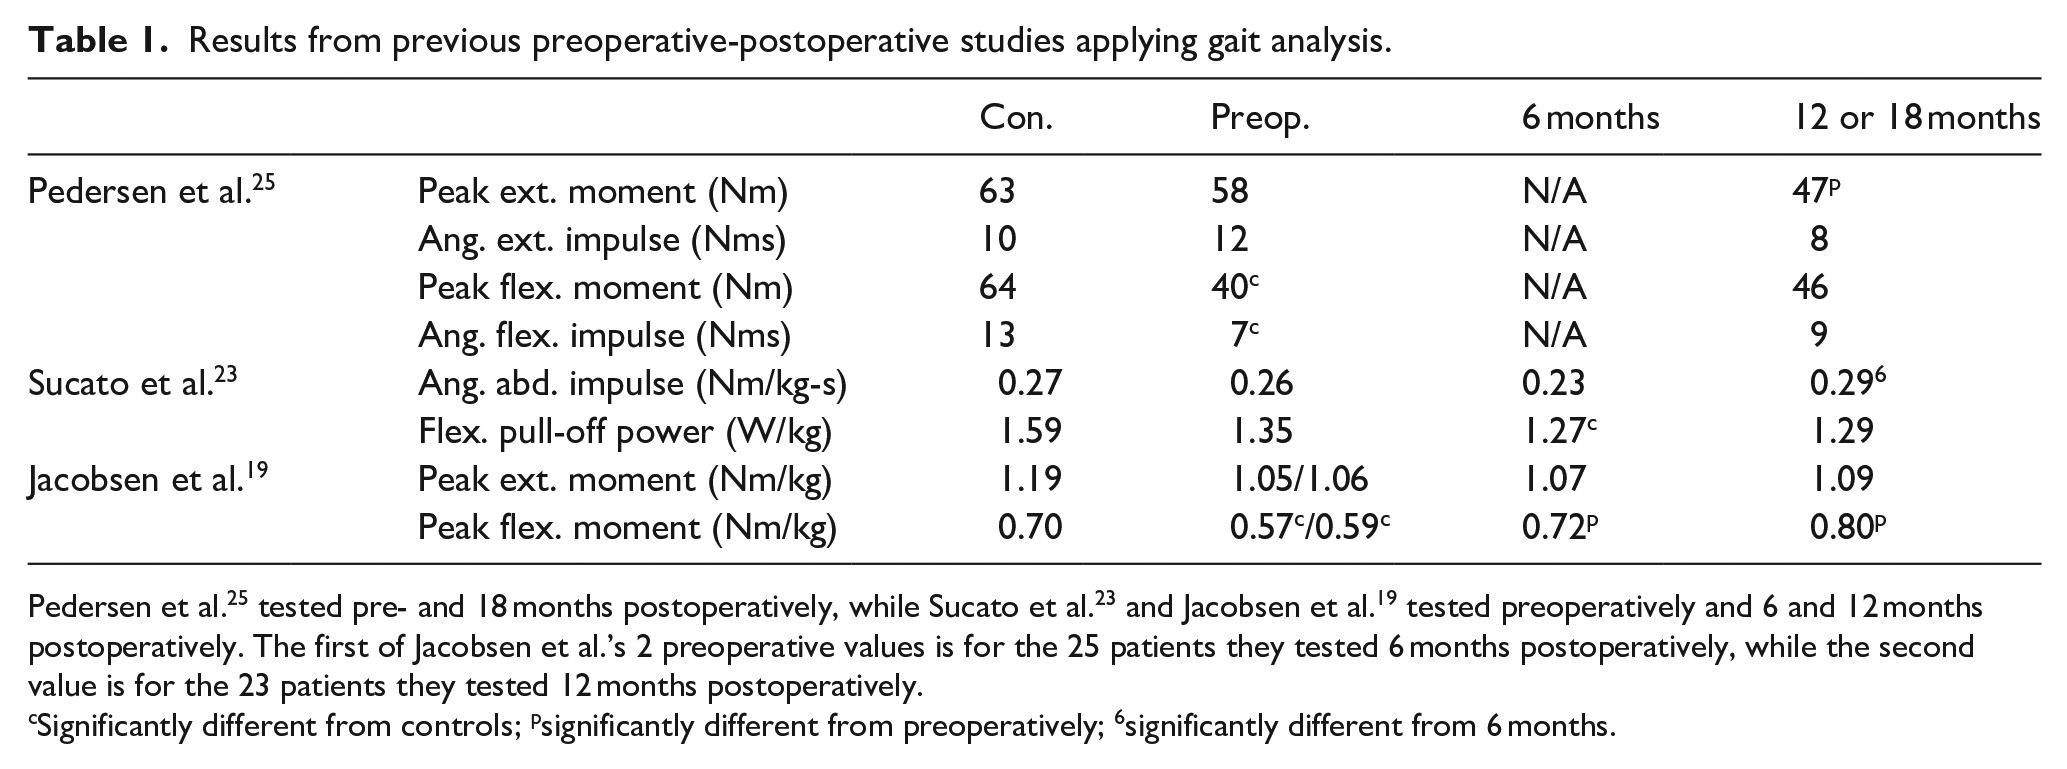
Pedersen et al. 25 tested pre- and 18 months postoperatively, while Sucato et al. 23 and Jacobsen et al. 19 tested preoperatively and 6 and 12 months postoperatively. The first of Jacobsen et al.’s 2 preoperative values is for the 25 patients they tested 6 months postoperatively, while the second value is for the 23 patients they tested 12 months postoperatively.
Significantly different from controls; psignificantly different from preoperatively; 6significantly different from 6 months.
In these 3 studies, the minimally invasive approach was used by Pedersen et al. 25 and Jacobsen et al., 19 while the modified Smith-Petersen approach was used by Sucato et al. 23 While Pedersen et al. 25 and Jacobsen et al. 19 only analysed the sagittal plane (flexion-extension), Sucato et al. 23 conducted a full, 3D analysis in order to also evaluate hip abductor function. Pedersen at al. 25 and Sucato et al. 23 concluded that hip function during walking was not fully normalised at 12 months (18 months in Pedersen et al.’s study) postoperatively, while Jacobsen et al. 19 concluded it was.
By extending inverse dynamics analysis with static optimisation, the individual muscle forces creating the moments can be estimated, which subsequently allows estimation of the joint contact force, i.e. the magnitude and direction of the compressive force between the femoral head and the acetabulum. 27 In an extended 3D analysis of this kind, using the preoperative data from Jacobsen et al., 18 we recently found lower joint contact force in patients compared to controls, and speculated it was a compensatory mechanism perform by the patients to alleviate pain. 24
It could be speculated that the minimally invasive PAO approach allows for a faster rehabilitation secondary to decreased soft tissue damage of the hip flexor muscles compared to the more common approaches. Thus, the purpose of this follow-up study was to compare the preoperative muscle and joint contact forces, 24 and at 6 and 12 months postoperatively in the same patients to reveal possible muscle activation changes underlying the joint moment changes previously observed postoperatively by Jacobsen et al. 19 (Table 1). We hypothesised that the differences in muscle activations and joint contact force between patients and controls we observed preoperatively would be normalised at 6 months postoperatively. 24
Methods
Subjects
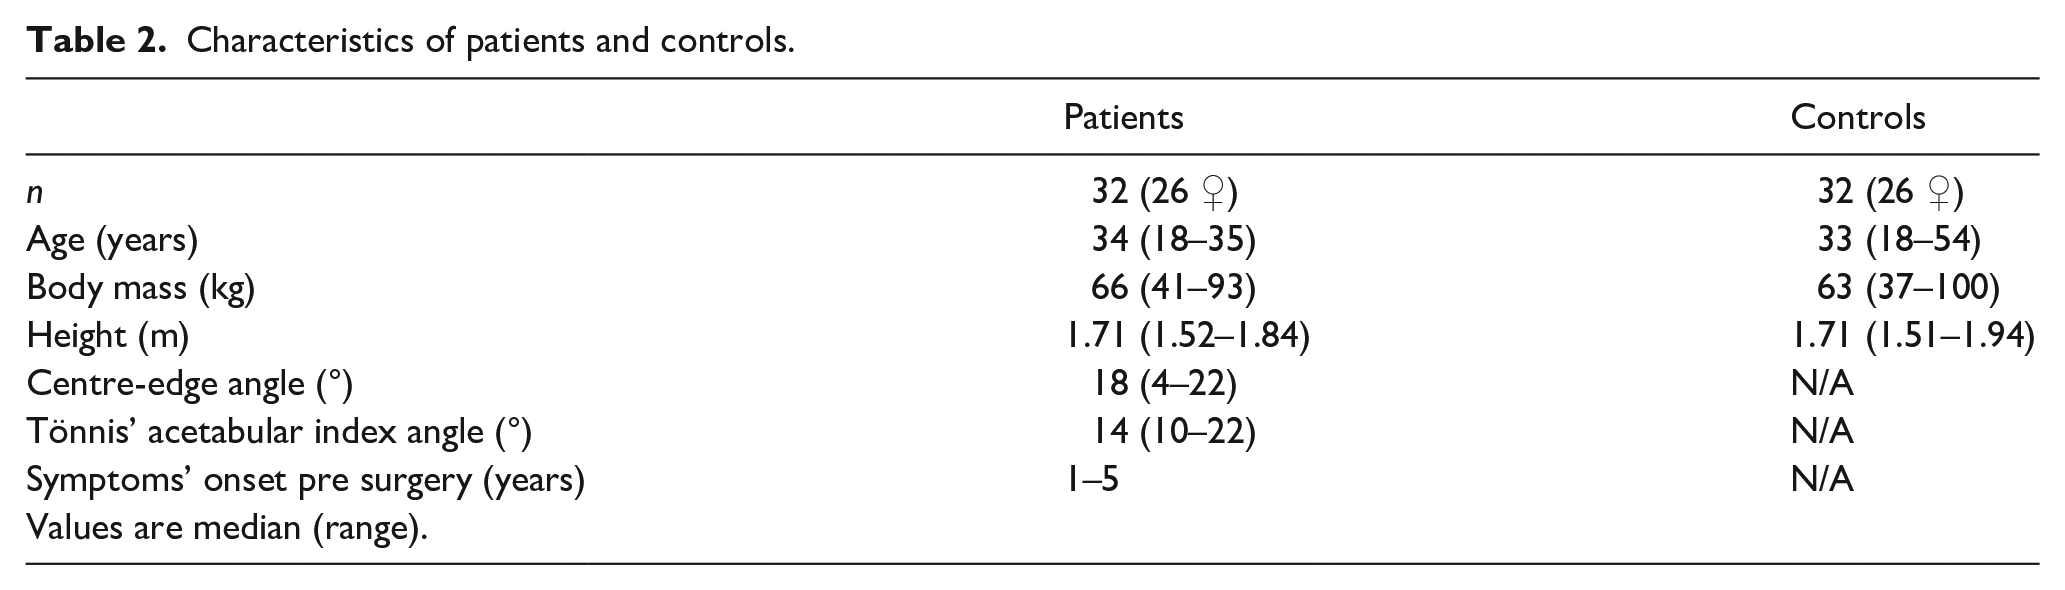
The subjects are described in detail in Jacobsen et al. 18 In short, 32 patients (26 women), scheduled for minimally invasive PAO, and 32 matching controls were included (Table 2). The patients were diagnosed with unilateral or bilateral hip dysplasia, indicated radiologically by a centre-edge angle <25° and subjectively by hip pain and functional limitations revealed by detailed questionnaires.15,18 All subjects gave informed consent prior to participation. The study adhered to the Declaration of Helsinki and was approved by the Central Denmark Region Committees on Biomedical Research Ethics (M-20100206) and the Danish Data Protection Agency. The study was registered at ClinicalTrials.gov (NCT01344421).
Characteristics of patients and controls.
Motion capture
The motion capture is described in detail in Jacobsen et al. 18 In short, all subjects performed several barefoot walking trials on an 8-m walkway instrumented with 8 MCU-1000 ProReflex cameras (Qualisys, AB, Gothenburg, Sweden) and an OR6-7 AMTI force plate (Advanced Mechanical Technology, Watertown, MA, USA) concealed by a thin carpet to prevent subjects from unintentionally altering their gait in order to strike the plate. Motion and force data were sampled at 240 Hz and 960 Hz, respectively. Trials were repeated until at least 3 clean force plate hits with either foot were recorded. All trials were performed with bare feet. Automatic tracking was facilitated by 38 reflective markers placed on anatomical landmarks or as clusters on rigid plates on pelvis and lower extremities. The camera system was calibrated to residual errors less than 2.5 mm over a recording volume of approximately 3 ×1 × 1.3 m (L × W × H).
Gait analysis
We used the raw data from Jacobsen et al., 18 but to enable more elaborate comparisons with Pedersen et al. and Sucato et al., we conducted a full, 3D analysis and calculated all peak moment, angular impulse and power measures as previously reported in those studies (Table 3). The gait analysis is described in detail in Skalshøi et al. 24 In short, motion and force data were analysed in OpenSim 3.2, 28 using the built-in Gait 2392 musculoskeletal model with lower extremities, pelvis and torso and 92 lower extremity muscles (Figure 1). The model was scaled to match the size and strength of each individual subject based on marker measurements and bodyweight. Joint angles and moments were calculated using OpenSim’s inverse kinematics and inverse dynamics tool, respectively. Individual muscle forces were calculated using OpenSim’s static optimisation tool, which minimises the sum of squared activations while being constrained by muscle force-velocity and force-length properties. Muscle forces were then used to calculate joint contact forces. Kinematic results were lowpass filtered at 6 Hz cut-off before applying the inverse dynamics and static optimisation tools, using OpenSim’s 3rd order Butterworth filter. Median values from all successful trials for each patient’s leg scheduled for operation and a random leg from each control for the whole gait cycle were used to calculate mean curves for each group. Joint moments were normalised to body mass, while muscle and joint contact forces were normalised to body mass2/3 (Jaric, Ugarkovic and Kukolj, 2002). Parameters used for further statistical analyses were peak values for moments, angular impulses, flexor pull-of power (flexor moment multiplied by joint angular velocity at toe-off) and muscle forces as well as peak joint contact force and its direction at the instant of peak magnitude.
Hip joint moments, angular impulses and power in patients and controls measured preoperatively and 6 and 12 months postoperatively.
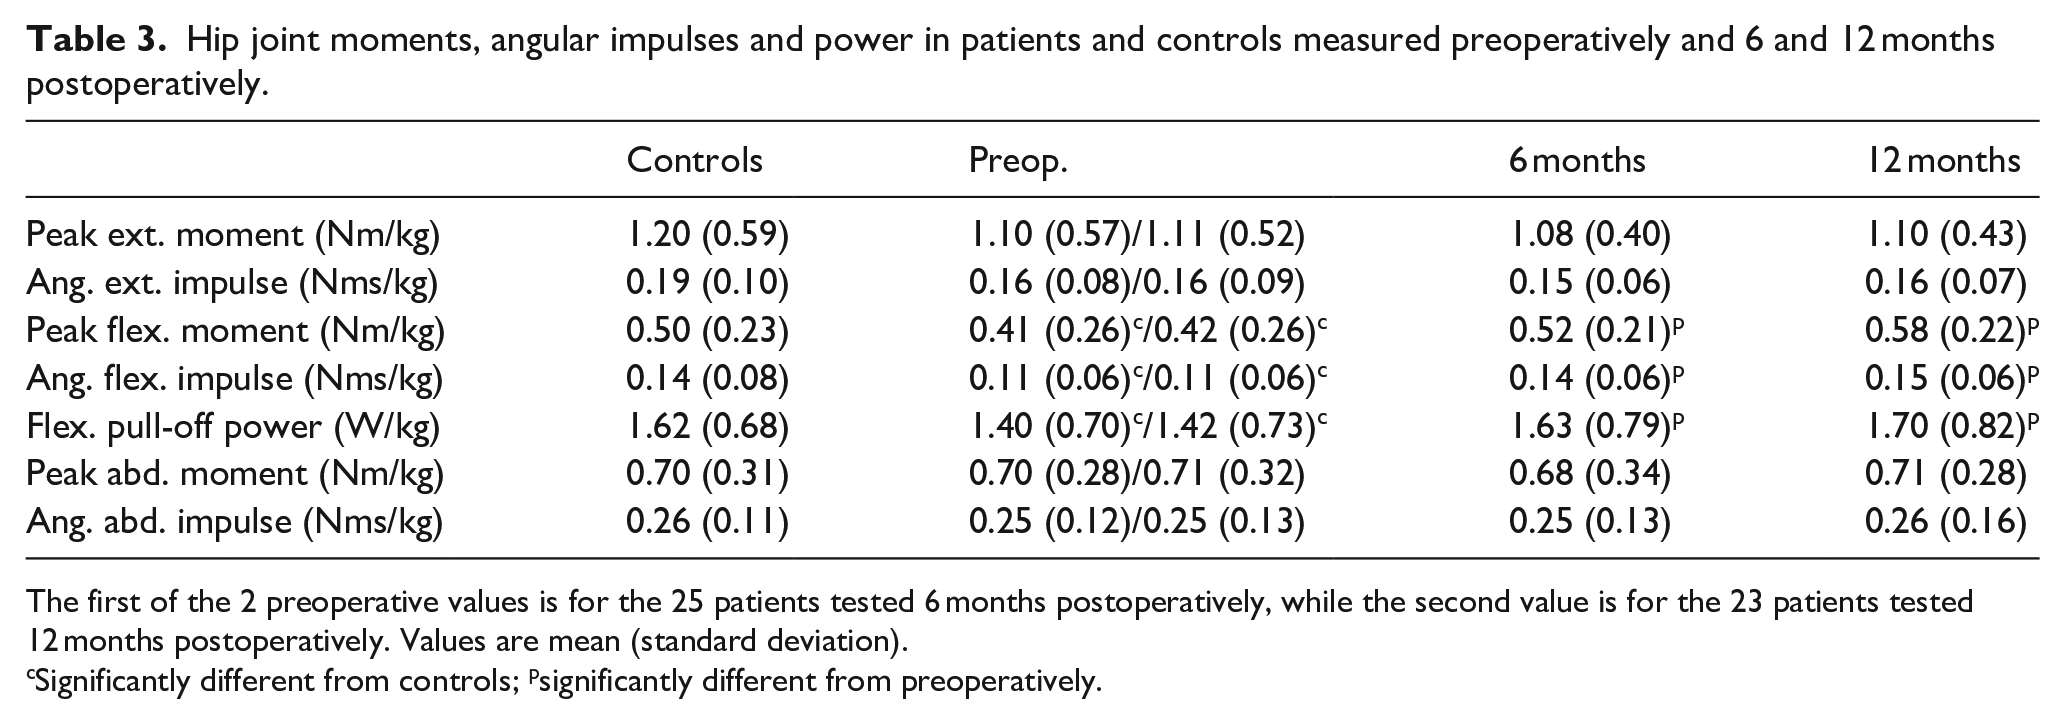
The first of the 2 preoperative values is for the 25 patients tested 6 months postoperatively, while the second value is for the 23 patients tested 12 months postoperatively. Values are mean (standard deviation).
Significantly different from controls; psignificantly different from preoperatively.
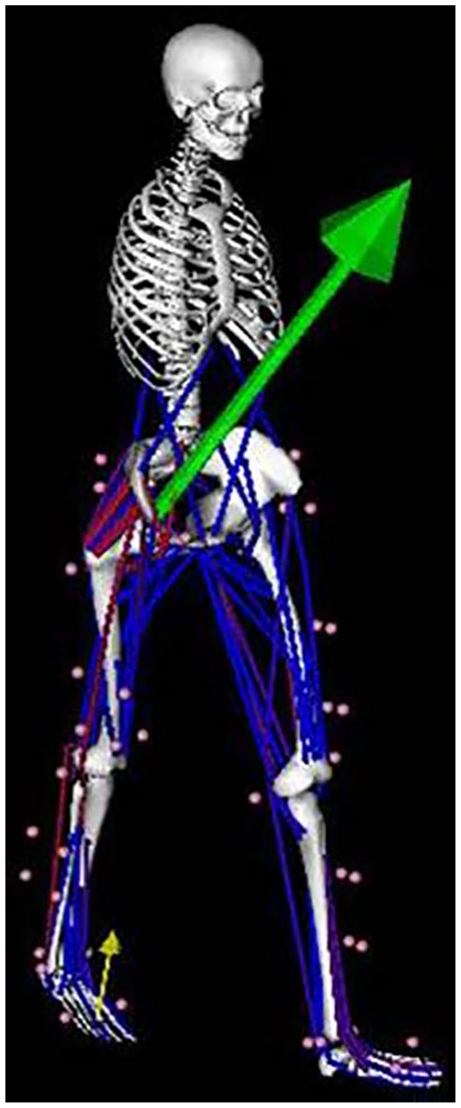
OpenSim model of a representative subject at the instant of maximal joint contact force (green vector), occuring 52% into the gait cycle (propulsion phase shortly before toe-off).
Surgery and rehabilitation
A detailed description of the minimally invasive PAO approach can be found in Troelsen et al. 2 Patients were hospitalised for a median of 3 days where they were introduced to a standardised rehabilitation programme. During the first 6–8 weeks they were allowed to perform partial weight-bearing starting with a maximum load of 30 kg. After 6–8 weeks, patients were allowed to walk with full weight-bearing. In addition, the patients performed physiotherapist-supervised training twice a week for 6 weeks, starting 6 weeks after surgery. The rehabilitation programme focused on strength and stability training and normalisation of walking.
Statistics
Data were tested for normality by the Shapiro-Wilk test. Differences between controls and each of the patient test times were tested with 1-way ANOVA when normally distributed, otherwise with 1-way-ANOVA on ranks. Differences between patient test times were tested with 1-way ANOVA with repeated measures (RM) when normally distributed, otherwise with 1-way ANOVA RM on ranks. When applicable, pairwise comparisons were tested with Tukey’s honestly significant difference test. Alpha level for all tests was 0.05. Statistical calculations were performed using SigmaPlot 12.5 (Systat Software, Inc., San Jose, CA, USA).
Results
Of the 32 patients tested preoperatively, 7 declined to participate in the 6 months postoperative test and further 2 declined 12 months postoperatively. 19 Thus, the statistical comparisons between controls and patients preoperatively are based on 32 patients, while the pairwise statistical comparisons between patients preoperatively and 6 months postoperatively are based on 25 patients, and the pairwise comparisons including the 12 months postoperative test are based on 23 patients. All statistical tests had power >0.83.
Table 3 shows peak hip joint moments and impulses in 3D and flexor pull-off power. None of the extensor and abductor measures were significantly different between controls and patients tested preoperatively, nor between any of the 3 times patients were tested. For all of the flexor measures, patients’ preoperative values were lower than controls’, but had increased to values above controls’ already 6 months postoperatively.
Table 4 shows peak muscle forces and joint contact force and direction at the instant of peak force. With the exception of the rectus femoris muscle, the peak force in all the pure hip flexors, i.e. muscles with only flexor function at the hip, had increased significantly above preoperative level already 6 months postoperatively.
Muscle and joint contact forces in patients and controls measured preoperatively and 6 and 12 months postoperatively.
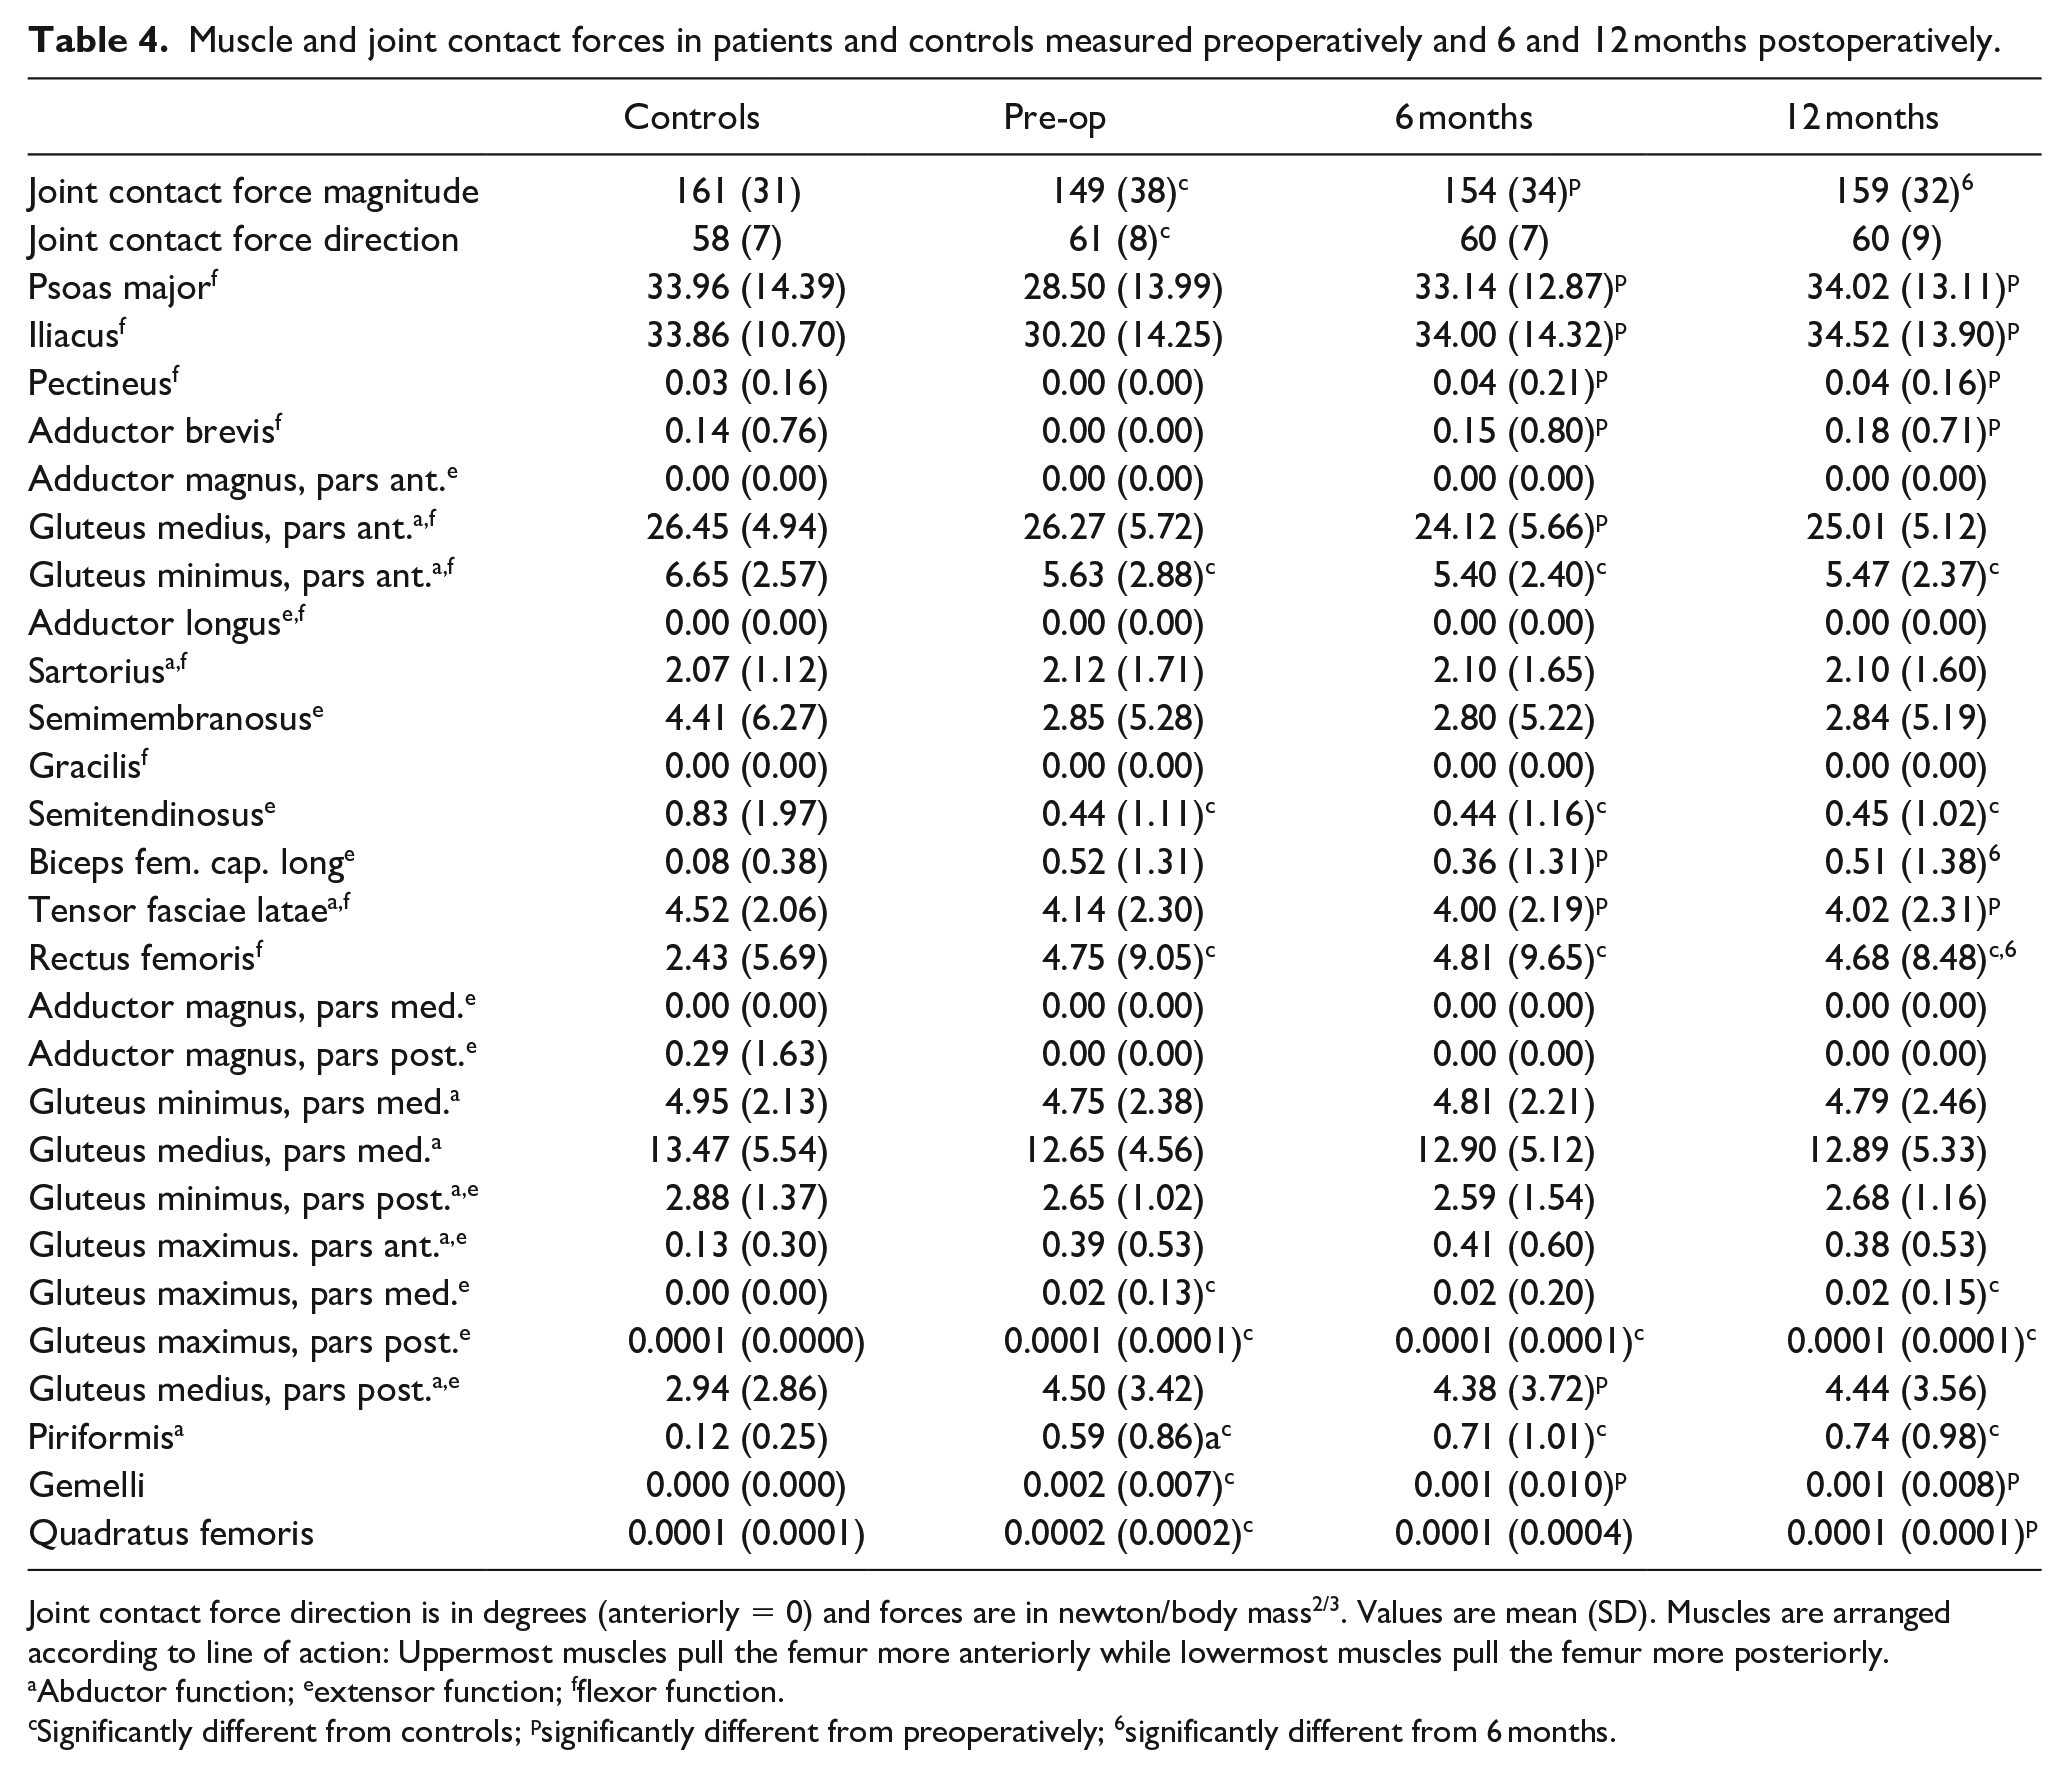
Joint contact force direction is in degrees (anteriorly = 0) and forces are in newton/body mass2/3. Values are mean (SD). Muscles are arranged according to line of action: Uppermost muscles pull the femur more anteriorly while lowermost muscles pull the femur more posteriorly.
Abductor function; eextensor function; fflexor function.
Significantly different from controls; psignificantly different from preoperatively; 6significantly different from 6 months.
The joint contact force had increased significantly from pre- to 6 months postoperatively and again from 6 to 12 months postoperatively.
Discussion
The purpose of this follow-up study was to compare the preoperative muscle and joint contact forces to the 6 and 12 months postoperative values in the same patients with the hypothesis that the differences in muscle activations and joint contact forces between patients and controls would be normalised 6 months postoperatively.
Muscle forces
We found no differences in neither extensor nor abductor measures, which – similarly to our net joint flexor measures – is corroborated by force data from the respective muscles. These results are partly in agreement with Pedersen et al. 25 and Sucato et al., 23 respectively. Pedersen et al. 25 found the peak extensor moment to be lower 18 months postoperatively while angular impulse was unchanged. Sucato et al. 23 found a non-significant reduction in peak abductor moment 6 months postoperatively, that was normalised 12 months postoperatively.
The earlier normalisation in muscle function compared to previous studies, especially with respect to the hip flexors, can be a result of the minimally invasive approach causing less soft tissue trauma compared to the more conventional Smith-Petersen approach. Although the minimally invasive approach was also investigated by Pedersen et al., 25 their result might be influenced by the surgical approach being newly developed at the time of their study. The extensor muscles are not affected at all and the abductor muscles only to a minor extent during PAO. One of the advantages of the original Bernese PAO over earlier methods was the abductor muscle sparing, 10 so the slight reduction in extensor and abductor function observed postoperatively by Pedersen at al. 25 and Sucato et al., 23 respectively, could result from an overall lower activity level caused by the more seriously affected hip flexors. As hip flexor function in our study was reduced for shorter time postoperatively compared to the studies by Pedersen et al. 25 and Sucato et al., 23 such a reduction in level of physical activity would have been of similarly shorter time, thereby possibly explaining why extensor and abductor function seemed completely unaffected in our study. However, although both Pedersen et al., 25 Sucato et al. 23 and we emphasised early weight-bearing and other muscle strengthening rehabilitation activities, we cannot rule out that the observed normalisation time differences were caused or at least influenced by rehabilitation differences.
Our net joint results were in general of comparable magnitudes to those reported by Pedersen et al. 25 and Sucato et al. 23 ; our slightly higher flexor and extensor measures can be explained by our patients’ slightly higher walking speed (1.4 m/s compared to 1.25 m/s in Pedersen et al. 25 and 1.3 m/s in Sucato et al. 23 ). However, our results differed from these previous studies with respect to development over time, most notably the 3 flexion measures, which in our study were all normalised already after 6 months. This is in contrast to Sucato et al., 23 who found patients’ flexion pull-off power to be lower than controls’ at all testing times, although only statistically significant 6 months postoperatively. Since Pedersen et al. 25 found lower peak flexor moment and angular flexion impulse at their 18 months postoperative test, although non-significant, and did not test earlier, their results probably also contrast with ours. Combined, these differences indicate that our patients’ hip flexion ability was earlier normalised than in the previous studies, and can probably be explained by the reduction in pain after PAO. The early normalisation is further corroborated by force data from the pure hip flexor muscles, in particular the prime mover the iliopsoas muscle. Peak moments are instantaneous measures, while the angular impulses, being time integrals of moments, are measures of the overall muscle demand across the stance phase. 10 Power is also an instantaneous measure, but being the product of moment and joint angular velocity, it expresses the muscles’ ability to further accelerate the joints at a given walking speed, thereby being the measure most closely related to performance, i.e. walking speed.
Joint contact forces
In contrast to net joint measures and muscle forces, joint contact force magnitude did not seem fully normalised 6 months postoperatively. Considering that joint contact force is primarily due to muscle forces, this might at first seem strange; however, the various peak muscle forces and the peak joint contact force do not necessarily occur at the same instant during the gait cycle. Assuming that changes in muscle activation is a pain avoidance strategy,1,18,24,26 this could indicate that joint structures need longer time to heal than muscles. This is corroborated by Jacobsen et al.’s 19 finding that while our patients experienced gradually less pain at 6 and 12 months postoperatively compared to preoperatively, they were still not completely pain free 12 months postoperatively.
Limitations
While our study is 1 of only 4 longitudinally designed PAO studies and the only one to include individual muscle and joint contact forces, it still has a number of limitations. Firstly, we conducted multiple statistical tests without any corrections (e.g., Bonferroni) to protect against type I errors. However, while some of the statistical significant differences we found therefore might be type I errors, we still have confidence in the major finding that the flexor muscles and hence flexor function were normalised already 6 months postoperatively, given that all the net joint flexor measures and the peak forces in all the pure hip flexor muscles increased significantly. On the contrary, we do not consider the risk of type II errors to be relevant, given the fairly high statistical power.
Secondly, we base our analysis on connections between peak moments, peak power, peak muscle forces and peak joint contact force, despite we cannot be certain these peak values occur simultaneously. Similarly, we assume patients try to reduce peak joint contact force as a pain avoidance strategy, but we cannot be certain peak force and maximal pain occur simultaneously.
Thirdly, individual muscle forces and joint contact force were estimated using OpenSim’s built-in static optimisation procedure, which minimises the sum of squared muscle activations. While this is an established, physiologically based optimisation criterion for normal walking, 29 it might not be valid for patients with hip dysplasia, who perhaps activate their muscles with the added objective of minimising pain.
Finally, we did not compare our rehabilitation activities to those employed in previous studies, despite the very probable influence of these activities on the time course of rehabilitation.
In conclusion, hip muscle function during walking seemed normalised already 6 months after minimally invasive periacetabular osteotomy, while joint contact force did not seem fully normalised until 12 months postoperatively, perhaps because the hip joint structures need longer time to heal than the muscles and some kind of pain alleviating strategy was still in effect.
Footnotes
Declaration of conflicting interests
The author(s) declared no potential conflicts of interest with respect to the research, authorship, and/or publication of this article.
Funding
The author(s) received no financial support for the research, authorship and/or publication of this article.