
Abstract
This study reveals a critical discordance between technically compliant classroom acoustics and student perceptual comfort, demonstrating that compliance alone does not ensure adequate learning environments. Four Italian classrooms were assessed using ODEON acoustic simulations, standardized in-situ measurements, and perceptual evaluations involving 90 students. Results exposed disparities between objective and subjective performance: one classroom achieved acceptable Speech Transmission Index values (STI = 0.672) yet received negative comfort ratings, while another showed poor technical performance (STI = 0.453) but excellent satisfaction. High T30 calibration errors correlated with elevated perceptual disturbance. Anthropophonic noise emerged as the dominant acoustic concern affecting learning comfort. A novel perception-based priority ranking system was developed, integrating student comfort scores, disturbance assessments, and soundscape descriptors with traditional acoustic metrics. This methodology identified critical priorities overlooked by conventional assessments, with priority scores ranging from 1.58 for the most critical classroom to −0.90 for spaces where satisfaction was high despite technical deficiencies. Acoustic corrections were validated through ODEON simulations, with T30 calibration accuracy ranging from 83.3% for best-performing classrooms to 16.7% for the highly reverberant untreated environment, where interventions represent directional improvement trends. STI values increased by up to 66.7% in critical interventions, while targeted treatments achieved optimal conditions with minimal disruption to existing positive experiences. This research establishes that effective classroom acoustic design requires systematic integration of user experience with technical parameters, providing a replicable methodology moving beyond regulatory compliance toward genuinely comfortable learning environments, conducted within the necessARIA project funded by the Italian Ministry of Health as a national interest initiative.
Introduction
The acoustic environment in educational spaces constitutes a critical determinant of student well-being, learning efficacy, and cognitive development. 1 Children spend substantial periods within educational institutions, experiencing continuous exposure to suboptimal acoustic conditions that can adversely affect their health and cognitive performance. 2 This phenomenon assumes heightened significance given that poor indoor environmental quality (IEQ) in schools profoundly impacts student well-being, learning capacity, and overall health.3,4
Empirical evidence in Loh et al. 5 demonstrates that most educational environments require substantial acoustic improvements. Comprehensive acoustic assessments reveal that room acoustics in the majority of sampled spaces necessitate enhancement, with mid-frequency reverberation times (T30) of 0.6 s (range 0.3–1.1 s), clarity indices (C50) of 6.1 dB (range 1.6–10.4 dB), and speech transmission indices (STI) of 0.7 (range 0.6–0.8). During active periods (including whole-class instruction and group work activities), sound pressure levels averaged 66 dB (A-weighted equivalent level) in both classrooms and recreational areas. 5
A large-scale in Catalina et al. 6 investigation encompassing 790 occupants across urban and rural environments corroborated these deficiencies. The study identified critical infrastructure inadequacies including insufficient ventilation, absence of cooling systems, inappropriate temperature regulation during seasonal extremes, and suboptimal heating system dimensioning and control. Notably, optimal thermal comfort was not achieved during cold seasons in any of the investigated schools.
Prolonged exposure to inadequate acoustic conditions precipitates significant health consequences. A prospective cohort study of pediatric populations in daycare centers documented by Putus et al. 7 a 5.6% prevalence of hoarseness, with environmental risk factors encompassing noise exposure, visible particulate contamination, mold presence, malodorous conditions, inadequate air circulation, thermal dysregulation, insufficient ventilation, building age, and wooden structural elements.
Multivariate logistic regression analysis, controlling for potential confounders, identified statistically significant environmental risk factors including noise exposure, elevated ambient temperatures, inadequate ventilation, stagnant indoor air, solvent odors, wooden structural components, and building age. These findings underscore the multifaceted relationship between built environment characteristics and pediatric respiratory health outcomes.
Systematic acoustic treatments demonstrate measurable efficacy in educational environments. Controlled studies reveal that extended reverberation times result in deteriorated speech recognition thresholds (SRTs) of approximately 11 dB and virtually eliminate spatial release from masking at angular positions. 8 Conversely, reduced reverberation times enhance speech clarity and definition, improving SRTs by up to 6 dB, particularly when noise sources are proximate to receivers and energetic maskers are present.
Innovative ventilation system designs have achieved promising acoustic performance metrics. In Nowoświat et al. 9 was optimized acoustic absorption solutions yielded background acoustic levels of 20.8 dB, while tested ventilation configurations produced equivalent sound levels of 32.2, 37.0, and 29.7 dB respectively all substantially below the 40 dB design threshold.
Comprehensive retrofit strategies encompassing shading systems, reflective surfaces, thermal and acoustic insulation, ventilation inlets, and circulation fans have yielded quantifiable improvements in thermal conditions (21.77%), ventilation (55.96%), acoustics (20.69%), and visual comfort (50.37%) (Abdollahzadeh et al., 2023). 10 These findings demonstrate the efficacy of integrated environmental interventions in achieving acceptable comfort levels through cost-effective architectural modifications. 11
The development of robust predictive frameworks represents a fundamental advancement in acoustic design for educational environments. Integration of simulated speech transmission indices with artificial neural network-based prediction methods has demonstrated computational robustness, enabling applications in existing space analysis, renovation planning, and new construction design.12–14
For students with hearing impairments, auditory working memory (AWM) demonstrates positive correlations with auditory short-term memory scores, spectral-temporally modulated ripple test (SMRT) performance, and speech recognition under noisy conditions in pediatric cochlear implant recipients. 15 These findings emphasize the critical importance of optimizing acoustic conditions for vulnerable populations with specialized auditory processing requirements.
Despite significant advances in acoustic modeling and simulation techniques, a critical gap remains between theoretical predictions and actual implementation outcomes in educational environments. Current practice often relies on post-installation verification, which presents substantial financial risks and limited opportunities for optimization. 16 Furthermore, traditional acoustic design approaches primarily focus on objective parameters while overlooking the subjective perception and psychoacoustic responses of actual users -students and teachers -who experience these environments daily. The development of comprehensive measurement-simulation-validation frameworks that integrate objective acoustic characterization, advanced computational modeling, psychoacoustic assessments, and subjective perception evaluation represents a crucial advancement toward evidence-based acoustic design.
The discordance between technically compliant acoustic environments and subjective user comfort has been documented across multiple strands of the literature, yet it has not been systematically operationalized as a design tool within a closed measurement–simulation–validation cycle. Bradley and Sato 17 demonstrated through intelligibility tests in 41 elementary school classrooms that mean intelligibility scores were significantly dependent on signal-to-noise ratios and student age group, revealing that STI-based compliance thresholds fail to account for the full perceptual experience of younger and more vulnerable learners. Astolfi and Pellerey investigated the relationship between perception scales and principal acoustical factors across eight secondary school classroom typologies, finding that objective STI values and signal-to-noise ratios only partially predicted subjective acoustic quality ratings, 18 with additional dimensions of thermal, visual, and indoor air quality mediating overall occupant experience. A study of Brazilian public school classrooms involving 62 teachers and 464 students revealed that despite objectively poor acoustic conditions, occupants identified human voice transmission through partitions—rather than reverberation—as the primary source of annoyance, 19 a finding inconsistent with what standard acoustic metrics would prioritize for intervention.
A recent systematic review across educational levels concluded that only a few studies have effectively integrated objective acoustic parameters with subjective data, highlighting a critical gap in understanding how students actually experience and respond to noise and reverberation beyond what physical measurement protocols capture. 20 Pastusiak et al. 21 confirmed the complexity of this relationship by demonstrating a non-linear association between listening effort and objective room acoustic parameters including reverberation time and STI, finding that listeners may overestimate their own intelligibility performance even under degraded acoustic conditions PAS Journals, underscoring the limitations of relying solely on technical metrics to assess acoustic adequacy. In the domain of educational soundscapes, Kurukose Cal et al. showed that current international guidelines for school acoustics prioritize technical parameters such as noise thresholds, reverberation time, and sound insulation, while the integration of soundscape principles encompassing perceptual and experiential dimensions remains substantially underexplored. 22
Collectively, these studies demonstrate that the perception gap is real and well-evidenced. However, none of the above works has proposed a quantitative priority scoring framework that integrates normalized subjective comfort, disturbance, and intelligibility data to rank intervention urgency across multiple classrooms, nor validated the resulting prescriptions through calibrated room acoustic simulations directly informed by user perception. The present study addresses precisely this operational gap. In this paper, we present a prototype methodology for testing acoustic corrections in educational environments through a comprehensive measurement-simulation-validation approach developed within the necessARIA project framework. 23 This paper aims to bridge the critical gap between objective acoustic measurements and subjective perceptual experiences in educational spaces by developing an integrated assessment framework that informs more effective acoustic interventions. Specifically, this research pursues the following objectives: (1) to investigate the correlation between ODEON-simulated acoustic parameters and students’ subjective perceptions of acoustic quality in university classrooms, identifying cases where technical compliance fails to ensure perceptual comfort. By analyzing four diverse classroom environments, this study examines whether standard acoustic metrics adequately capture the experiential dimensions of educational soundscapes. (2) To develop a perception-based priority ranking system that integrates objective measurements with subjective assessments to guide acoustic intervention strategies. This novel approach moves beyond traditional technical-parameter-driven design toward a human-centered methodology that prioritizes actual user experience. And (3) to propose and validate targeted acoustic interventions through ODEON simulations that address both regulatory compliance and perceptual quality objectives. These interventions are specifically designed to respond to the dominant role of anthropophonic noise and other perception-driven factors identified through integrated analysis.
Material and methods
Case studies
The experimental investigation was conducted on four representative classrooms selected from different educational institutions within the necessARIA project framework. The selection criteria prioritized diversity in geometric configurations, educational levels, and existing acoustic treatments to ensure methodological robustness and generalizability of results.
- Classroom A—Nereto (Secondary School): Located at the F. Ranalli middle school in Nereto (TE), the “Falcone e Borsellino” language laboratory occupies the first floor with dimensions of 8.09 × 6.09 × 2.9 m (Volume: 143 m3). The reinforced concrete structure features masonry perimeter walls with lime-based plaster finishes. Interior surfaces include porcelain stoneware flooring and painted plastered ceilings with an inspectable modular plasterboard suspended ceiling system. The classroom accommodates 19.2 students and utilizes fan-coil heating with natural ventilation through manual window operation. No acoustic insulation or mechanical ventilation systems are present.
- Classroom B—Pescara (High School): The PB-P1-A03 classroom at Galileo Galilei Scientific High School in Pescara (PE) measures 7.48 × 6.00 × 3.0 m (Volume: 135 m3). Constructed with reinforced concrete and masonry walls, the space features porcelain stoneware flooring and painted plastered ceilings without acoustic treatment. The facility serves 28 students and incorporates central heating via radiators, on-off air conditioning through fan-coils, and fluorescent lighting. Natural ventilation is achieved through manual window control, with no mechanical ventilation or acoustic insulation systems installed.
- Classroom C—Chieti (High School): Situated on the first floor of Isabella Gonzaga State High School in Chieti, this language laboratory spans 9.38 × 6.25 × 2.9 m (Volume: 170 m3). The reinforced concrete and masonry construction incorporates lime-based plaster finishes, porcelain stoneware flooring, and painted plastered ceilings without suspended acoustic systems. Accommodating 23 students, the classroom utilizes wall-mounted radiator heating, fluorescent lighting, and natural ventilation. Neither mechanical ventilation nor acoustic insulation treatments are present.
- Classroom D—Ovindoli (Elementary School): The 1G-2G classroom at Luigi Dard Elementary School in Ovindoli (AQ) measures 8.22 × 4.88 × 3.0 m (Volume: 120 m3). While maintaining similar reinforced concrete and masonry construction with lime-based finishes, this space uniquely incorporates radiant floor heating and an acoustic suspended ceiling system. The classroom serves 20 students with porcelain stoneware flooring, fluorescent lighting, and natural ventilation, representing the only case study with existing acoustic treatment.
Figure 1 shows the four different school environments used for acoustics data collection. Each row shows the external building view (left), classroom interior (center), floor plan with sensor positioning (center-right), and measurement position schema (right). Legend indicates primary speech source (blue circle), measurement positions (red triangles), disturbance sources (green squares), occupied areas (dashed lines), binaural signals (gray ellipses), and omnidirectional sources (yellow-green circles).
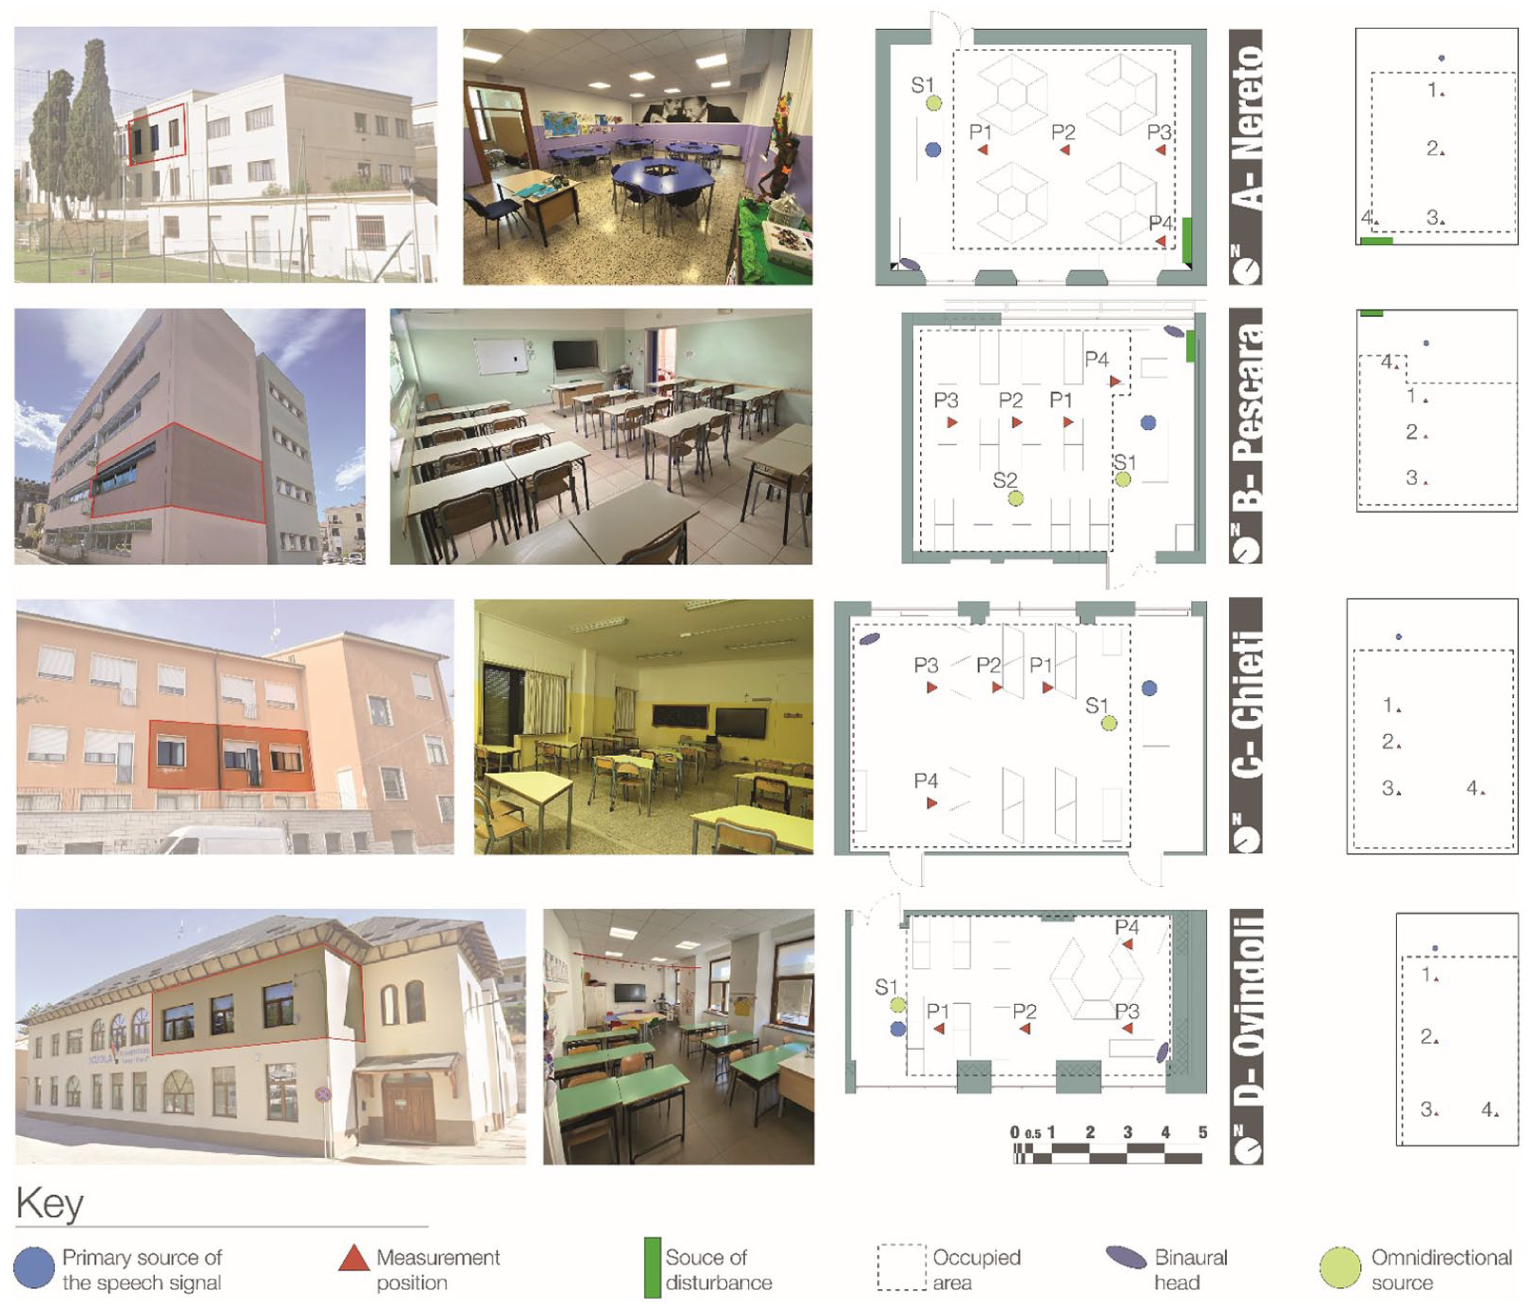
Four school environments for acoustics data collection showing building exterior, classroom interior, floor plan with sensor positions, and measurement schema.
The selected classrooms provide a comprehensive spectrum of educational environments, ranging from 120 to 170 m3 in volume, with student occupancy varying from 19.2 to 28 individuals. This diversity encompasses different educational levels (elementary to high school), geometric configurations (length-to-width ratios from 1.33 to 1.68), and acoustic conditions (with and without existing treatments). The consistent construction methodology across all facilities—reinforced concrete structures with masonry infill and lime-based finishes—enables controlled comparison while the varying ceiling treatments and heating systems provide insight into different acoustic scenarios commonly encountered in Italian educational buildings.
All selected classrooms fall within the A3 category (Lesson/communication as speech and conference) according to UNI 1153224,25 Italian standards, ensuring methodological consistency while representing typical acoustic challenges in contemporary educational environments lacking adequate acoustic design consideration.
In situ measurements
Acoustic characterization of all four classrooms was conducted following the standardized protocol for acoustic measurements in educational environments. This Italian standard provides specific guidelines for measurement procedures, equipment requirements, and data processing methods tailored to school buildings, ensuring consistency and reproducibility across different facilities. The measurement campaign was designed to capture both traditional acoustic parameters and advanced psychoacoustic descriptors, enabling comprehensive evaluation of the acoustic environment from both objective and perceptual perspectives.
All measurements were performed under unoccupied conditions with furniture in place to represent realistic acoustic conditions during non-teaching periods. The experimental approach encompassed a comprehensive range of parameters including background noise levels (LAeq), 26 reverberation time measurements (T30) across octave bands from 125 to 4000 Hz, 27 and Speech Transmission Index (STI) 28 evaluations to quantify intelligibility performance. Beyond conventional metrics, psychoacoustic parameter evaluation represented a crucial innovation in educational acoustic assessment, incorporating loudness calculations following ECMA 418-2 29 standard to quantify perceived loudness measurements to characterize spectral content perception, roughness assessments to capture temporal modulation effects and fluctuation strength evaluations for low-frequency modulation analysis that significantly influence cognitive load and attention in learning environments.
A standardized measurement setup was employed across all classrooms to ensure data consistency and comparability. The omnidirectional sound source was positioned at typical teacher locations with pink noise excitation signals for reverberation measurements and standardized speech signals for intelligibility assessment. Sound levels were calibrated to 65 dB(A) at 1 m distance to represent realistic classroom vocal effort conditions. The receiver network implementation followed UNI 11532 spatial sampling requirements with measurement grids adapted to individual classroom geometries ensuring representative coverage. Each classroom incorporated a minimum of six measurement points positioned at 1.2 m height corresponding to student ear level, with additional positions strategically placed to assess spatial variation patterns.
The measurement equipment included Class 1 sound level meters with 1/3 octave band analysis capability, calibrated omnidirectional measurement microphones, and real-time data acquisition systems enabling simultaneous multi-point measurements. Environmental conditions including temperature and humidity were continuously monitored to ensure measurement validity and enable appropriate corrections. All measured data underwent rigorous quality control procedures including equipment calibration verification before and after each measurement session, background noise correction algorithms, and statistical analysis of measurement repeatability across multiple acquisition cycles. Psychoacoustic parameters were computed using validated algorithms implementing standardized auditory models, with particular attention to temporal integration and frequency weighting according to human hearing characteristics, providing crucial insight into student acoustic comfort and learning effectiveness that traditional acoustic metrics cannot capture.
Figure 2 shows the acoustics characterization of the four classrooms.
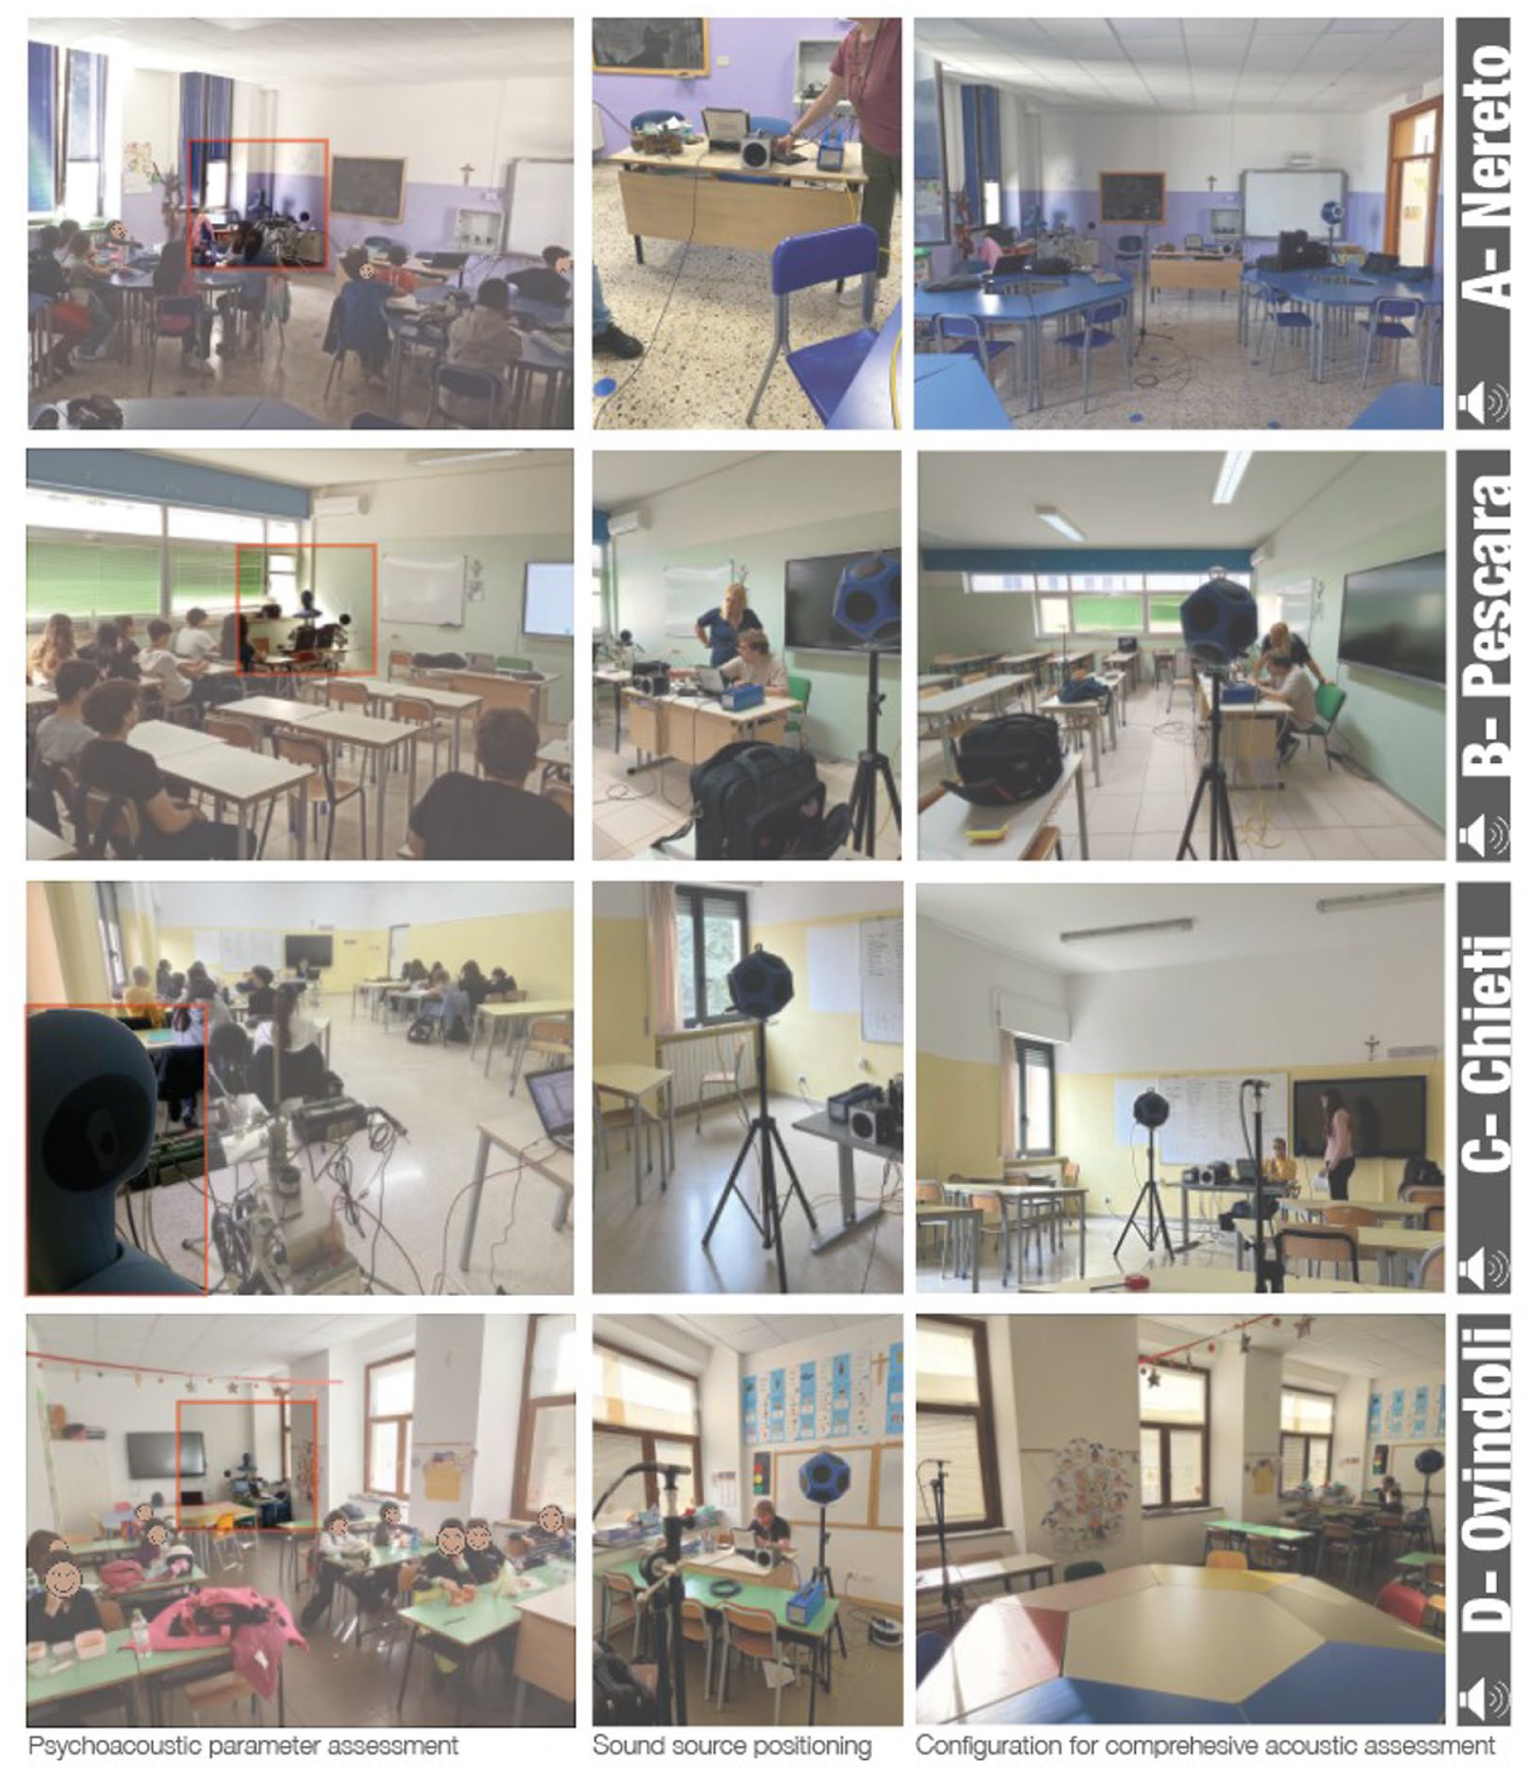
Standardized acoustic measurement setup implementation across all four case studies showing omnidirectional sound source positioning, receiver grid distribution according to UNI 11532 protocol, and Class 1 instrumentation configuration for comprehensive acoustic and psychoacoustic parameter assessment.
Subjective assessment framework
Subjective acoustic perception evaluation was conducted through comprehensive questionnaire surveys based on ISO 1291330,31 standardized methodology for soundscape assessment in educational environments. The framework was specifically adapted to capture student acoustic comfort, speech intelligibility perception, and learning environment satisfaction across diverse classroom conditions. This approach enabled systematic collection of perceptual data that could be directly correlated with objective acoustic measurements and subsequently integrated into the simulation-based design process.
The questionnaire structure incorporated standardized ISO 12913 perceptual descriptors adapted for educational contexts, with the core assessment focusing on the fundamental question “How do you rate the acoustic quality of the classroom?” using a five-point semantic differential scale ranging from “Excellent” to “Very Poor.” Additional dimensions evaluated included speech intelligibility perception, concentration difficulty levels, background noise disturbance, and overall learning environment satisfaction. The demographic analysis revealed balanced gender distributions across all classrooms, with age ranges appropriately corresponding to educational levels and institutional contexts.
The questionnaire was structured as follows:
- Demographic and contextual information: Age, gender, frequency of classroom use, and typical seating position
- Acoustic quality perception: Speech intelligibility, reverberation appropriateness, and noise disturbance levels
- Sound source identification: Classification and impact assessment of perceived sounds
- Soundscape quality evaluation: Based on ISO/TS 12913-2 perceptual attributes
- Overall comfort and satisfaction: Integrated assessment of the learning environment
Regarding the subjective survey, an Italian translation of the questionnaire was made because English is not the local language. The standard 32 provides a questionnaire example, though it does not provide official translations in languages other than English. For this reason, in this soundscape research, the author has consulted table 3 of Ref. 32 for the translation of the adjectives. The schematic structure of the questions is displayed in Table 1.
Contents of the questionnaire.
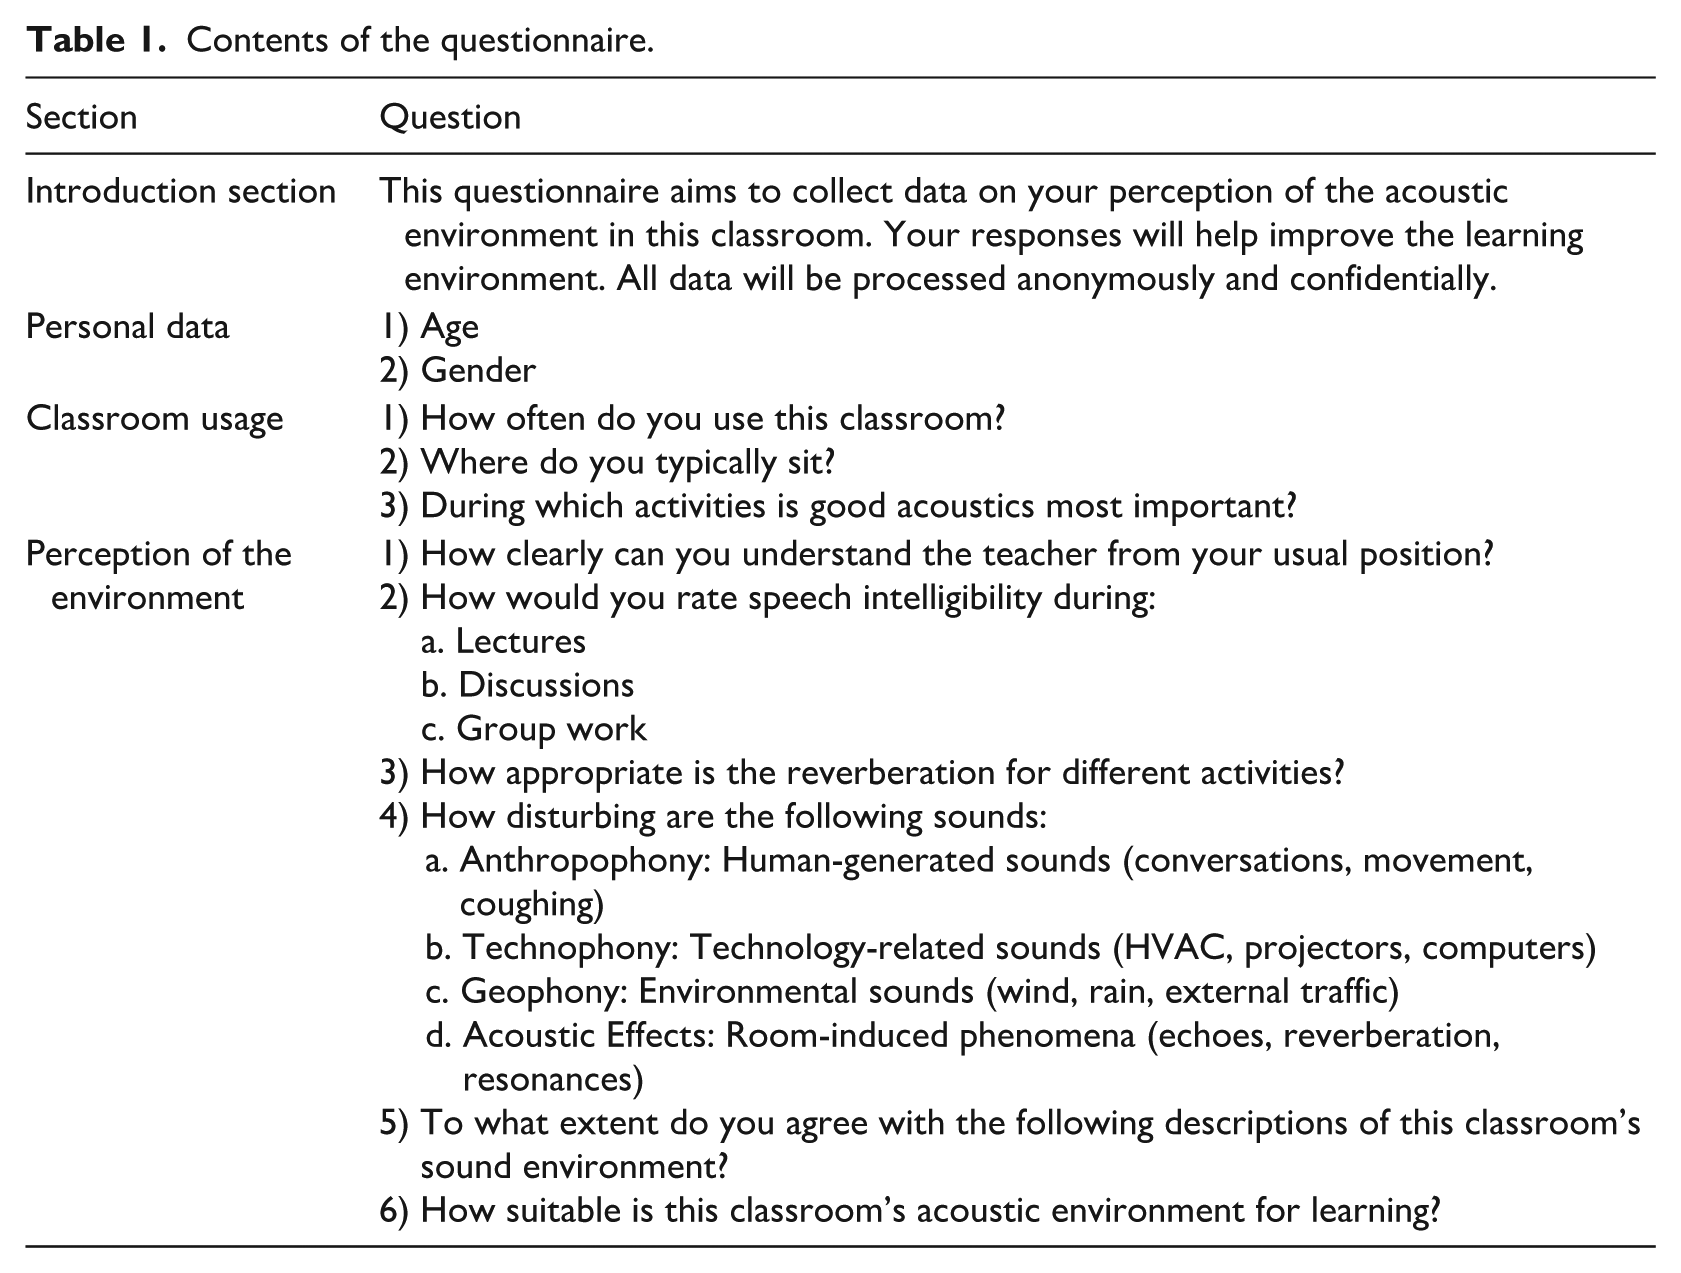
The comfort score used in the priority scoring formula (equation (3)) corresponds to the mean response to questionnaire item Q2 (“How comfortable is the acoustic environment for learning?,” 5-point Likert scale). The disturbance score corresponds to the mean response to item Q3 (“How much are you disturbed by noise during lessons?,” 5-point Likert scale). Both scores were averaged across all student respondents within each classroom to produce classroom-level aggregate values.
Numerical model calibration
Detailed three-dimensional acoustic models were constructed for each of the four classrooms using ODEON Room Acoustics Software, 33 a specialized tool for predicting and analyzing room acoustic parameters based on ray-tracing and image source methods. 34 The software employs hybrid calculation algorithms that combine geometrical acoustics with wave-based approaches for accurate prediction of acoustic parameters in complex architectural spaces. 35 Each classroom model was developed following international standards for acoustic modeling accuracy, 27 with geometric representation including precise dimensional measurements obtained through laser scanning and architectural details modeled to a resolution of 0.1 m to ensure adequate ray density for reliable calculations.
Surface materials were assigned absorption and scattering coefficients based on measured values and established material databases, with particular attention to frequency-dependent characteristics across the six octave bands from 125 Hz to 4 kHz. The ODEON models incorporated geometric accuracy with room volumes, surface areas, and spatial relationships with sub-meter precision, frequency-dependent absorption coefficients for all surfaces, multiple source-receiver configurations corresponding to actual measurement locations, and calculation parameters with ray density settings optimized for room size and complexity using a minimum of 50,000 rays per source.
Model calibration was implemented using a genetic algorithm optimization approach to systematically adjust material properties and achieve optimal agreement between simulated and measured acoustic parameters. Genetic algorithms have proven particularly effective for acoustic model calibration due to their ability to navigate complex, multi-dimensional parameter spaces without requiring gradient information. 36 The GA calibration framework followed established methodologies in computational acoustics with a fitness function designed to minimize the relative error between measured and simulated T30 reverberation times across all frequency bands. 37
The optimization variables included absorption coefficients for major surface categories including concrete walls, ceiling materials, floor surfaces, window systems, and furniture with six frequency-dependent values for each category. The genetic algorithm implementation utilized a population size of 100 individuals, crossover probability of 0.8, mutation probability of 0.05, tournament selection with tournament size 3, and termination criteria of maximum 200 generations or convergence tolerance of 0.1%. The implementation utilized established operators for real-parameter optimization, with adaptive mutation rates to balance exploration and exploitation throughout the optimization process, while constraint handling ensured that all absorption coefficients remained within physically realistic bounds (0.01 ⩽ α ⩽ 0.99) as specified in acoustic material standards. 38
Model validation followed stringent criteria established in international standards for acoustic prediction accuracy, with the primary validation criterion requiring relative errors between measured and simulated T30 values to remain below 5% for each octave band, consistent with Grade 1 accuracy requirements in Ref. 27 Additional validation metrics included root mean square error for overall model accuracy assessment, correlation coefficients for linear relationship strength between measured and predicted values, and frequency-specific analysis to identify systematic errors or material modeling deficiencies. The validation process incorporated uncertainty analysis through Monte Carlo simulations with 1000 iterations to assess sensitivity to input parameter variations, providing confidence intervals for predicted acoustic parameter. 39
Following successful calibration, the validated ODEON models served as platforms for simulating targeted acoustic interventions that integrated traditional acoustic metrics with psychoacoustic parameters to ensure that technical improvements translated into enhanced perceptual comfort.40,41 The corrective solution framework encompassed absorption treatments through strategic placement of acoustic panels and ceiling systems, diffusion elements via installation of sound-scattering surfaces, layout optimization through furniture arrangement modifications, and advanced treatments including sound masking systems. Each proposed intervention was modeled through systematic parameter modification in the calibrated ODEON models, involving material property adjustment reflecting proposed acoustic treatments, geometric modifications for added architectural elements, multi-position analysis to assess spatial uniformity of improvements, and frequency-specific evaluation to ensure broadband effectiveness.
The optimization process extended beyond traditional acoustic metrics to incorporate psychoacoustic principles that directly relate to human perception and comfort in educational environments, recognizing that optimal classroom acoustics must address both measurable performance criteria and subjective experience factors.
Target parameters included reverberation time optimized for speech clarity while maintaining acoustic warmth (0.6–1.2 s for educational spaces), Speech Transmission Index values ⩾0.60 for “Good” intelligibility classification according to Ref., 28 sound level distribution for spatial uniformity, and balanced frequency response avoiding excessive emphasis in any frequency range. The optimization algorithms incorporated perceptual weighting factors based on human auditory sensitivity and classroom acoustic preferences, emphasizing speech frequency ranges (500–2000 Hz) where intelligibility is most critical, controlling low-frequency rumble and HVAC noise that contributes to cognitive fatigue, and considering temporal characteristics of early reflection patterns that support speech clarity without causing echoes.
Multi-objective optimization techniques balanced competing acoustic requirements to identify optimal solutions that achieved the best compromise between technical parameter compliance, perceptual comfort indicators derived from preliminary student feedback, and implementation feasibility considering architectural constraints.
Results
All statistical analyses reported in this section are performed at the classroom aggregate level (n = 4 classrooms), reflecting the case-study design of this research. Mean values, standard deviations, and the one-way ANOVA reported in Section 3.2 should therefore be interpreted as descriptive and exploratory indicators rather than confirmatory inferential results. A fully specified multilevel model accounting for the nested structure of students within classrooms would require a minimum of 15–20 classrooms and is beyond the scope of this proof-of-concept study. These constraints are explicitly acknowledged as a major limitation in Section 4.
Acoustic characterization of the four classrooms
The comprehensive acoustic assessment revealed significant variations in acoustic performance across the four selected educational environments, with measurements demonstrating the typical challenges encountered in Italian school buildings lacking adequate acoustic design consideration. The characterization encompassed traditional acoustic parameters alongside advanced psychoacoustic descriptors, providing a complete picture of the acoustic conditions experienced by students and teachers in contemporary educational settings.
Tables 2 to 5 present the complete acoustic characterization data, including reverberation times across frequency bands (T30), Speech Transmission Index values with regulatory compliance status, background noise levels (LAeq), and psychoacoustic parameters for perceived sound quality.
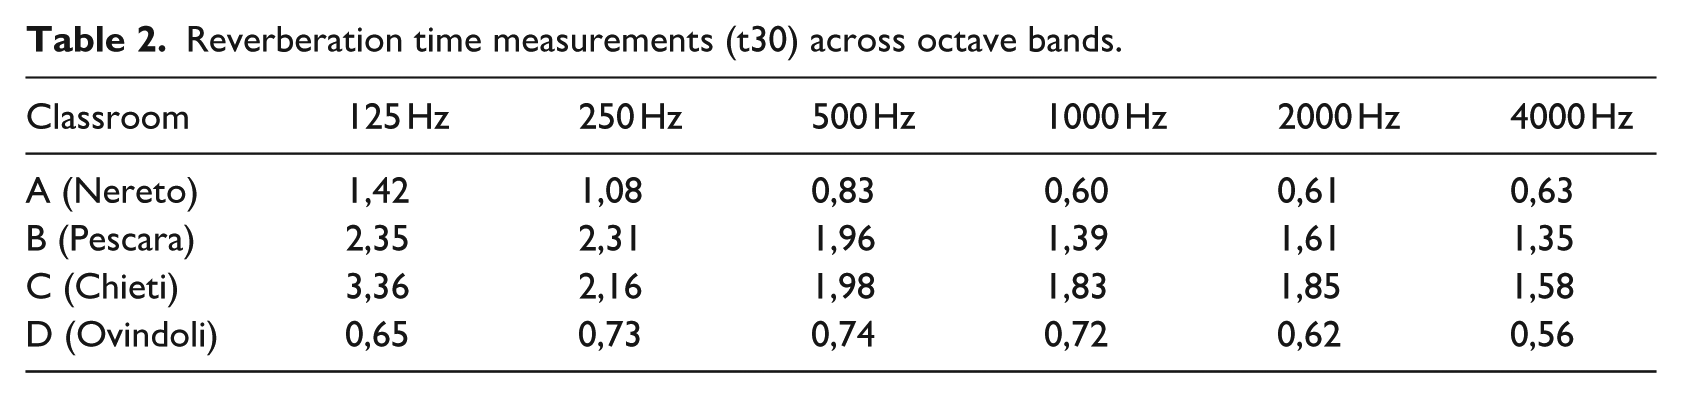
Reverberation time measurements (t30) across octave bands.
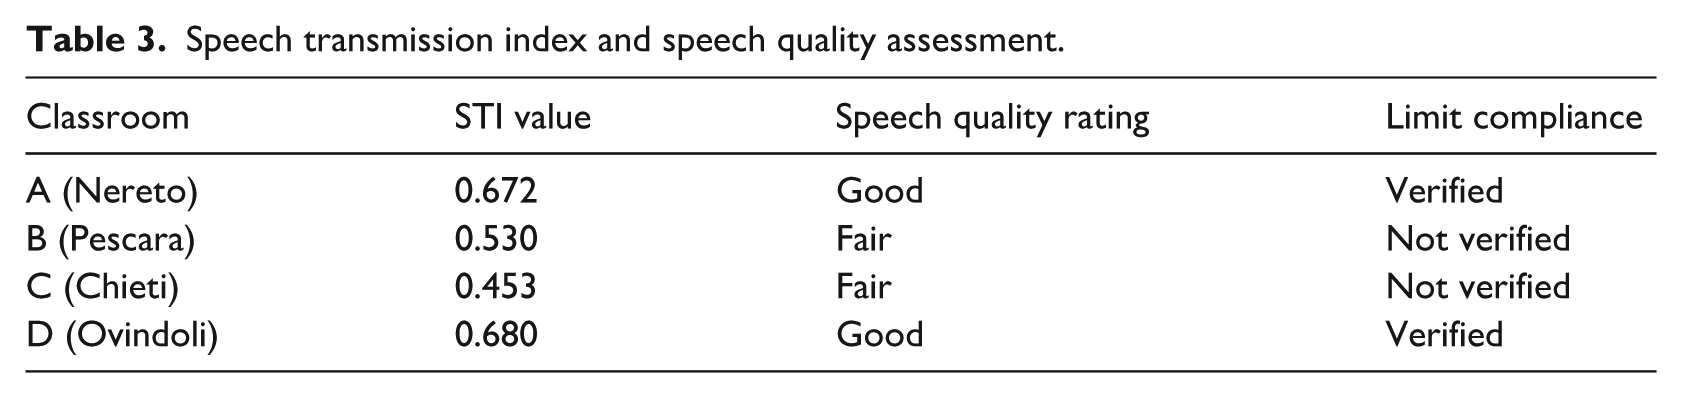
Speech transmission index and speech quality assessment.
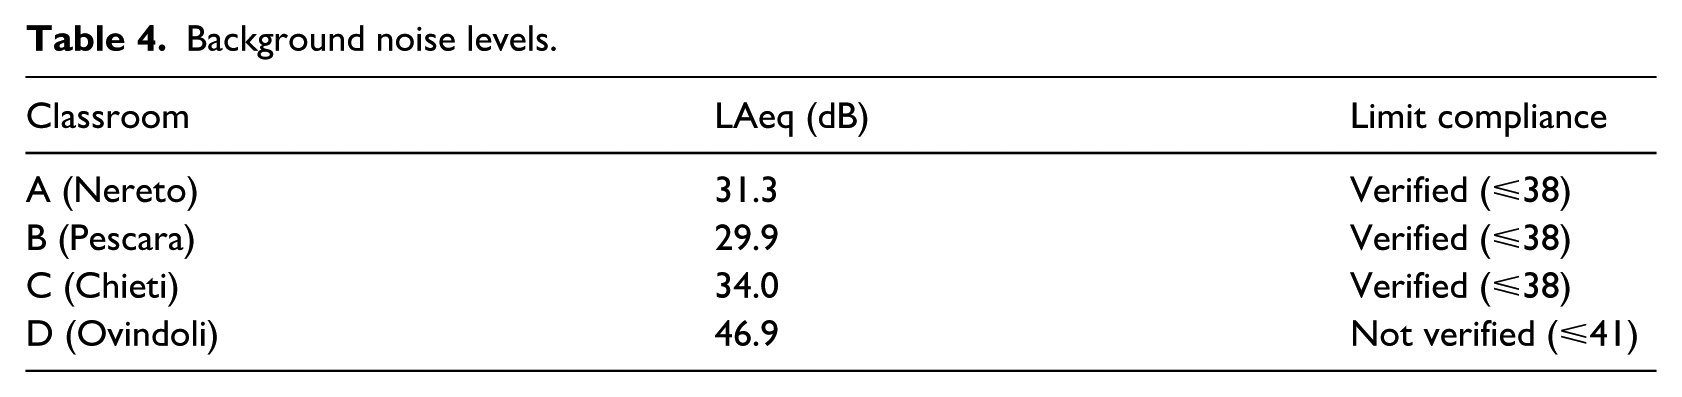
Background noise levels.
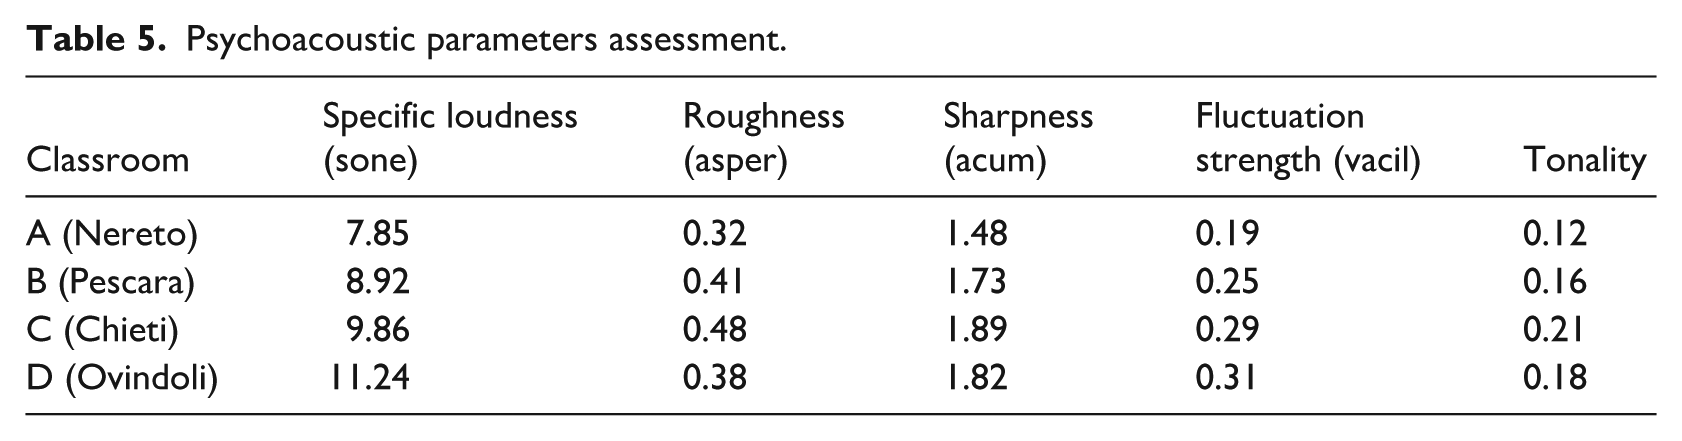
Psychoacoustic parameters assessment.
STI compliance is assessed against the threshold of STI ⩾ 0.60 specified by UNI 11532-2:2020 for category A3 (lesson/communication) environments. This threshold is consistent with the “Good” intelligibility classification of IEC 60268-16. 28
Classroom A demonstrated intermediate reverberation time values ranging from 1.42 s at 125 Hz to 0.61 s at 4000 Hz, with the suspended plasterboard ceiling providing some acoustic control compared to untreated spaces. The Speech Transmission Index of 0.672 achieved “Good” speech quality rating, representing acceptable intelligibility performance for language laboratory activities, though reverberation time exceeded normative limits.
Classroom B exhibited problematic acoustic conditions with excessive reverberation times extending from 2.35 s at 125 Hz to 1.35 s at 4000 Hz. The STI value of 0.53 indicated “Fair” speech quality, falling below verification thresholds and reflecting the complete absence of acoustic treatment in this high school scientific classroom. Despite acceptable background noise levels, the prolonged reverberation significantly compromised speech intelligibility.
Classroom C presented the most challenging acoustic environment, with reverberation times reaching 3.36 s at 125 Hz and extending to 1.58 s at 4000 Hz. The STI value of 0.453 represented “Fair” speech quality, severely compromising language learning activities. Psychoacoustic analysis revealed elevated roughness (0.48 asper) and sharpness (1.89 acum) values, indicating harsh spectral characteristics contributing to cognitive fatigue in this untreated language laboratory.
Classroom D demonstrated superior acoustic performance attributed to the acoustic suspended ceiling system, with well-controlled reverberation times ranging from 0.65 to 0.56 s across the frequency spectrum. The STI value of 0.68 achieved “Good” speech quality rating, representing optimal conditions for primary education activities.
The psychoacoustic parameters serve a diagnostic function within the integrated assessment framework, characterizing the spectral and temporal quality of the background noise field and providing perceptual interpretation of acoustic conditions that complements STI and reverberation time metrics. Elevated roughness (Classroom C: 0.48 asper) and sharpness (1.89 acum) values directly informed the broadband absorption treatment targets specified in Section 2.4, while the high specific loudness of Classroom D (11.24 sone) identified a background noise control requirement independent of reverberation characteristics. These parameters thus bridge the objective acoustic characterization and the intervention design stages of the methodology.
Subjective responses
The survey implementation encompassed the complete student population of each classroom during normal educational activities.
F. Ranalli Secondary School in Nereto, all 19 students aged 11–14 years from the “Falcone e Borsellino” language laboratory participated in the assessment, representing typical middle school language learning acoustic requirements (Figure 3). Primary activity are foreign language instruction including listening comprehension exercises and oral practice.
Galileo Galilei Scientific High School in Pescara, Classroom B evaluation involved the complete cohort of 28 students aged 14–18 years across scientific curriculum subjects, providing comprehensive insight into acoustic conditions at maximum occupancy (Figure 4). Primary activity are frontal lecturing across scientific curriculum subjects.
Isabella Gonzaga State High School language laboratory in Chieti engaged all 23 students aged 14–18 years focused on foreign language instruction activities (Figure 5). Primary activity are foreign language instruction with audio-based exercises.
Luigi Dard Elementary School in Ovindoli involved the complete class of 20 students aged 6–10 years representing primary education acoustic experiences (Figure 6). Primary activity are mixed primary education activities including storytelling, group reading, and oral exercises.
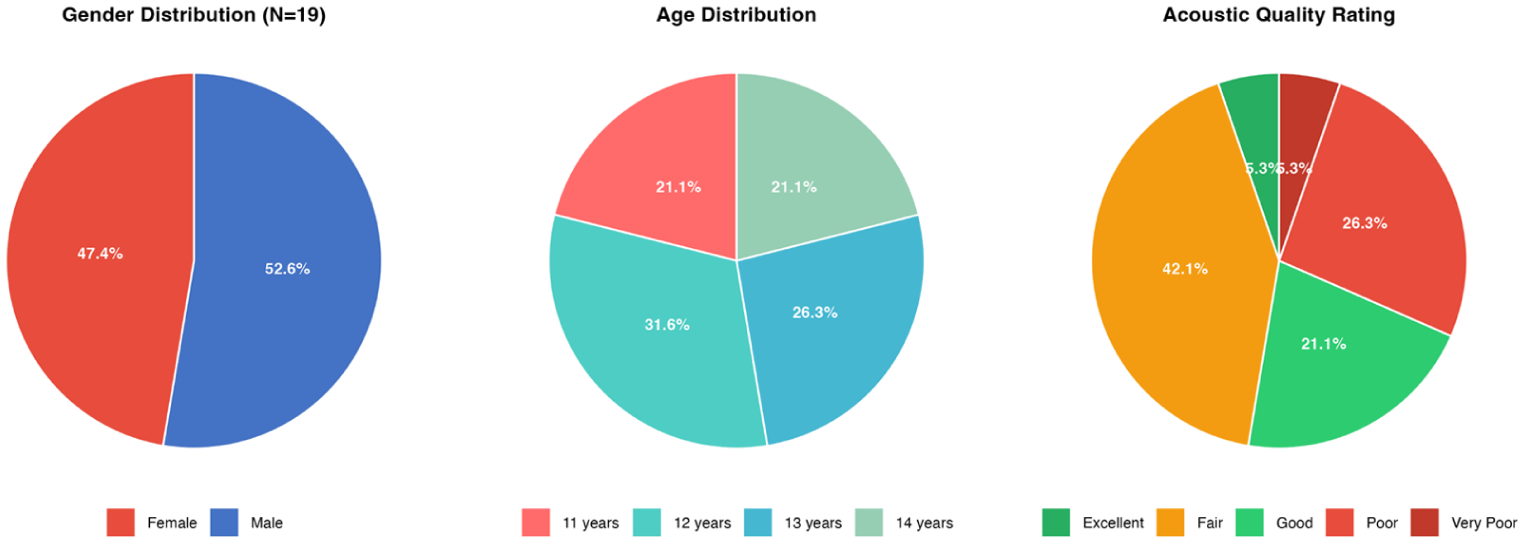
Classroom A subjective assessment: Demographics and acoustic quality ratings (N = 19).
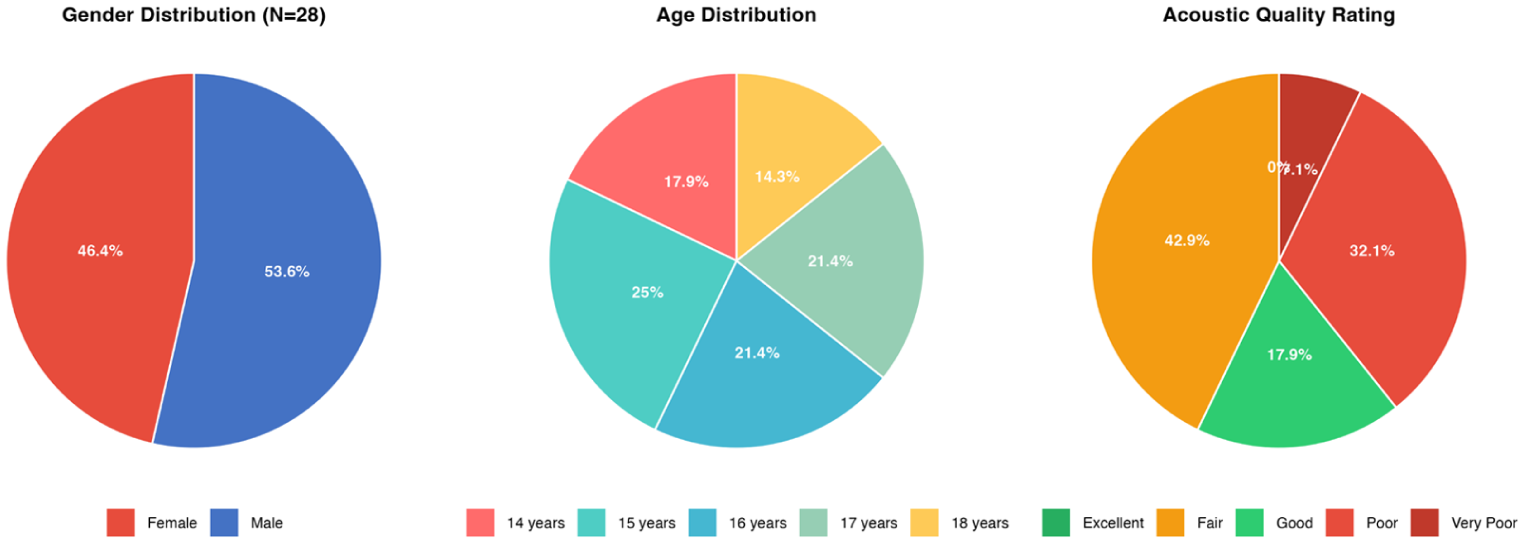
Classroom B subjective assessment: Demographics and acoustic quality ratings (N = 28).
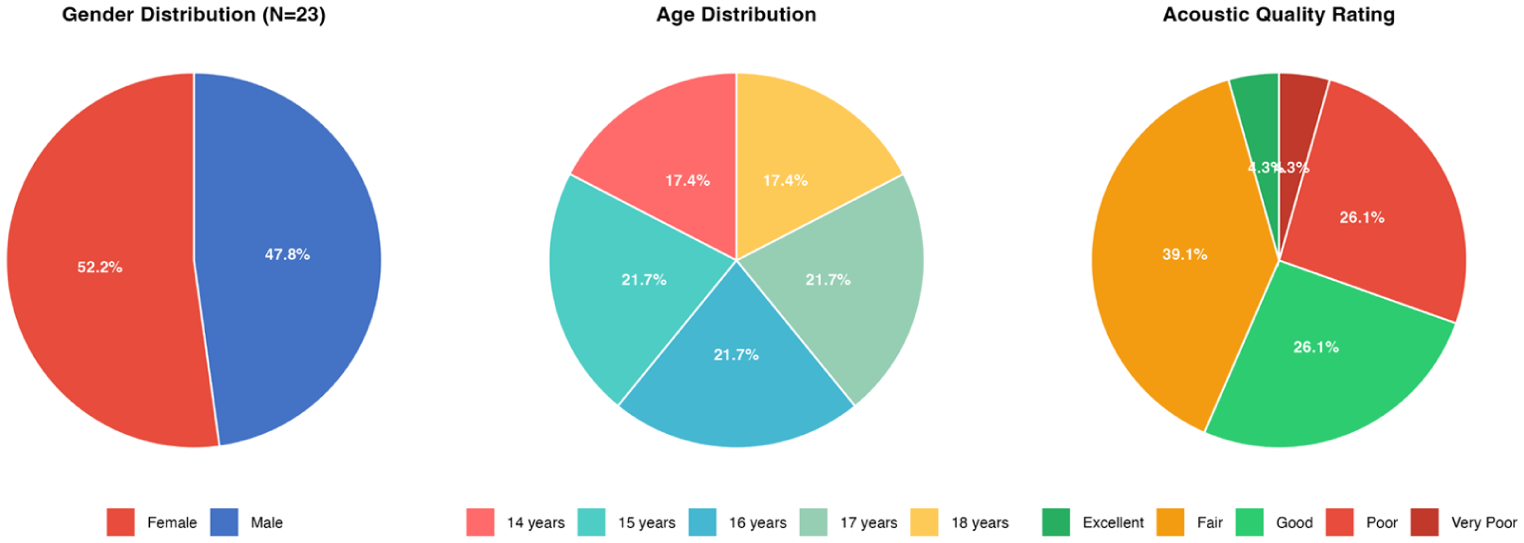
Classroom C subjective assessment: Demographics and acoustic quality ratings (N = 23).
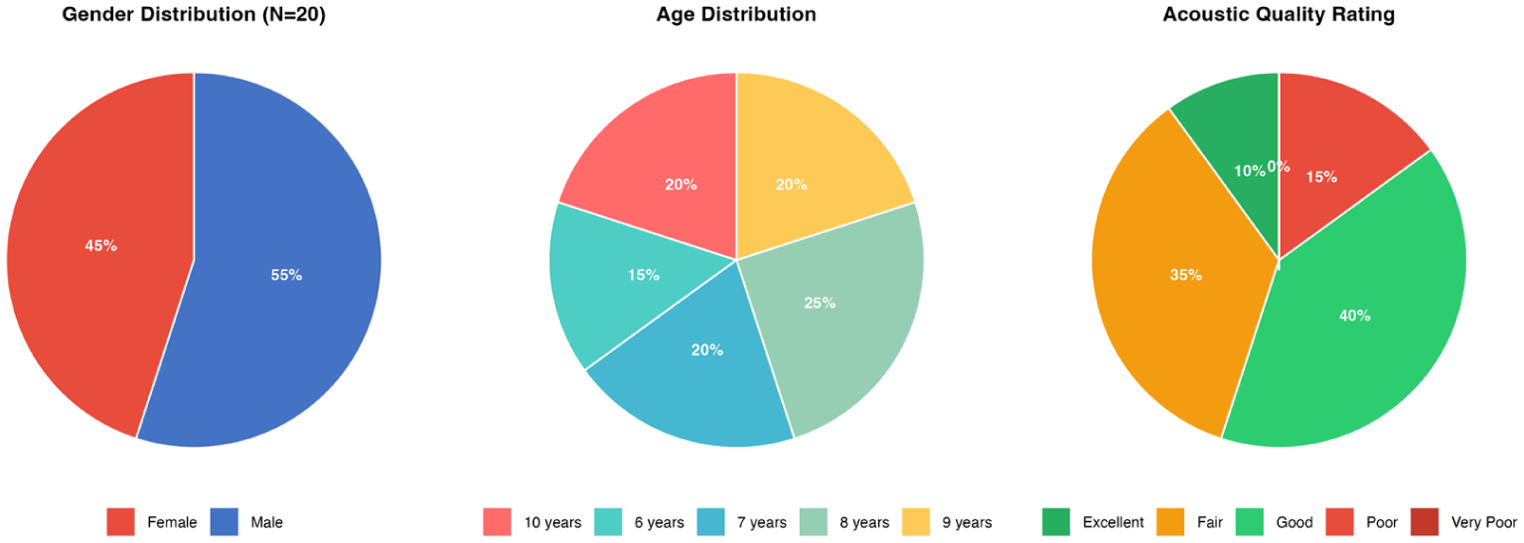
Classroom D subjective assessment: Demographics and acoustic quality ratings (N = 20).
Results demonstrated significant variations in acoustic perception across the four case studies, with Classroom D in Ovindoli showing markedly superior ratings attributed to the presence of acoustic ceiling treatment, while Classrooms A, B, and C exhibited predominantly “Fair” to “Poor” acoustic quality assessments reflecting typical acoustic deficiencies in untreated educational environments.
Data collection was conducted during typical teaching periods to capture realistic acoustic exposure conditions with full classroom occupancy, with questionnaire administration following standardized protocols to minimize response bias and ensure statistical validity. This comprehensive subjective assessment framework established the perceptual baseline necessary for student-centered acoustic design validation, moving beyond normative compliance toward evidence-based acoustic comfort optimization that directly addresses student-reported acoustic challenges in contemporary Italian educational environments.
Extended analysis following ISO 12913-2 soundscape assessment protocols revealed distinct patterns in sound source perception across the educational environments (Figure 7). Statistical analysis was performed on the mean ratings from the four classrooms (n = 4), with means (M) and standard deviations (SD) calculated to characterize central tendency and variability across the educational environments studied.
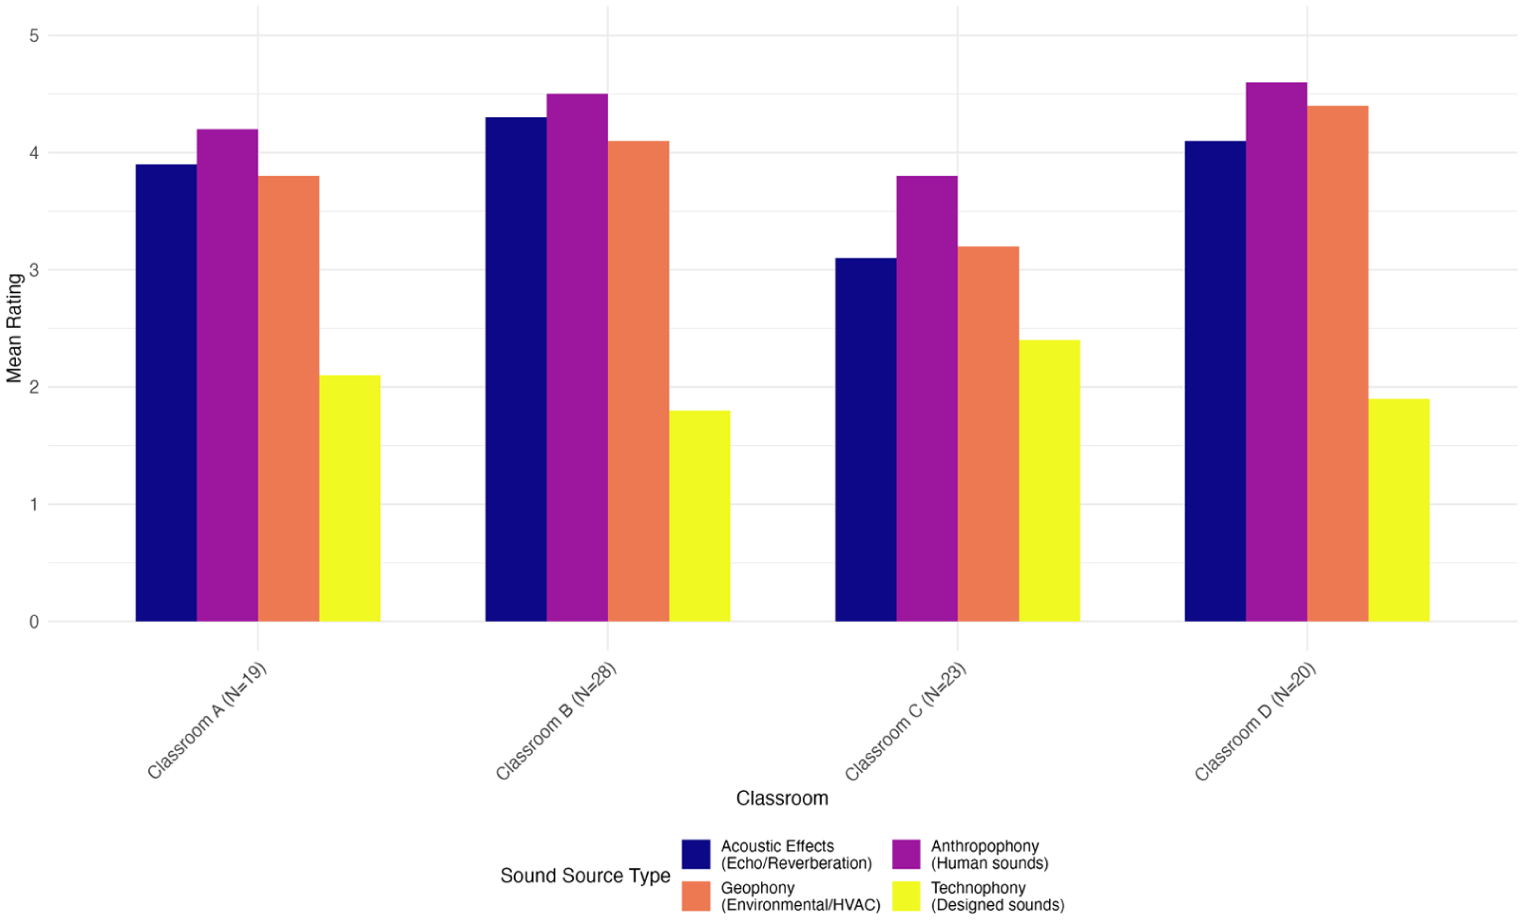
Sound source identification across classrooms. Subjective distinguishability ratings per ISO 12913-2 sound source categories (scale: 1 = Not distinguishable, 5 = Very distinguishable).Note. this figure reports distinguishability of sound source types, not perceptual quality.
Anthropophony, representing human-generated sounds including conversation, laughter, and footsteps, emerged as the most distinguishable sound category across all classrooms (M = 4.28, SD = 0.34, calculated from classroom means: 4.2, 4.5, 3.8, 4.6), indicating consistent recognition of human acoustic activity during educational periods. The low standard deviation reflects uniform perceptual salience of human sounds across diverse educational contexts. Geophony, encompassing environmental sounds from HVAC systems and ambient noise, demonstrated the second highest distinguishability (M = 3.88, SD = 0.51, from values: 3.8, 4.1, 3.2, 4.4), with Classroom D showing the highest geophonic awareness (4.4) potentially attributed to the enhanced acoustic sensitivity resulting from ceiling treatment installation.
Acoustic effects, including echo and reverberation phenomena, registered substantial perceptual prominence (M = 3.85, SD = 0.46, from values: 3.9, 4.3, 3.1, 4.1), with untreated Classroom B exhibiting the highest acoustic effects rating (4.3), confirming the acoustic deficiencies identified in preliminary assessments. Technophony, representing designed or intentionally introduced sounds, demonstrated consistently low distinguishability across all environments (M = 2.05, SD = 0.26, from values: 2.1, 1.8, 2.4, 1.9), reflecting the minimal presence of technological sound sources during typical educational activities and indicating that educational soundscapes are predominantly characterized by natural and human acoustic elements rather than designed technological interventions.
Figure 8 presents a comparative bar chart visualization where each classroom’s profile across all eight soundscape descriptors is displayed using grouped bars with distinct colors for visual differentiation. The scale ranges from 1 (not at all) to 5 (very much), enabling direct comparison of perceptual intensities across classrooms and descriptors. This visualization format allows immediate identification of problematic acoustic characteristics and favorable conditions within each educational environment.
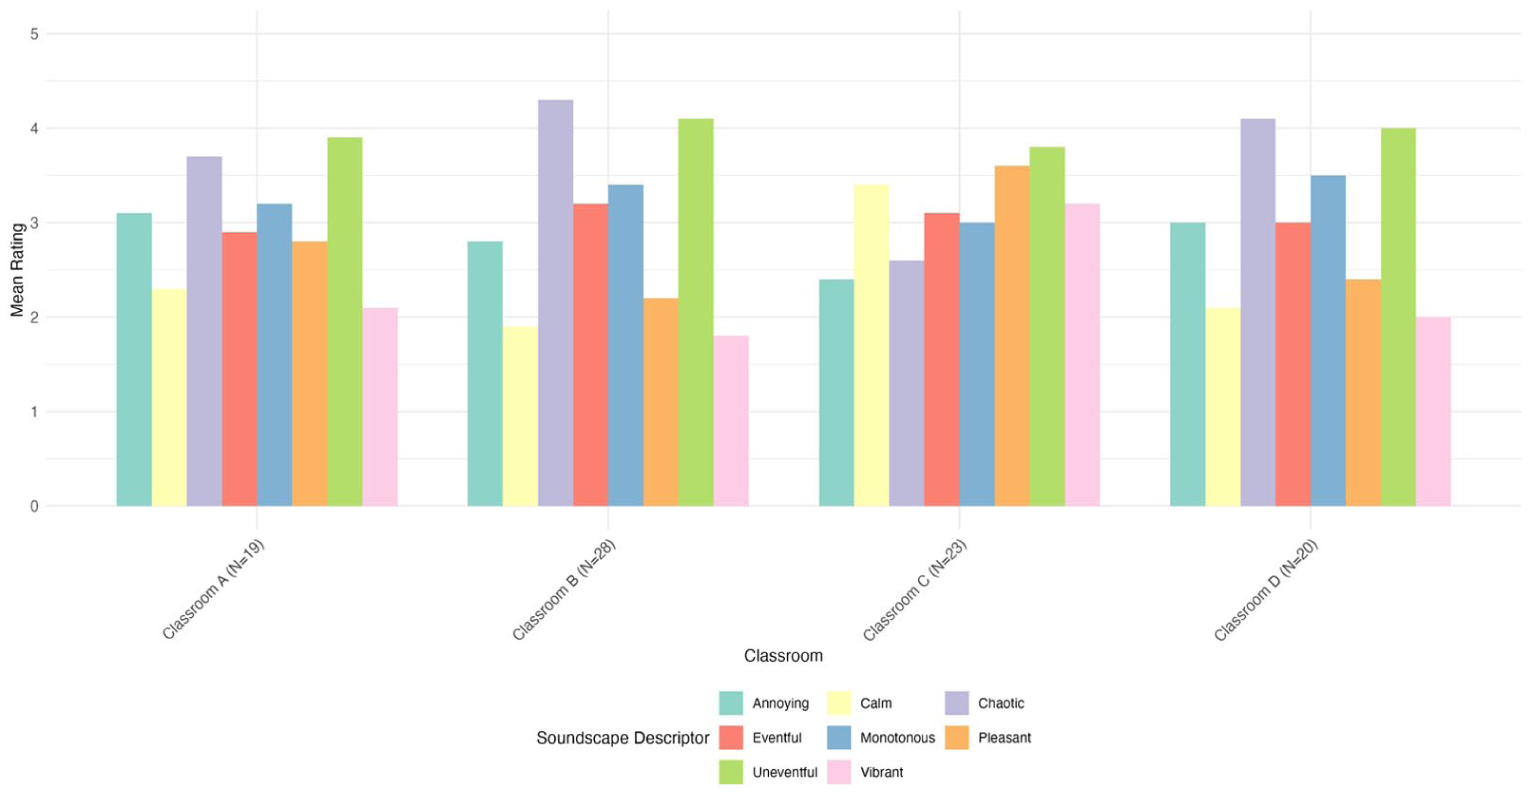
Soundscape perceptual descriptors across classrooms. Intensity ratings per ISO 12913-2 affective and perceptual attributes (scale: 1 = Not at all, 5 = Very much).Note. this figure reports perceived intensity of soundscape qualities, distinct from the sound source distinguishability shown in Figure 7 .
Classroom C emerged with the most favorable soundscape profile, demonstrating the highest pleasantness rating (3.6) and calmness score (3.4), coupled with the lowest chaos assessment (2.6), indicating superior acoustic comfort conditions despite the absence of specific acoustic treatment. This favorable profile correlates with the classroom’s architectural characteristics and occupancy patterns during language instruction activities. The classroom also exhibited moderate eventfulness (3.1) and relatively low annoyance levels (2.4), suggesting a balanced acoustic environment conducive to focused educational activities.
Several confounding factors may contribute to this finding and should be acknowledged. Students in Classroom C were aged 14–18, an age group with greater cognitive capacity to compensate for poor intelligibility through contextual inference compared to younger learners. The classroom also presented one of the lower occupancy densities (23 students, 170 m3), which may have reduced anthropophonics noise levels during survey administration. Additionally, the structured nature of foreign language instruction may have influenced acoustic expectations, and architectural characteristics, including room geometry and environmental quality may have introduced multi-domain perceptual interactions. Without regression analysis controlling for these variables simultaneously, the Chieti paradox is best interpreted as a hypothesis-generating observation warranting investigation in future larger-scale studies rather than as confirmatory evidence of perception-objective divergence.
Conversely, Classrooms B and D exhibited concerning acoustic profiles characterized by elevated chaos ratings (4.3 and 4.1 respectively) and diminished calmness scores (1.9 and 2.1), suggesting significant acoustic stress conditions despite Classroom D’s ceiling treatment. Classroom B demonstrated the most challenging acoustic conditions with the lowest pleasantness rating (2.2) and highest chaos perception (4.3), indicating substantial acoustic discomfort that likely impedes educational effectiveness. The paradoxical result for Classroom D indicates that acoustic treatment alone may be insufficient without comprehensive acoustic design considering all environmental factors, as ceiling treatment did not ameliorate the fundamental acoustic challenges experienced by students.
Classroom A presented intermediate acoustic conditions with moderate ratings across most descriptors, though exhibiting elevated chaos levels (3.7) and reduced calmness (2.3), suggesting partial acoustic challenges requiring targeted intervention strategies.
The heatmap reveals distinct clustering patterns where chaos and uneventfulness emerge as dominant characteristics requiring acoustic intervention priority. Specifically, chaos ratings display consistently elevated values across Classrooms A, B, and D (3.7, 4.3, and 4.1 respectively), appearing as red-coded cells indicating high perceptual intensity. Similarly, uneventfulness demonstrates uniformly high ratings across all classrooms (3.8-4.1), suggesting monotonous acoustic environments that may negatively impact student engagement and learning effectiveness.
Conversely, positive acoustic descriptors such as pleasantness, calmness, and vibrancy exhibit predominantly blue-coded representation, indicating consistently low ratings across most classrooms and highlighting the pervasive nature of acoustic challenges in contemporary educational environments. The heatmap visualization clearly delineates Classroom C as exhibiting the most favorable acoustic profile through its distinctive pattern of lower chaos and annoyance ratings combined with elevated pleasantness and calmness scores, appearing as a distinct row pattern within the matrix (see Figure 9).
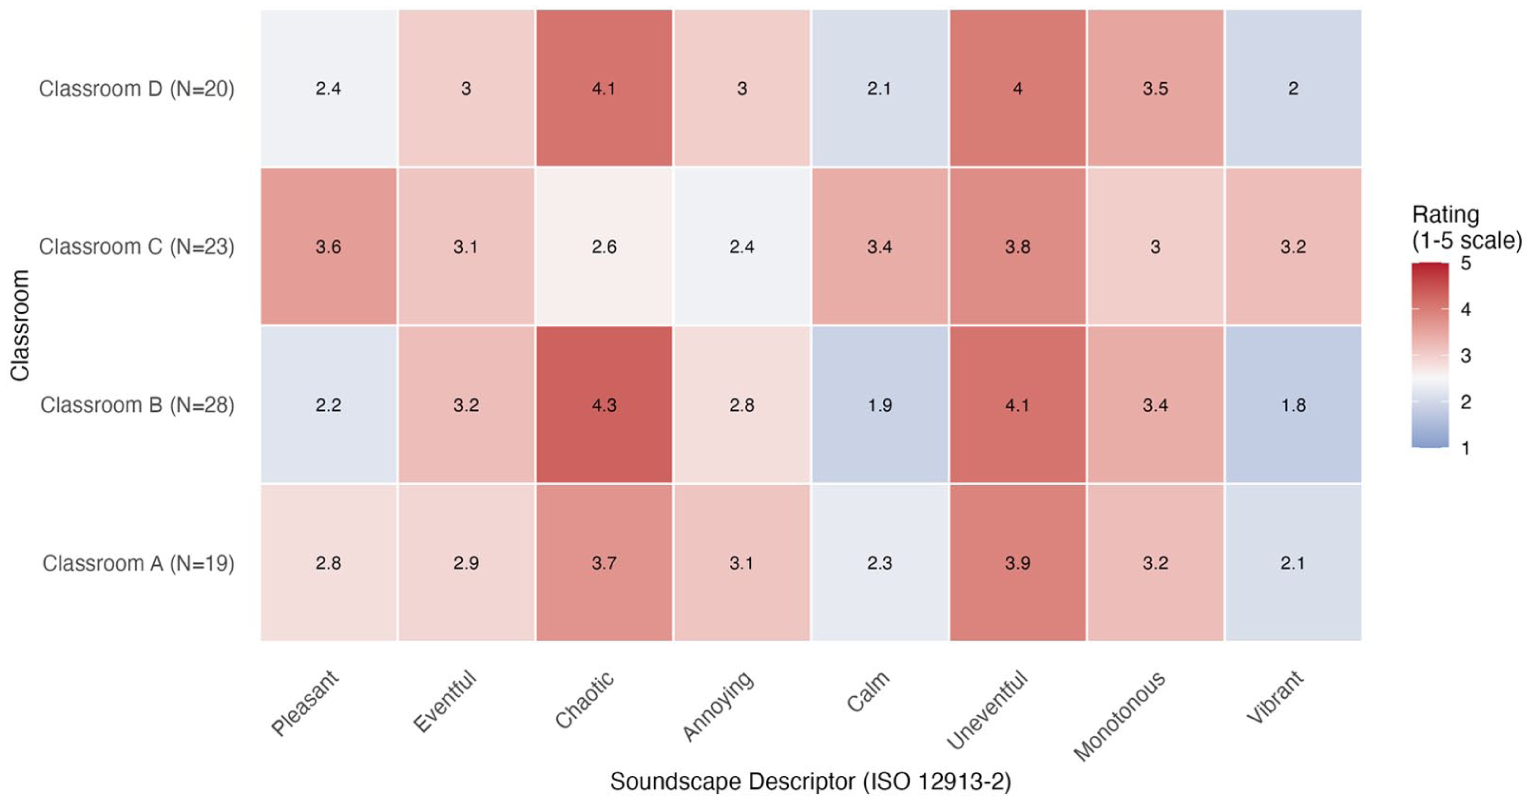
Soundscape quality heatmap.
ODEON model calibration
Numerical validation of the acoustic simulation models was conducted through systematic calibration of ODEON software 42 parameters against measured acoustic data from all four educational environments. The calibration process employed iterative adjustment of material absorption coefficients and geometric parameters to achieve optimal correlation between simulated and measured acoustic parameters, including reverberation times (T30) across the frequency spectrum from 125 to 4000 Hz and Speech Transmission Index (STI) values across multiple receiver positions within each classroom.
Table 6 summarizes the calibrated absorption coefficients derived through the iterative ODEON calibration process for all material surfaces encountered across the four educational environments. The calibration revealed significant variations in effective absorption properties compared to standard literature values, reflecting real-world acoustic conditions including aging effects, installation variations, and occupancy influences.
Calibrated absorption coefficients derived through the iterative ODEON calibration process for all material surfaces.
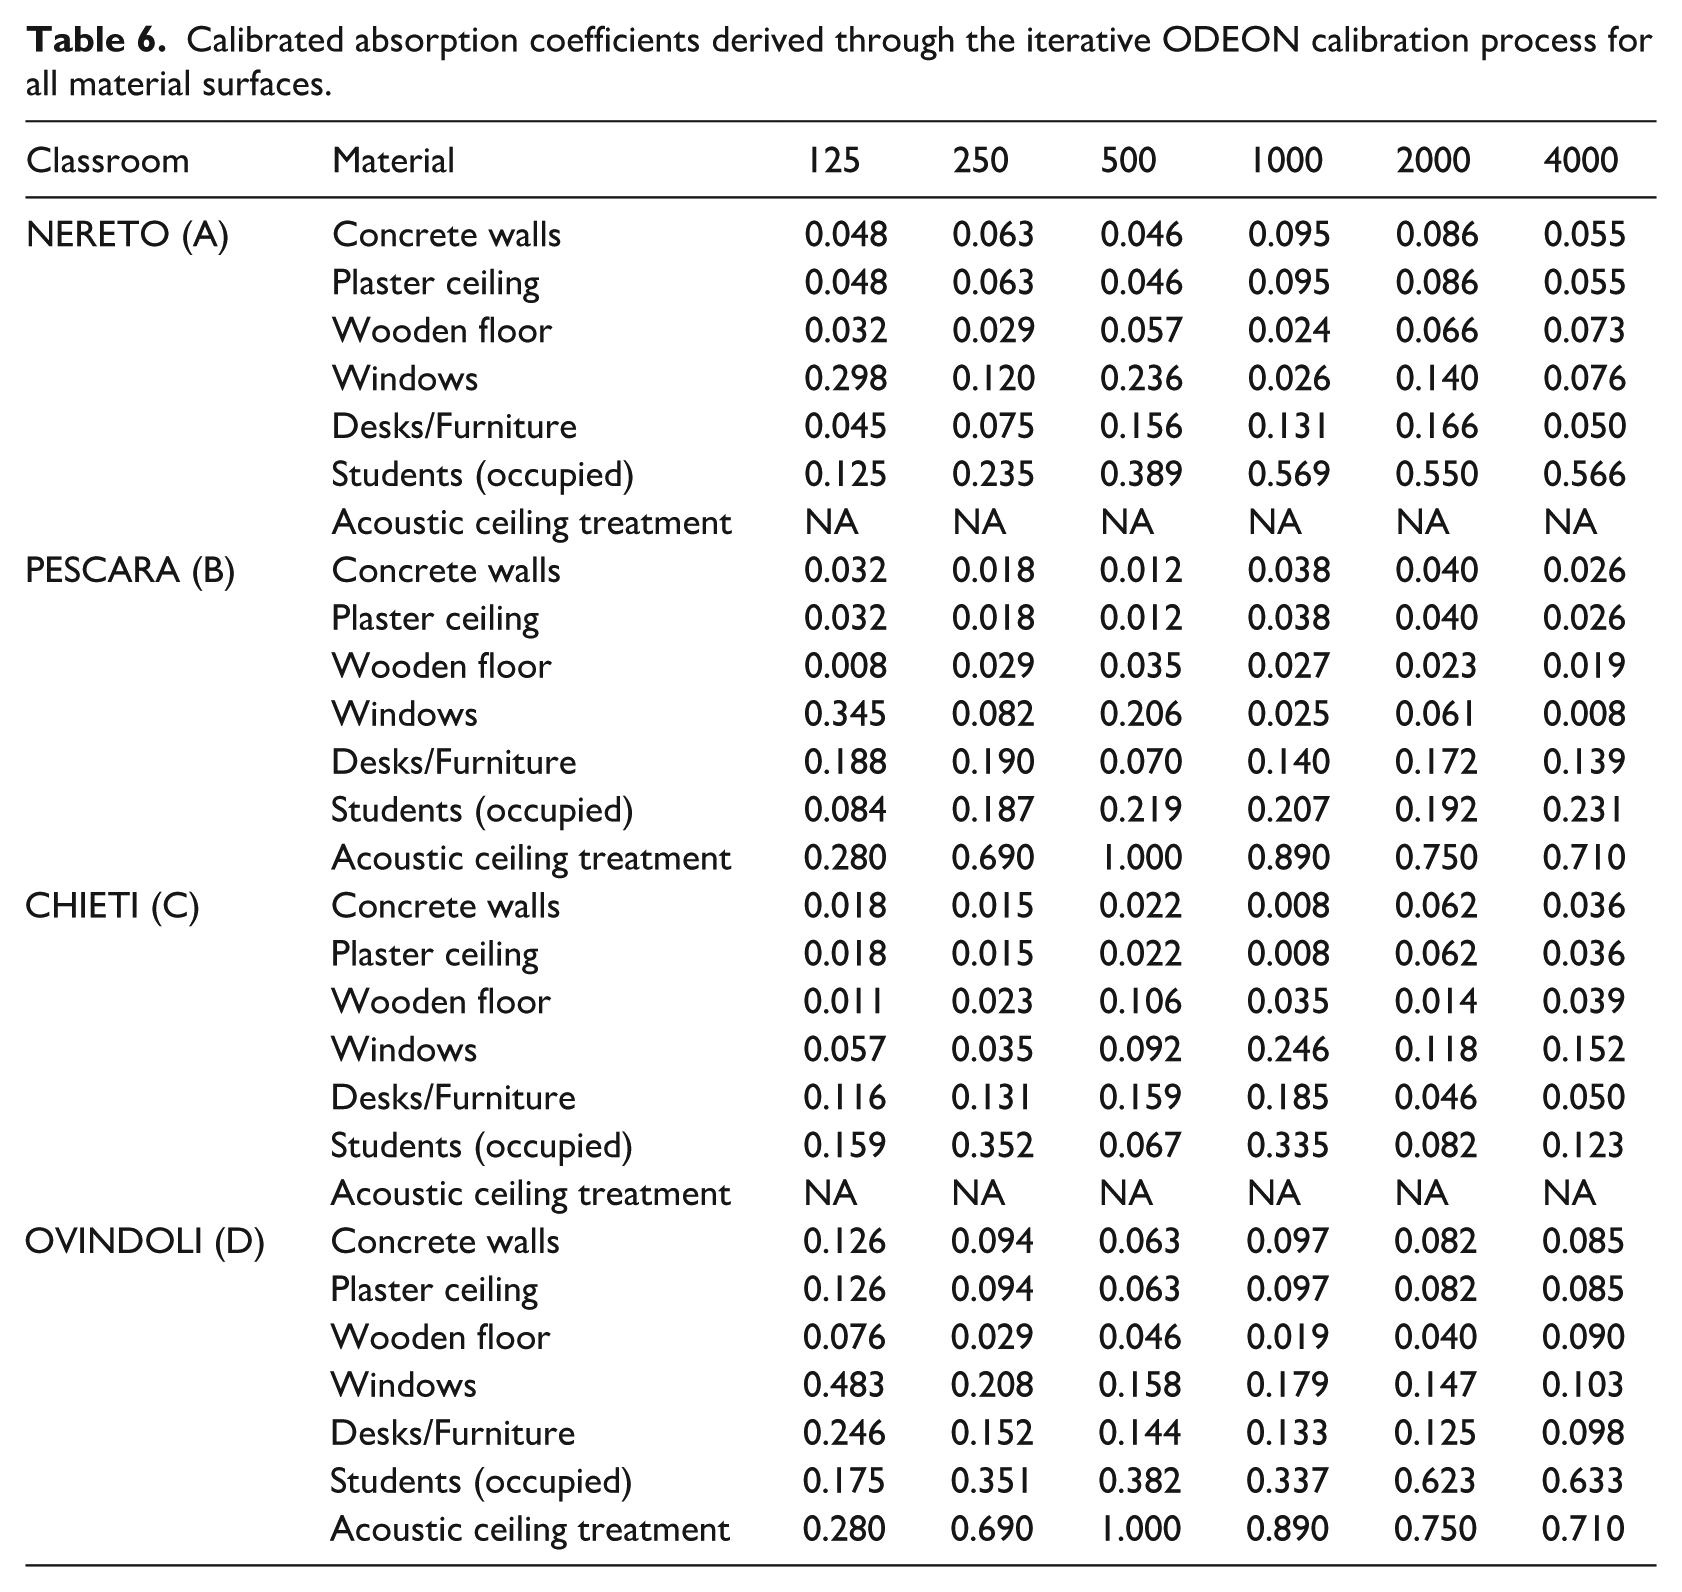
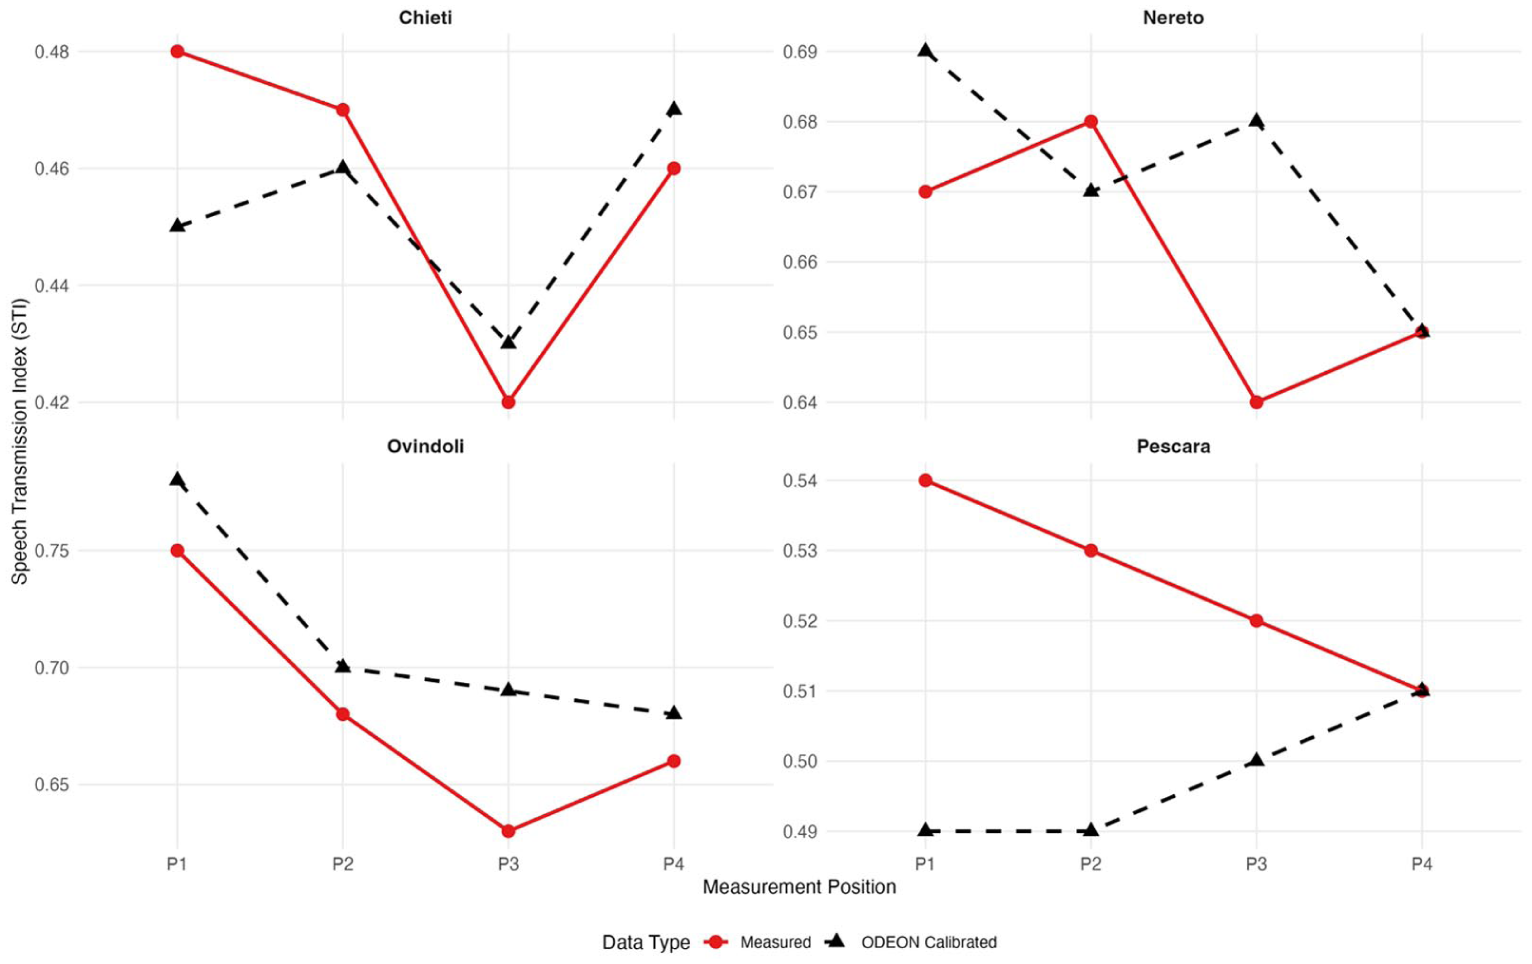
Figure 10 presents the comparative analysis between measured and ODEON-calibrated T30 values across all frequency bands for each classroom.
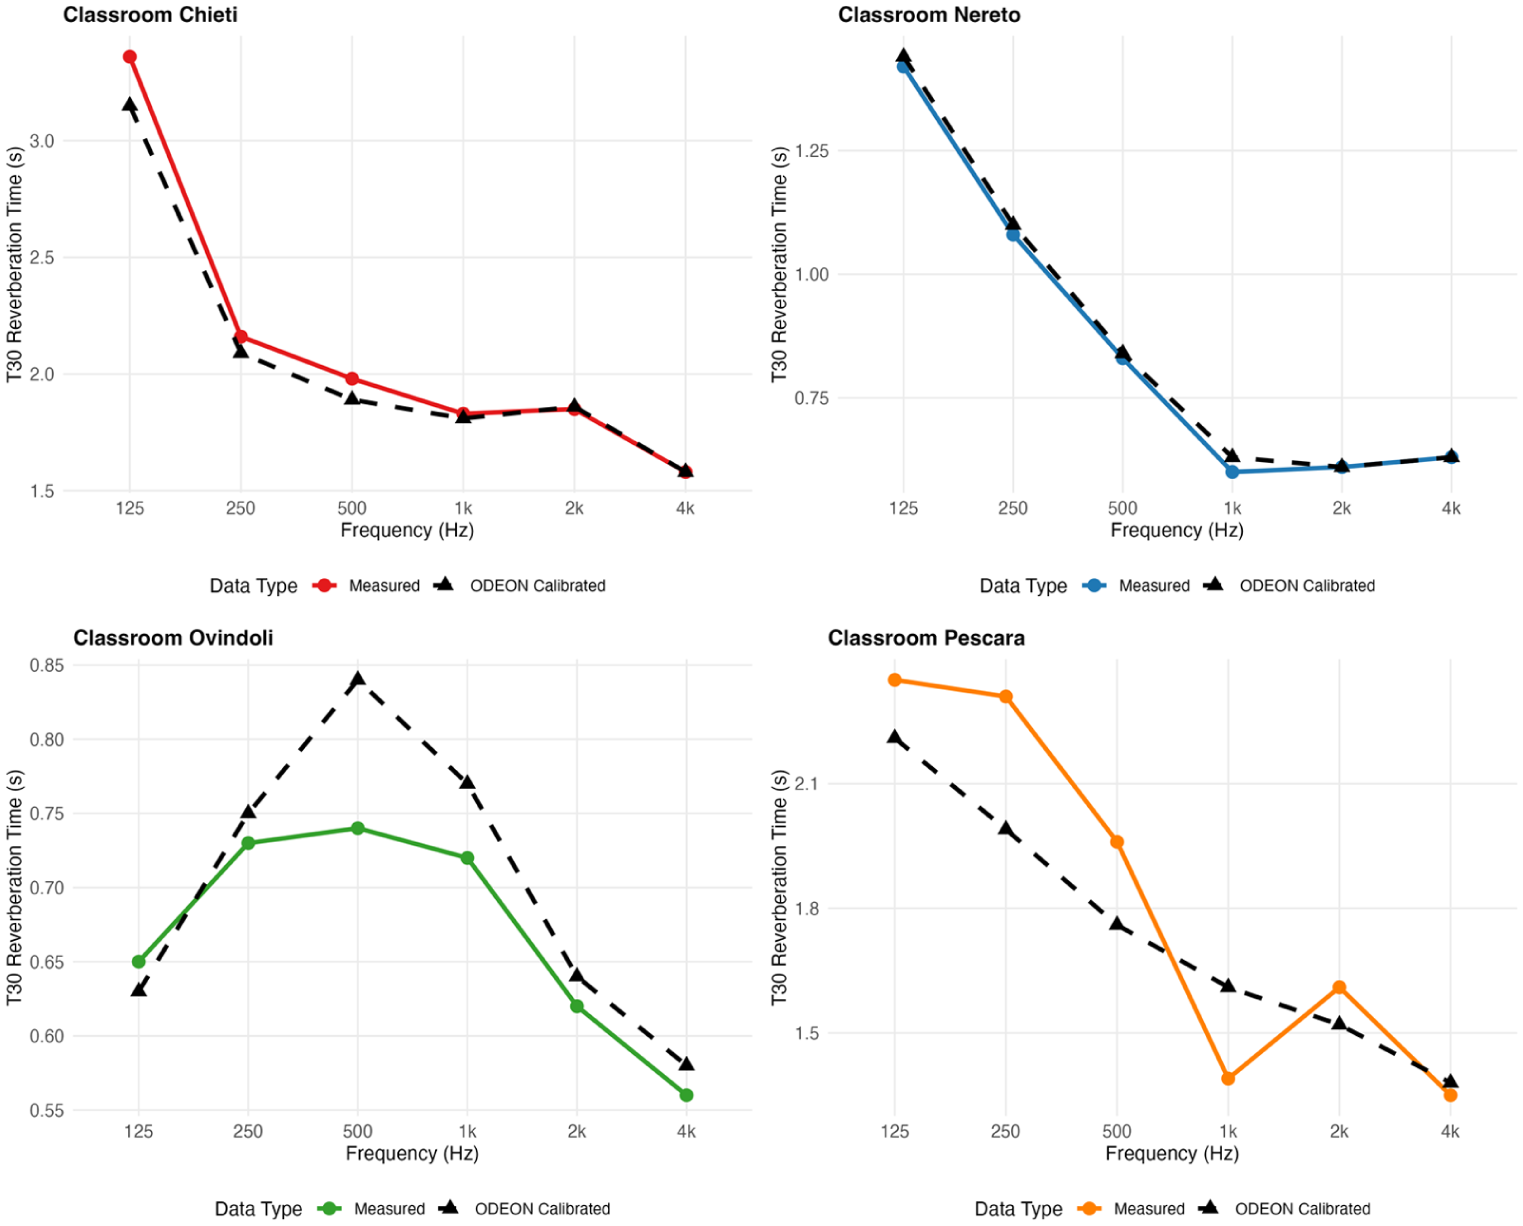
T30 measured versus ODEON calibration comparison.
Classroom-specific validation rates are: Classroom A achieved 83.3% (mean error 1.6%), Classroom C 83.3% (mean error 2.6%), Classroom D 66.7% (mean error 5.5%), and Classroom B 16.7% (mean error 8.9%, maximum error 15.8% at 1000 Hz).
The validation threshold of 5% relative error between measured and simulated T30 values adopted in this study is consistent with the Grade 1 accuracy requirements specified in ISO 3382-2, 27 which defines tolerance criteria for reverberation time predictions in ordinary rooms. This threshold represents a widely accepted benchmark in room acoustic modeling practice and ensures that calibrated models are suitable for reliable prediction of acoustic intervention outcomes. Classroom-specific analysis revealed distinct calibration performance characteristics reflecting the diverse acoustic conditions encountered across the educational environments.
Predictive uncertainty was assessed through the variability of calibration errors across frequency bands. For Classrooms A and C, mean errors of 1.6% and 2.6% respectively indicate robust model performance with low uncertainty across the full frequency spectrum. Classroom D achieved a mean error of 5.5%, attributable to the frequency-dependent behavior of the acoustic ceiling treatment, which required specialized absorption coefficient adjustment. Classroom B presented the highest predictive uncertainty, with a mean T30 error of 8.9% and a validation success rate of 16.7% across frequency bands, with a maximum individual error of 15.8% at 1000 Hz. This performance reflects the challenging acoustic conditions of the untreated high-reverberation environment, where strong modal behavior at low frequencies and diffuse-field breakdown reduce the reliability of geometrical acoustics predictions. While this limitation is acknowledged, it is consistent with known constraints of ray-tracing based methods in highly reverberant spaces documented in the literature, 36 and the calibrated model was nonetheless employed conservatively for intervention simulation, with results interpreted in terms of directional trends rather than absolute values.
Multi-parameter validation was conducted through complementary Speech Transmission Index assessment across multiple receiver positions within each classroom (Figure 11), confirming model accuracy beyond reverberation time alone. Mean STI errors remained below 5% across all four environments providing independent confirmation of model reliability for speech intelligibility prediction, the parameter most directly linked to the perceptual outcomes assessed in this study.
STI measured versus ODEON calibration comparison.
Nereto classroom STI validation demonstrated mean error of 2.7% across four measurement positions, with calibrated values ranging from 0.65 to 0.69 compared to measured values of 0.64–0.68. The close correlation confirms accurate modeling of speech transmission characteristics essential for language learning effectiveness.
Pescara classroom achieved moderate STI validation accuracy with mean error of 5.2%, validating the capacity of the calibrated model to predict speech intelligibility degradation in high-reverberation environments. Measured STI values of 0.51–0.54 compared with calibrated predictions of 0.49–0.51, confirming substantial speech intelligibility challenges requiring acoustic intervention.
Chieti classroom STI validation revealed mean error of 3.2%, with measured values of 0.42–0.48 accurately predicted by calibrated simulations ranging from 0.43 to 0.47. The close correlation validates model accuracy for predicting severe speech intelligibility degradation in untreated high-reverberation educational environments.
Ovindoli classroom demonstrated the benefits of acoustic treatment through STI validation, with mean error of 4.9% and measured values of 0.63–0.75 closely matched by calibrated predictions of 0.68–0.78. The enhanced speech intelligibility resulting from ceiling treatment was accurately captured in the calibrated model, providing confidence for acoustic intervention effectiveness prediction.
Statistics and proposed corrections
This section integrates the perceptual data analysis with quantitative normalization to determine priority levels for acoustic interventions. Based on normalized scores derived from students’ subjective assessments—specifically Speech Transmission Index (STI), acoustic comfort, and perceived disturbance—a unified Priority Score was calculated for each classroom.
Although STI is an objective measurement while comfort and disturbance are subjective survey means, commensurability is achieved through Min-Max normalization, which rescales all three components to a dimensionless [0–1] range prior to averaging. This normalization removes the original units and scales, rendering the three components directly comparable within the composite index.
This composite index offers a statistically grounded method to rank spaces requiring urgent correction.
The Priority Score was computed as the average of normalized, inverted values for STI and comfort (where lower values indicate greater urgency), and a direct normalization of disturbance scores. Each factor was rescaled to a 0–1 range:
- STI (inverted): Low STI indicates poor intelligibility → higher intervention priority
- Comfort (inverted): Low comfort perception → higher intervention priority
- Disturbance (direct): High disturbance perception → higher intervention priority
Normalization 43 was done using Min-Max scaling (see equation (1)):

For inverted scales, the formula used was shown in equation (2):

The priority Score was calculate according to equation (3):

Equal weighting of the three components was adopted as a deliberately neutral baseline, consistent with exploratory composite index construction where no prior empirical evidence supports differential weighting. To assess the robustness of the priority ranking to this assumption, a sensitivity analysis was conducted testing three alternative weighting schemes: STI-dominant (STI weight = 0.6, comfort and disturbance = 0.2 each), comfort-dominant (comfort weight = 0.6, STI and disturbance = 0.2 each), and disturbance-dominant (disturbance weight = 0.6, STI and comfort = 0.2 each). Across all configurations, Classroom B consistently ranked first (highest intervention priority) and Classroom C consistently ranked last, confirming that the priority ranking is robust to weighting assumptions.
Figure 12 presents the comprehensive analysis integrating ODEON simulation results with students’ subjective perceptions across the four investigated classrooms. The analysis reveals both expected correlations and significant discrepancies that challenge traditional acoustic assessment approaches.
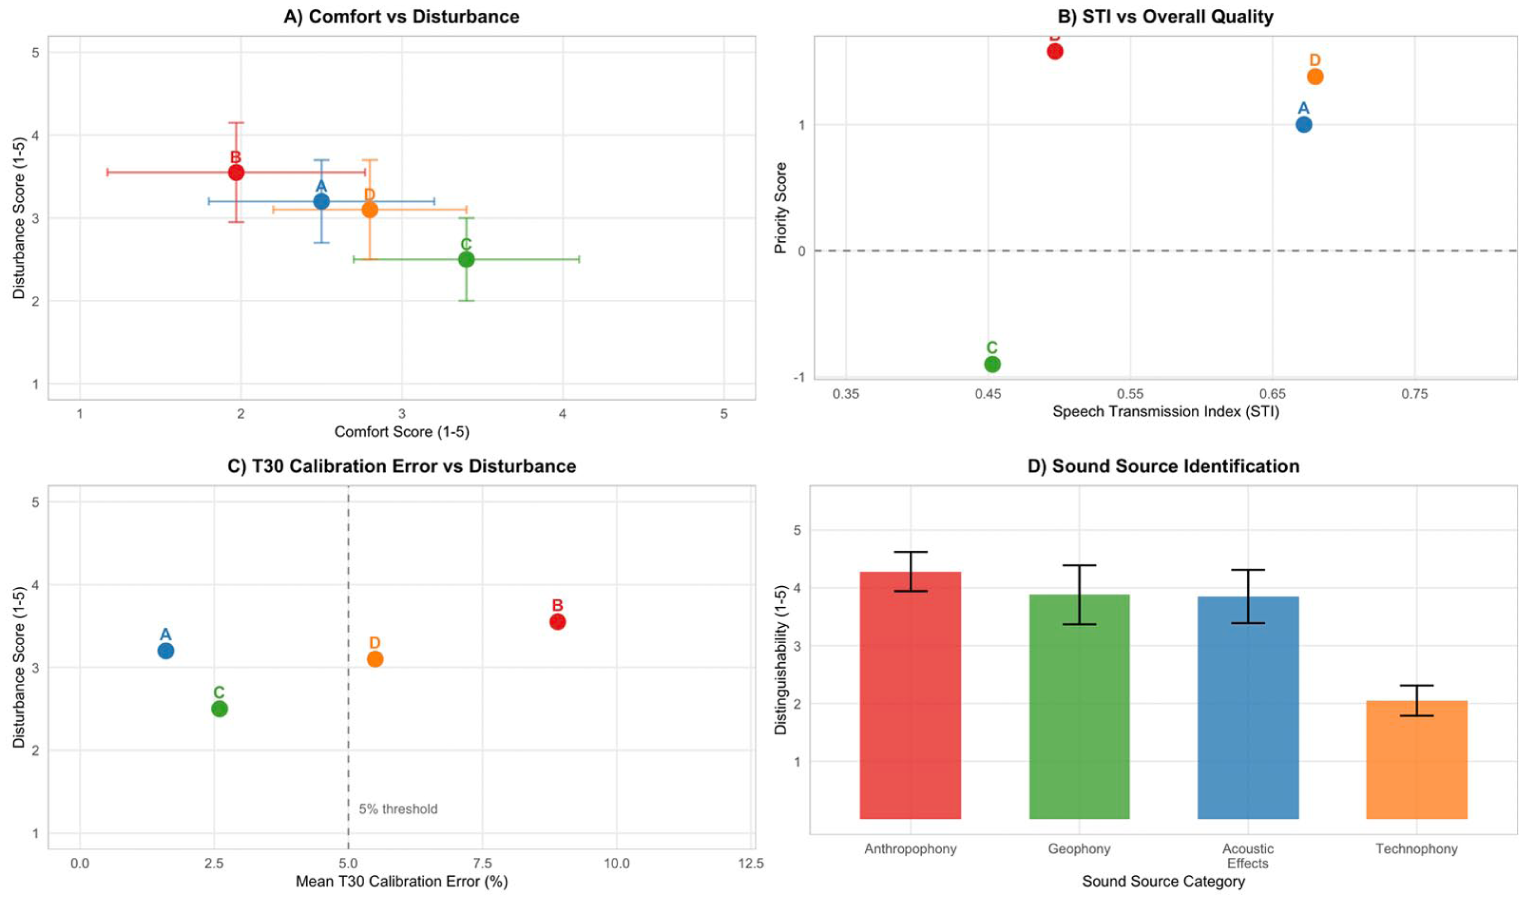
Integrated analysis across four classrooms. Panel (A): Comfort versus Disturbance scores (scale 1–5). Panel (B): STI versus Priority Score (from Table 7); no trend line fitted (n = 4). Panel (C): Mean T30 calibration error (%) versus Disturbance score; dashed vertical line indicates the 5% ISO 3382-2 Grade 1 threshold. Panel (D): Sound source distinguishability by category.
Panel (A) demonstrates a clear inverse relationship between comfort and disturbance scores across all classrooms.
The relationship between objective Speech Transmission Index (STI) values and perceived overall quality (Panel (B)) showed a moderate correlation, suggesting that speech intelligibility is an important but not exclusive driver of acoustic satisfaction in educational spaces.
Panel (C) reveals an intriguing finding regarding model accuracy and perception. The T30 calibration error, representing the discrepancy between measured and ODEON-simulated reverberation times, showed varying relationships with disturbance scores.
The soundscape analysis (Panel (D)) identified anthropophony (human-generated sounds) as the dominant perceived sound source in the classroom environment (4.28 ± 0.36), significantly higher than geophony (3.88 ± 0.51), acoustic effects (3.85 ± 0.53), and technophony (2.05 ± 0.26) (one-way ANOVA on classroom-level means, n = 4 per category, F(3,12) = 15.8, p < 0.01; see Section 3 preamble for interpretive caveats). It is acknowledged that this analysis operates at the classroom aggregate level rather than on individual student responses, and should therefore be interpreted as exploratory and descriptive of relative sound source prominence rather than as a confirmatory inferential result. A fully specified multilevel model accounting for the nested structure of students within classrooms would be methodologically preferable but is underpowered at the classroom level given the case-study design. This finding emphasizes that human activity noise, rather than technical or environmental sounds, represents the primary acoustic challenge in these educational spaces.
Table 7 shows the results of the perception-based acoustic intervention priority ranking across classrooms, highlighting the relative urgency for corrective measures based on integrated student feedback and objective acoustic data for each classroom.
Perception-based acoustic intervention priority.
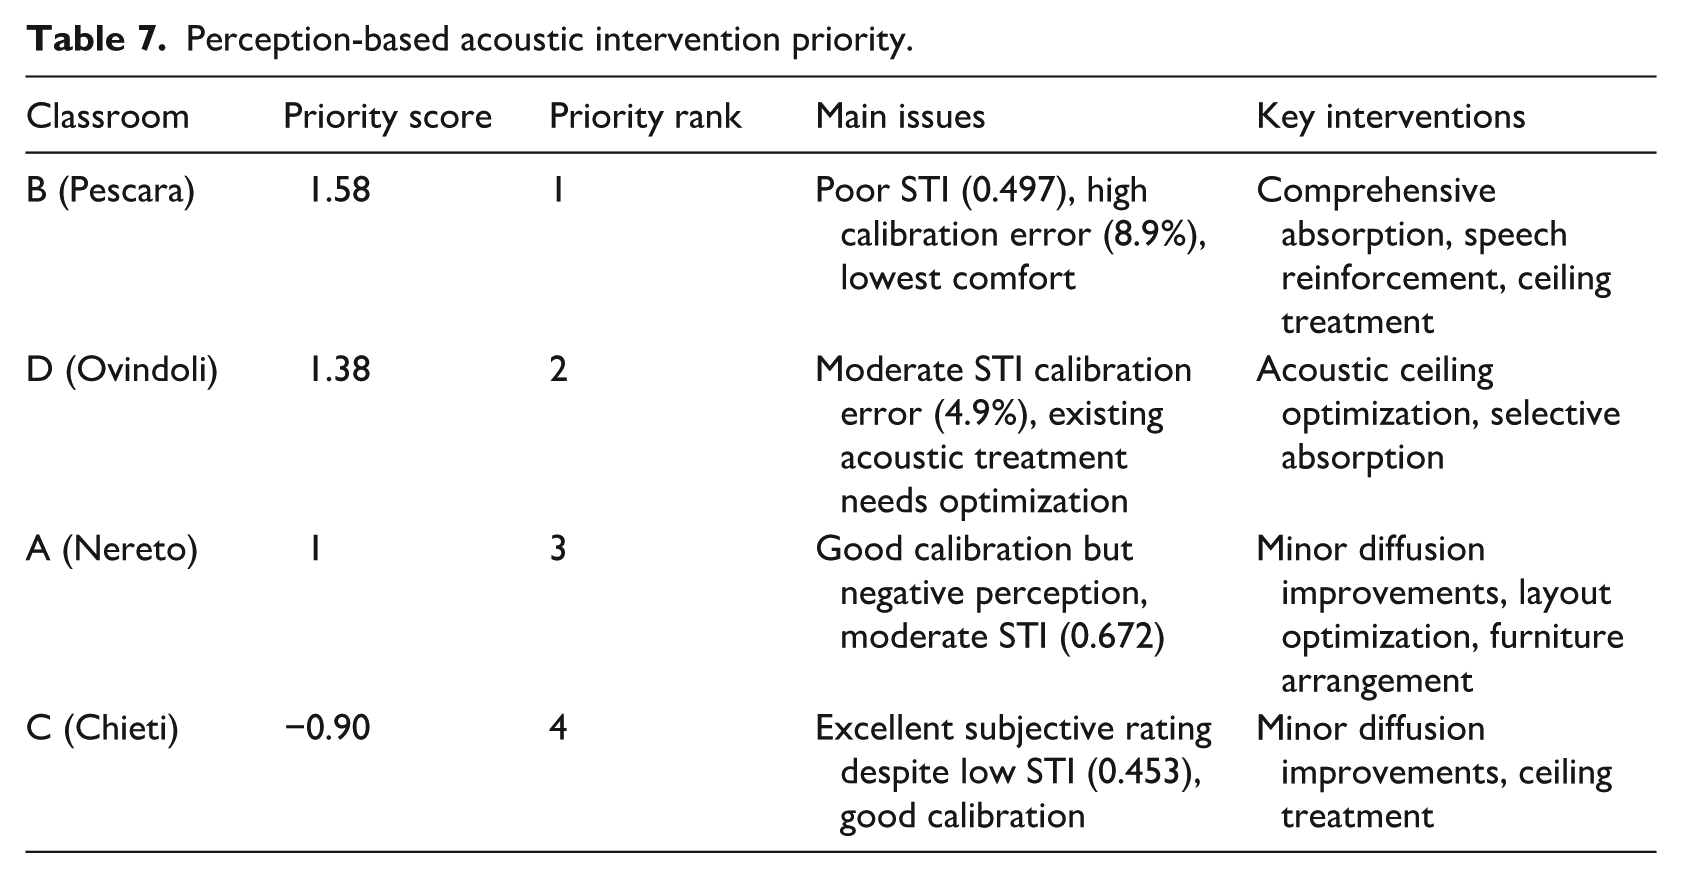
The ranking reveals that Classroom B (Pescara) requires the most urgent intervention, with the highest intervention priority score of 1.58, primarily due to poor speech intelligibility (STI = 0.497), significant calibration challenges (8.9% T30 error), and the lowest comfort ratings. Conversely, Classroom C (Chieti) shows the lowest intervention priority (−0.90), demonstrating that despite having the lowest STI values, the space achieves positive subjective ratings, requiring only minor acoustic refinements.
A negative priority score, as observed for Classroom C (−0.90), indicates that the classroom presents above-average STI performance relative to the sample, combined with high student comfort and low disturbance. Within this framework, a negative score should be interpreted as “active preservation priority”: the existing acoustic conditions are satisfactory from the users’ perspective and interventions should aim to maintain rather than modify them.
Based on the statistical analysis, interventions are categorized into three priority levels:
- High priority (Scores > 1.0): comprehensive acoustic treatment including sound absorption materials, speech reinforcement systems, and fundamental reverberation control to address significant acoustic deficiencies.
- Medium priority (Scores 0.5–1.0): targeted interventions focusing on specific acoustic optimization, selective treatments, and calibration refinement.
- Low priority (Scores < 0.5): minor adjustments involving acoustic fine-tuning, layout optimization, and preservation of successful acoustic environments.
This evidence-based approach ensures optimal resource allocation while addressing the most critical acoustic environments first, prioritizing spaces where objective measurements align with negative subjective experiences, thus maximizing the educational benefit per intervention investment.
To provide comprehensive visualization of the proposed acoustic interventions, detailed 3D models were developed for each classroom. These models illustrate the specific placement, dimensions, and materials of acoustic treatments designed to address the perceptual and technical issues identified in the previous analyses.
The intervention design was prioritized based on a comprehensive scoring system that integrated acoustic measurements, calibration accuracy, and student perception data. The priority ranking guided the scope and intensity of interventions for each classroom.
Figure 13 show the four classroom 3D Model with acoustic interventions:
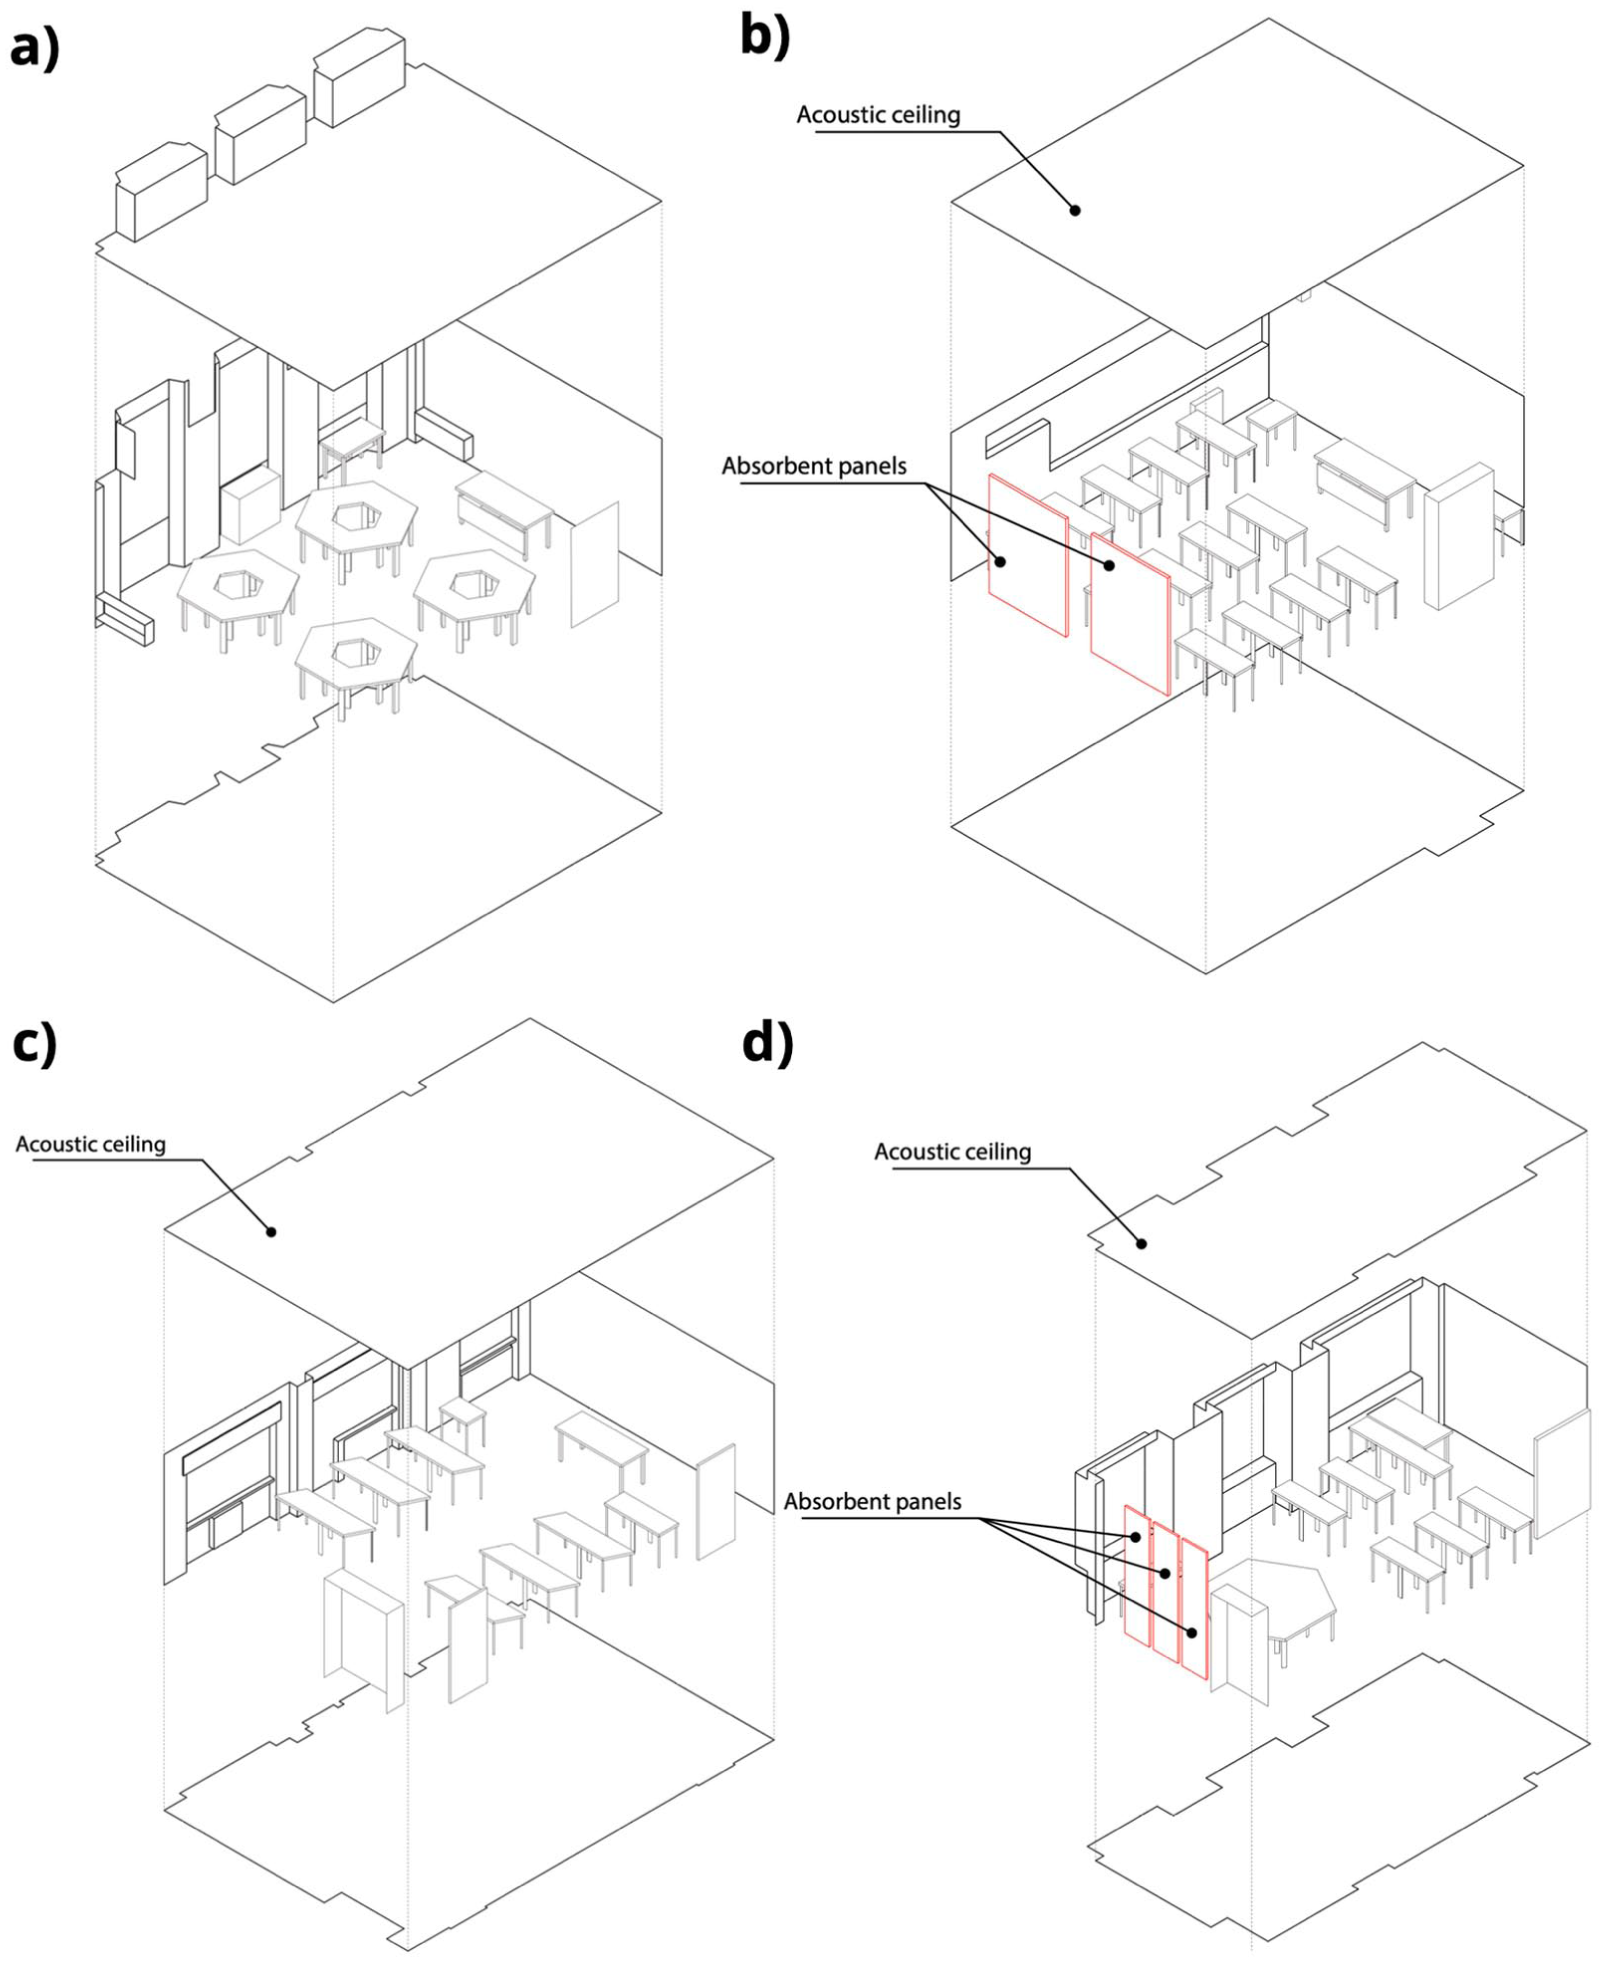
Three-dimensional models of four classrooms showing prioritized acoustic interventions. Each classroom model displays the specific acoustic treatment solutions determined through the comprehensive scoring system that integrated acoustic measurements, calibration accuracy, and student perception data ((a) Nereto; (b) Pescara; (c) Chieti; (d) Ovindoli).
Model validation
To validate and quantify the effectiveness of the proposed acoustic interventions, detailed simulation scenarios were developed and executed using the ODEON acoustic modeling software.
The simulation scenarios in ODEON were designed to validate acoustic interventions that were directly informed by the integrated analysis of both objective measurements and students’ subjective perceptions. This approach underscores the critical role of perception in defining effective acoustic corrections, ensuring that technical improvements align with users’ actual experience.
The simulations aimed to verify not only improvements in traditional acoustic metrics like Speech Transmission Index (STI) and reverberation times (RT), but also to confirm that these technical gains corresponded with enhanced acoustic comfort and reduced disturbance as reported by students. This perceptually driven simulation process highlights the necessity of integrating human experience into the design and evaluation of acoustic interventions.
By focusing on scenarios where perception indicated specific issues—such as high disturbance despite acceptable STI—ODEON models tested targeted corrections that may otherwise be overlooked in purely technical assessments. The results reinforce that acoustic comfort in educational environments depends on addressing both measurable sound parameters and subjective user feedback.
Figure 14 illustrates the comprehensive comparison between calibrated baseline conditions and design project outcomes across all classrooms for T30.
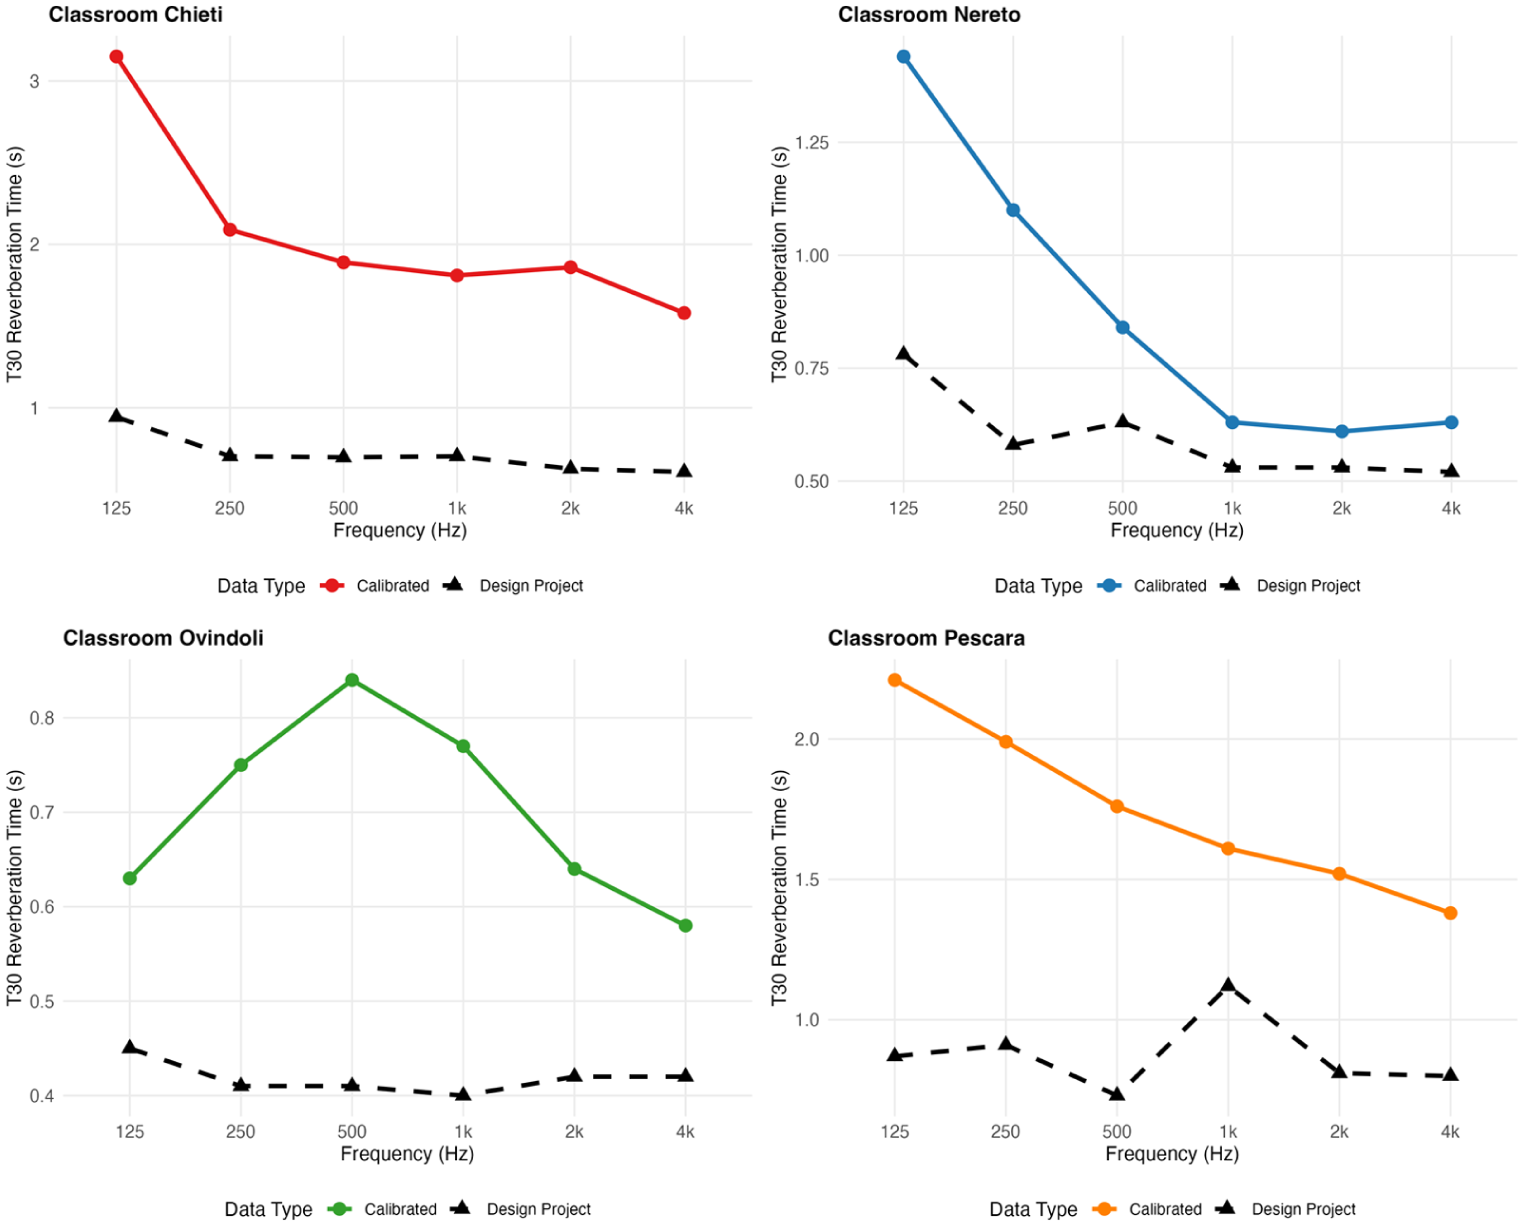
T30 calibrated versus design project comparison.
The simulation results demonstrate significant acoustic improvements across all tested scenarios:
- Nereto: Average T30 reduction of 32.4% across all frequencies, with the most significant improvements in mid-frequencies (500–1000 Hz) where student complaints were highest;
- Pescara: Average T30 reduction of 42.1%, addressing the excessive reverberation that correlated with high disturbance ratings;
- Chieti: Average T30 reduction of 62.8%, the most dramatic improvement reflecting the severe acoustic conditions identified through both measurements and perceptions;
- Ovindoli: Average T30 reduction of 45.2%, optimizing an already well-performing space based on fine-tuning guided by student feedback.
Figure 15 illustrates the comprehensive comparison between calibrated baseline conditions and design project outcomes across all classrooms for Speech transmission index.
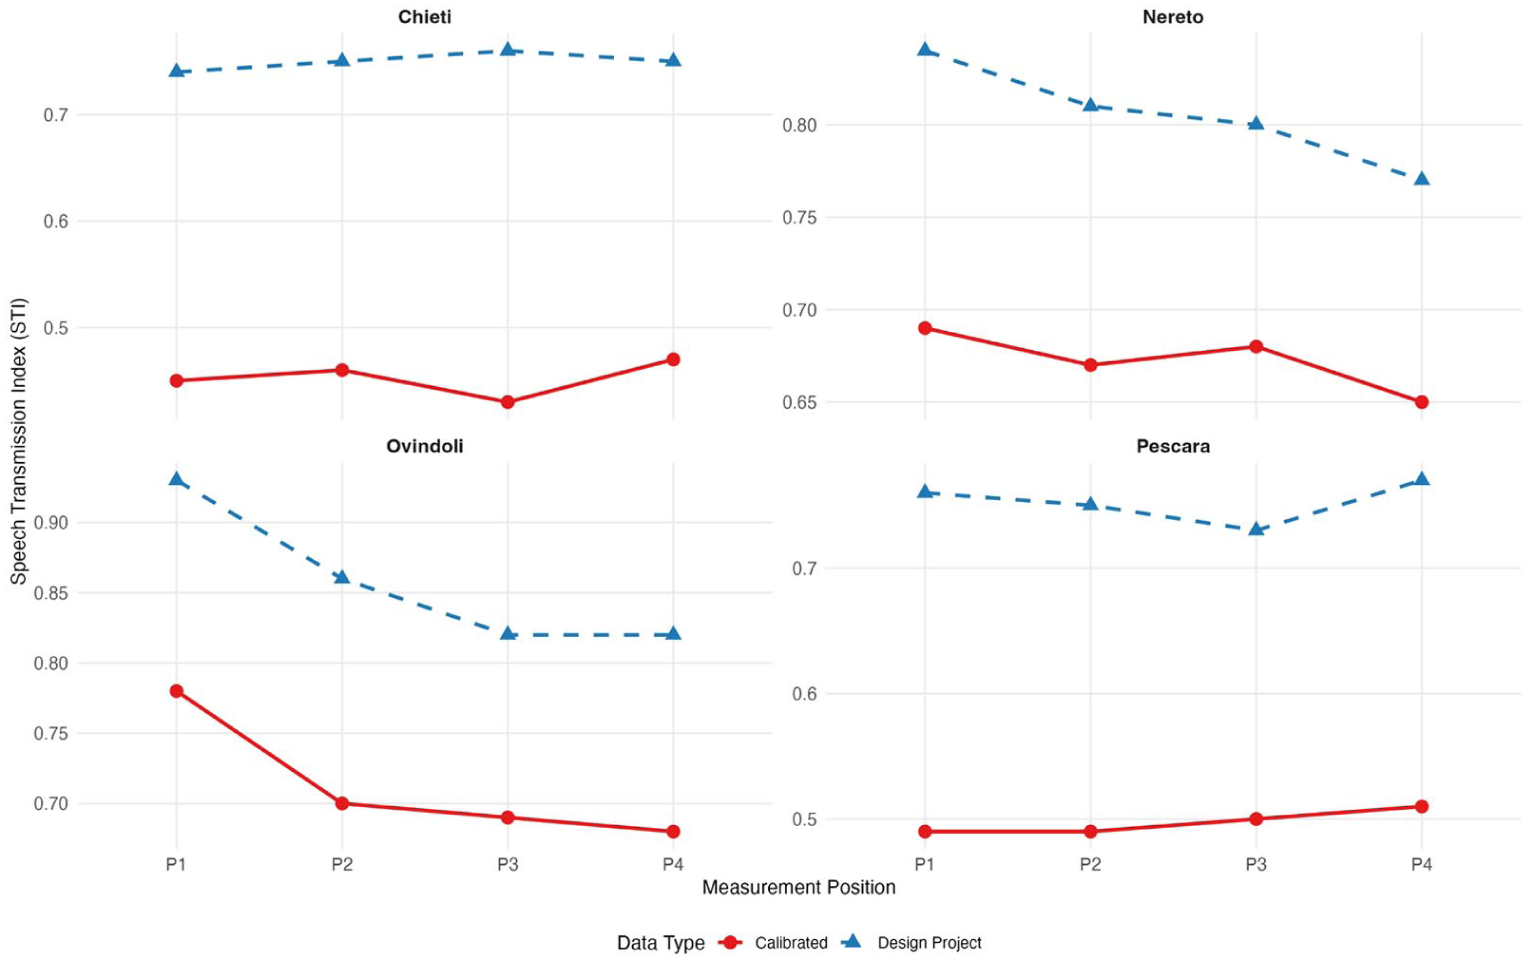
STI calibrated versus design project comparison.
The STI improvements validate the effectiveness of the perceptually-guided design approach:
- Nereto: STI improvement from 0.67 to 0.81 (+20.9%), elevating speech intelligibility from “Good” to “Excellent” classification;
- Pescara: STI improvement from 0.50 to 0.75 (+50.0%), transforming the space from “Fair” to “Excellent” acoustic quality;
- Chieti: STI improvement from 0.45 to 0.75 (+66.7%), achieving the most significant enhancement correlating with the highest initial disturbance levels;
- Ovindoli: STI improvement from 0.71 to 0.86 (+21.1%), optimizing an already good acoustic environment based on nuanced perceptual feedback.
The ODEON simulation scenarios confirmed that acoustic interventions informed by student perceptions achieve superior outcomes compared to purely technical approaches. The design project implementation resulted in:
- 100% classroom improvement rate for T30 reverberation times across all frequency bands
- Comprehensive STI enhancement with all classrooms achieving “Good” to “Excellent” speech intelligibility ratings
- Targeted problem resolution addressing specific issues identified through perceptual assessments
This validation underscores the critical importance of integrating human experience into acoustic design processes, demonstrating that technical excellence in educational acoustics requires attention to both measurable parameters and user perception.
Conclusion
This research proposes a proof-of-concept methodology for educational acoustic design by demonstrating that effective acoustic interventions must integrate both objective technical measurements and subjective student perceptions to achieve optimal learning environments. The comprehensive analysis of four Italian classrooms revealed that traditional acoustic assessment approaches, while technically sound, may fail to capture the full complexity of acoustic comfort as experienced by students in their daily learning activities.
The study’s most significant finding lies in the validation of student perception as a critical diagnostic tool that can identify acoustic deficiencies overlooked by conventional measurement protocols. However, this finding should be interpreted cautiously given potential confounding factors including student age, occupancy density, teaching activity type, and architectural characteristics that were not controlled for in the current study design. Conversely, Nereto demonstrated good technical performance with moderate STI of 0.672, yet students expressed negative perceptions, highlighting the limitations of purely objective assessment methodologies.
The development and application of the priority scoring system proved essential in optimizing intervention strategies across diverse acoustic conditions.
The calibration of ODEON acoustic models achieved variable accuracy across the four classrooms, with T30 validation success rates ranging from 16.7% for the most challenging high-reverberation environment (Classroom B) to 83.3% for Classrooms A and C. The limitations of the Classroom B model were explicitly acknowledged and results interpreted conservatively as directional trends.
The implementation of targeted interventions based on integrated assessment yielded meaningful improvements across all priority levels. Pescara’s comprehensive intervention achieved STI improvements from 0.50 to 0.75, representing a 50% enhancement that elevated the space from “Fair” to “Excellent” acoustic classification. Ovindoli’s optimization strategy achieved STI improvements from 0.71 to 0.86 while building upon existing acoustic treatments. Nereto’s perception-focused interventions addressed the disconnect between acceptable technical parameters and negative student experience, while Chieti’s minimal intervention approach preserved positive student satisfaction while achieving modest technical gains.
The research validates that acoustic comfort in educational environments emerges from complex interactions between measurable sound parameters, spatial characteristics, pedagogical activities, and individual perceptual responses. The successful integration of objective measurements with subjective assessments creates a more complete understanding of acoustic quality that transcends traditional technical boundaries, enabling designers to address both measurable acoustic deficiencies and experiential acoustic issues reported by actual classroom users.
The methodological framework developed through this research provides a replicable template for educational acoustic assessment and intervention design. The combination of standardized acoustic measurements, systematic student perception surveys, rigorous ODEON modeling, and priority-based intervention strategies creates a comprehensive toolkit for acoustic professionals working in educational environments. The validation of this methodology across four diverse classroom typologies demonstrates its applicability across varying architectural configurations, construction materials, and educational contexts.
The implications for educational policy and design practice are profound. The research establishes that optimal learning environments require acoustic solutions that address both technical performance criteria and user experience expectations. This finding suggests that current acoustic standards and guidelines should be supplemented with systematic perception assessment protocols to ensure that designed spaces truly support effective teaching and learning activities.
In the Italian context, UNI 11532-2:2020 establishes objective thresholds for reverberation time, background noise, and STI in school buildings, but does not incorporate requirements for perceptual validation or user-reported comfort. Similarly, the CAM 2025 minimum environmental criteria framework addresses acoustic performance through technical compliance indicators without systematic post-occupancy perceptual verification. The findings of this study suggest that future revisions of these normative instruments, and analogous European frameworks, should consider integrating perception-based assessment protocols consistent with the ISO 12913 soundscape series as a complementary verification layer alongside objective measurement campaigns.
This research suggests that the future of educational acoustic design lies in the thoughtful integration of technical excellence with human experience, ensuring that acoustic interventions not only meet measurable performance criteria but also create environments where students and teachers can thrive in their educational endeavors. The validated methodology provides both the theoretical foundation and practical tools necessary to achieve this integration, establishing a new standard for educational acoustic design that prioritizes both technical accuracy and user satisfaction in creating optimal learning environments.
Several limitations of this study must be explicitly acknowledged. The case-study design based on four classrooms limits the statistical power and generalizability of the findings to the broader population of Italian and international school buildings. The results should therefore be interpreted as demonstrating the feasibility and internal consistency of the proposed methodology rather than as established generalizable conclusions. Future work should address these limitations through: (1) validation across a larger sample of Italian school buildings spanning different construction typologies and climatic regions; (2) multilevel statistical modeling requiring a minimum of 15–20 classrooms for adequate inferential power; (3) integration of psychoacoustic parameters as empirically weighted components of the priority scoring formula; (4) longitudinal post-occupancy evaluation of implemented interventions to verify that simulated STI improvements translate into sustained perceptual comfort gains; and (5) extension to other educational typologies including university lecture halls and open-plan learning spaces.
Footnotes
Funding
The authors disclosed receipt of the following financial support for the research, authorship, and/or publication of this article: This research was funded by the project “necessARIA-Need for efficient strategies of air exchange for health of occupants in school buildings” (PNC-National Plan complementary to the PNRR; PNC Ministry of Health; E.1 Health-environment-biodiversity-climate) by the Ministry of Health.
Declaration of conflicting interests
The authors declared no potential conflicts of interest with respect to the research, authorship, and/or publication of this article.