
Abstract
Background:
While spinal cord (SC) attacks of neuromyelitis optica spectrum disorder (NMOSD) are often devastating, signs predictive of their poor clinical outcome have been elusive until now, except for the delay in initiating plasma exchange (PE).
Objective:
We studied the correlation between conventional non-standardized magnetic resonance imaging (MRI) parameters, PE treatment, and clinical data obtained at nadir and recovery.
Methods:
Retrospective study of first SC attacks of NMOSD.
Results:
Sixty-nine Afro-Caribbean NMOSD patients were included (aquaporin-4 (AQP4) antibodies positive in 65%). Median nadir and residual expanded disability status score (EDSS) were, respectively, 7.5 and 4.0. In bivariate analysis, all conventional MRI parameters were correlated with nadir and residual EDSS. In multivariate analysis, nadir EDSS correlated with lesion length (p = 0.022) and edema (p = 0.019), whereas residual EDSS correlated with T1w (T1-weighted) hypointense signal (p = 0.003). Gadolinium enhancement was not associated with outcome.
Conclusion:
A specific pattern of lesions in conventional MRI data is differentially associated with nadir and residual EDSS. Lesions associated with poor prognosis should prompt highly efficient treatment.
Introduction
Neuromyelitis optica spectrum disorder (NMOSD) attacks are often associated with severe impairment and poor recovery. However, the severity of the attacks varies, ranging from hiccup or minor sensory signs remitting spontaneously to cervical tetraplegia requiring ventilation assistance and sometimes death. Clinical recovery is also variable in patients reaching the same clinical nadir, as exemplified by the dispersion of standard error in recovery expanded disability status score (EDSS). 1 Although plasma exchange (PE) and steroids given in the earliest days after clinical onset may improve the recovery rate, about half of optimally treated patients will not recover their basal clinical level, and some of them may not recover it at all.1–3 Apart from early treatment and preservation of tendon reflexes,4–6 no predictive parameter is able to predict poor clinical outcome reproductively. A recent study correlated lesion length on magnetic resonance imaging (MRI) with EDSS at nadir and at recovery, 7 but it was insufficiently powered to detect a possible association with other conventional MRI parameters.
We studied the correlation of easily available MRI parameters with PE treatment and clinical data obtained at nadir and recovery. To avoid any possible confounding bias related to history of relapses, we focused on the index spinal cord (SC) attack in a large monocenter cohort.
Methods
Patient sample
We considered all patients positive for anti-AQP4 (aquaporin-4) antibody when available and used the latest NMOSD criteria for patients with unavailable or negative antibodies. 8
Inclusion and exclusion criteria
All patients undergoing a first SC attack between 1998 and 2017 were retrospectively considered and included only if the following criteria were met: detailed clinical status data before attack, during clinical nadir, and at 6-month follow-up, and MRI available within 8 weeks after clinical onset. Attack severity was not considered for inclusion. Patients were excluded if MRI data at the time of the first SC attack or last clinical follow-up were unavailable, or if SC relapse occurred in the first 6 months.
Data collection
Medical records were reviewed and demographic data were collected—sex; age at relapse; preceding number of spinal or optic neuritis relapses; anti-aquaporin-4 antibody (AQP4-Ab) status; final clinical diagnosis; time to PE initiation; EDSS before, during nadir, and late follow-up (⩾6 months); and immunosuppressive drugs given prior to the attack or started at the time of the attack. Drugs discontinued a year or more before the index attack were excluded owing to their low probability of affecting the course of the relapse. Since these clinical data were recorded prospectively, they were available in all cases. Sera were tested for anti-AQP4 at the INSERM U842 laboratory of Lyon, France, by a cell-based assay on live cells transfected with AQP4. 9
Clinical assessment
We collected EDSS at the time of the attack and at month 6 (nadir and residual EDSS). EDSS was reported by a senior neurologist (PC), and data were directly available from clinical records. Baseline EDSS before the first attack was assumed to be normal in all patients. Since the study concerned the SC, EDSS were recalculated to exclude the optical system component. 7 For example, EDSS of a blind patient was set to 0 instead of 4.
Radiological assessment
Most of the MRI scans were acquired in our center, but multiple upgrades were done between 1998 and 2017, so sequence parameters were for routine clinical use but were not standardized for the purpose of the study. All MRI scans were performed on a 1.0 Tesla magnet or higher, and included sagittal T1-weighted (w), T2w, and post-contrast T1w images. Study parameters were kept simple and unambiguous so that they were less dependent on the availability of MRI machines. Axial images were occasionally available and were not considered. MRI scans were all reviewed retrospectively by an examiner (MB) blind to the clinical data for the presence or absence of cord edema, defined as sagittal cord enlargement of the involved level (bulbar, cervical C1–C7, thoracic T1–T12, or mixed), post-contrast enhancement (whatever the enhancement intensity), and T1w hypointense signal (defined as a signal apparently lower inside the core lesion as compared to normal tissue). 7 Examples of MRI with and without T1w hypointense signal are provided in Figure 1. Lesion length was approximated to the number of adjacent vertebral bodies from the highest to lowest level of T2w hyperintense signal. SC MRI data prior to the included index attack were assumed to be normal.
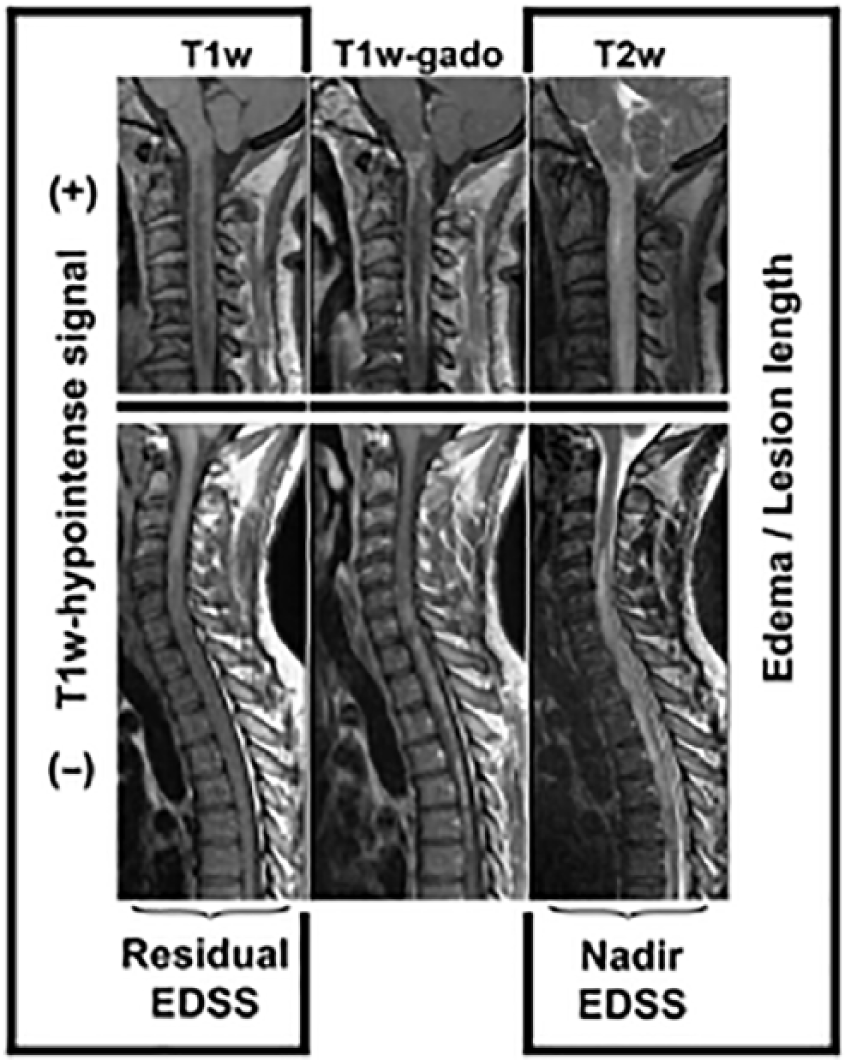
Relation between MRI parameters with clinical prognosis. Sagittal cord MRI of two typical cases of NMOSD attacks. Both patients demonstrate longitudinally extended lesions with edema and contrast uptake. Upper row: cervical attack with large central T1w hypointense signal. Lower row: cervico-thoracic attack without T1w hypointense signal. Sagittal T1w, T1w gadolinium-enhanced, and T2w sequences are depicted in columns. T1w hypointense signal is strongly associated with poor residual EDSS, whereas edema and lesion length in T2w sequences are associated with nadir EDSS. Post-contrast T1w sequences are not associated with prognosis in multivariate analysis.
Statistical analysis
Data are n (%), mean (standard deviation (SD)), or median (interquartile range (IQR)). Correlation between disability score and lesion length was assessed using a Spearman coefficient. Fisher’s test was used to compare qualitative variables. To analyze the interaction between qualitative and quantitative variables, we used the Satterthwaite test. PE were considered as binary values (done/not done) but were not stratified in terms of delay 2 due to small population. Collinearity and interaction between variables were checked. We performed an exploratory analysis using bivariate and multivariate linear regression analysis. We considered p values of <0.20 in bivariate analysis for multivariate modeling. A backward multivariate linear regression was used to model nominal outcome variables selected during the previous step. A non-parametric bootstrap (resampling) procedure was used to revalidate our multivariate models (results not shown). Data are reported with parameters estimation and 95% confidence intervals (CIs). All statistical analyses were performed using SAS version 9.4 (SAS Institute, Cary, NC, USA) and R version 3.5.1 (R Core Team). All p values < 0.05 were considered significant.
Results
Demographic data
Sixty-nine patients were included. All of them were Afro-Caribbean and 90% were female. They lived in Martinique (55%), Guadeloupe (19%), and French Guyana (10%), and the remaining lived in the neighboring Caribbean Islands. The median age at attack was 43.2 (16.7) years. Clinical onset of neuromyelitis optica (NMO) was the SC index attack in 60.9% cases. Previous optic neuritis had occurred in 39.1% of cases, often with residual visual acuity sequelae requiring manual edition of basal EDSS. In 12 cases (17.4%), minor brainstem (hiccup) or minor mainly sensitive SC attacks occurred without sensorimotor sequelae. APQ4-Abs were positive in 41 (65.1%) of the tested cases, and 6 patients died before the test became available. All the AQP4-Abs-negative or non-tested patients fulfilled the most recent NMOSD criteria. 8
An immunosuppressive treatment was already ongoing at the time of the index SC attack in 14.5% of patients, mostly started after a prior optical onset. All patients received high-dose steroids and add-on PE was given in 52% of them. Immunosuppressive drugs were started in almost all cases (mitoxantrone 65%, rituximab 11%, cyclophosphamide 11%; others were azathioprine and mycophenolate mofetil).
Basal EDSS was null after correction for the visual system. Median nadir and residual EDSS were, respectively, 7.5 (2.5) and 4.0 (4.5) (Table 1). Only five patients recovered a normal EDSS score although two of them were severely impaired at nadir. APQ4-Ab status had no influence on nadir or residual EDSS (p = 0.21; p = 0.31). Surprisingly, residual EDSS was higher in PE-treated patients: 5.3 (5.0) versus 3.8 (4.3) (p = 0.31), but nadir EDSS was higher in the PE-treated group: 8.0 (2.0) versus 6.0 (4.0) (p < 0.001).
Bivariate analysis of MRI parameters, AQP4-Abs, PE status, and EDSS range.
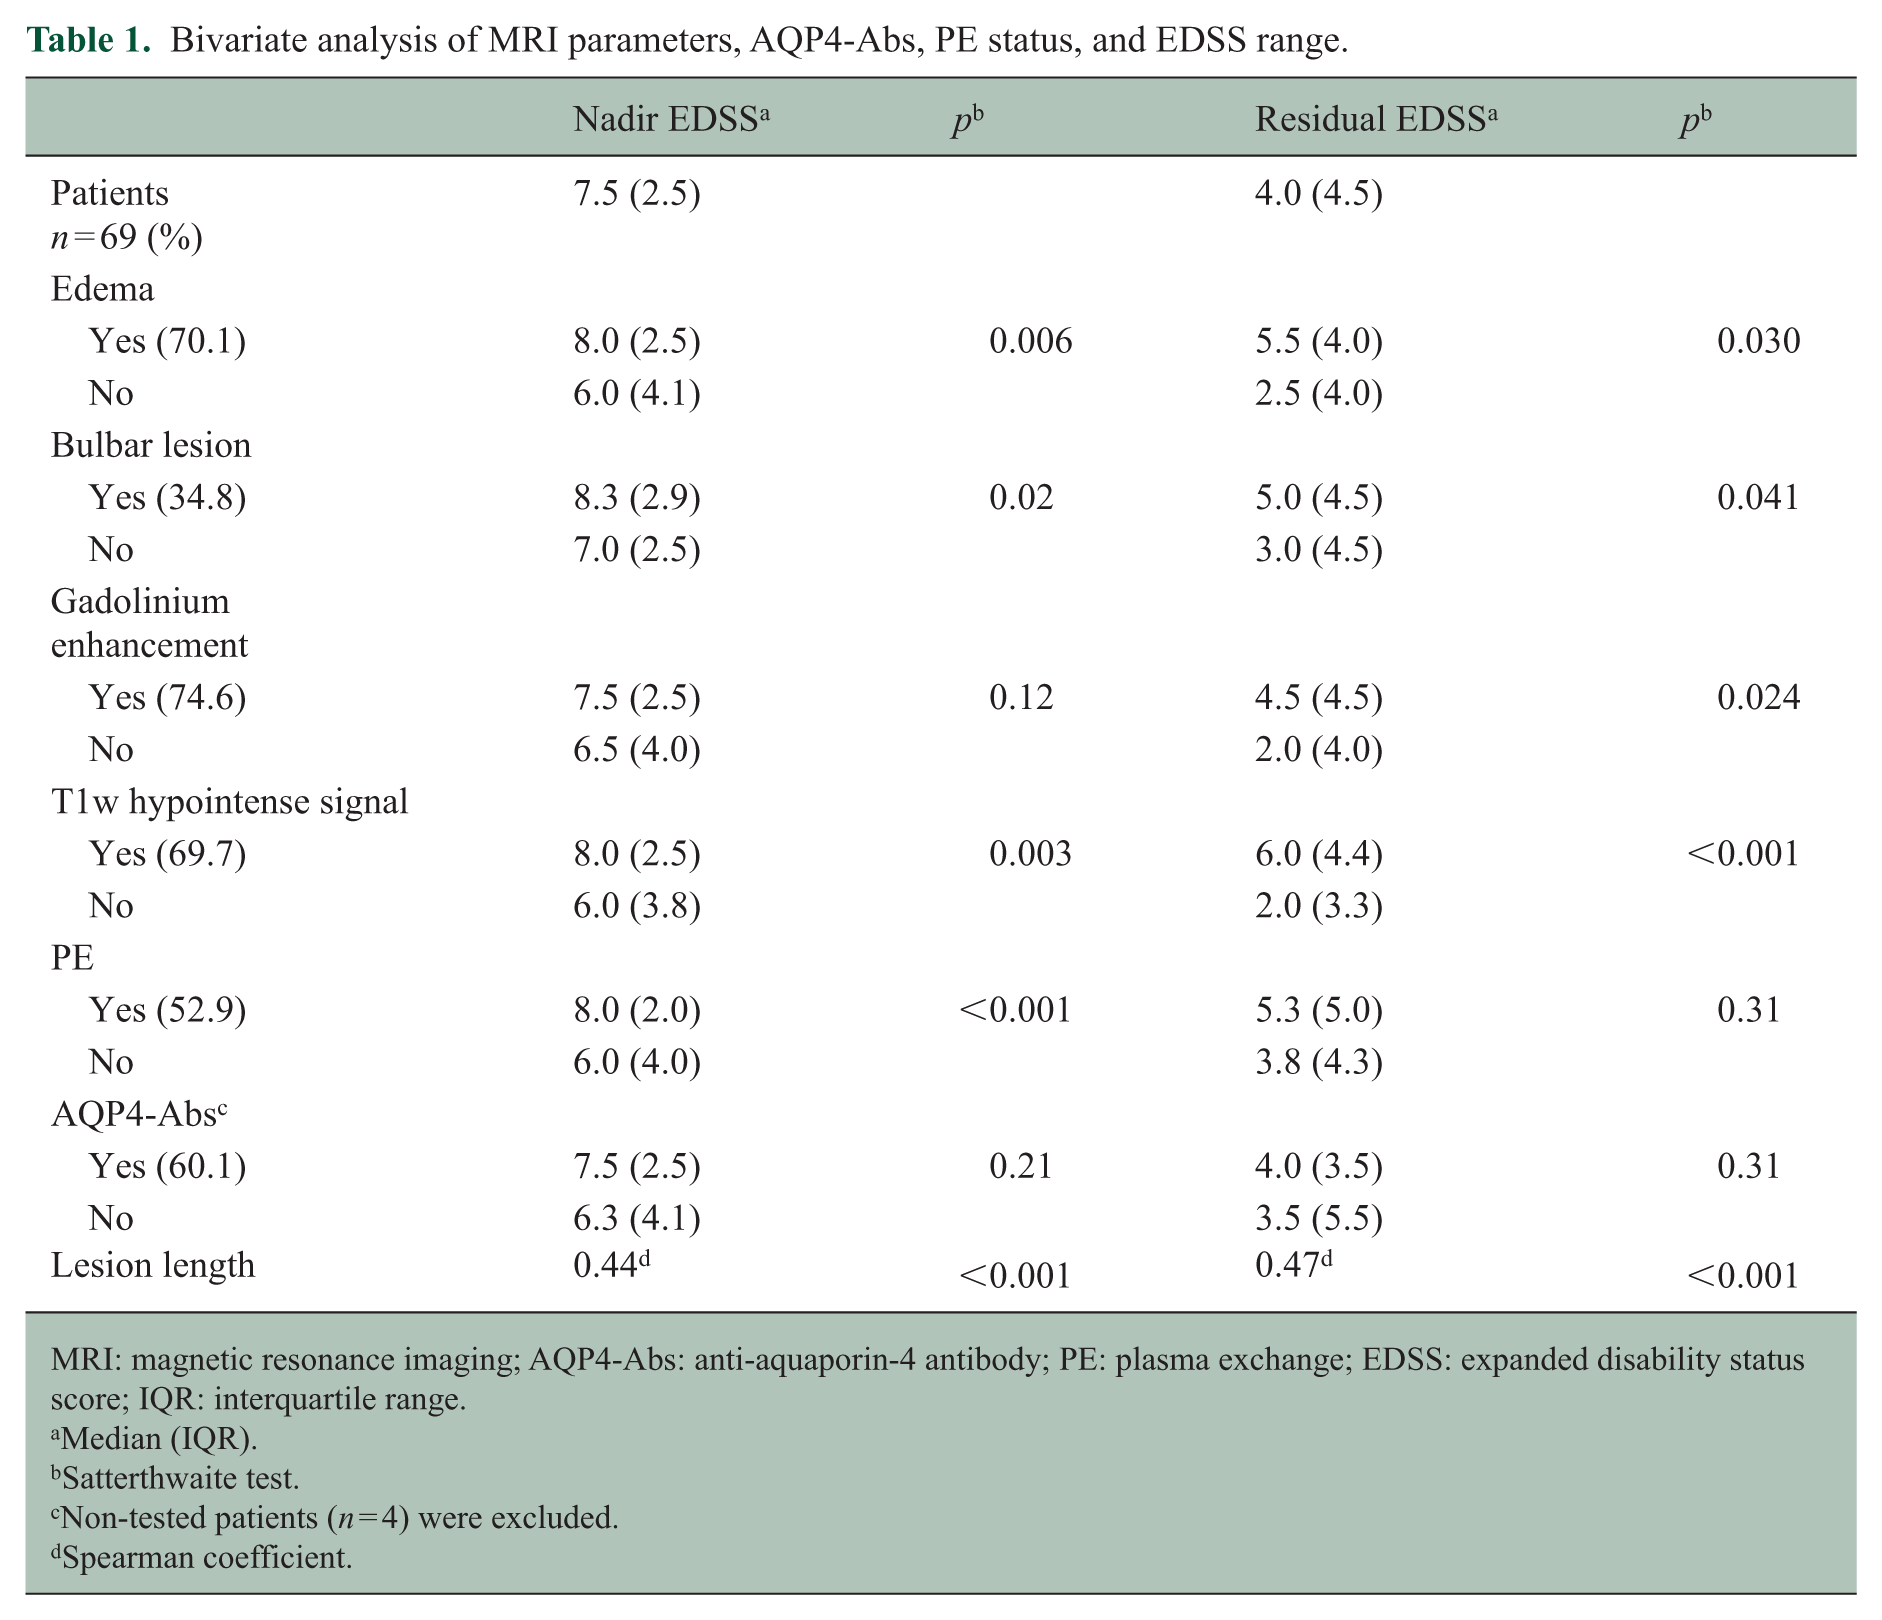
MRI: magnetic resonance imaging; AQP4-Abs: anti-aquaporin-4 antibody; PE: plasma exchange; EDSS: expanded disability status score; IQR: interquartile range.
Median (IQR).
Satterthwaite test.
Non-tested patients (n = 4) were excluded.
Spearman coefficient.
MRI parameters
General results
Median delay from first-ever clinical symptom to MRI was available in 40 attacks and was 16 (19) days. T1w sequences and post-contrast T1w sequences were not available in three and one cases, respectively. Most lesions were unique, but two lesions co-occurred in 14.4% of cases. Median lesion length was 6 (5) vertebral bodies. Levels involved were as follows: bulbar 27.5% (with 2.9% purely bulbar), purely cervical 33.3%, purely thoracic 20.3%, and cervico-thoracic 26.1%, including 7.2% of holocord lesions. Interestingly, lower levels than T9 level were involved in 20.6% but always in longitudinal holocord or pan-thoracic myelitis, except in one case. Edema, gadolinium enhancement, and T1w hypointense signals were observed in 70.1%, 74.6%, and 69.7%, respectively.
Correlation between MRI parameters
Bulbar lesions and edema were associated with a trend (p = 0.10). On the contrary, all other MRI parameters were highly intercorrelated (Table 2). Length of spinal lesions was positively correlated with all other MRI parameters (Figure 2).
Correlation between MRI parameters.
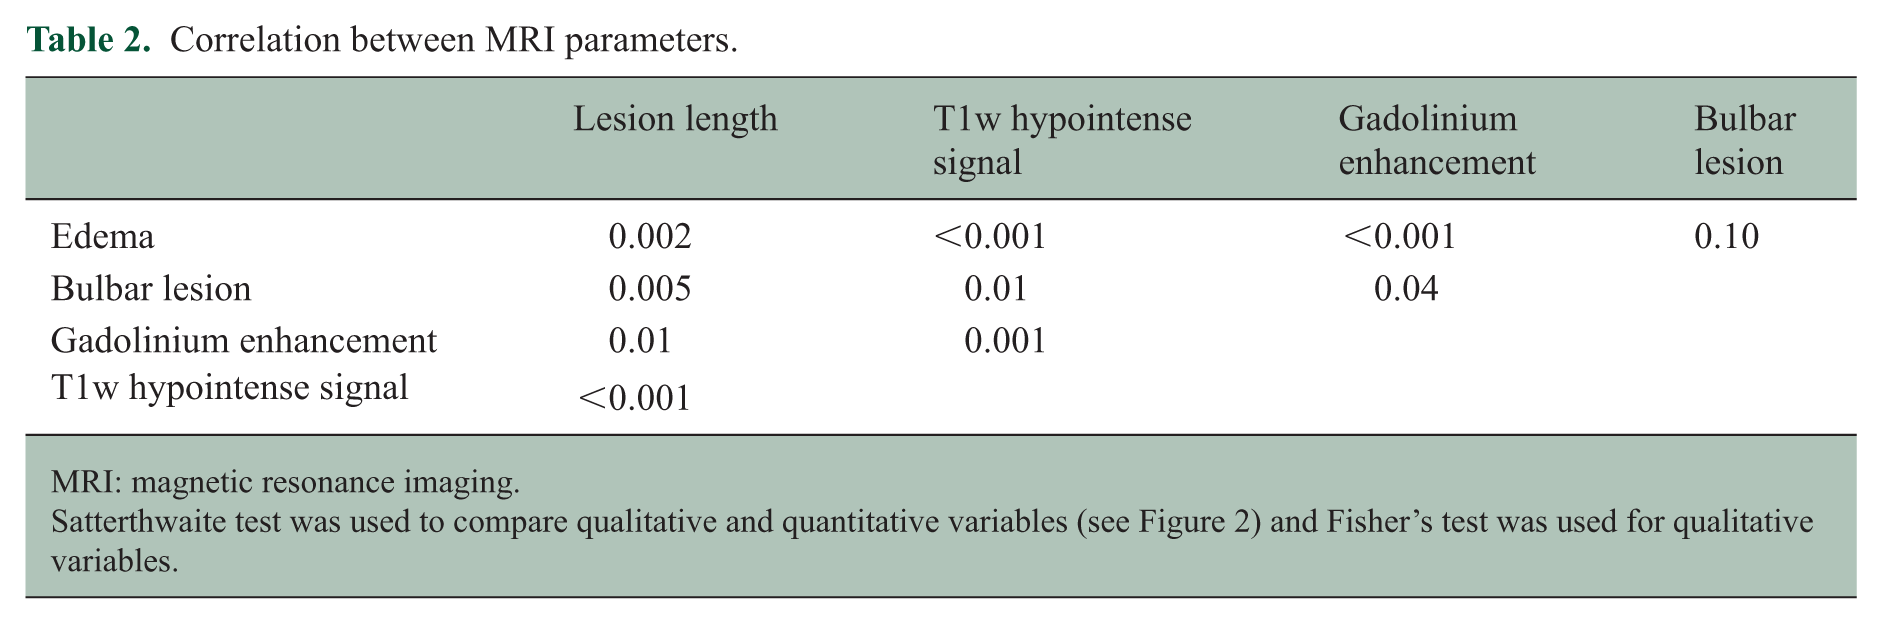
MRI: magnetic resonance imaging.
Satterthwaite test was used to compare qualitative and quantitative variables (see Figure 2) and Fisher’s test was used for qualitative variables.
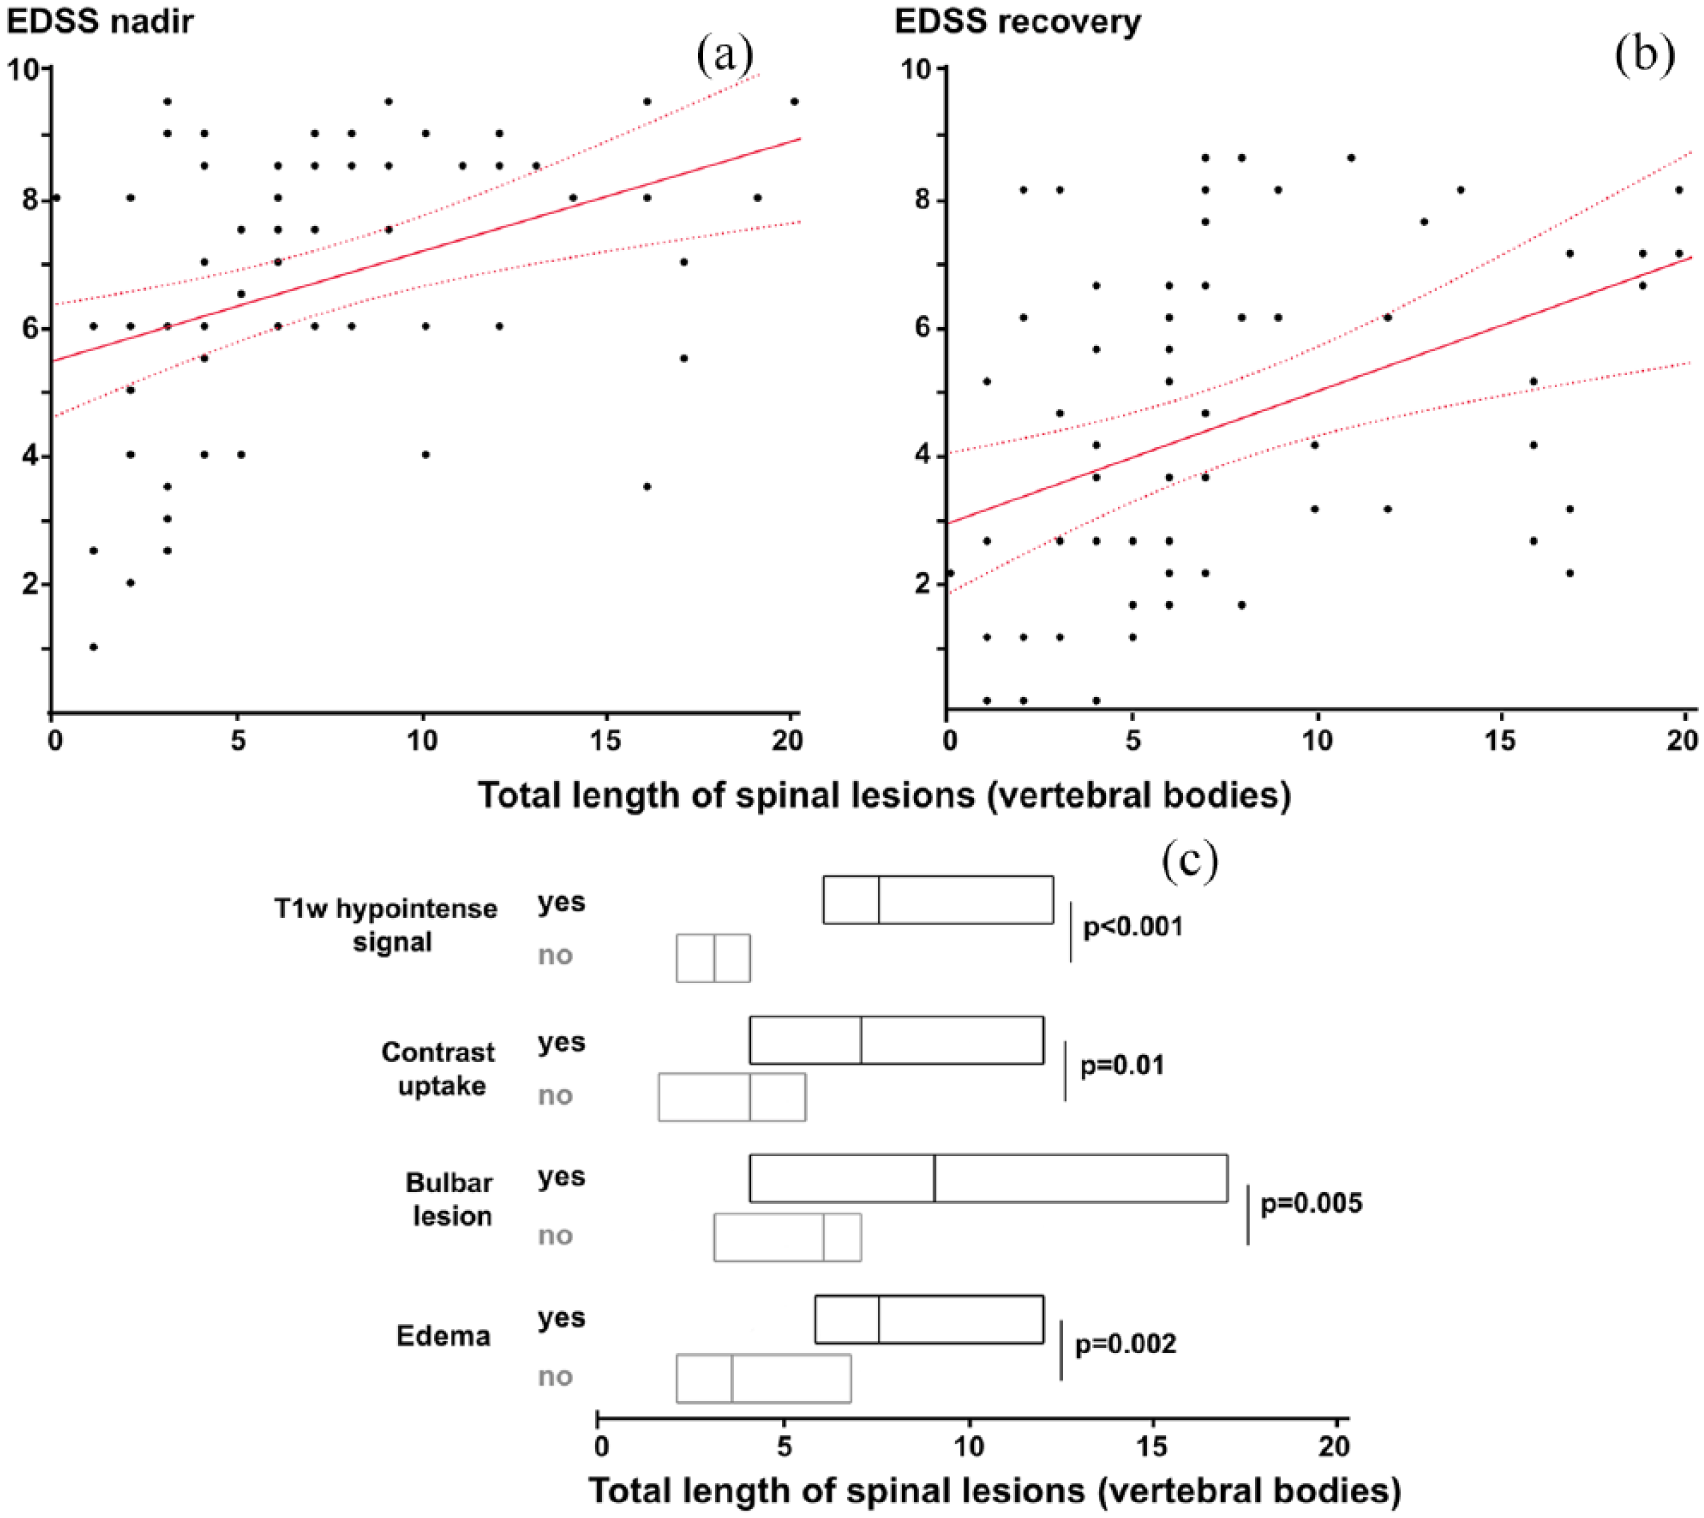
Correlation between MRI parameters and EDSS. (a) Correlation between lesion length and nadir EDSS (r = 0.44; p < 0.001) and (b) residual EDSS (r = 0.47; p < 0.001). Best fit straight lines with confidence intervals. (c) Correlation between lesion length and other MRI parameters (T1w hypointense signal, gadolinium enhancement, bulbar lesion, and edema).
Correlation between MRI parameters and clinical outcome
Gadolinium enhancement was not correlated with nadir EDSS but a correlation with residual EDSS was observed (p = 0.024) (Table 1). Edema was associated with higher nadir EDSS (p = 0.006) and residual EDSS (p = 0.030). Bulbar lesions were associated with higher nadir EDSS (p = 0.02) and residual EDSS (p = 0.041). Presence of T1w hypointense signal was associated with higher nadir (p = 0.003) and residual EDSS (p < 0.001). Lesion length was associated with nadir EDSS (r = 0.44; p < 0.001) and residual EDSS (r = 0.47; p < 0.001) (Figure 2). Nadir and residual EDSS were correlated (r = 0.57; p < 0.001).
Multivariate model
We performed an exploratory analysis of seven potentially valuable independent predictors of nadir and residual EDSS (Table 3). In bivariate analysis for nadir EDSS, all variables except AQP4-Abs were selected for multivariate modeling. After adjustment, nadir EDSS was associated with lesion length (p = 0.022) and edema (p = 0.019), but not with gadolinium enhancement, bulbar lesion, or T1w hypointense signal.
Multivariable analysis of nadir and residual EDSS.
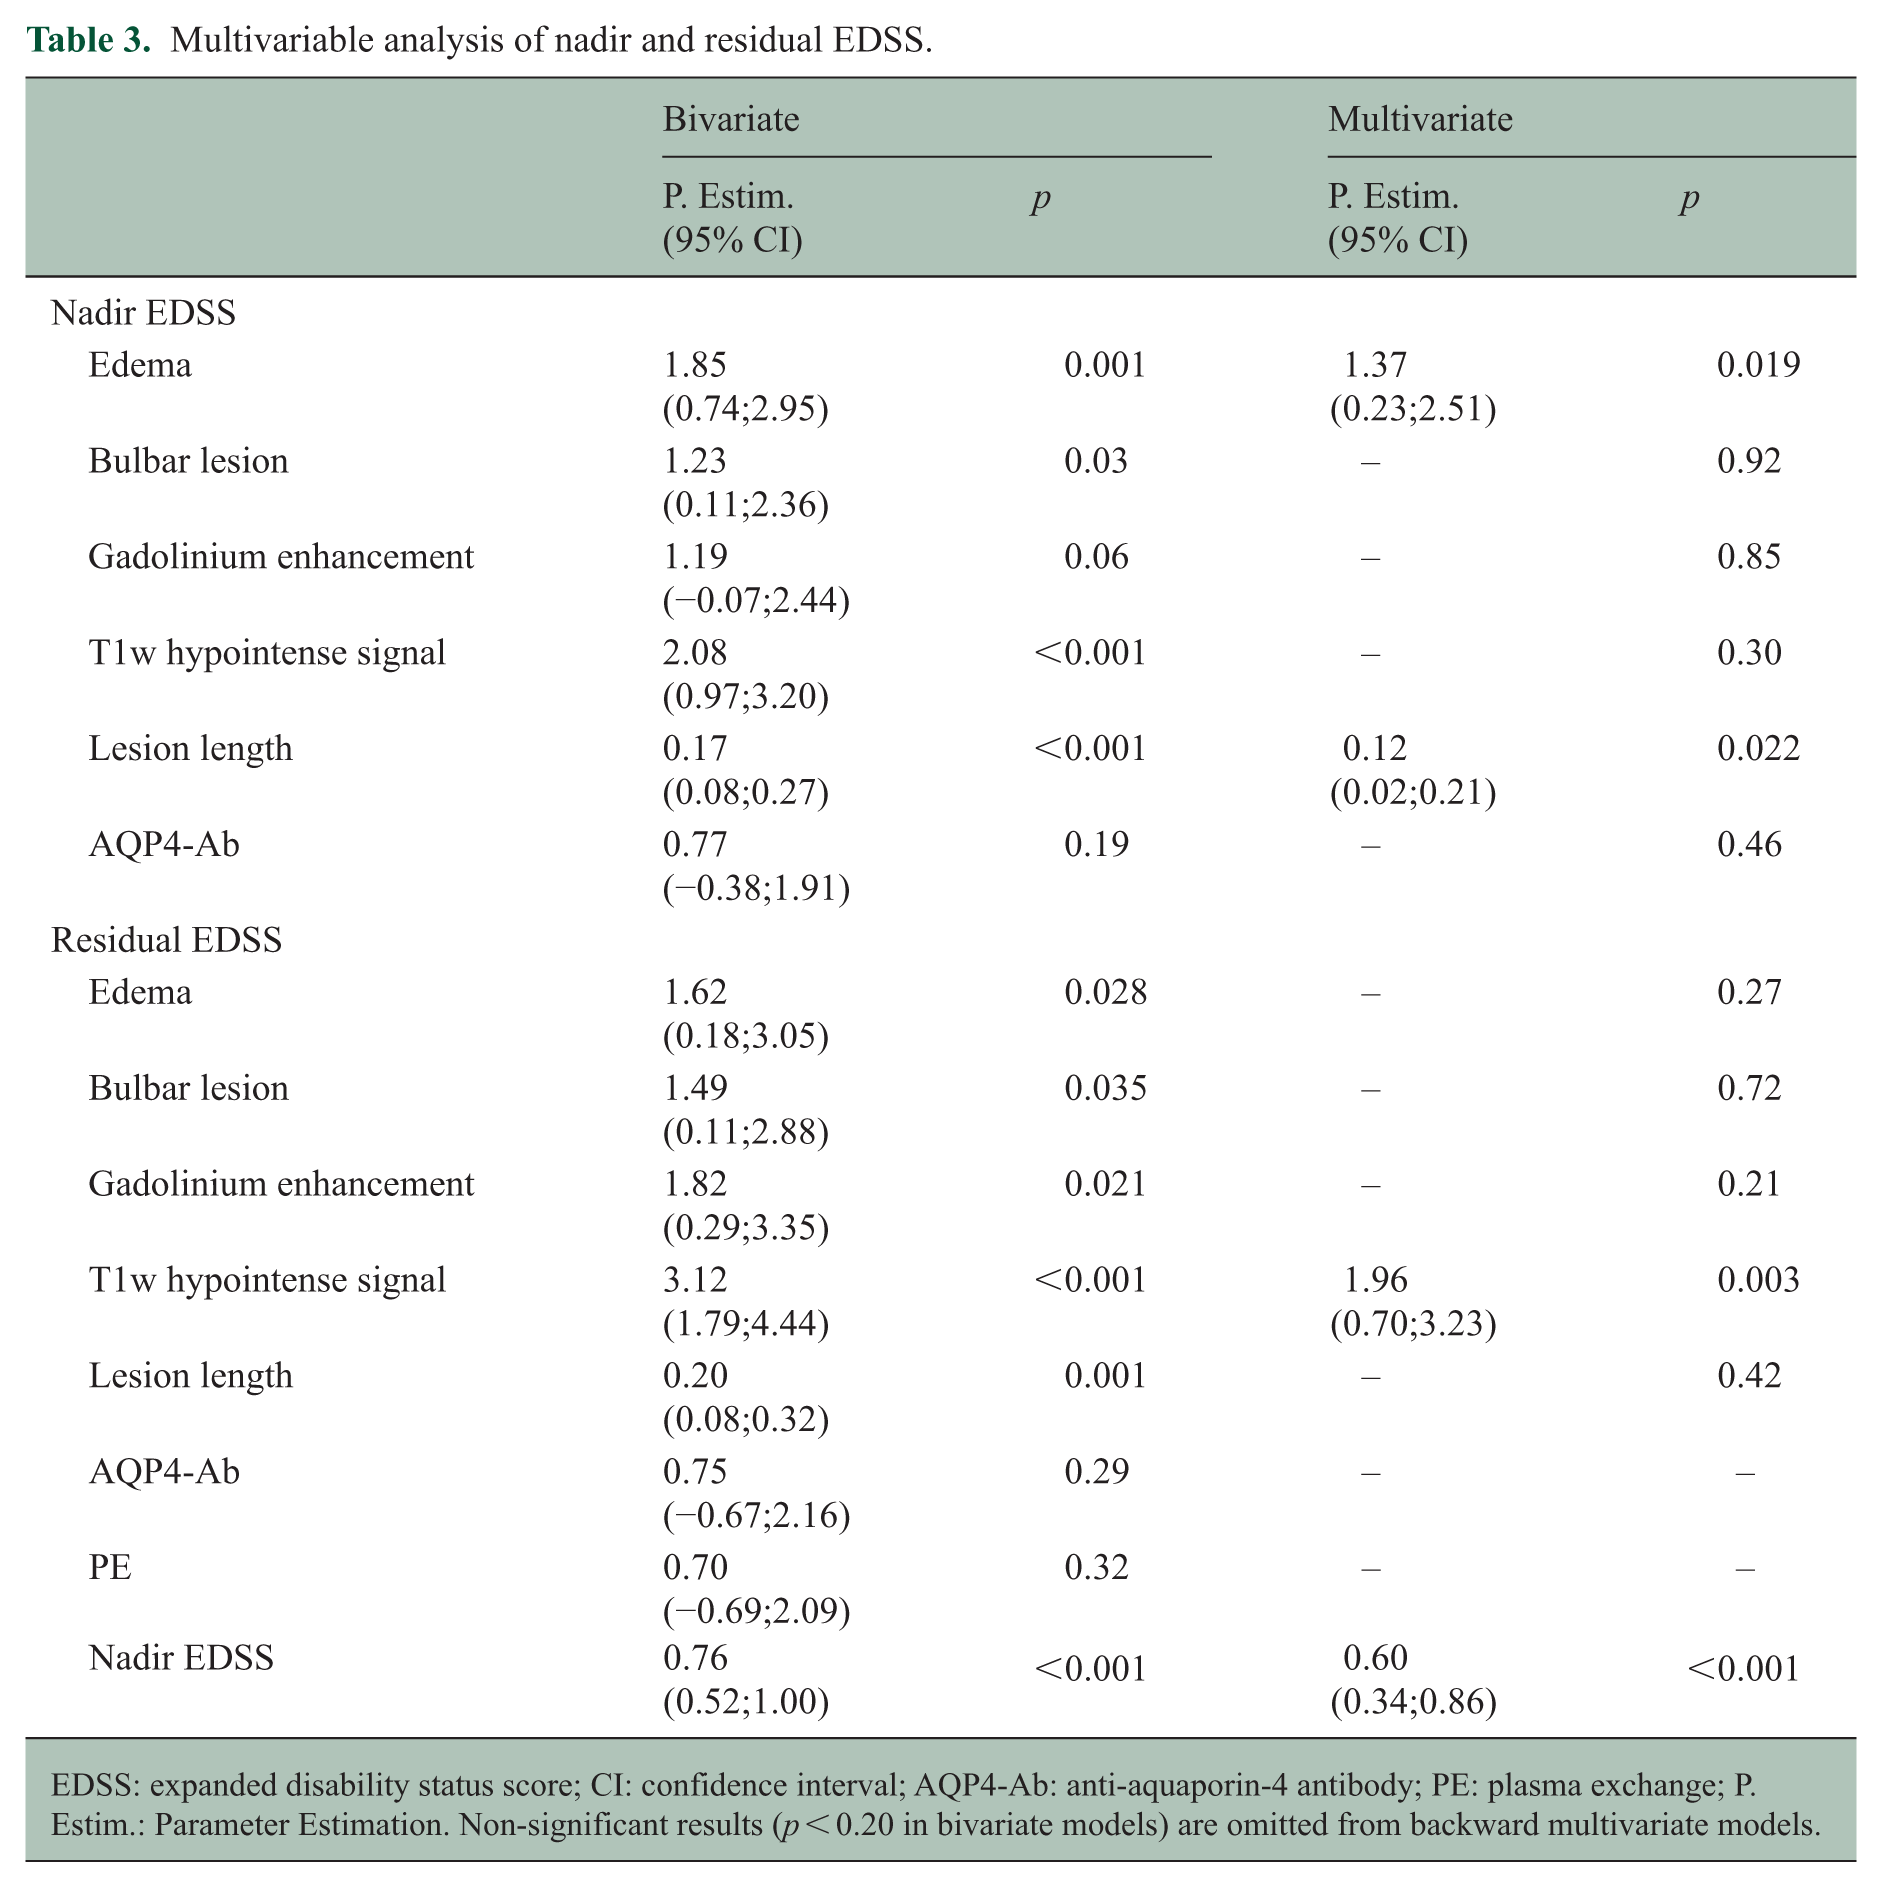
EDSS: expanded disability status score; CI: confidence interval; AQP4-Ab: anti-aquaporin-4 antibody; PE: plasma exchange; P. Estim.: Parameter Estimation. Non-significant results (p < 0.20 in bivariate models) are omitted from backward multivariate models.
In bivariate analysis for residual EDSS, all variables except AQP4-Abs and PE were selected for multivariate modeling. Residual EDSS was exclusively associated with T1w hypointense signal (p = 0.03). Gadolinium enhancement, bulbar lesion, and edema were not associated with residual EDSS.
Discussion
Incomplete recovery is a common outcome of NMOSD attacks, both from a clinical and radiological point of view, and sequelae may modify the vulnerability of SC tissue to further relapses. We therefore focused on the index SC attack to avoid any potential confounding factor. We also considered a small number of severe relapses if the first possible attack was very mild and limited to anamnestic data (usually prolonged hiccup or transient tiny sensory signs). Since this is a retrospective study, MRI sequences were not homogeneous across patients. We focused on readily available and unambiguous conventional MRI sequences acquired on 1.0 T or higher MRI coils. We included all the patients in a single center referencing all NMOSD patients from the French West Caribbean Islands and Guyana. Patients were not included if they were being followed in a different center at the time of the first attack, if their MRI data were not available, or if they had undergone their first spinal attack before 1998, a time when MRI images were of insufficient quality for this study. We thus avoided any selection bias and ensured population homogeneity by including only Afro-Caribbean patients (>90% of the population), excluding the unique Caucasian patient.
Main of the clinical features of our series are in keeping with those reported in the literature, as are their main radiological features. Simultaneous multiple lesions (non-contiguous SC lesions or in association with brainstem lesions) were observed in 14.5% of our cohort, thereby confirming this unexceptional multifocal pattern.7,10 The median total length of SC lesions was slightly higher than that previously reported, probably reflecting the higher severity of NMOSD in Afro-Caribbean patients than in Caucasian patients. Cervico-thoracic lesions predominated. Apart from a single patient suffering from a T12 lesion associated with a focal T4 lesion, lower thoracic levels (⩾T9) were rarely involved (20.6%) and always in association with longitudinal myelitis.
MRI parameters were consistently intercorrelated, which was expected for parameters typically observed during inflammation. Most of the MRI parameters correlated with nadir and residual EDSS in bivariate analysis, except a trend for gadolinium enhancement and nadir EDSS (p = 0.06). On the contrary, multivariate analysis demonstrated a new differential pattern of association: nadir EDSS was associated with edema and lesion length, whereas residual EDSS was associated with T1w hypointense signal. As a consequence, apparently aggressive lesions (longitudinal involvement with edema) may be associated with good prognosis, whereas T1w hypointense signal could be a surrogate marker of poor prognosis that requires reconsideration of treatment options.
Although the presence of edema was not associated with nadir or residual EDSS in a previous study, 7 we consistently found that edema was associated with higher nadir EDSS but not with residual EDSS. This suggests that edema is associated with acute and transient functional lesions that are able to recover, at least partially. The high correlation between edema and T1w hypointense signal was therefore expected. Proportion of T1w hypointense signal was in the same range as in other studies.7,11,12 Interestingly, it was associated with higher nadir EDSS only in bivariate analysis but was consistently associated with poorer EDSS at recovery. This was not the case in a previous study, 7 possibly due to a lack of power, but it is highly consistent since it was reproducible in our subpopulations receiving PE or not (results not shown). In multiple sclerosis lesions, T1w hypointense signal inside the new inflammatory lesions often remits and is mainly considered to be related to edema. Therefore, our observation that T1w hypointense signal is predictive of a poor clinical outcome suggests that the underlying pathological lesion differs from multiple sclerosis and is probably driven by tissue destruction. In diffusion studies of cervical NMOSD lesions, radial diffusivity was increased with tissue destruction, 13 but data were lacking during acute SC attacks. Future studies may involve non-conventional diffusion and tractography imaging to better characterize tissue integrity, the latter technique being more likely to decipher axonal lesions from tissue edema inside acute spinal lesions.13,14 Contrary to our previous studies,11,15 we did not examine MRI results acquired after recovery, so correlating acute and late MRI results with treatment delays is a goal for future studies.
Mean acute EDSS was lower than previously reported since we included all spinal attacks at onset regardless of their severity, contrary to interventional studies.1,2,5 In keeping with this design, the median EDSS of patients treated by PE was higher than that of patients who did not receive it. 3 Therefore, bivariate analysis did not confirm any beneficial action of PE (coded as a binary value) and even suggested a trend to higher nadir EDSS in PE-treated patients. These paradoxical results were also reported in a previous study. 7 Only 52% of the patients were treated by PE in this study, reflecting our historical practice, the low availability of PE until the last decade, and the inclusion of non-severe SC attacks. Based on a large cohort of spinal and optic attacks at onset or relapsing, we previously demonstrated that a short delay from clinical onset to PE is a major factor of good recovery. 2 However, in that study, PE was initiated very early at a median of 7 days, with 63% and 34% treated within 10 and 5 days or less, respectively. 2 In this study, the median delay until PE was far higher (16 days), and only 20% and 10% of patients received PE in 10 and 5 days or less, respectively. Therefore, negative effect of PE (considered as a binary value) observed in this study is in keeping with the results of previous studies, which were negative in cohorts of late PE-treated patients,6,16 but confirm positive results in those treated early.2,17 Longer delays until treatment are probably due to longer delays until hospitalization and the time taken to establish the differential diagnosis at the onset of the attack. Importantly, the first attack is associated with a set of factors that increase the risk of poor recovery: null basal impairment, longer delays until the final diagnosis, delays until hospitalization and the differential diagnosis work-up, and a longer time taken to initiate PE.
We acknowledge the limitations of this study. This study was retrospective over two decades, so we used MRI acquired in routine use, checked for good quality, but not standardized for study purposes. We designed our study to use very basic MRI parameters because they have long been available. They are widely used in daily practice and are associated with prognosis. The goal was to facilitate translation into routinely applicable prognostic criteria. Classifying these parameters is generally easy, and it seems improbable that judgment of such basic parameters was biased by progressive technological improvements. Retrospective cervical volumetric analysis was not possible on our routinely acquired MRI images: different acquisition protocols and different scanners were used, and only recent images were available in digital form.
No MOG-Ab(+) (myelin oligodendrocyte glycoprotein antibodies) patient was included but we did not obtain MOG-Ab status in some of our AQP4-Ab(–) patients since the test became available only recently. However, MOG-Ab prevalence is lower than 10% in NMOSD patients from African ancestry, 18 which strongly minimizes any possible bias. Although our study includes the largest cohort of first SC attacks, we could not analyze differences in sub-groups according to AQP4 status, so future studies should be extended to MOG-Ab(+) patients. Moreover, it would be interesting to replicate the study in patients suffering from optic neuritis associated with NMOSD.
The severity of some of the attacks led to PE initiation and hence introduced a strong bias that minimized the effect of PE on the most severe attacks. The size of the population studied was insufficient to overcome this bias, and we were unable to examine the interaction between PE delay and MRI parameters. Future studies should focus on the interaction between MRI parameters and early PE. Whether first-line treatment (i.e. very early steroids and PE) is able to reverse the influence of MRI parameters associated with poor clinical prognosis (T1w hypointense signal) remains unclear.
In conclusion, the pattern of conventional MRI parameters is differentially associated with nadir and residual EDSS: edema and lesion length are associated with higher nadir EDSS whereas T1w hypointense signal is associated with poor residual EDSS. This sign of poor prognosis could be a further argument for initiating optimal treatment early.
Footnotes
Acknowledgements
We are indebted to Ray Cooke for copyediting. We also thank Hervé Dreau for his invaluable help in bootstrapping analyses.
Declaration of Conflicting Interests
The author(s) declared no potential conflicts of interest with respect to the research, authorship, and/or publication of this article.
Funding
The author(s) received no financial support for the research, authorship, and/or publication of this article.