
Abstract
Background:
The research is focused on sensitive biomarkers in multiple sclerosis (MS).
Objective:
The aim of the study was to assess the relationship between plasma neurofilament light chain (pNfL) and disease activity as defined by the concept NEDA (no evident disease activity), including brain volumetry, in a cohort of MS patients treated with disease-modifying treatment (DMT).
Methods:
Levels of pNfL (Single Molecule Array (SIMOA) technology) were examined in 95 RRMS (relapsing-remitting multiple sclerosis) patients and analyzed in relationship to NEDA-3 status and NEDA-BVL (brain volume loss; NEDA-3 extended by brain volumetry) during the last 12 months. The statistical model was developed using logistic regression analysis, including the independent variables: demographic, clinical, and magnetic resonance imaging (MRI) data. Dependent variables were NEDA-3 and NEDA-BVL status.
Results:
The mean age of the study participants (n = 95, 62% females) was 37.85 years (standard deviation (SD) = 9.62) and the median disability score was 3.5 (2.5–4.1). Receiver operating characteristics (ROC) analysis showed that pNfL predicts NEDA-3 (the sensitivity and specificity of the model were 92% and 78%, respectively, p < 0.001) and NEDA-BVL status (the sensitivity and specificity were 80% and 65%, respectively, p < 0.001).
Conclusion:
The results show that pNfL levels are a useful biomarker of disease activity determined by NEDA-BVL status, including brain MRI-volumetry in patients with RRMS.
Introduction
Multiple sclerosis (MS) is a chronic autoimmune disorder with individual different disease activity and treatment responses. Current research is focused on the identification of sensitive biomarkers related to disease activity in order to optimize a patient’s treatment in daily practice.1–5
Several studies have identified blood neurofilament light chain (NfL) as a sensitive biomarker of neuroaxonal damage in MS.1,4–7 A few studies found an association between NfL levels and MS disease activity.2,3,5,8–10 To reach NEDA (no evident disease activity) status is a target in relapsing-remitting MS treatment with DMT (disease-modifying therapy). 11
Three-compound NEDA-3 status takes account of the absence of relapse, brain magnetic resonance imaging (MRI) activity, and worsening disability. Some researchers point out that NEDA-3 status reflects mostly inflammatory activity and overlooks ongoing neurodegenerative processes. One proposal to address these limitations is the measurement of pathological brain volume loss (BVL), a marker of neurodegeneration. Clinical drug trials that employed BVL as an outcome parameter have shown that the effect of treatment on BVL correlated with the effect on disability progression.12,13 Slowing brain atrophy is currently one of the important markers of effective MS treatment.
Kappos et al. 14 first proposed the concept of NEDA-BVL status (NEDA-3 with added BVL) in a study of patients on fingolimod (FREEDOM trials). NEDA-BVL was defined as the absence of clinical relapses, a lack of new or enlarged T2W lesions and disability progression in the previous 6 months, and a mean annual rate brain volume loss (AR-BVL) of <0.4%. Achieving NEDA-BVL status based on an annual threshold BVL rate of 0.4% in MS cohorts on DMT was evaluated in several studies, mostly in early disease course.8,10 Sormani et al. 9 concluded that NfL could be possibly used as a substitute marker for BVL.
Therefore, we investigated in an RRMS (relapsing-remitting multiple sclerosis) cohort the association between plasma neurofilament light chain (pNfL) and parameters of disease activity, as defined by NEDA-BVL. We analyzed the relationship between pNfL and demographic, clinical, and radiological parameters, as well as associations with NEDA-3 and NEDA-BVL in our RRMS cohort. To the best of our knowledge, these variables have not been studied in such a context.
Material and methods
Study subjects
Ninety-five consecutive patients with RRMS were eligible to participate in the study and enrolled in a cohort study at the Department of Neurology of Louis Pasteur University Hospital in Košice (also see Figure 1 for the study design). The study was approved by the Hospital Ethics Committee and was performed in accordance with the Good Clinical Practice standard and the Declaration of Helsinki.
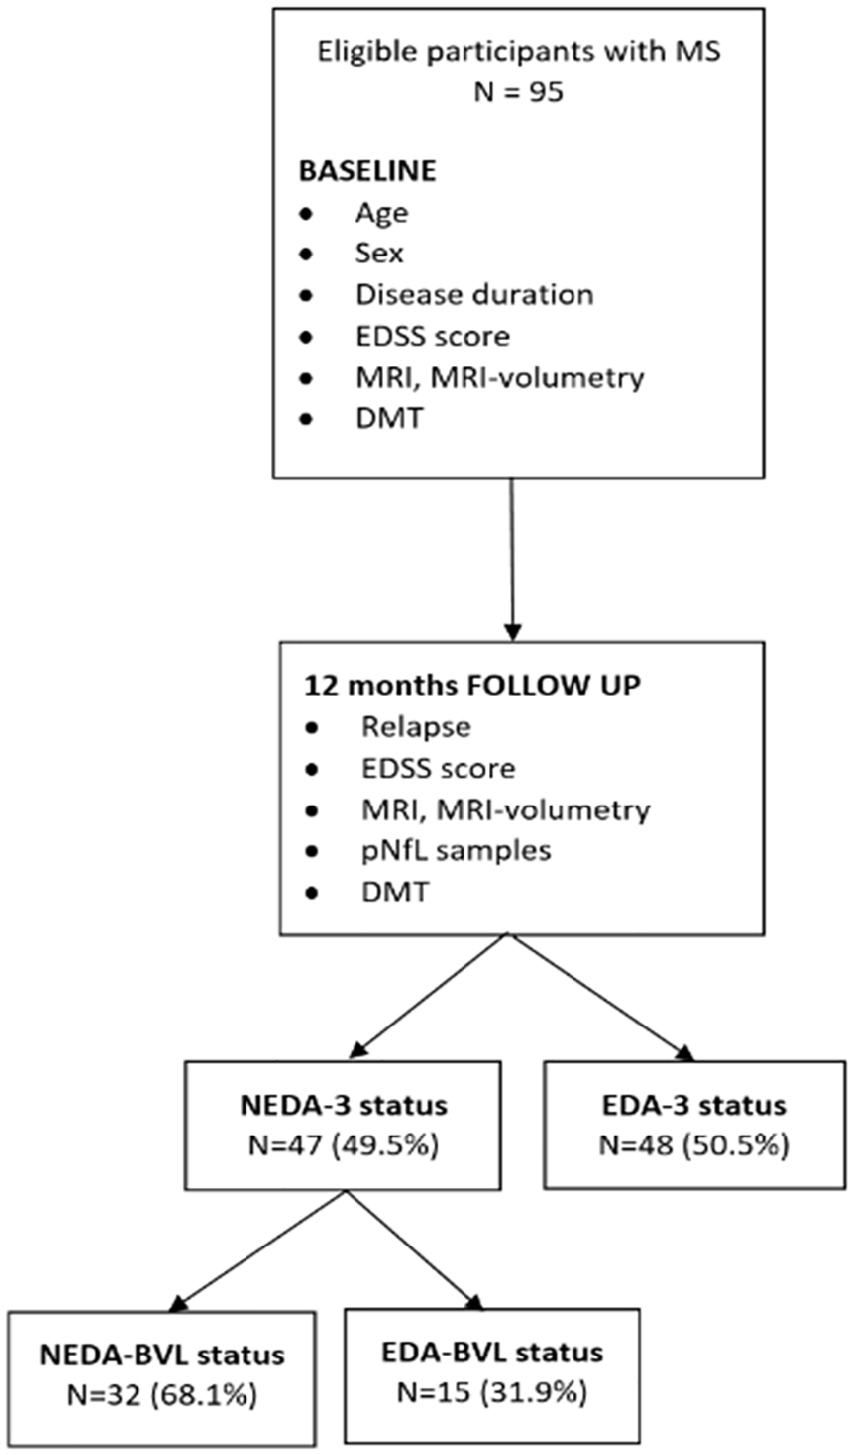
A schematic flowchart diagram showing the procedure by which data were tested in MS patients.
The inclusion criteria were the following: (1) diagnosis of RRMS based on the revised 2010 McDonald criteria, (2) being older than 18 years, and (3) the ability to give written informed consent. The exclusion criterion was primary-progressive MS and patients with a severe comorbidity. Of the patient population involved in the study (n = 95), 36 were males and 59 were females. All patients were treated with DMT according to the Slovak MS treatment criteria. The study period was January 2019 to February 2020. Patients underwent clinical neurological examination, including expanded disability status scale (EDSS), blood sampling, and brain MRI. 15 Patient characteristics are presented in Table 1. Disease duration was considered the time from the first symptoms of MS to the date of the pNfL examination.
Demographic, clinical, laboratory, and MRI characteristics of the study sample.
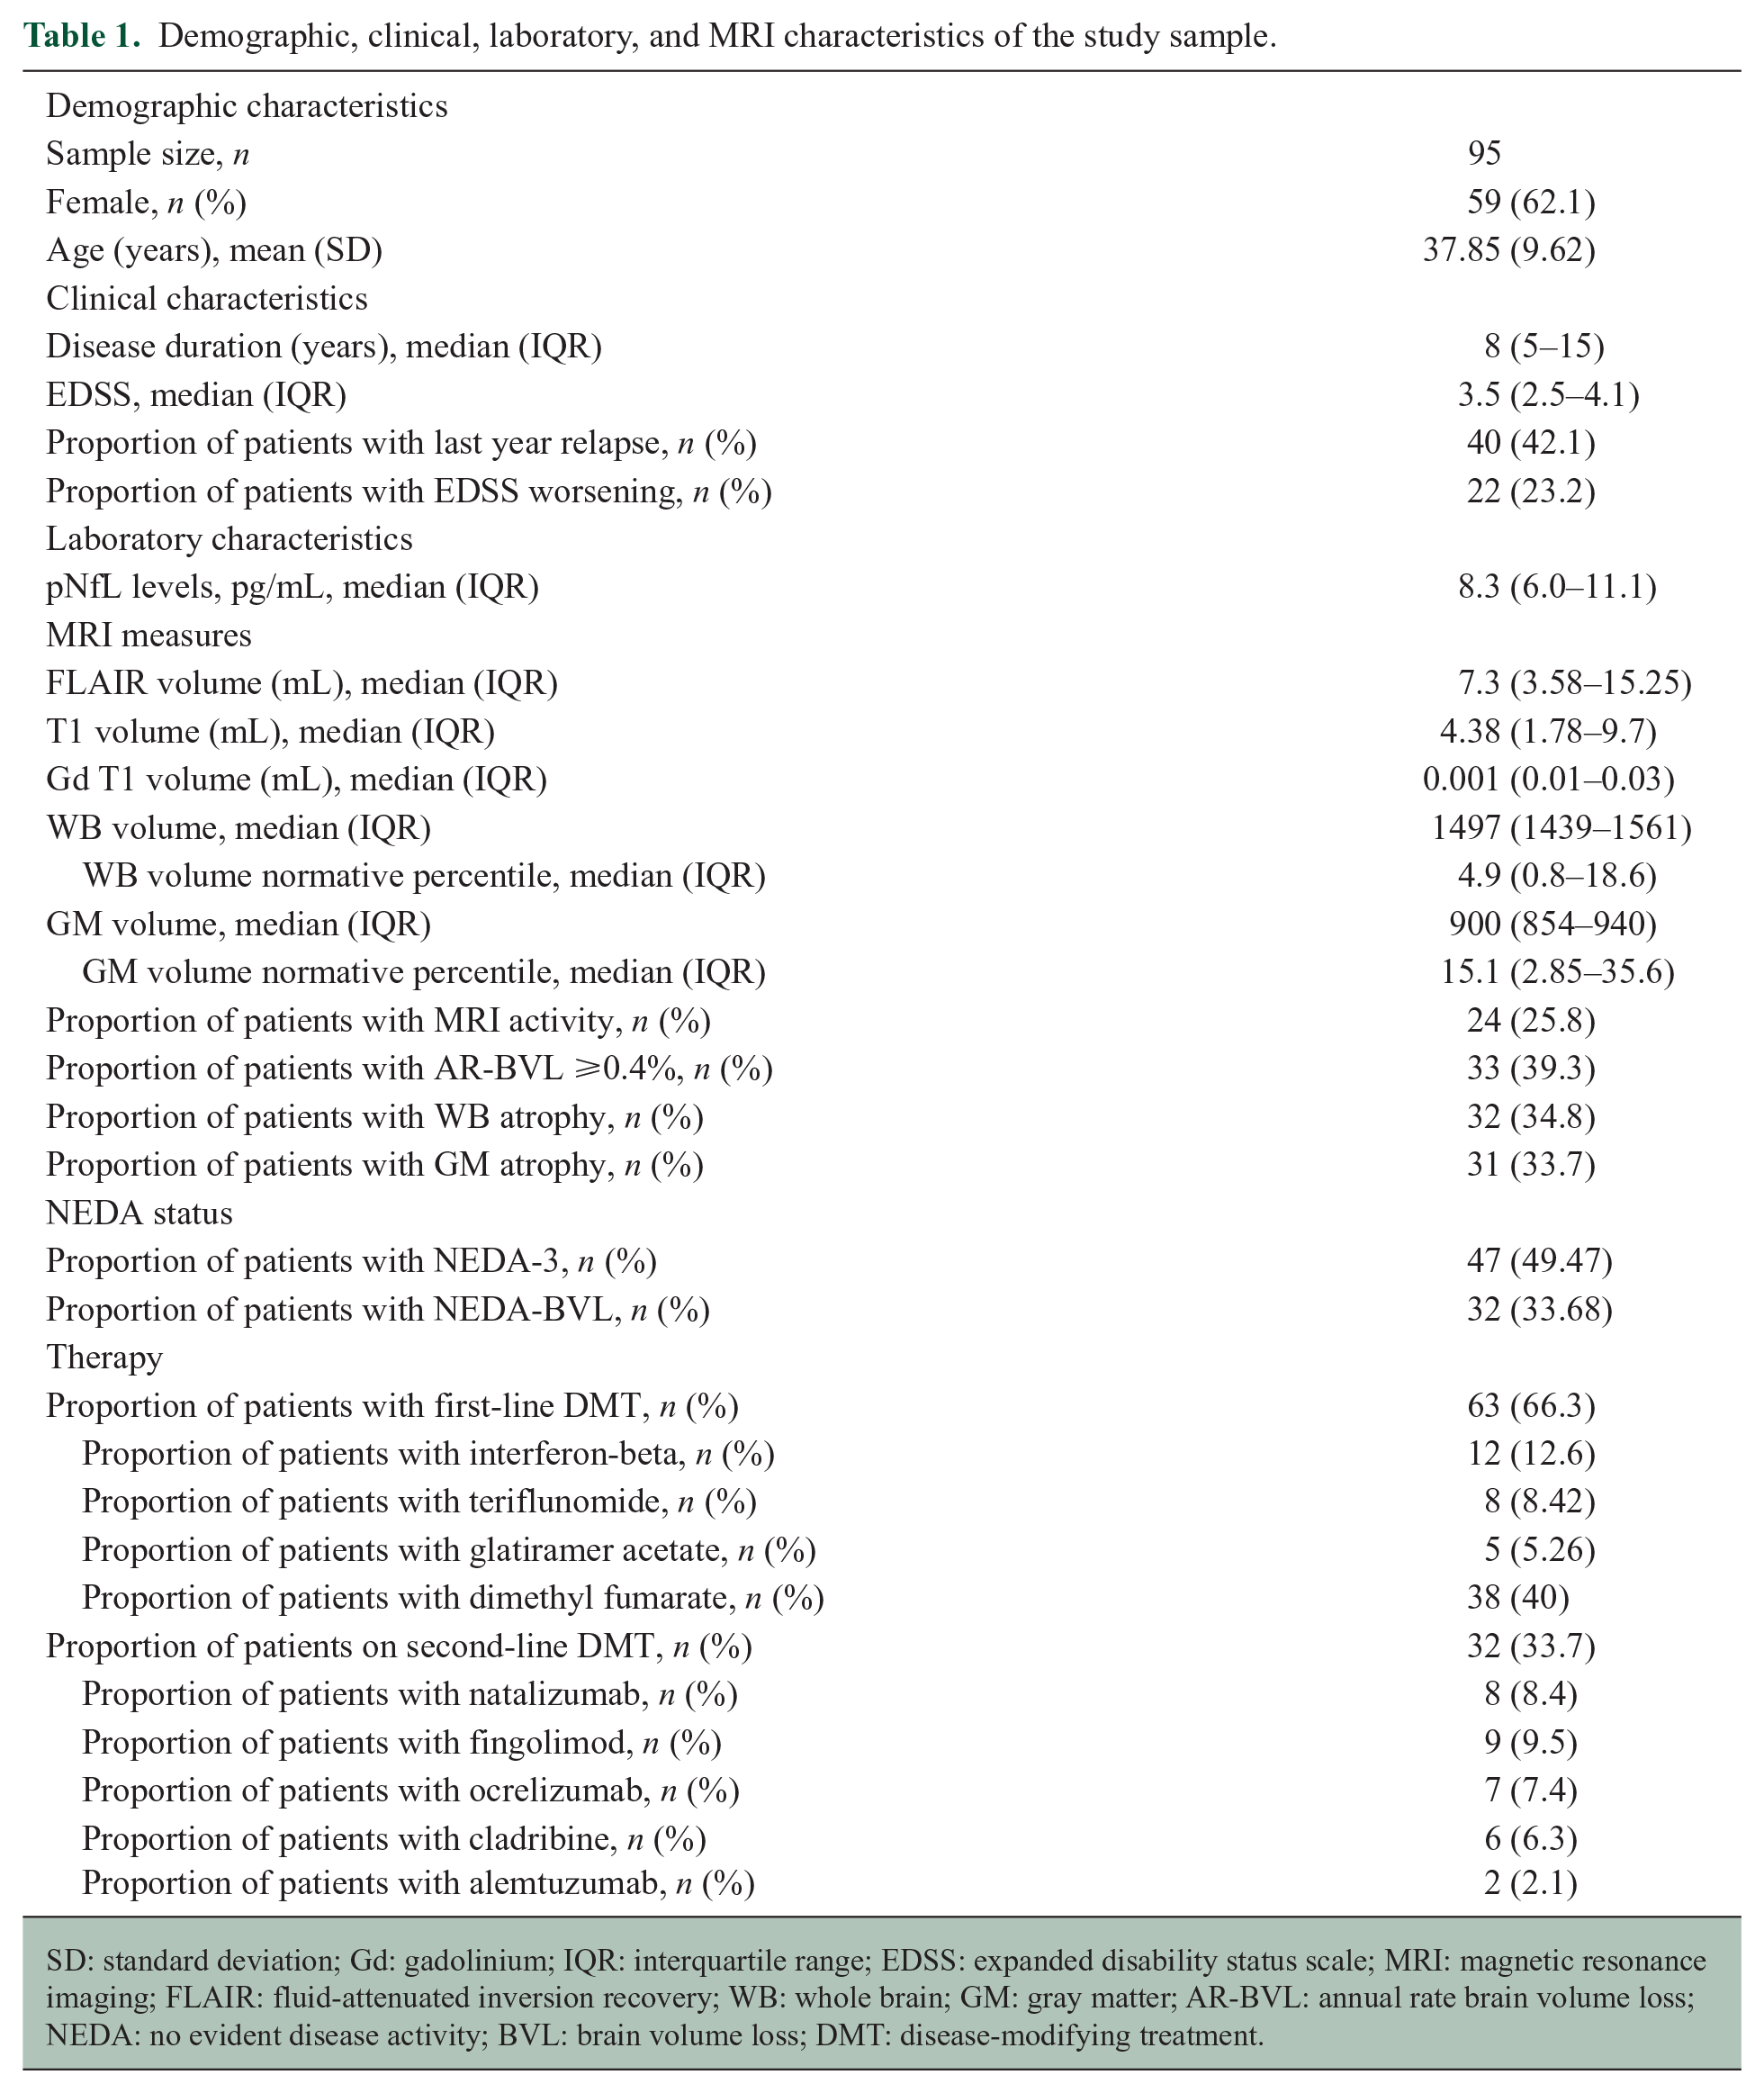
SD: standard deviation; Gd: gadolinium; IQR: interquartile range; EDSS: expanded disability status scale; MRI: magnetic resonance imaging; FLAIR: fluid-attenuated inversion recovery; WB: whole brain; GM: gray matter; AR-BVL: annual rate brain volume loss; NEDA: no evident disease activity; BVL: brain volume loss; DMT: disease-modifying treatment.
NfL measurements
The NfL sample was taken at the follow-up visit (12 months after the baseline visit). Samples of 3 mL of venous blood were collected into vacutainer tubes including anticoagulant (sodium citrate) by the treating physicians and processed at room temperature within 2 hours. The samples were then spun at 4000 r/min for 10 minutes, and the collected plasma was divided into polypropylene tubes and stored at −80°C. Blood samples were pseudonymized and analyzed without clinical data. The pNfL was analyzed by SIMOA™ (Single Molecule Array) NfL assay using the NF-Light Advantage Kit and the SIMOA HD-1 analyzer, protocol of Quanterix, Lexington, MA, USA. 16 Inter-assay coefficients of variation for the three native serum samples were 5.3%, 1.9%, and 5.3% for 6.2, 21.7, and 256 pg/mL, respectively. Intra-assay coefficients of variation (n = 30) for the three native serum samples were 6.1%, 6.8%, and 7.3% for 6.2, 21.7, and 256 pg/mL, respectively.
MRI measurements
Brain MRI was performed using a standardized three-dimensional (3D) T1-weighted magnetization-prepared rapid gradient-echo sequence and a 3D T2-weighted fluid-attenuated inversion recovery (FLAIR) sequence with MS protocol in all MS patients. Lesion maps were initially drawn on T2-weighted 3D FLAIR images using a PHILIPS Ingenia 3.0T Omega HP (Philips North America Corporation, dStream, direct digital technology, Best, The Netherlands). Longitudinal coregistration fusion was used for identification of T2 lesions, FLAIR lesions, T1 lesions, T1 gadolinium-enhancing lesions and their occurrence as well as new or enlarged lesions, and their volume was measured. Whole brain (WB) volume and gray matter (GM) volume were measured using the Icobrain program (ICOMETRIX, Leuven, Belgium). Volumetric parameters were calculated by automatic brain volume quantification using FLAIR and T1-weighted scans 17 using longitudinal, transsectional, and segmentational techniques.
The Icobrain program compares the measured values of brain volumes in patients with healthy controls and calculates the deviation from the standard values evaluated in healthy controls (the database is mainly from Europe and North America), with the average expected annual change in volume for controls that match in the age and gender category. WB volume and GM volume parameters were adjusted for skull size using Icobrain, and the normal range and normative volume percentile change in healthy controls were used as a reference. Annual BVL threshold (AR-BVL) was based on the annual percentage brain volume change (PBVC) as a value below the normal range of reference values in healthy controls (database), in accordance with gender and age. Abnormal BVL was defined as a threshold annual BVL rate of 0.4% according to the study of De Stefano et al. 18 MRI data were analyzed by blinded radiologists and Icobrain raters. They had no information about disease activity and NfL levels.
NEDA-3 and NEDA-BVL definition
NEDA-3 status was evaluated at follow-up visit using data from the last 12 months (Figure 1). NEDA-3 status was defined as the absence of relapse, EDSS worsening, and MRI activity. EDSS worsening or CDP (confirmed disability progression) was defined as an increase in the EDSS score of 1.5 points, if the previous EDSS score (baseline visit) was 0; an increase of ⩾1.0 point, if EDSS ⩽5.0; or an increase of ⩾0.5 points, if EDSS ⩾5.5, confirmed at 6 months.19,20 The EDSS score from the baseline visit (12 months before) was used to determine the CDP at the follow-up visit.
MRI activity was defined as having at least two or more new/or enlarging T2 hyperintense lesions or the presence of a gadolinium (Gd)-enhancing T1 lesion in the brain MRI (at follow-up visit) compared with the previous scan (baseline visit, 12 months before). MRI scans with volumetry were performed as follows: the first scan at the baseline visit and the second one within 3 months of the follow-up visit.
NEDA-BVL status was defined (at the follow-up visit) as the presence of NEDA-3 status extended by a fourth component—BVL. Patients were dichotomized based on an AR-BVL <0.4% or ⩾0.4%. 18 EDA (evident disease activity) status was unfilled NEDA status.
Statistical analysis
Descriptive statistics were compiled to provide basic information about the patients. Summary statistics are presented as the mean value ± standard deviation (SD), median (range), and percentage, where applicable categorical variables are number and percentage. Thereafter, binary logistic regression analysis was performed. The model included demographic (age and sex), laboratory (pNfL), clinical (EDSS at follow-up visit and disease duration), and radiological (MRI and MRI-volumetry) variables as independent variables. Dichotomized NEDA-3 and NEDA-BVL status were used as the dependent variable. The stepwise regression backward method was used to select the model with the best predictors. Consequently, for evaluation of the predictive value of pNfL levels as a predictor of NEDA-3 and NEDA-BVL status, we plotted the ROC (receiver operating characteristics) curve and calculated the area under curve (AUC) with a 95% confidence interval (CI). From the pNfL cut-off values, we selected the optimal one with the highest discriminant accuracy (sensitivity and specificity). Optimal NfL cut-offs were defined based on the Youden index. Statistical analyses were performed at the 0.05 level/values of significance using the IBM SPSS (Statistical Package for the Social Science) software version 23.0.
Results
The demographic, clinical, laboratory, and radiological (MRI) characteristics of the patients with MS are provided in Table 1. The mean age was 37.85 ± 9.62 years (20–64), and 59 (62.1%) patients were female. The median disease duration was 8.0 years (interquartile range (IQR) = 5–15), and the median pNfL was 8.3 pg/mL (IQR = 6–11.1). Patients were treated with DMTs in the following proportions: 63 patients (66.3%) were on first-line DMTs and 32 (33.7%) on second-line DMTs (Table 1).
From a total of 95 patients, 45 (47.4%) showed NEDA-3 status, while 50 (52.6%) patients showed EDA-3 status. The pNfL was significantly higher in the EDA-3 group than in the NEDA-3 group (11.55 ± 6.03 pg/mL vs 6.99 ± 1.99 pg/mL; p < 0.001). From a total of 95 patients, 27 (29.7%) showed NEDA-BVL status, and EDA-BVL was present in 68 (70.3%).
From the subgroup of NEDA-3, 32 patients showed NEDA-BVL status (68.1%). The pNfL was significantly higher in the EDA-BVL group than in the NEDA-BVL group (10.49 ± 5.72 pg/ml vs 6.96 ± 2.17 pg/ml; p < 0.001; Figure 1).
Multivariable logistic regression analysis, a model consisting of age, sex, disease duration, EDSS, and pNfL as independent variables and NEDA-3 status as the dependent variable, showed that the pNfL value (B = −0.382, Exp(B) = 0.682; p < 0.01) is a significant predictor of NEDA-3 status. Multivariable logistic regression analysis, a model consisting of age, sex, disease duration, EDSS, and pNfL as independent variables and NEDA-BVL status as the dependent variable, showed that the pNfL value (B = −0.322, Exp(B) = 0.725; p < 0.01) is a significant predictor of NEDA-BVL status.
ROC curve analysis using predicted values from multivariable logistic regression model showed the pNfL level to be a predictor of NEDA-3 status (AUC = 0.902; 95% CI = 0.830–0.973; p < 0.001), and the sensitivity and specificity of the predictive model were 92.3% and 78%, respectively, (Figure 2). Lower pNfL values indicate stronger evidence for the presence of NEDA-3 status, with a cut-off level of 8.4 pg/mL for pNfL (Supplemental Figure 1). ROC curve analysis showed the pNfL level to be a predictor of NEDA-BVL status (AUC = 0.757; 95% CI = 0.654–0.860; p < 0.001), and the sensitivity and specificity of the predictive model were 80% and 65%, respectively, (Figure 3). Lower pNfL values indicate stronger evidence for the presence of NEDA-BVL status, with a cut-off level of 7.3 pg/mL for pNfL (Supplemental Figure 2).
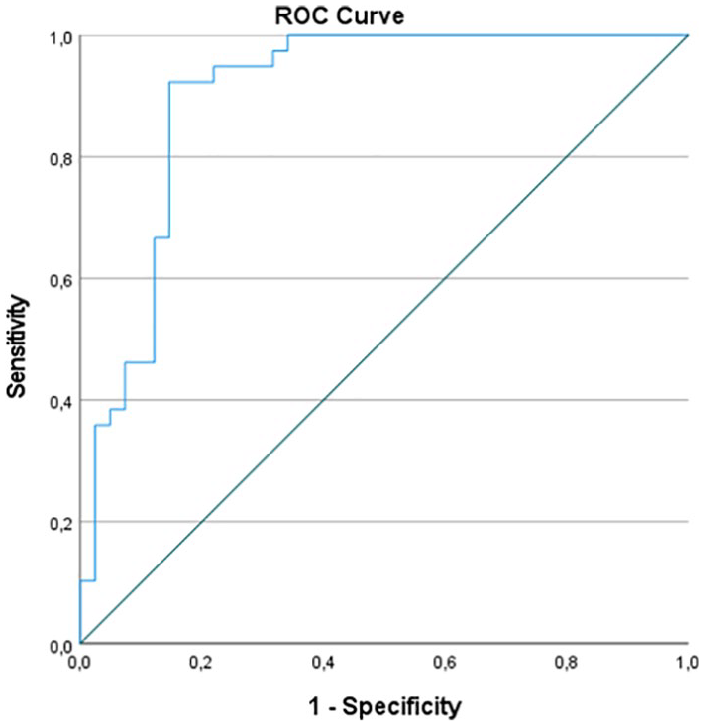
ROC analysis of the pNfL of patients with and without NEDA-3 status. The sensitivity and specificity of the predictive model were 92.3% and 78%, respectively, with an area under the curve (AUC) of 0.902 (95% CI = 0.830–0.973; p < 0.001). Lower values of pNfL indicate stronger evidence for the presence of NEDA-3 status.
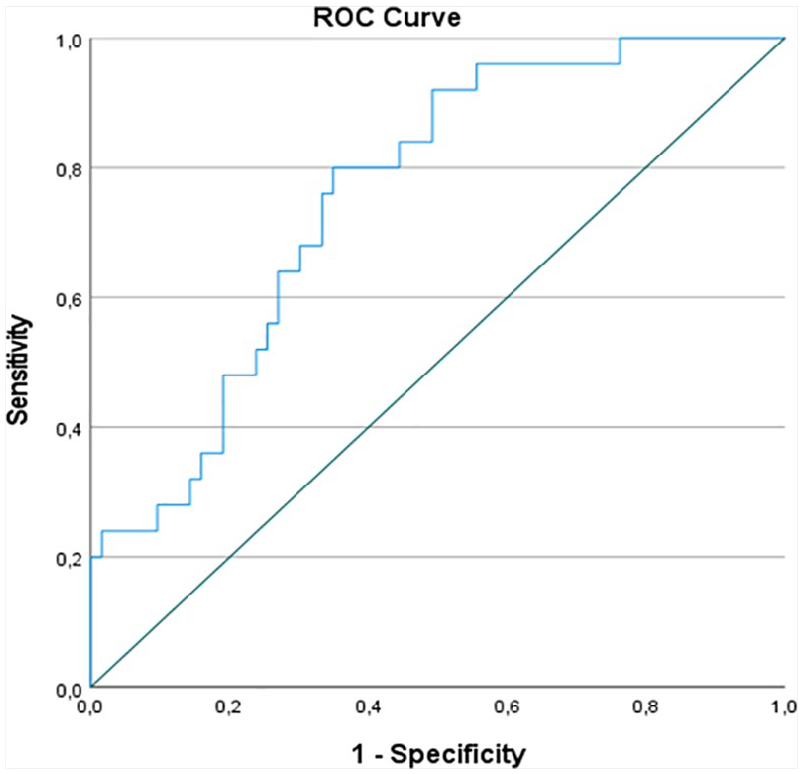
ROC analysis of the pNfL of patients with and without NEDA-BVL status. The sensitivity and specificity of the predictive model were 80% and 65%, respectively, with an area under the curve (AUC) of 0.757 (95% CI = 0.654–0.860; p < 0.001).
Discussion
The results of this study showed that pNfL levels are predictors of MS disease activity, as measured by four-domain NEDA-BVL status, consisting of the absence of relapse, disability (EDSS) worsening, brain MRI activity, and BVL ⩾0.4%. Almost half of the patients (49.5%) on DMT treatment had NEDA-3 status, and a third (33.7%) had NEDA-BVL status.
Our results show good potential for NfL levels to discriminate between patients with NEDA-BVL versus EDA-BVL, and a good performance of NfL levels for discriminating between patients with NEDA-3 and EDA-3. However, the NEDA-BVL results show a significant drop in sensitivity when compared to NEDA-3 patients. This difference in NfL levels is most probably driven by the “NEDA-3 component,” which is included in NEDA-BVL. Comparison of pNfL levels in NEDA-3 and NEDA-BVL showed no difference (6.99 ± 1.99 vs 6.96 ± 2.17), and this seems to indicate that pNfL does not well capture BVL. Similar findings have been reported in a few studies.2,21 This may be also reflected by the two AUC values: NEDA-3-AUC (0.902) was higher than NEDA-BVL-AUC (0.757). This probably reflects the smaller number of patients with NEDA-BVL status compared with the NEDA-3. In fact, it allows us to conclude that an analysis with NfL as the dependent variable may better quantify the association between NfL and recent BVL and indicate whether NfL and BVL may be somehow complementary. Based on this observation, BVL along with pNfL appears to be a useful tool.
NEDA-3 status is a widely used target of DMT in MS patients and is considered annually in every patient before the decision regarding the continuation of therapy.11,22 Due to widespread criticism, the current NEDA-3 concept will be probably revised eventually. One of the known disadvantages of NEDA-3 is that it mainly reflects the inflammatory component, while neurodegenerative processes can progress undetected. Another disadvantage is that the widely used EDSS scale (the actual concept of NEDA) may not accurately detect the progression of disability. It is known that sustainability of three-domain NEDA differs among DMTs8,23,24 and that disability progression in patients despite meeting criteria of NEDA-3 is possibly a consequence of brain and spinal cord atrophy. 6
Thus, we choose NEDA-BVL status for analysis of the relationship between pNfL (as a biomarker of neuroaxonal loss) and disease activity. Our results show that the plasma NfL level is a sensitive marker of MS disease activity and is associated with BVL. In contrast to other studies with early MS patients, we studied a cohort of RRMS patients with established ongoing disease and therapy, and our results show that pNfL levels at any point during the disease course show an association with NEDA-BVL status.
The main contribution of this study is the strength of the association between the “gold standard” measurement of current disease activity (NEDA-3) and pNfL, expressed by the area under the ROC curve. However, because this is only the first and an observational study, it is clearly necessary to verify the validity of our findings in the future in a wider range of patients. Current ROC analysis leads to a discussion of possible false positives, where pNfL also covers cases with spinal activity or subclinical disease activity, while false negatives may represent those whose pNfL does not capture the activity of an NEDA-related disease, for example, brain disorders other than MS or disease activity in the distant past.
NfL have recently been studied in many associations in MS patients,5,6 as they correlate with disease severity measured with MRI,1,4,6,7 with T2 lesion volume, as well as brain atrophy at follow-up.4,25 Studies have shown that BVL in MS correlates with brain inflammatory activity and predicts long-term disability status. 21 Slowing brain atrophy is currently one of the important markers of effective MS therapy. The study of Sormani et al. 9 pointed out the relationship between NfL and NEDA-3 as well as the NEDA-BVL concept.
We conducted this study to determine the association between pNfL levels and current disease activity and its benefit for our routine practice in the patient’s regular annual evaluation. Based on the results of this study, we assume that pNfL has the potential to discriminate those patients having NEDA-3 and NEDA-BVL status. NfL samples taken every 6 months may in the future be an alternative to annual brain MRI as a part of a combined assessment of disease activity in individual MS care. pNfL seems to be a supportive marker in those patients who have been apparently stable for a long period or a possible indicator of absent disease activity.
This study has several limitations: the follow-up in our cohort was relatively short; therefore, we want to emphasize the need for a longitudinal collection of NfL samples in a prospective study with a larger cohort of RRMS patients for better explanation of NfL validity in individual disease course. We did not take into account all of the patients’ comorbidities, vascular risk factors and aging, known factors which may affect NfL levels. Regarding brain volume measurement, there are several known obstacles in data interpretation, or MRI volumetric techniques.8,26
Conclusion
BVL measurement, along with pNfL levels, appears to be a useful tool for assessing current disease activity in MS patients.
Supplemental Material
sj-pdf-1-msj-10.1177_1352458521998039 – Supplemental material for Plasma neurofilament light chain levels are predictors of disease activity in multiple sclerosis as measured by four-domain NEDA status, including brain volume loss
Supplemental material, sj-pdf-1-msj-10.1177_1352458521998039 for Plasma neurofilament light chain levels are predictors of disease activity in multiple sclerosis as measured by four-domain NEDA status, including brain volume loss by Jarmila Szilasiová, Pavol Mikula, Jaroslav Rosenberger, Miriam Fedičová, Zuzana Gdovinová, Peter Urban and Lýdia Frigová in Multiple Sclerosis Journal
Footnotes
Acknowledgements
The authors thank all patients with MS who participated in this study. The authors also thank M Novák and J Hanes from the Slovak Academy of Sciences Bratislava for technical assistance and support.
Author Contributions
All authors made substantial intellectual contributions to the study, critically reviewed the manuscript, and approved the final version of it. J.S. performed the initial literature review and wrote the first draft of the manuscript. J.R. and P.M. supervised the work and performed the statistical analyses. Z.G. revised the manuscript. P.U. performed the laboratory tests. L.F. performed and revised the radiological evaluation.
Declaration of Conflicting Interests
The author(s) declared the following potential conflicts of interest with respect to the research, authorship, and/or publication of this article: The authors declare the following financial interests/personal relationships which may be considered as potential competing interests: Dr J.S. has received personal compensation for consulting, serving on a scientific board, speaking or other activities, with received compensation for serving on a scientific advisory board from Biogen, TEVA, Sanofi, Novartis, Roche and Merck, and for consultancy from Merck and Biogen. Mgr P.M. has no potential conflict of interest. Dr J.R. has received personal compensation for consulting and speaking or other activities, with received compensation from Mundipharma. Dr M.F. has received personal compensation for consulting, speaking or other activities from Biogen, Merck, Roche, Novartis, Sanofi, and TEVA. Dr Z.G. has received personal compensation for consulting, serving on a scientific board, speaking or other activities, with received compensation for serving on a scientific advisory board from Bayer, Biogen, Boehringer Ingelheim, Merck, MSD, Novartis, Pfizer, Takeda, and Teva. Mgr P.U. has no potential conflict of interest. Dr L.F. has no potential conflict of interest.
Ethical Approval and Consent to Participate
This study was approved by the Ethics Committee of the Louis Pasteur University Hospital in Košice.
Funding
The author(s) disclosed receipt of the following financial support for the research, authorship, and/or publication of this article: The study was supported by the Scientific Grant Agency of the Ministry of Education of the Slovak Republic (VEGA 1/0057/2018 and VEGA 1/0540/2020) and research on biomarkers of neurological disorders, UNLP, and UPJŠ LF Košice. The funding bodies did not play any role in the collection, analysis, and interpretation of the data, nor did they contribute to the writing of this manuscript.
Supplemental Material
Supplemental material for this article is available online.
References
Supplementary Material
Please find the following supplemental material available below.
For Open Access articles published under a Creative Commons License, all supplemental material carries the same license as the article it is associated with.
For non-Open Access articles published, all supplemental material carries a non-exclusive license, and permission requests for re-use of supplemental material or any part of supplemental material shall be sent directly to the copyright owner as specified in the copyright notice associated with the article.