
Abstract
This study investigates the functions of international tourism hubs, namely, the gathering and distributing function, transferring function, and management and service function. An assessment index of 49 indicators is developed measuring these functions based on the literature review and a survey of expert panel. Analytical hierarchy process method was applied to determine the importance weight of the indicators. Two cities in China, Beijing and Shanghai, were selected to empirically test the assessment index and compared with the tourism hub functions. The results indicate that Beijing has stronger functions on gathering and distributing tourists, as well as management and services, while Shanghai exceeded on transferring function due to its tourist distribution center. Strategic and managerial implications and suggestions are provided based on the study results.
Introduction
Tourism, as a major global industry, has been widely recognized as a primary source of revenue and employment due to the international tourism receipts for many countries (Dwyer and Forsyth, 1997), especially for promoting the economic growth in less developed regions (Li et al., 2015). Destinations therefore compete with each other to gain more visitations through improved competitive advantages. Extant literature on geography of tourism transport and tourist flow and planning has highlighted the importance of the nodal function of a competitive tourism destination (Lohmann and Pearce, 2010). Lohmann and Pearce (2010) conceptualized and operationalized the nodal functions of tourism, which include various origins, destinations, gateways, hubs, stopovers, and other subcategorizations. Hub is one of the most important functions, referring to special nodes that are part of a network and is located to facilitate connectivity among interacting places (O’Kelly, 1998). Therefore, they often act as catalysts for clustering economies because of their direct and accessible connection to many spoke cities (Lohmann et al., 2009).
Hub networks are found essential in several areas of modern society, including transportation, telecommunications, and logistics (Horner and O’Kelly, 2001). A well-connected transportation hub network can make tourism destinations more accessible and interconnected, thus supporting regional development and leveraging tourism activities (Lohmann et al., 2009). From the tourism development perspective, hubs allow direct connections between pairs of origin and destination being replaced by fewer, indirect connections and simplified network, which eventually centralize the passenger handling and sorting and facilitate destination carriers to take advantage of scale economies through the consolidation of passenger flows (Chou, 1990; Devany and Garges, 1972; Kanafani and Ghobrial, 1985; Lohmann et al., 2009; Lohmann and Pearce, 2010; Toh and Higgins, 1985).
Considering the importance of hubs, many international cities intend to build themselves as international tourism hubs in order to control regional tourism flows. Nonetheless, to the best of authors’ knowledge, no previous literature provides the exact evaluation scheme of international tourism hubs, and equally limited empirical research exists in assessing the functions of international tourism hubs. Meanwhile, for developing countries with a fast-growing tourism industry, such as China, major gateway cities play significant roles in tourism flow and regional economic development. Gateways in a general sense are seen as major entry/exit points into or out of a national or regional system; they not only link other nodes within a national or regional network but also serve to link one network to another (Burghardt, 1971; Pearce, 2001). Tier I cities such as Beijing, Shanghai, and Guangzhou are the major gateways to enter and exit China, thus altogether control the direction and volume of China’s inbound and outbound tourism flow (Li and Ma, 2003; Liu et al., 2010; Wang et al., 2012). Beijing and Shanghai have been strategically accelerating the airport construction so as to improve their international hub functions. Shanghai currently aims to become the international air logistics center relying on the “free-trade zone,” while Beijing is constructing a new international airport. Moreover, the “72-h visa-free transit” policy launched in five major Chinese cities in 2013 is expected to enhance destinations’ attractiveness and establishment of international tourism hubs (Li and Song, 2013; Song et al., 2012).
Therefore, this study aims to develop an evaluation scheme to assess the functionality of international tourism hubs by systematically establishing a list of assessment index. Furthermore, this study applies the developed assessment index to examine Beijing and Shanghai as potential international tourism hubs. A quantitative comparison is made between the two cities, and practical implications for both cities are derived from the analytical results. This study is expected to provide insights of international tourism hubs and its application for destination competitiveness. The contributions of this research are multifolded. Academically, the study makes an initial attempt to define and distinguish “international tourism hub” from conventionally discussed “transportation hub.” Practically, this study provides a comprehensive evaluation scheme for international tourism hubs and technically answers the question “what requirements should a city meet in order to become an international tourism hub?” Meanwhile, the innovative comparison between Beijing and Shanghai based on the proposed assessment index serves as a case for evaluating intentional tourism hubs. Finally, the findings would assist public sectors in formulating development policies for Beijing and Shanghai to establish international tourism hubs in both cities.
Literature review
The “hub” concept is well defined in the transportation industry. Conventionally referred to, in a general sense, a place with functions as crossroads or any large airport or airline operating base, a hub has been used with a more technical meaning as the result of changes in airline practices and their transfer functions within a wider network (Dennis, 1994). Establishing a hub not only makes all operating stations more mutually accessible on an airline’s network but also minimizes the number of flight interchanges to the passenger’s convenience (Toh, 1984). Lew and McKercher (2002) stated that a hub is a place where more than one route for a transport medium (usually air or rail) converge and emanate. From the air traffic management perspective, Button (2002) proposed the definition of a “hub airport”—the geographical and temporal concentration of traffic through an airport that is important to which airline carries it. In addition to the character of “concentration or centrality,” a hub is also defined as a transit point that allows economic efficiencies through concentrations of service and economies of scale (Lew and McKercher, 2002).
On this basis, Fleming and Hayuth (1994) used the terms “centrality” and “intermediacy” as spatial qualities that enhance the traffic levels of transportation hubs and hence indicate that they are places strategically located within transportation systems. Matsumoto (2007) examined international air passengers, cargo flows, and the degree of air traffic density of major cities within and among Asia, Europe, and America. The results revealed that many cities are strengthening their position as international transportation hubs, especially Tokyo, Hong Kong, Singapore, London, Paris, Frankfurt, Amsterdam, New York, and Miami.
As a basic condition of establishing a tourism hub, a transportation hub plays a critical role in tourism development. Transport infrastructure largely determines the destination accessibility and tourism inflows into a destination (Khadaroo and Seetanah, 2008; Lew and McKercher, 2002). Using the gravity model, Khadaroo and Seetanah (2008) reported that transportation infrastructure, especially the aviation infrastructure, significantly affect international tourism flow and its scale. Therefore, adequate transport infrastructure is a prerequisite for receiving, accommodating, and processing visitors, which serves as the basis for tourism destination development (Lohmann et al., 2009). Raguraman (1997) stated that transport plays a “generative” or “facilitative” role in economic development, as transport capacity either directly leads to or supports, in the presence of other factors, the expansion in productive potential of a region. Well-connected transport networks can make tourism destinations more accessible and interconnected and thus assist in regional development and play an important role in leveraging activities (Lew and McKercher, 2002).
Tourism hub is a relatively new concept without much previous research compared to conventional transportation hub. Lew and McKercher (2002) defined any place that is visited more than once in a multiple destination itinerary as a hub destination. By examining the relative location of a destination within the larger itinerary pattern, they found that international air travelers to Hong Kong exhibit the following patterns: single destination, gateway destination, egress destination, and touring destination. Although Hong Kong serves as a regional transportation hub for airlines and other transportations, it does not function as a hub destination for most people’s trips due to the relatively high cost of airline travel. At a small geographic scope, however, McKercher (2001) reported that Hong Kong does serve as a ground-based hub destination for overnight trips to Macau and Guangdong province.
A more representative case of an international tourism hub is Singapore. With its geographical advantage, Singapore builds itself as a leading tourism on-route destination stop by applying a long-term, orchestrated strategy that integrates tourism, aviation, and governmental support (Lohmann et al., 2009; Sikorski, 1986). Singapore Changi Airport is one of the busiest airports in the world providing airlines to more than 200 destinations in 68 countries (www.changiairport.com). The airport is defined as a “destination in itself” by providing various attractions and tourist activities including shopping, recreation, and entertainment (Changi Airport, 2007). More importantly, the airport has well-established linkage to the city’s mass transit network and other visitor assistance facilities such as the Singapore Visitor Center (Lohmann et al., 2009). In addition, Singapore Stopover Holiday program, which includes a variety of discounted or free accommodations, restaurants, attractions, car rentals, and airport transfers, contributes to Singapore’s success of becoming a tourism hub (Low and Toh, 1997; Raguraman, 1997).
Tourism hub is the intermediary or bridge between source market and destination, and it serves both domestic and international tourists. There are four types of tourist flows: (a) domestic tourists travel to domestic destinations via tourism hub, (b) domestic tourists travel to international destinations via tourism hub, (c) international tourists travel to domestic destinations via tourism hub, and (d) international tourists travel to international destinations via tourism hub. This study mainly focuses on the (c) and (d) types of tourism hub, which refers to the international tourism hub. Based on “hub-and-spoke” network, we define the tourism hub from the perspective of the relationship between tourism hub and surrounding tourism spoke cities. In this definition, tourism hub refers to the main access/gateway to reach the final destination and the main egress to home origins. Simultaneously, it provides tourism resources and information services of the tourism spoke cities; meanwhile, spoke tourism cities provide additional tourism attractions and activities to the tourism hub, and relieve the capacity pressure during tourism hub city’s peak period.
Based on extant literature of transportation hub functions and international tourism city characteristics (e.g. Dennis, 1994; Khadaroo and Seetanah, 2008; Lew and McKercher, 2002; Lohmann et al., 2009; O’Kelly, 1998; O’Kelly and Miller, 1994), three primary functions of tourism hub are identified: gathering and distributing function, transferring function, and management and service function. The gathering and distributing function of a tourism hub refers to its capability to accommodate and distribute international tourists from the origins to the end destination. During the process of gathering and distributing, the tourism hub’s external transportation that connects with the source markets and destinations is an important precondition for the success of tourists’ gathering and distributing.
The transferring function of a tourism hub indicates the hub’s capability to move tourists/passengers from one gathering/distributing platform to another within the same city for the next connecting journey. The hubbing, where passengers changed planes to continue their journey, often involved interlining and a change of airline and/or other transportation (Button, 2002). Therefore, tourism hub as a “must-pass” place should provide easy-to-access connecting points in order to transfer tourists to many other tourism destinations.
The management and service function of a tourism hub focus on the services in the entire process of tourists’ gathering, distributing, and transferring. Examples of services include visa application at the gathering stage, luggage transit at the transferring stage, and additional itinerary services during the distributing process. Similar to Changi Airport, Dubai International Airport has followed a strategy of providing a comprehensive and reliable service throughout its nonaeronautical business (Lohmann et al., 2009). In sum, Figure 1 demonstrates the diagram of tourism hub functions.
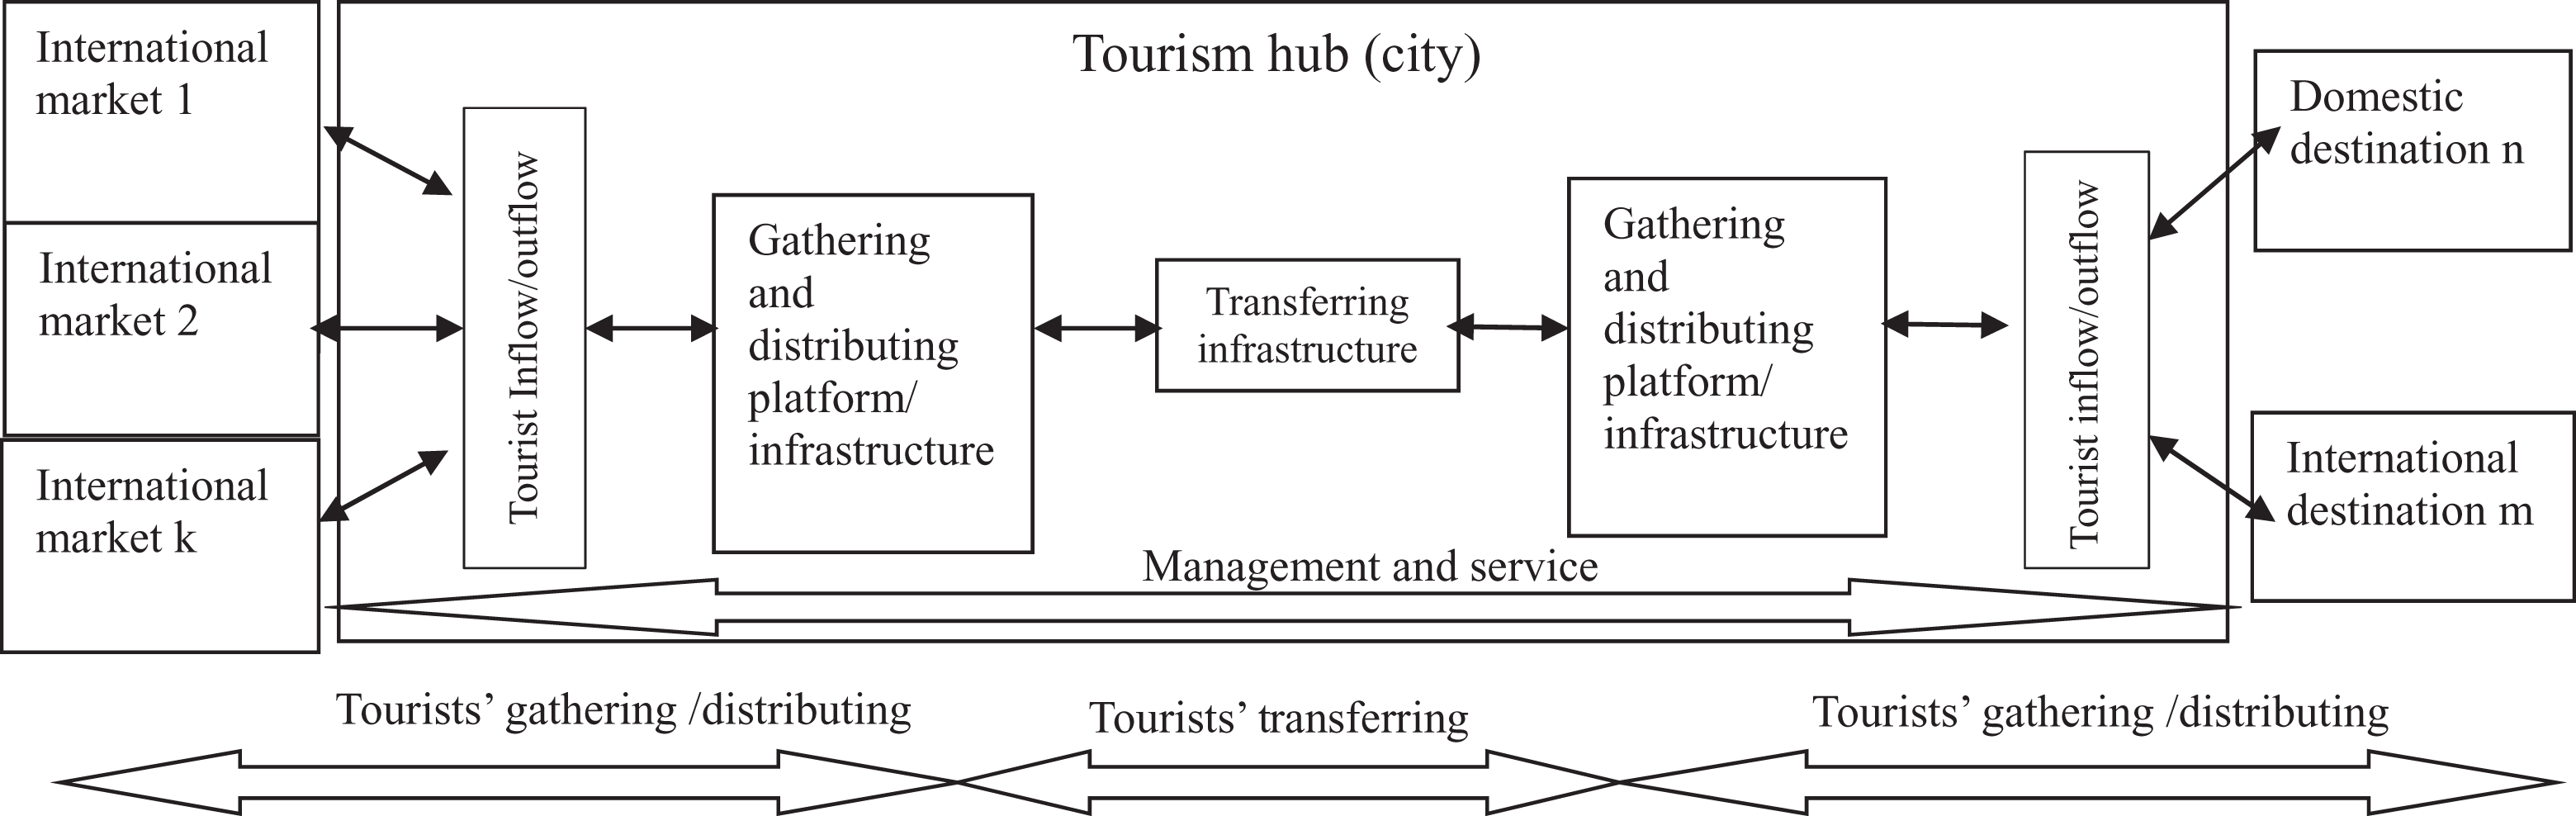
Schematic diagram of tourism hub functions.
Previous studies on assessment of international tourism hubs present certain limitations (Button, 2002; Fleming and Hayuth, 1994; Lew and McKercher, 2002; O’Kelly and Miller, 1994; Toh, 1984). First, most studies on international cities define them as merely tourism destinations and establish the corresponding assessment indicators from the perspective of improving their competitiveness. Thus, the functions of tourism hub for the international cities are neglected. Second, most previous studies focused on transportation hub, but only few relate to theoretical and empirical studies on international tourism hubs. Currently, the definition, connotation, characteristics, and the functions of tourism hubs are blind spots in the literature. Third, extant studies on the construction of tourism hub cities are mostly case studies or purely descriptive in nature. This study aims to fill in the research gap by developing an assessment index of international tourism hubs and providing a quantitative comparison between Beijing and Shanghai with regard to their functions as international tourism hubs.
Method
Development of assessment indicators
The study used analytical hierarchy process (AHP) method to determine the importance weight of each assessment indicator. AHP, a structured technique for organizing and analyzing complex decisions, is a combination of both quantitative and qualitative methods that have a particular application in group decision-making. Users of the AHP decompose their decision problem into a hierarchy of easily comprehended subproblems. Once the hierarchy is built, the decision makers systematically evaluate its various elements by comparison in the hierarchy. The AHP converts these evaluations to numerical values that can be processed and compared over the entire range of the problem, and finally a numerical weight is derived for each element in the hierarchy, allowing diverse elements to be compared to one another in a rational and consistent way.
This study applied the Yet Another AHP (YAAHP) software (version 7.5) and surveyed a panel of 15 tourism experts to evaluate the validity and viability of the assessment index, and multiple rounds of revisions and adjustment were made based on the experts’ feedback. A three-level assessment index with a total of 49 indicators was developed accordingly to measure each function. Official public statistics from various government bureaus were used to empirically examine the assessment indicators. Specifically, first, based on the extant literature, the assessment indicators for the international tourism hubs were developed in the survey. Second, 15 experts from China’s public sectors in tourism, including tourism research institutes, tourism administration (Beijing Municipal Commission of Tourism Development), and international tourism organization (World Tourism Cities Federation), were selected to answer the survey questionnaire. The experts included 11 males and 4 females, and the majority of them were between 45 and 64 years old and had over 10 years or 15 years of experience in tourism. They were selected from diversified sources in research institutes, administration, and international organizations in tourism, which could possibly influence or guide the policy and planning development in the city tourism in China and internationally. Third, the expert responses were input into the YAAHP software (version 7.5) to determine the importance weight of each indicator in the assessment index of international tourism hub.
Sample selection
Beijing and Shanghai were chosen for the quantitative analysis and comparison, mainly for the following reasons. First, Beijing and Shanghai are China’s political and economic centers, respectively, and both are the top inbound tourism destinations and transferring cities. In 2012, Shanghai and Beijing ranked the first and second in the provincial international tourist arrivals and combinely represented 29% of China’s total inbound tourist arrivals. On this basis, Beijing and Shanghai have the potential to become the international tourism hubs. Second, both Beijing and Shanghai have strategic plans to accelerate the constructions with the aim to build themselves as international tourism hubs. Third, considering the data availability, both Beijing and Shanghai have more comprehensive data compared to other cities in China.
Data source
This study used the secondary data from multiple official government sources to empirically test the assessment index of international tourism hubs. The data sources included China Transportation Statistics, China National Tourism Administration, Beijing Statistics Bureau, Shanghai Statistics Bureau, China Port Yearbook 2012, Beijing Statistics Yearbook 2013, Shanghai Statistics Yearbook 2013, Beijing Capital International Airport Annual Report 2012, and Shanghai Airport Annual Report 2012.
The majority of the 49 assessment indicators were measured directly using the secondary data from the aforementioned statistics sources (marked by “⋆”). The rest of the indicators were measured by adopting quarterly assessment reports or surveys from official China Civil Aviation Statistics (marked by “¤”), “rating score” method that assigns scores to indicate the availability of services or different levels of services/functions (marked by “※”), field observation and survey (marked by “△”), and calculation of the average value between the field observation/survey and the suggested value of AutoNavi, the counterpart of Google map in China (marked by “*”).
Dimensionless quantity of data
The comprehensive assessment index of tourism hub includes a variety of indicators with different associated physical dimensions. Therefore, the data was reformed to have dimensionless quantity for assessment and comparison purpose. Based on the nature of each indicator’s effect on tourism hub functions, both positive and negative indicators are included in the assessment index and calculation. Positive and negative indicators are categorized depending on if they would possibly promote or prohibit tourism hub functions, respectively. For instance, the number of international flights per year indicates the passenger capacity of a tourism hub, which refers to an example of positive indicators, whereas time needed (minutes) by public transportation for transit shows the (in)convenience of transferring for passengers, and thus represents a negative indicator due to its reverse correlation with the transit efficiency of a tourism hub. When analyzing the effect of one type of indicators, correspondingly the other type of indicators is fixed or controlled. Therefore, a larger value of the positive indicators refers to stronger tourism hub functions, and vice versa. On this basis, the dimensionless quantities of these two types of indicators are calculated as follows: 1. Positive indicators:

2. Negative indicators:

where Pi is the transformed value after dimensionless, Di is the original value of the ith indicators, and
Based on the importance weight and the dimensionless value of each assessment indicator, the integrated score of city tourism hub function can be calculated as follows:

where F is the integrated score of the immediate higher level in the tourism hub functions, Pi is the dimensionless value, Wi is the importance weight of corresponding indicator, and m is the number of indicators. Each of the third-level indicators was calculated first, followed by the second-level indicator calculation, and the first-level indicators at the last step.
Findings
The YAAHP software was used to calculate the weight of each indicator in the assessment index based on the tourism expert responses (Zou et al., 2016). The three functions of tourism hub for Beijing and Shanghai were examined, and an overall comparison was performed between these two cities.
Gathering and distributing function
The gathering and distributing function were measured by two dimensions at the international level and domestic level (first-level indicator), which include six second-level indicators and 14 third-level indicators (codes: E1–E14). The importance weight for each indicator on each level is presented in Table 1.
Indicator scores of gathering and distributing function.
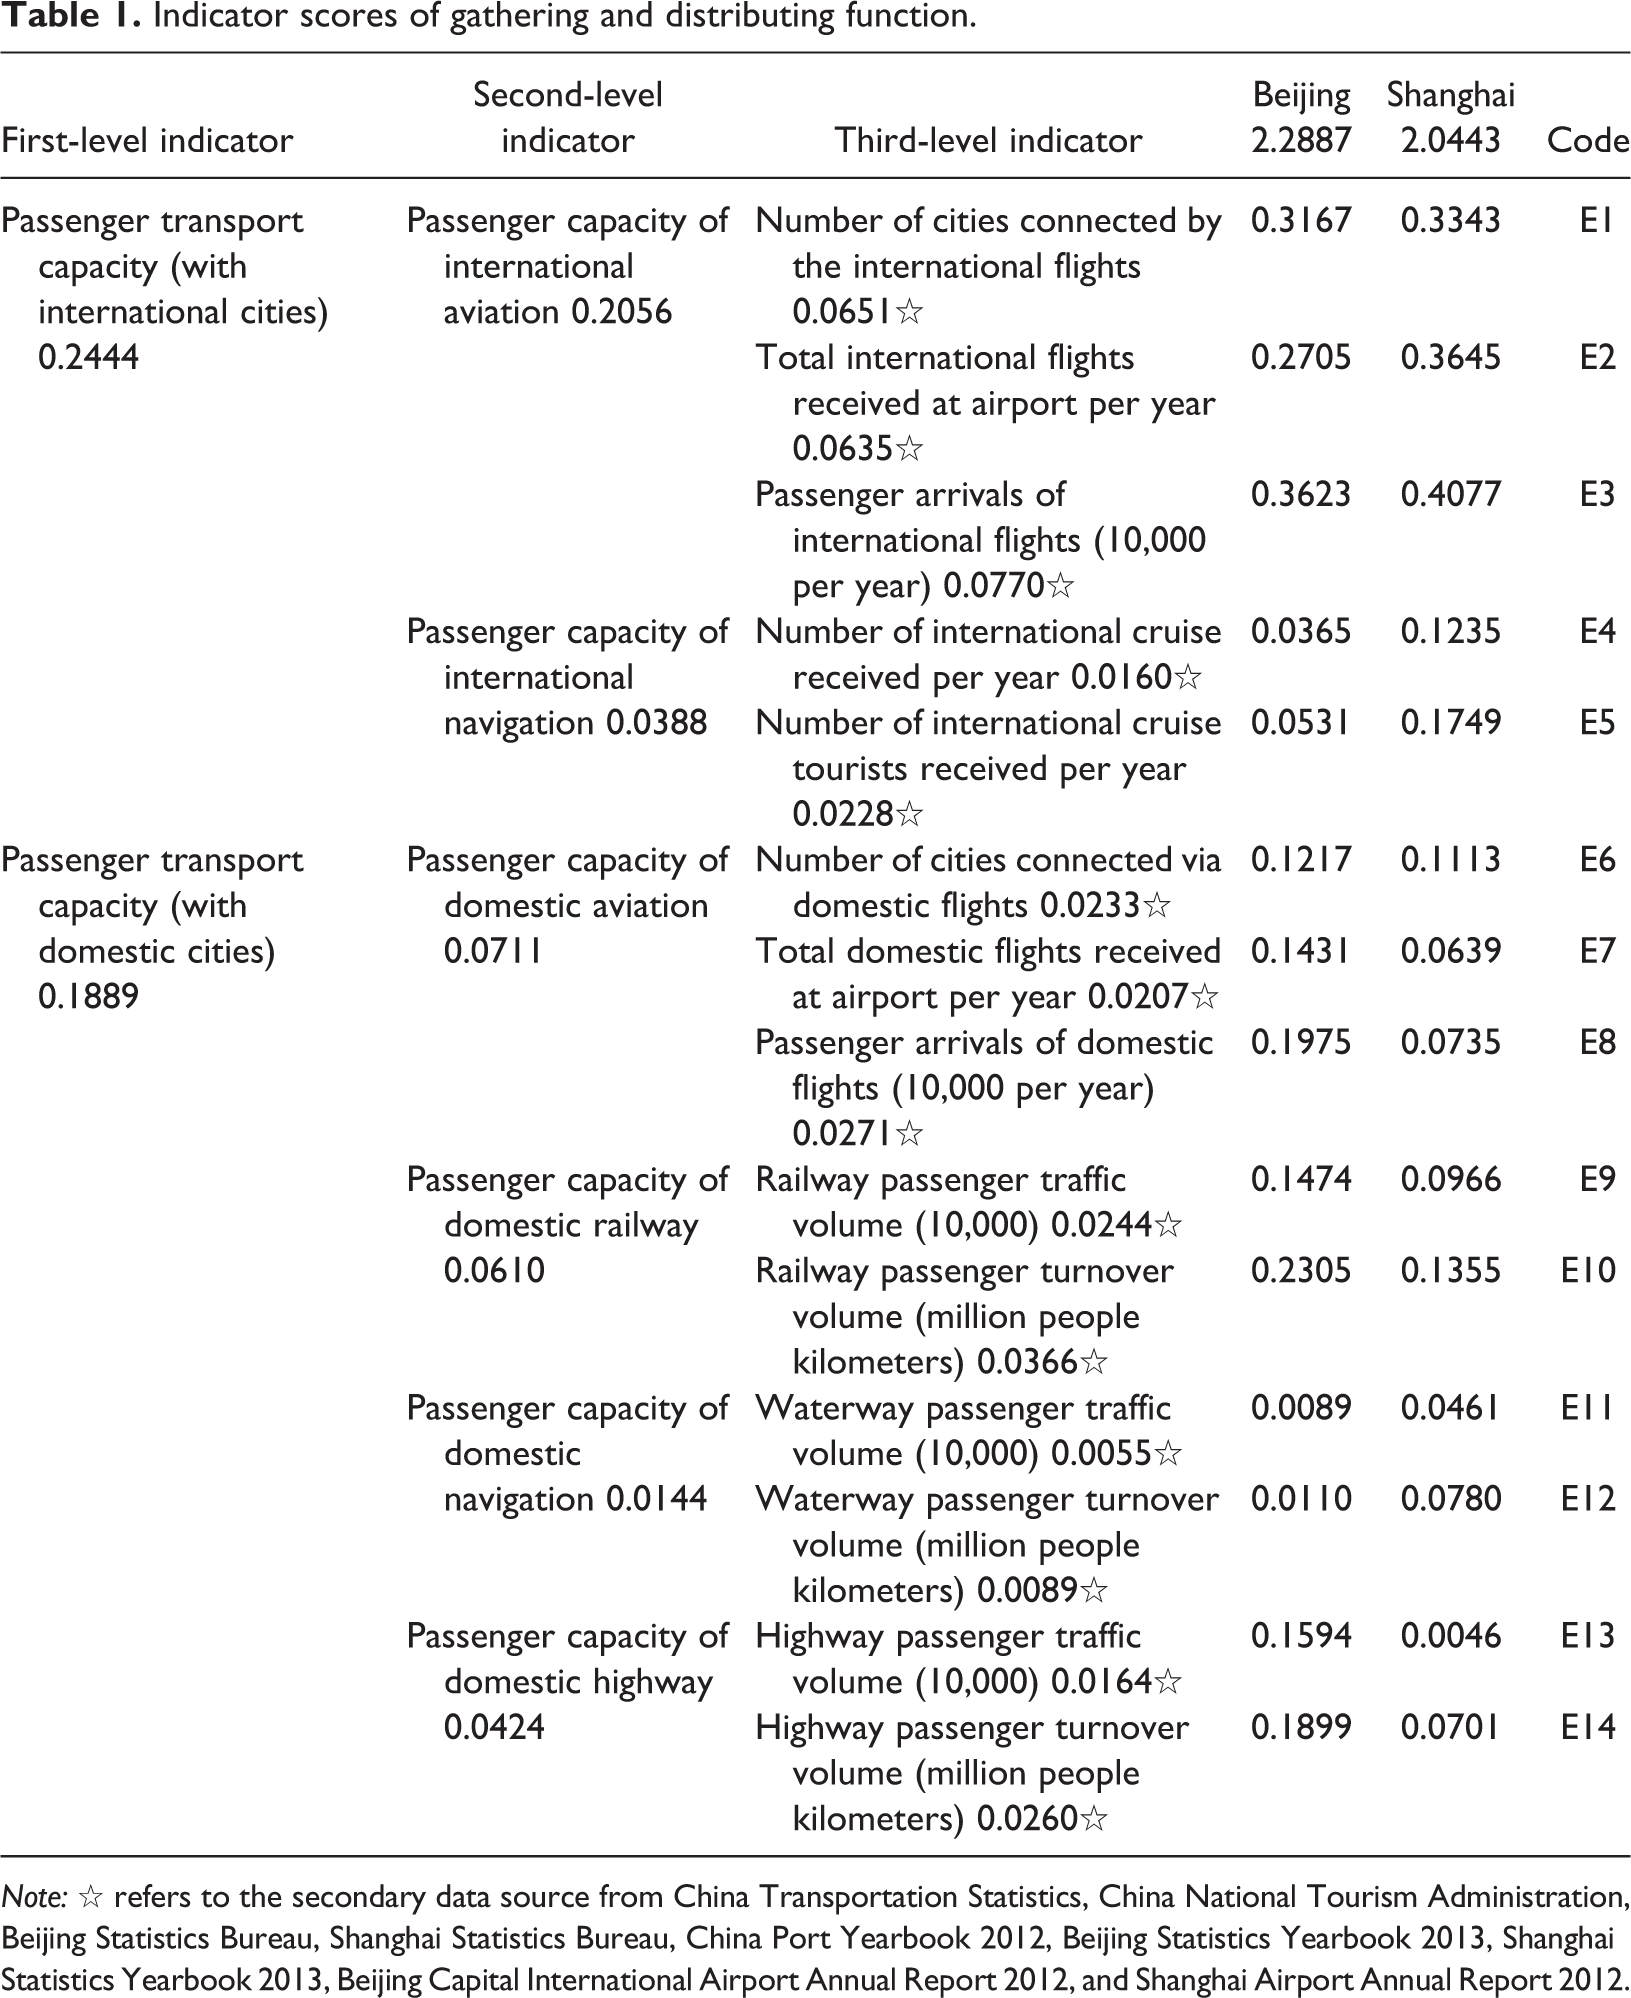
Note: ⋆ refers to the secondary data source from China Transportation Statistics, China National Tourism Administration, Beijing Statistics Bureau, Shanghai Statistics Bureau, China Port Yearbook 2012, Beijing Statistics Yearbook 2013, Shanghai Statistics Yearbook 2013, Beijing Capital International Airport Annual Report 2012, and Shanghai Airport Annual Report 2012.
The result indicates that domestic passenger transport capacity of Beijing exceeded that of Shanghai, but Beijing only had half of the international passenger transport capacity of Shanghai (see Figure 2). The comparison of the second-level indicators is presented in Figure 3. First, as for the indicators on international passenger transport capacity, Shanghai exceeded Beijing on all the measurement indicators, including international aviation and international navigation. The data of Tianjin Port was used to represent Beijing’s international navigation/cruise passenger capacity due to Beijing’s geographic location, and the results show that there was a large difference between Beijing (Tianjin Port) and Shanghai (Shanghai and Wusong Port) in terms of international cruise numbers and international cruise tourists. Second, as for the indicators on domestic passenger transport capacity, Beijing had higher scores than Shanghai on all indicators except for the domestic navigation/cruise. Being the political center of China, Beijing has relatively better traffic connectivity with other cities in China. The detailed comparison of the third-level indicators of gathering and distributing function between Beijing and Shanghai is presented in Figure 4.
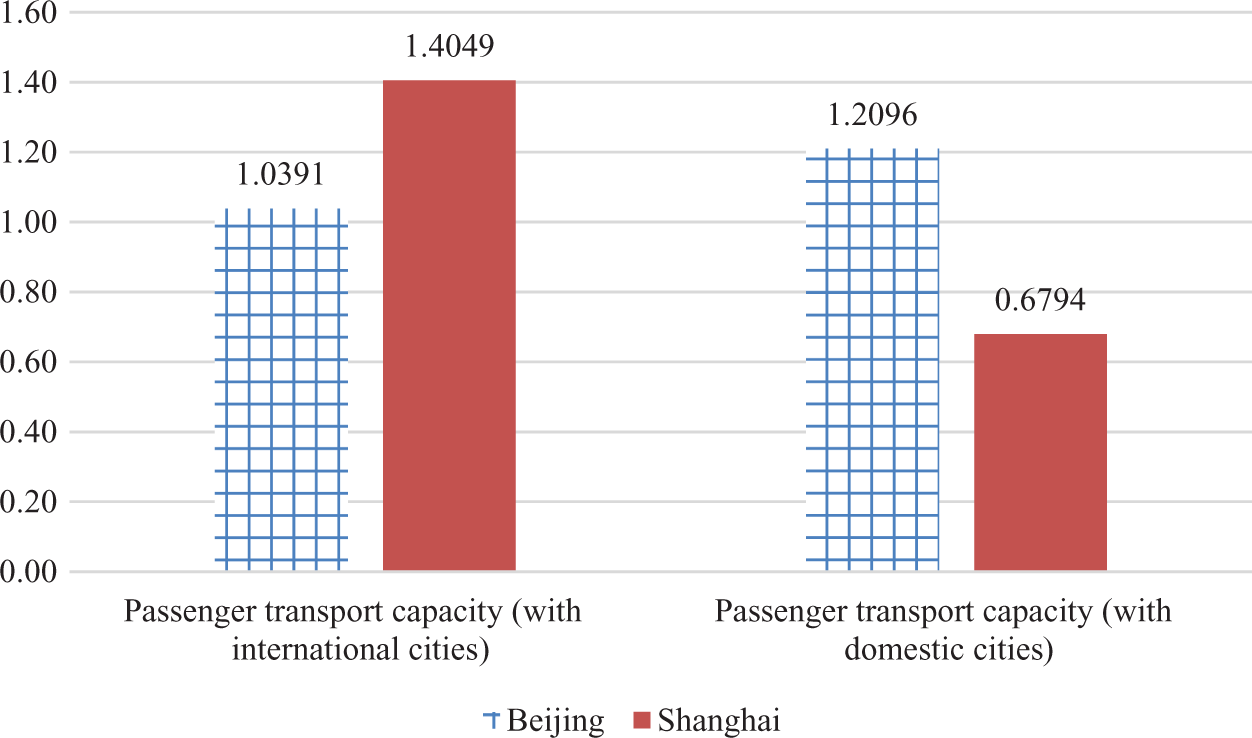
Comparison of first-level indicators of gathering and distributing function.
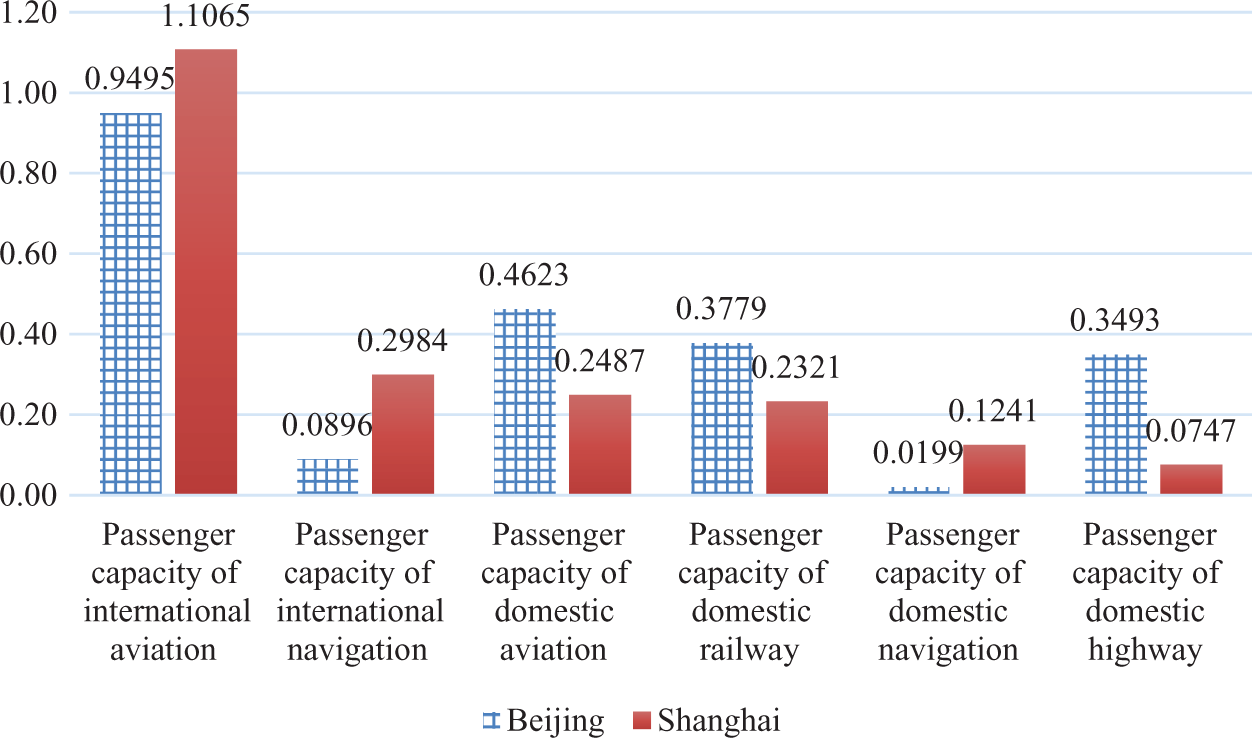
Comparison of second-level indicators of gathering and distributing function.
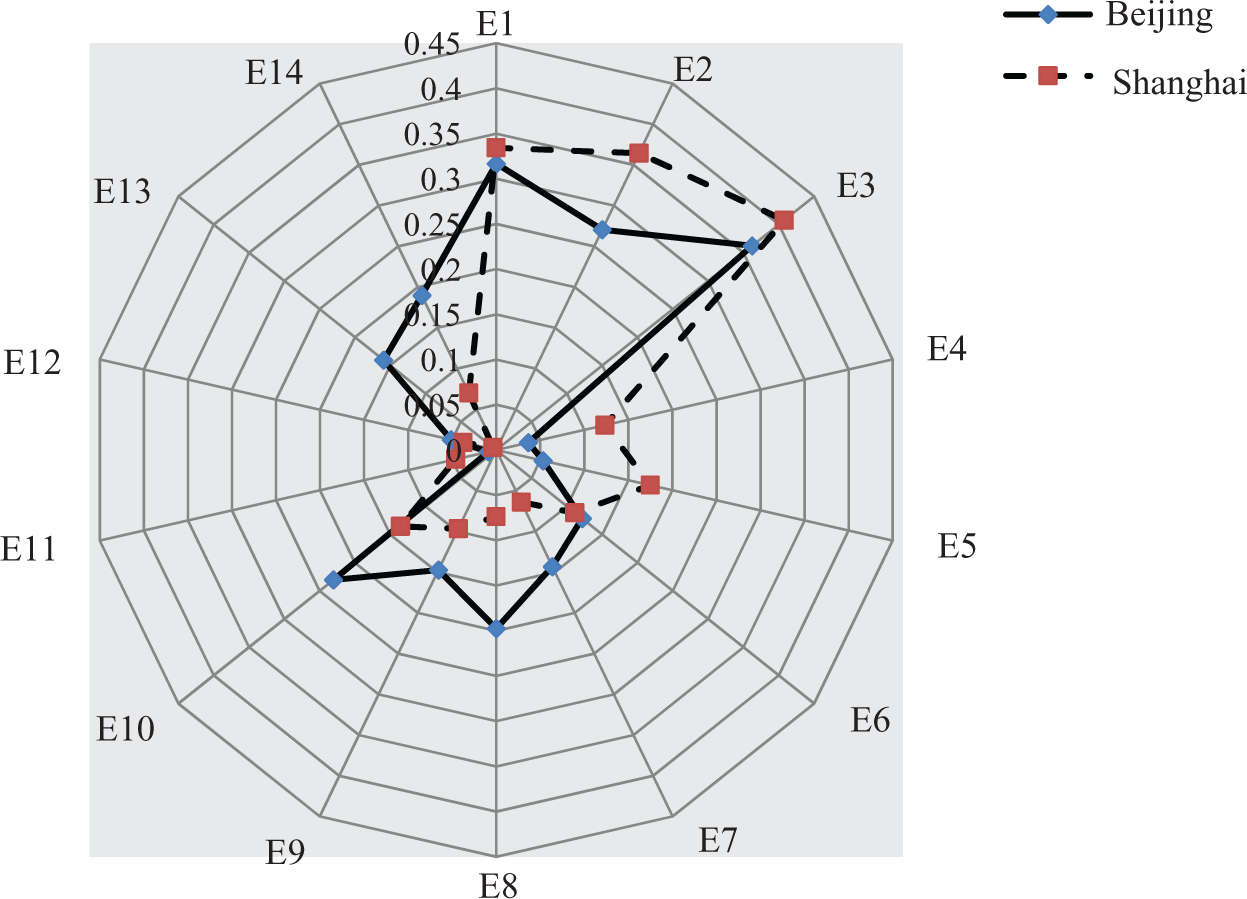
Comparison of third-level indicators of gathering and distributing function.
Transferring function
Three dimensions (first-level indicators) are used to measure the transferring function, including transferring efficiency, transferring cost, and transferring comfort/quality. In total, 9 second-level indicators and 22 third-level indicators (codes E15-E36) are included. The importance weight for each indicator on each level is presented in Table 2. The results show that the transit efficiency of Shanghai exceeded that of Beijing; the transit cost is similar between Beijing and Shanghai; the transit comfort/quality for Beijing is slightly better than that of Shanghai (see Figure 5).
Indicator scores of transferring function.
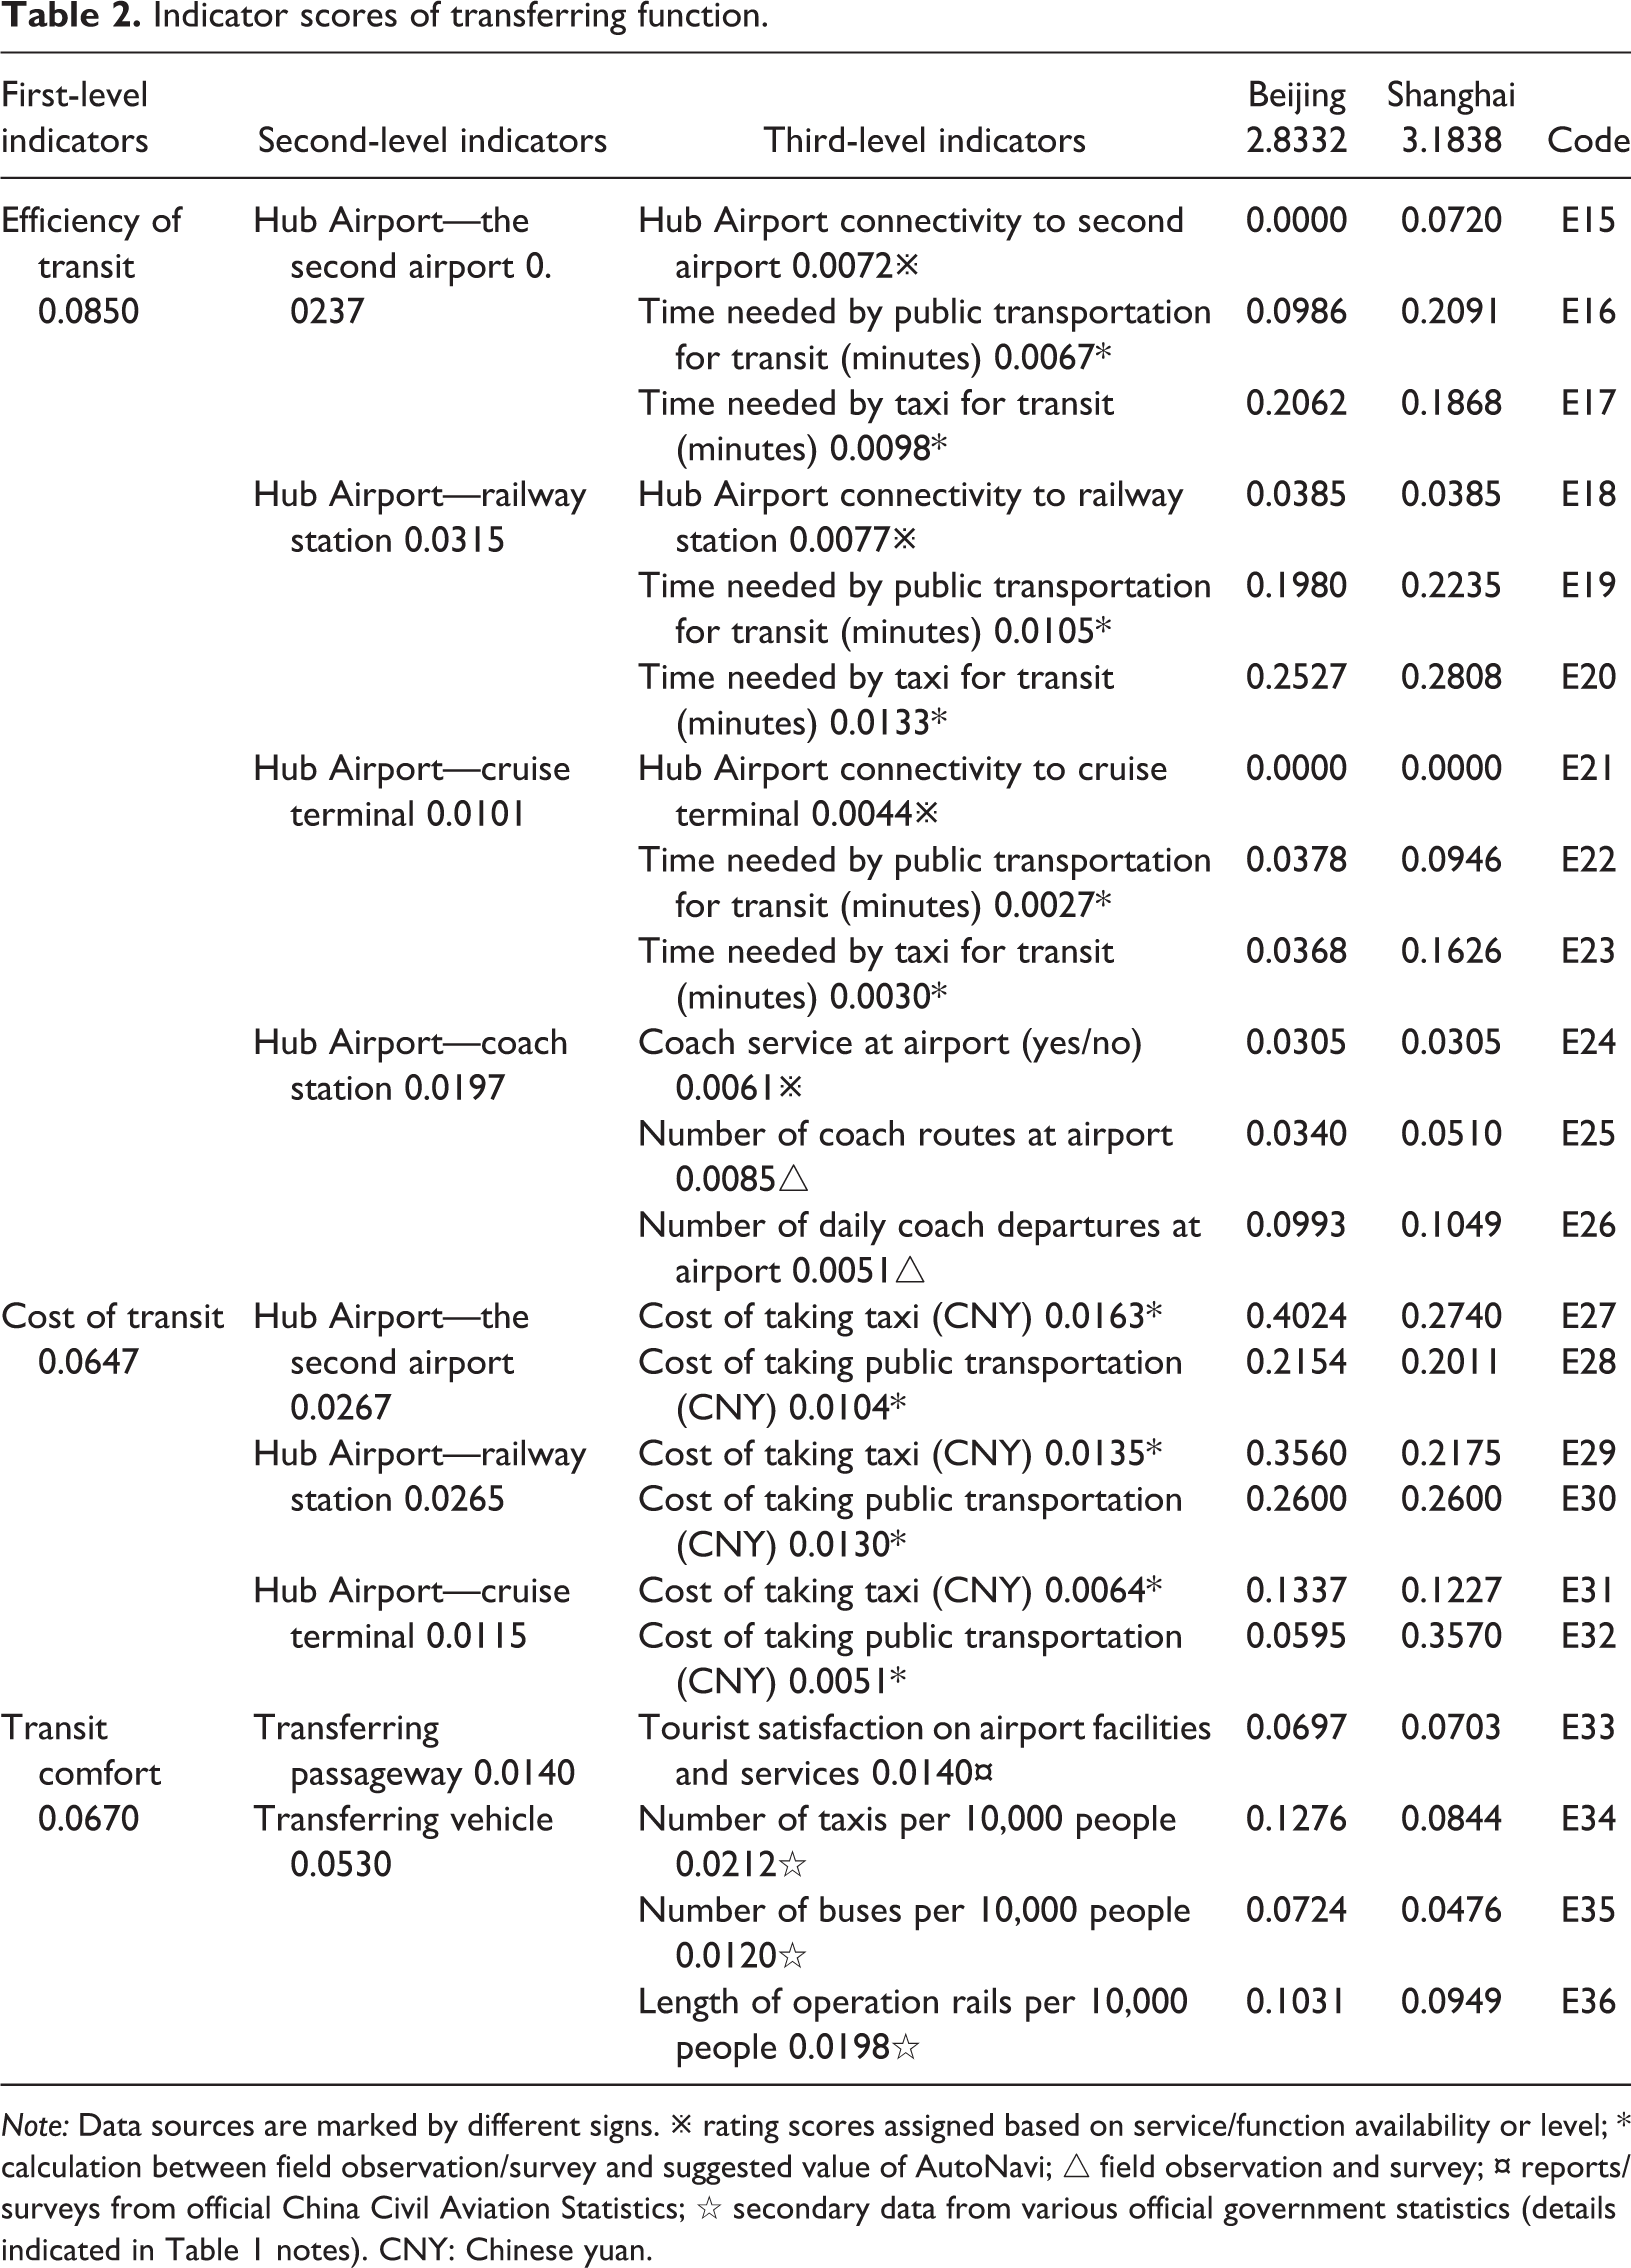
Note: Data sources are marked by different signs. ※ rating scores assigned based on service/function availability or level; * calculation between field observation/survey and suggested value of AutoNavi; △ field observation and survey; ¤ reports/surveys from official China Civil Aviation Statistics; ⋆ secondary data from various official government statistics (details indicated in Table 1 notes). CNY: Chinese yuan.
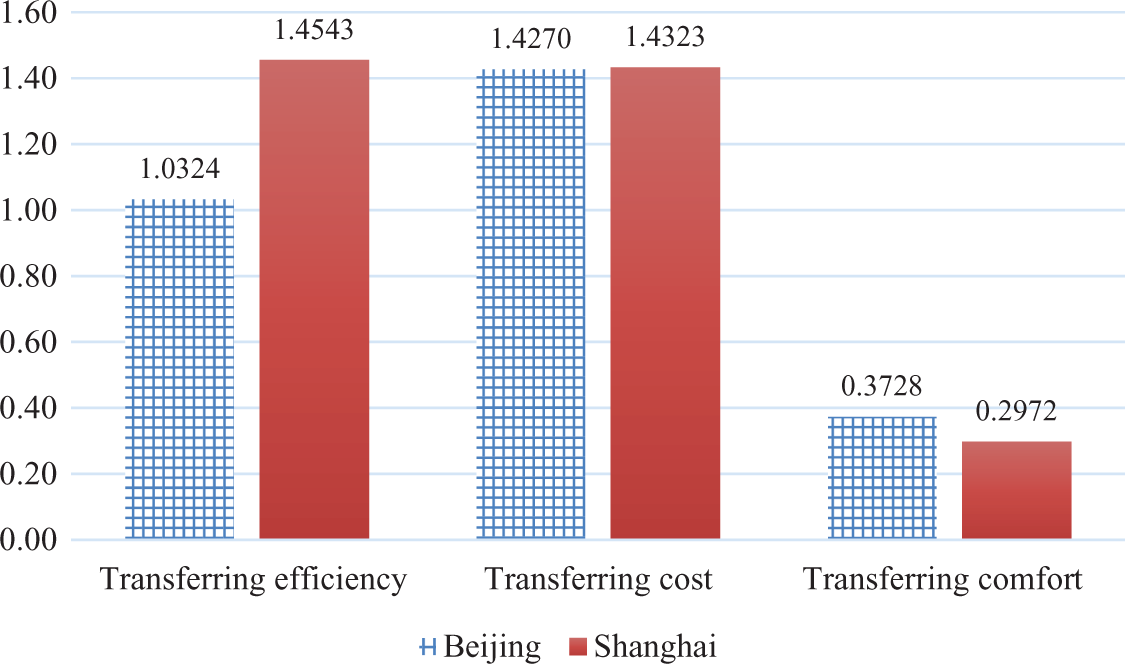
Comparison of first-level indicators of transferring function.
The comparison of second-level indicators is presented in Figure 6. In terms of the transit efficiency, the scores of four indicators for Beijing were all less than that of Shanghai. Specifically, the transit efficiency from Beijing Capital International Airport to Beijing Nanyuan Airport is lower than that from Shanghai Pudong Airport to Shanghai Hongqiao Airport. Although the Baidu map shows that the distance between the two airports in Shanghai is 54 km, which is significantly longer than Beijing’s 41.2 km, there are direct shuttle bus lines from Shanghai Pudong Airport to Hongqiao Airport via highway/overpass, whereas Beijing does not have such transportation. Due to the similar reason, the transit efficiency from Beijing Capital International Airport to Beijing railway stations, Tianjin Cruise Homeport, and coach stations was lower than the counterparts in Shanghai. Shanghai had more coach lines and more frequent coach departures. As the design of the coach lines is usually consistent with the demand of tourists, to some extent, this indicates that the demand of Beijing’s tourists for travelling to the surrounding regions is lower than that of Shanghai.
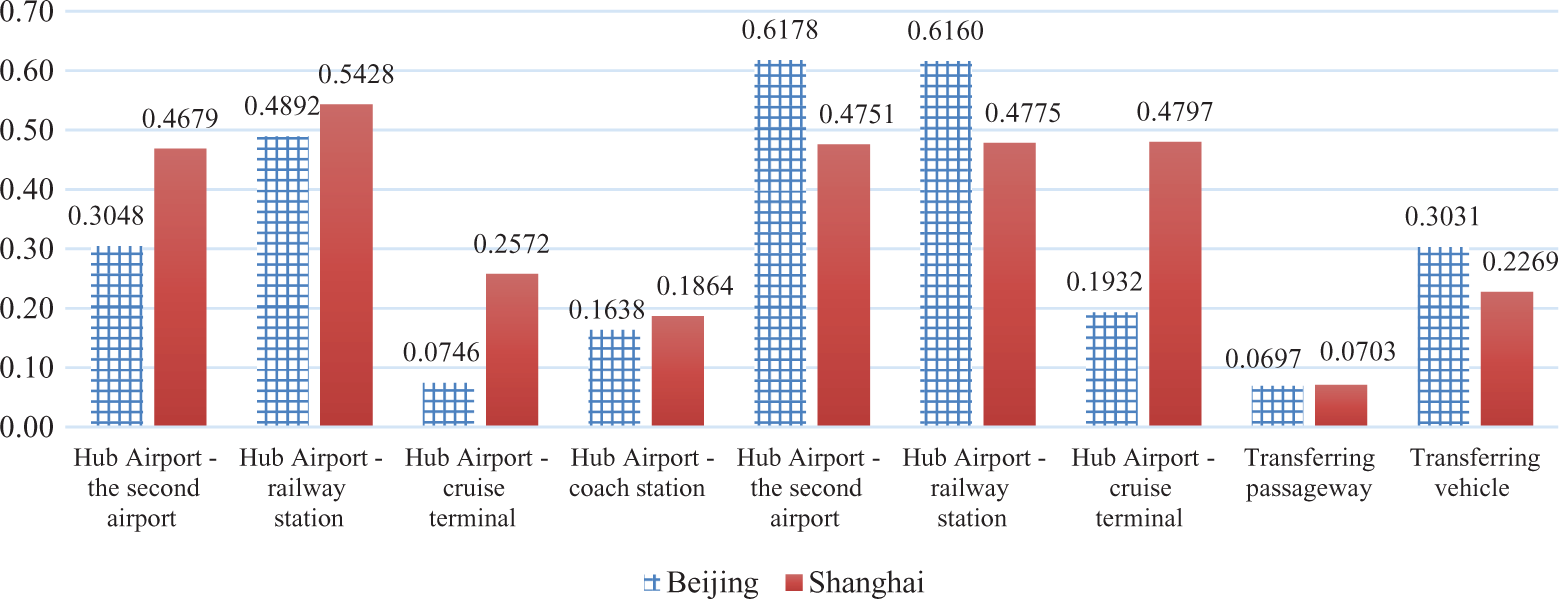
Comparison of second-level indicators of transferring function.
In terms of the transit cost, Beijing’s cost was lower than Shanghai on the indicators of “hub Airport to second airport” and “hub airport to railway station”. This can be explained by the shorter transit distance in Beijing and higher taxi fee in Shanghai. However, due to the constraint of the geographical location and the distance between Beijing and Tianjin, the transit cost is higher for Beijing on the cost of “hub airport to the cruise terminal.”
In terms of the transit comfort, the comfort/quality of Shanghai’s transferring passageway slightly exceeded that of Beijing but lower on transferring vehicle comfort. The data measuring transferring passageway comfort comes from Civil Aviation Bureau’s “Airport Service Assessment Report—satisfaction of airport facilities and services,” including 13 indices such as the adequacy of luggage trolleys, airport signages, airport environment and cleanness, personnel service, and Wi-Fi Internet access. Three indicators, including number of taxis, number of buses, and length of operation rails per 10,000 people, are used to measure the comfort of transferring vehicles, and the results show that all the scores on the above three indicators were higher for Beijing than for Shanghai. The detailed comparison of the third-level indicators of transferring function between Beijing and Shanghai is presented in Figure 7.
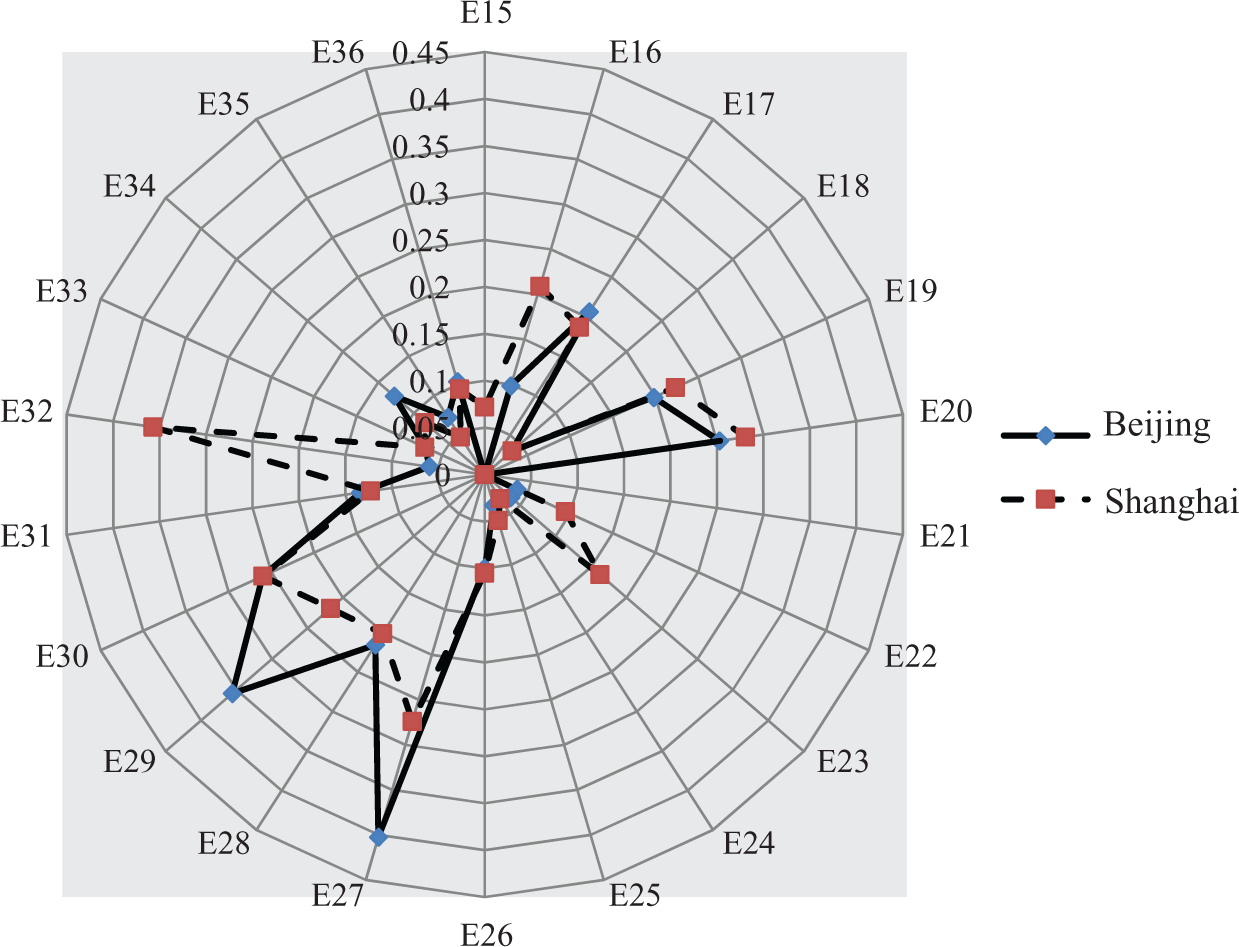
Comparison of third-level indicators of transferring function.
Management and service function
Quality service needs the support of government as well as tourism enterprises. Two dimensions (first-level indicators), namely, government management and tourism services, are used to measure this function; 7 second-level indicators and 13 third-level indicators (codes: E37–E49) are included. The importance weight of each indicator on three levels of management and service function is presented in Table 3. The results reveal that scores on government management were the same for Beijing and Shanghai, while Beijing had higher score on tourism service than Shanghai (see Figure 8).
Indicator scores of management/service function.
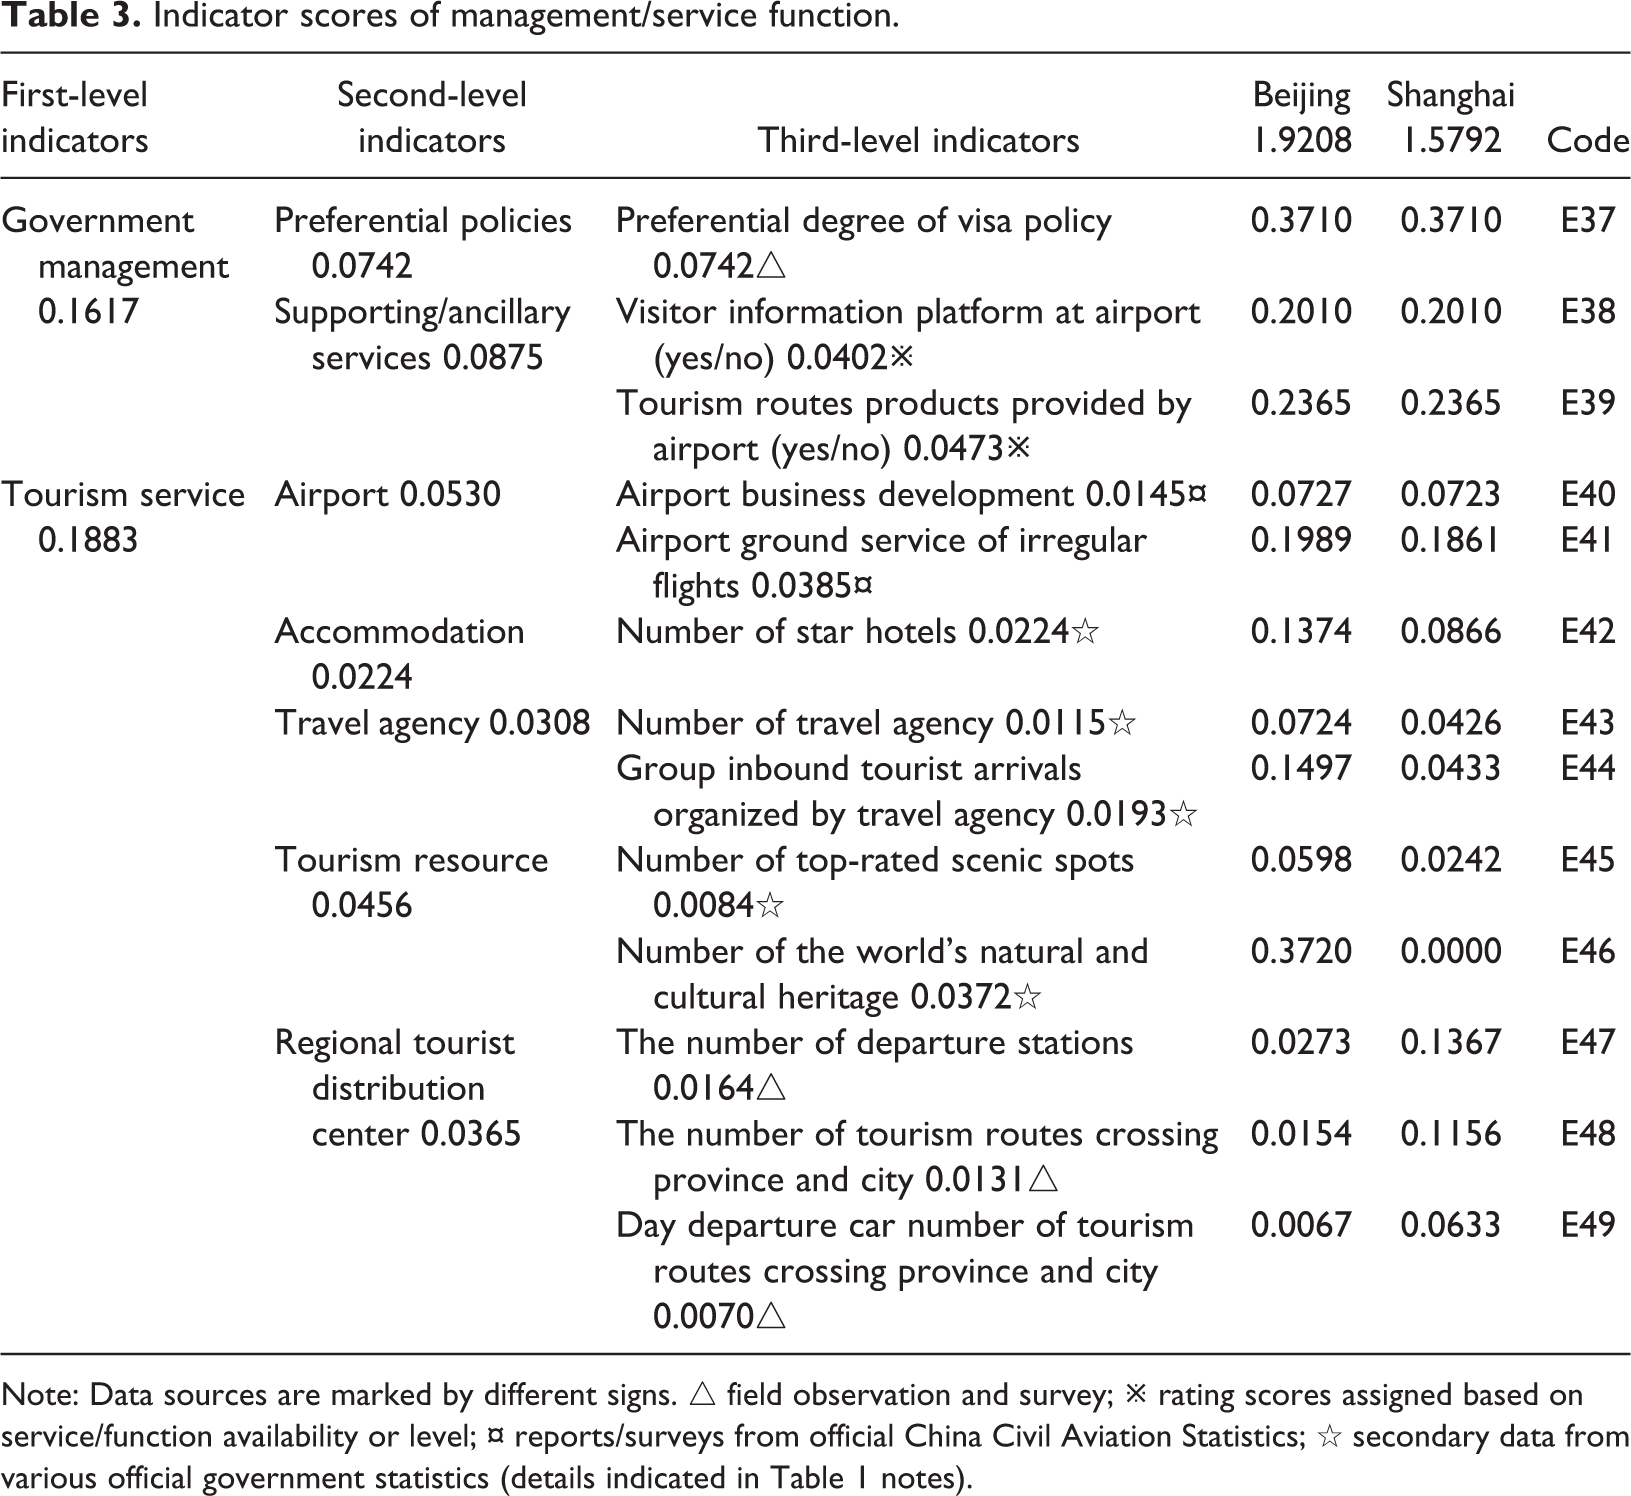
Note: Data sources are marked by different signs. △ field observation and survey; ※ rating scores assigned based on service/function availability or level; ¤ reports/surveys from official China Civil Aviation Statistics; ⋆ secondary data from various official government statistics (details indicated in Table 1 notes).
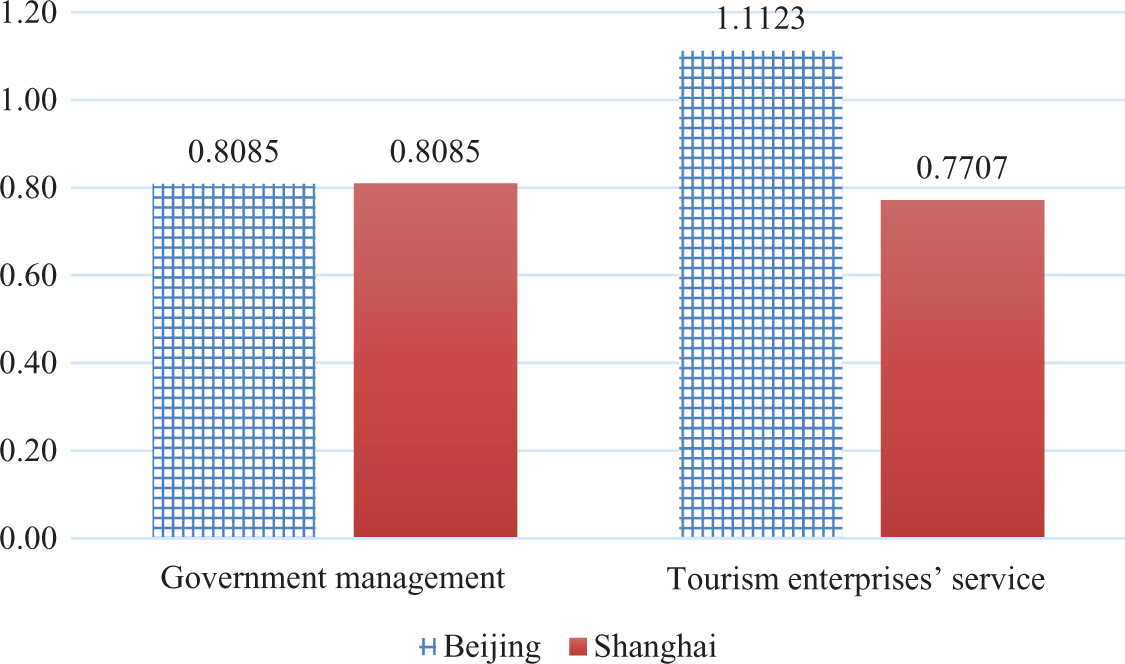
Comparison of first-level indicators of management/service function.
The comparison of second-level indicators is presented in Figure 9. In terms of the government management, favored policies, such as visa exemption, landing visa, E-visa, extension of visa time, and reduced visa application fee, would all help promote tourism development. In addition, the corresponding auxiliary service at the airport such as visitor information desk and touring routes and attractions is another key indicator. Results show that Beijing and Shanghai had the same scores on favored policies (visa) and ancillary services (see Figure 8). Both Beijing and Shanghai have launched the “72-h visa-free transit policy” since 2013, and there are tourism information desks in both Beijing Capital International Airport and Shanghai Pudong Airport, which largely facilitate the inbound travel.
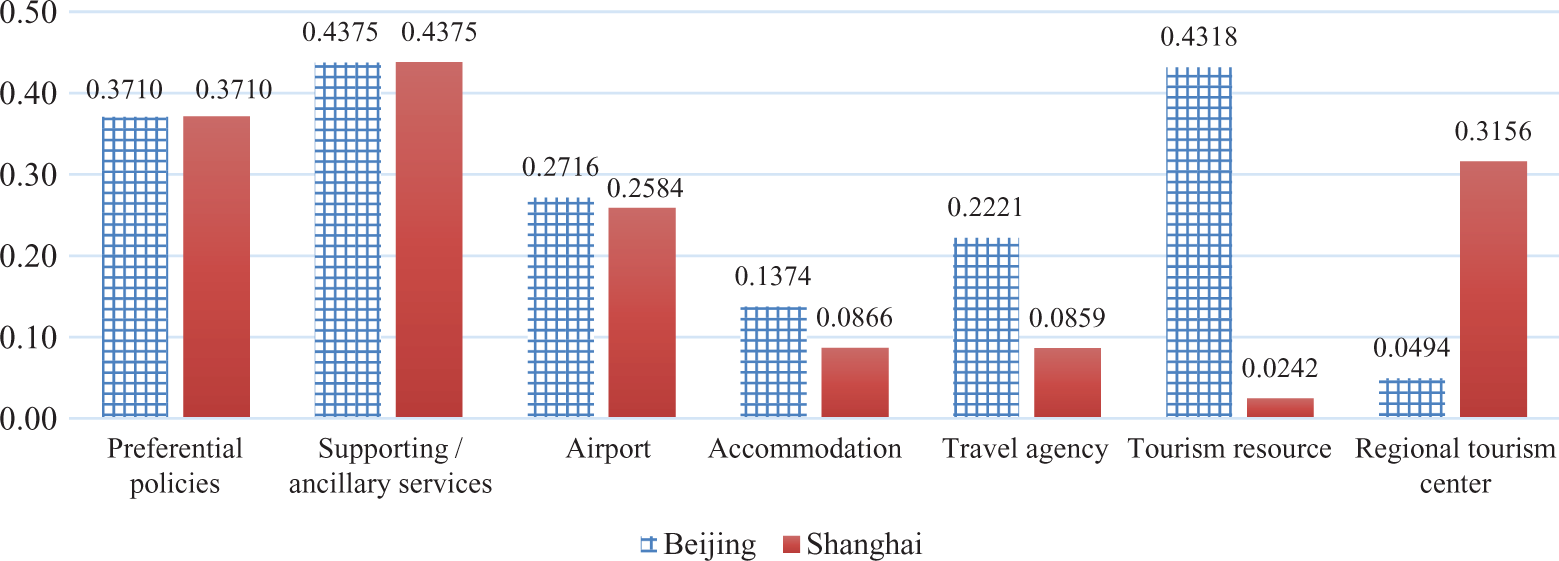
Comparison of second-level indicators of management/service function.
Tourism service, provided in airports, accommodation sectors, travel agencies, tourism attractions, and regional tourist distribution centers, is another essential measurement of international tourism hub function. Recently, regional tourism distribution centers have been established in major cities in China to better facilitate individual tourists’ travel in the city and surrounding areas. Regional tourist distribution centers provide a range of services from travel consultation to transportations and therefore serve as an important means of promoting regional tourism collaboration and integrating regional tourism resources. Results show that Beijing exceeded Shanghai on most of the indicators reflecting tourism service, including airport, accommodation, travel agency, and tourism attractions, but Shanghai presented a much higher score on regional tourist distribution center (see Figure 9). Beijing has more star hotels and travel agencies than Shanghai and receives more inbound tourists organized by travel agencies. In addition, Beijing provides more natural and cultural attractions than Shanghai to attract international tourists for visit and transit. However, Shanghai showed much higher scores on all indicators on regional tourist distribution center due to its geographic location and connectivity with surrounding cities and towns with attractions. A number of single-day, 2-day, and 3-day trips are provided for tourists who visit Shanghai to tour surrounding areas. The detailed comparison of the third-level indicators of management/service functions between Beijing and Shanghai is presented in Figure 10.
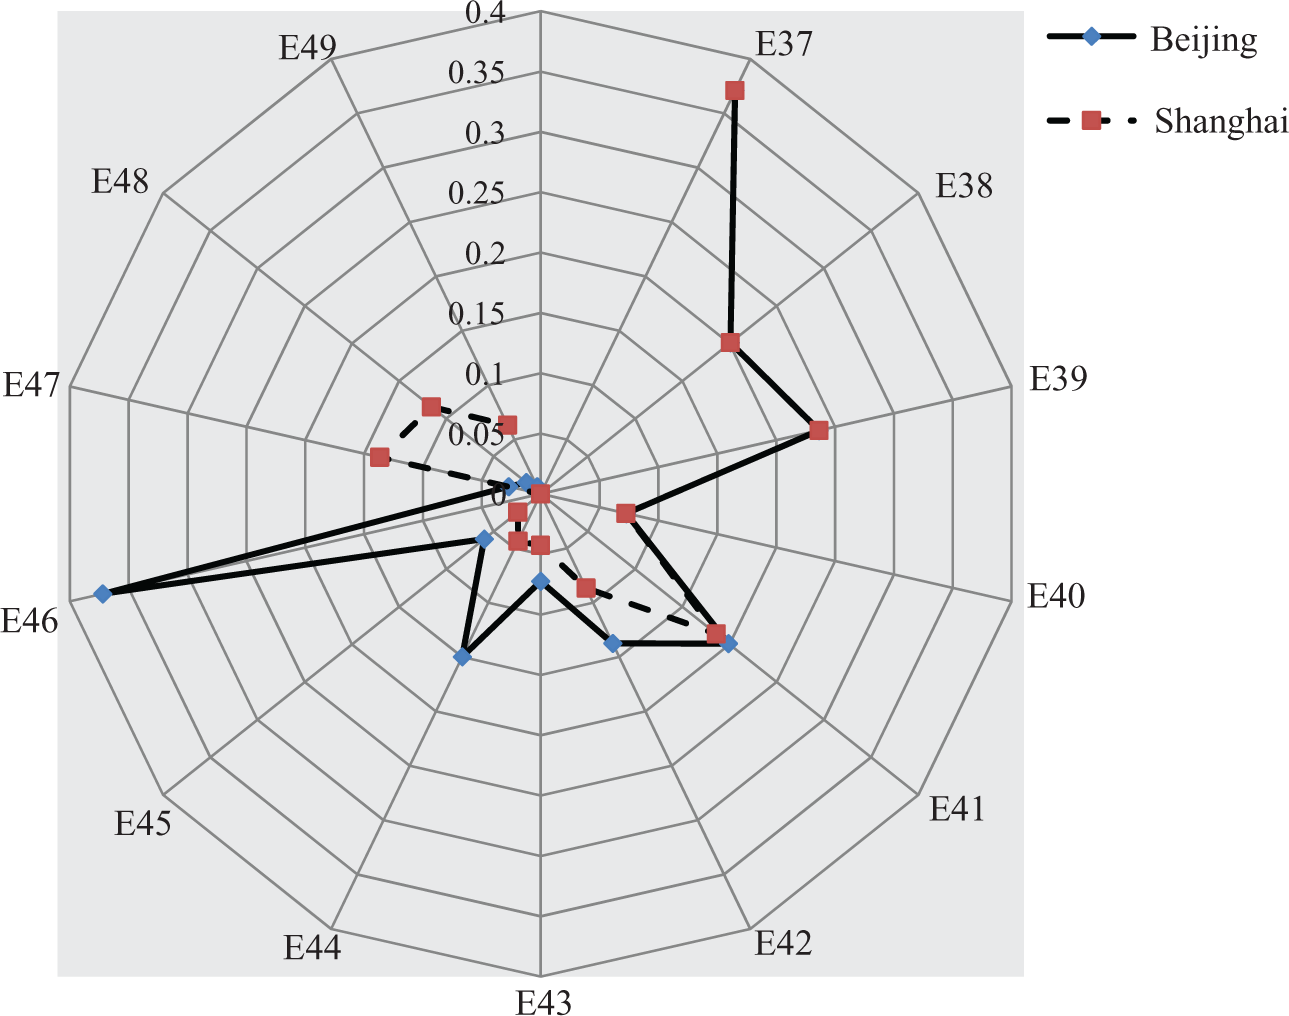
Comparison of third-level indicators of management/service function.
The overall comparison is performed based on the three functions of gathering and distributing, transferring, and management and service between Shanghai and Beijing (see Figure 11). Beijing showed relatively higher scores on gathering and distributing function, as well as the management and service function, whereas Shanghai exceeded Beijing on the transferring function.
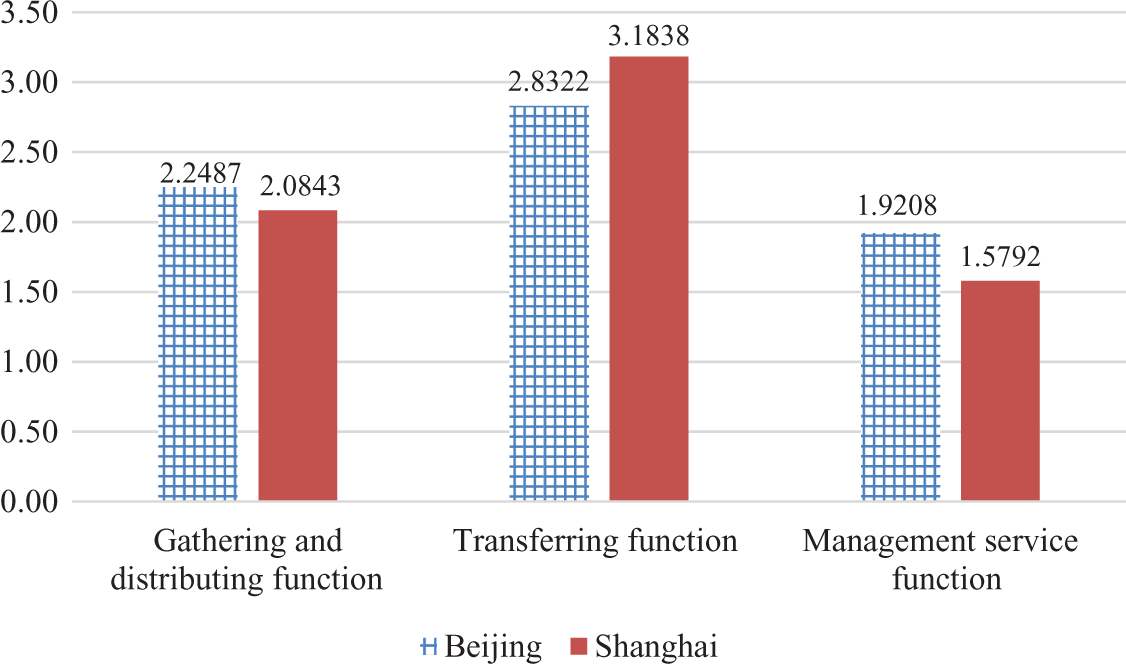
Overall comparison of tourism hub functions.
Conclusions and implications
Strategic implications of international tourism hubs
This study proposed the concept of international tourism hub and developed its evaluation scheme, namely gathering and distributing, transferring, and management and service. The assessment index of 49 indicators was developed and empirically examined by calculating and comparing between Beijing and Shanghai. Distinctive from transportation hubs, tourism hubs hold additional functions such as government policy and supporting tourism services. In addition, the complementary interaction of transportation, local government, as well as tourism and accommodation sectors were addressed in the evaluation scheme. The evaluation scheme is based on the former assessment indices of transportation and tourism cities development, which provide the international tourism cities with strategic and managerial implications and suggestions. In this study, the gathering and distributing function, transferring function, and management/service function concluded from the literature review and practices of international tourism hubs are not only the key factors of tourism hub assessment but also the indicators that should be adopted by policy makers.
Practically, as the passenger transport capability connected with international cities is the dominant indicator in the gathering and distributing function of tourism hubs, government and policy makers should invest on the infrastructure development to increase the passenger capacity. In terms of the transferring function, efficiency, cost, and comfort of transit have somewhat equal significance. Regarding the management/service function, governments and tourism enterprises should collaborate to provide tourists with high-quality service and experience. Governments are expected to formulate well-established regulations and policies, while tourism enterprises such as airports, travel agencies, hotels, and tourists distributing centers need to collaborate to enhance service qualities of tourism hubs. The practical implications drawn from the assessment framework apply to various stakeholders including tourists, government, policy makers, as well as tourism enterprises in the tourism hub development and improvement.
Practical implications for Beijing and Shanghai
Transportation is the basic requirement for building international tourism hub; therefore, it is critically important to improve the connectivity between tourism hub cities and international cities worldwide. The comparisons between Beijing and Shanghai on the functions of tourism hubs indicate that Shanghai presented better performance in majority of the indicators. In terms of the gathering and distributing function, although Beijing’s passenger capacity of domestic aviation, railway, navigation, and highway was better developed than Shanghai, the passenger capacity of international aviation and international navigation was weaker, which decreased the tourist flows from international markets and hindered the tourism development of international tourism hub. For example, Beijing International Airport only has direct flights with 108 cities worldwide, much less than other international airports in the world, and calls for more airlines, new flight routes, and collaboration with airlines on joint ventures with code-sharing. In addition, despite the inland city location, the passenger capacity of international navigation in Beijing was less than Shanghai and did not fully achieve its potential. Therefore, Beijing should take the best advantage of Tianjin Port by constructing convenient transportation route to achieve the comprehensive development of both sea and air.
With regard to transferring function, currently Beijing has encountered the inconvenience of transferring and traffic congestion, which results in less efficiency in airport, railway, cruise, and coach transit than Shanghai. As the traffic congestion has no quick solution, the feasible measure is to guarantee a direct access between Beijing Airport and other transportation hubs in Beijing or Tianjin. In addition, the united luggage transportation service among different transportation hubs should be developed in both Beijing and Shanghai due to the current time-consuming and inconvenient luggage handling in the transferring stage. More importantly, some measures should be taken to connect the airport, railway stations, coach stations, cruise in Beijing, Shanghai, and other major cities and thus provide integrative and seamless joint service for tourists.
From the management/service function perspectives, both governments and tourism enterprises are expected to make joint efforts to enhance the development of tourism hub. Both Beijing and Shanghai enjoyed preferential policies and supporting services; their tourism services, such as airport, accommodation, travel agency, and tourism resource, are similar. However, there are not enough regional tourist distribution centers in Beijing, which make it hard to connect to tourist attractions nearby and to promote regional tourism cooperation. Regional tourism cooperation is a solution to enhance resource sharing, expand tourism market, and improve city attractiveness and tourism brand image. Compared to Shanghai, Beijing currently does not transport many tourists to its surrounding cities. On the contrary, Beijing attracts a large number of tourists, investments, and human labors from surrounding regions, which is called a shadow effect cast from large cities/destinations (O’Connor, 1995). This situation results in low competitiveness of Bohai city group compared to its counterpart of Yangtze River Delta and Pearl River Delta city groups near Shanghai. Therefore, Beijing should strengthen the cooperation with its major neighboring cities to integrate the tourism development in the region. Specifically, short-term intercity tourism products/routes (from single-day to 3-day trips) should be further developed to facilitate tours in surrounding cities and towns. In addition, Beijing could cooperate extensively with the neighboring cities/towns on tourism product development (e.g. joint planning of the regional quality tourism routes), promotion (e.g. travel e-commerce service platform), brand image development, more investment in neighboring cities/towns, and justification of the current imbalanced tourism revenue distribution mechanism among the surrounding regions and Beijing.
Limitations and future research
The study has the following limitations. First, the assessment index was developed based on the literature review and evaluated by a panel of 15 tourism experts. Future research should enhance the validity by including a more rigorous procedure with a larger number of panel experts and tourists. Second, the assessment index is not an exhaustive list of all possible indicators. Some of the assessment indicators were not listed due to the data availability issue. Future study should include more relevant indicators and search more methods to empirically examine the indicators with available data. Third, some of the measurement data were directly adopted from reports or surveys conducted by administrative government or industry due to the data availability issue, which may result in measurement bias. For example, this study used the report of “satisfaction of airport facilities and services” from the Civil Aviation Bureau to measure the indicator “comfort of transferring passageway.” Despite their similar meanings, these two indicators are not the same. In the future study, the validity of the measurements could be improved by collecting the primary data. Finally, this study only investigated two cities in China—Beijing and Shanghai—for evaluating the functionality of international tourism hubs, and future studies should examine other international tourism hubs worldwide and modify the assessment index accordingly, and so it can be generalized in broader international tourism destination/hub settings.
Footnotes
Acknowledgement
The authors thank Ms Luhong Jiang for her assistance and coordination in the projects and this manuscript.
Declaration of conflicting interests
The author(s) declared no potential conflicts of interest with respect to the research, authorship, and/or publication of this article.
Funding
The author(s) disclosed receipt of the following financial support for the research, authorship, and/or publication of this article: This study was funded by Beijing Natural Science Foundation (Grant no: 9132006) and Beijing Social Science Foundation (Grant no: 15JDJGA006).