
Abstract
The relationship between socioeconomic status (SES) and time poverty remains poorly understood, particularly how financial and temporal resources jointly shape outcomes. Drawing on data from 9830 participants in the 2020 China Family Panel Studies, this study used latent profile analysis to identify SES-time usage profiles and examine differences in health and well-being outcomes. Four distinct subgroups emerged: Low Income-Short Working Hours (Income Poverty, 12.0%), Middle Income-Long Working Hours (Time Poverty, 41.7%), Low Income-Long Working Hours (Double Poverty, 4.5%), and High Income-Appropriate Working Hours (Balance, 41.9%). Results revealed systematic differences across profiles. The Balance group consistently exhibited optimal outcomes across almost all measured domains, while the Double Poverty group demonstrated the worst. Notably, temporal scarcity may be more detrimental to well-being than financial resources for individuals who have overcome absolute economic poverty. These findings clarify the interplay between socioeconomic resources and time allocation, providing evidence for targeted interventions to enhance well-being.
Introduction
Feelings of time poverty have become defining characteristics of contemporary societies (Giurge et al., 2020). A nationwide Gallup poll reveals that 80% of Americans feel they lack sufficient time to complete their daily activities (Whillans, 2019). Data from Canada show an increase in work hours accompanied by a decrease in leisure time (Statistics Canada, 2005). In China, the situation is equally stark; in 2023, Chinese employees worked an average of 2548 hours annually, significantly surpassing the average of 1742 hours reported by the Organization for Economic Co-operation and Development (OECD, 2024). Given the widespread nature of this issue, researchers are increasingly focused on identifying interventions to alleviate time poverty and its detrimental effects.
To design effective interventions for time poverty, identifying high-risk individuals is crucial. Research investigating whether the rich or poor are more susceptible to time poverty yields mixed results, indicating an ambiguous relationship between socioeconomic status (SES) and time usage. Some studies suggest that time stress increases with income (e.g. Cai and Stoyanov, 2023; Rudd, 2019), while others indicate that those with lower incomes also face significant time constraints (e.g. Liu et al., 2018; Oh, 2017). Traditional research often relies on variable-centered approaches, assuming uniform relationships across individuals, overlooking the observed discrepancies. In contrast, the person-centered approaches acknowledge population heterogeneity, categorizing individuals into groups based on shared but unobservable characteristics (Howard and Hoffman, 2018; Ling et al., 2025). Therefore, this study aims to elucidate the comprehensive relationship between income and time by employing latent profile analysis (LPA), a person-centered approach, to explore distinct combinations of SES and time usage. Furthermore, we will investigate the differences in outcomes across these profiles.
The relationship between SES and time usage
SES
SES is a widely recognized measure of an individual’s social standing, reflecting the quality-of-life attributes and opportunities available to people within a society (American Psychological Association, 2023). Researchers often use different indicators to measure SES, with education, income, and occupation being the primary ones. However, education and income are considered the most direct and significant indicators. Education offers a consistent measure from early adulthood onward (Oakes and Kaufman, 2017), while income provides a straightforward assessment of an individual’s access to valued material goods and services (Kraus and Stephens, 2012). Although occupation can also indicate SES, it is less frequently used because it primarily reflects the educational requirements and earning potential associated with a job (Fujishiro et al., 2010; Nam and Boyd, 2004). When information on education and income is available, occupation is often considered redundant (Nam and Boyd, 2004). Consequently, like many previous studies (e.g. Castro-Schilo et al., 2016; You et al., 2021), this study employs education and income as the principal indicators of SES.
Time poverty
Time poverty is defined as the scarcity of time for rest and leisure resulting from an excessive workload (Bardasi and Wodon, 2006). The concept was first introduced by Vickery in 1977, sparking increased research interest. Researchers assess time poverty by analyzing how individuals allocate their time across various activities (Williams et al., 2016). Classifications of activities vary: some use the basic economic split between work and leisure, others adopt the triangle of daily activities model, dividing time into paid work, unpaid work, and leisure (Gershuny, 2011), and some follow As (1978) model, categorizing time into necessary, contracted, committed, and leisure segments. Despite these differences, all methods for measuring objective time poverty categorize time into working time (paid and unpaid work) and discretionary time (the residual). Individuals are deemed time poor if their discretionary time falls below a specific threshold, or if their total working hours exceed a certain limit (Williams et al., 2016).
SES and time usage
The relationship between SES and time usage is complex, with conflicting views in the literature. Several studies suggest that higher SES correlates with greater time poverty, implying that time can be exchanged for money and that income and time poverty may not always coexist. For instance, a large-scale survey demonstrated that time-poor Australians generally have higher incomes (Strazdins et al., 2016). Rudd (2019) also found that wealthier, well-educated individuals are more likely to experience time poverty, likely due to the long hours demanded by high-paying jobs, leading individuals to sacrifice leisure time (Cai and Stoyanov, 2023). Moreover, occupational stress and professional ethics may drive individuals to adhere to the “ideal worker” norm of overtime work, increasing income but results in time poverty (Giurge et al., 2020).
Conversely, other studies suggest a correlation between low SES and time poverty, highlighting the simultaneous occurrence of income and time poverty (double poverty). For instance, a national survey in China found that lower SES workers reported higher total work hours, suggesting a prevalence of time poverty among the income-poor (Liu et al., 2018). Similarly, in South Korea, low-income female householders with spouses face the highest rates of time poverty, often experiencing double poverty (Oh, 2017). This pattern may arise because time-poor households need to purchase care services to make up for their lack of time, thereby exacerbating their financial strain (Noh and Kim, 2010). Additionally, income-poor individuals may be compelled to allocate more time to paid work to meet financial needs, further contributing to their time poverty (Öneş et al., 2013).
The divergent findings may result from the widespread reliance on variable-centered approaches, which examine general associations and assume uniform effects across individuals, thereby overlooking population heterogeneity (Howard and Hoffman, 2018). Such approaches struggle to capture the nuanced relationship between variables. Indeed, the interaction between SES and time usage likely varies among individuals; some may be money-rich but time-poor, while others might lack both resources. Therefore, a comprehensive understanding of the SES-time usage relationship necessitates more sophisticated exploration of how these variables combine at the individual level.
Several studies have attempted to address this complexity by employing variable-centered approaches to explore the combinations of time and money resources. For instance, using Chi-squared automatic interaction detection analysis, Cha (2013) classified older Korean males into four groups: time-money poor (16.2%), time rich (10.1%), money rich (44.3%), and time-money rich (29.3%). However, this analysis was limited to a specific demographic, restricting broader applicability of the findings. Similarly, Vithanage and Dunusinghe (2023) applied poverty thresholds to classify 4316 employed Sri Lankans as income-poor/time-poor (4.38%), income-poor/time-non-poor (2.99%), income-non-poor/time-poor (71.41%), and income-non-poor/time-non-poor (21.22%). In related work, Wang (2022) used thresholds to identify three forms of multidimensional poverty among urban Chinese residents: income poverty, time poverty, and income-constrained time poverty. However, reliance on cutoffs can bias estimates, misclassify individuals, and oversimplify complex phenomena (Leon-Perez et al., 2014; Nylund-Gibson et al., 2023).
Classifying individuals as simply “poor” or “non-poor” on the basis of a single indicator fails to capture the complexities of their circumstances. First, binary cutoffs obscure meaningful variation in income and time investments that can be more informatively represented along gradations (e.g. high, middle, low; Nylund-Gibson et al., 2023). Secondly, single-variable grouping rarely addresses multifaceted constructs such as time poverty. Conventional approaches often collapse time spent on heterogeneous activities into dichotomous indicators using preset thresholds, overlooking the specific nature of activities and the varying amounts of time individuals devote to them. This practice also ignores allocation trade-offs that may reveal underlying causes of time poverty—for example, female workers may face time poverty due to the dual demands of paid work and family (Kim and Lee, 2024), while others may be constrained primarily by long work hours (Wang, 2022). Given the substantial share of life spent at work (Helliwell et al., 2017) and the central role of housework in maintaining households (Burton, 2007), a finer-grained accounting of how people allocate time across these major yet distinct domains can yield deeper insights and support more targeted interventions to improve time management.
Given the limitations of variable-centered approaches, person-centered analyses are essential for a holistic understanding of the relationship between SES and time usage. Person-centered approach, such as LPA, identify distinct subpopulations differing in both the levels and patterns of indicators, which variable-centered analyses cannot capture (Zhang et al., 2024). By exploring potential combinations of key indicators—education, annual income, working hours, and housework hours—this approach can clarify previously inconsistent findings and providing more nuanced insights (Wang and Hanges, 2011).
Outcome-related differences in distinct profiles
Health and well-being are paramount goals for individuals and societies, yet their attainment hinges on access to key resources—especially time and money. According to scarcity theory (Mullainathan and Shafir, 2013), the experience of scarcity induces stress that narrows attention and shapes intertemporal trade-offs, often leading people prioritize immediate demands over long-term goals. Over time, these dynamics can undermine efforts to maintain health and well-being. Income and time poverty are distinct forms of scarcity affecting individuals and households differently (Khed and Krishna, 2023), suggesting that different configurations of SES and time use may yield divergent outcomes.
Health-related outcomes
Resource scarcity affects health through multiple pathways. Income poverty is a well-established social determinant of health (WHO Commission on Social Determinants of Health, 2008), and growing evidence shows that time poverty exerts comparably significant effects, mirroring many harms of material deprivation (Dodds and Colman, 2001).
The mechanisms linking these forms of scarcity to health are well-documented. Financial constraints limit access to healthcare, nutritious food, safe housing, and health-promoting environments. Both income and time poverty foster unhealthier lifestyle patterns, including reduced physical activity and increased reliance on harmful coping behaviors such as excessive alcohol consumption (e.g. McCann, 2025; Strazdins et al., 2016; Urakawa et al., 2020). Stress associated with income poverty—manifested through difficulties paying bills, securing stable housing, and accessing medical care—creates additional pathways to poor health outcomes (Li and Mutchler, 2022).
Time poverty presents distinct health challenges. The adverse health effects of excessive working hours are extensively documented (Bannai and Tamakoshi, 2014), but the impact of time usage varies by activity. Extensive domestic labor produces especially negative effects on mental health compared with paid employment or agricultural work (Richardson et al., 2017). This differential impact underscores the complexity of time-health relationships: the type of time use, not merely quantity, may be crucial for health outcomes. Given these multiple pathways, distinct SES-time usage profiles are likely to exhibit markedly different health outcomes across physical, mental, and behavioral dimensions.
Well-being-related outcomes
While SES and time use represent distinct dimensions of resource availability, their effects on well-being are both independent and interactive. Evidence shows clear associations between each dimension and various aspects of psychological and social well-being.
Lower SES consistently predicts reduced life satisfaction and diminished happiness (Adedeji et al., 2023), operating through reduced opportunities, increased exposure to stressors, and limited capacity to engage in fulfilling activities. Similarly, excessive working hours function as a primary stressor that undermines job satisfaction and overall well-being (Ma et al., 2025; Mubeen and Rashidi, 2014). Importantly, the relationship between resources and well-being is not uniformly negative across all configurations. Individuals who prioritize time over money maintain shorter working hours, invest more in intrinsically rewarding activities, and consequently experience enhanced social connections and greater overall happiness (Hershfield et al., 2016; Whillans and Dunn, 2019). This pattern suggests that the relative prioritization of resources, rather than their absolute levels, may be particularly important for well-being.
The multidimensional nature of well-being—encompassing job satisfaction, interpersonal relationships, and overall happiness—suggests that distinct SES-time usage profiles may be differentially associated with these domains. Understanding these patterns is essential for developing targeted interventions and policies to enhance population well-being.
The current study
Despite the established importance of both SES and time allocation for health and well-being outcomes, significant gap remains in our understanding of how these factors interact. Specifically, existing research has predominantly examined SES and time usage as separate variables or through variable-centered approaches that assume homogeneous effects across populations. This approach overlooks that individuals may experience different combinations of SES and time usage, creating distinct profiles with unique implications for health and well-being.
To address these limitations, the current study adopts a person-centered approach to investigate the heterogeneity in SES and time usage patterns and their differential associations with key outcomes.
Given the exploratory nature of this investigation and the novel indicator combinations that differ from previous research, we refrain from proposing specific directional hypotheses. Instead, our study addresses the following research questions:
These research questions aim to provide both descriptive insights into the heterogeneity of resource patterns in the population and explanatory insights into how these patterns relate to important life outcomes, advancing both theoretical understanding and practical applications for intervention and policy development.
Methods
Participants
The cross-sectional data were drawn from the 2020 wave of the China Family Panel Studies (CFPS), conducted by the Institute of Social Science Survey at Peking University and released in 2023 (Data access: http://www.isss.pku.edu.cn/cfps/). The CFPS is an extensive, comprehensive, and longitudinal social survey, encompassing a sample covering 25 provinces and representing approximately 94.5% of the total population of Mainland China (Xie and Hu, 2014).
Because our focus was on the relationship between income and primary time allocation, we excluded individuals who had missing responses (marked as “not applicable” or “don’t know”) for more than 80% of relevant items, lacked a primary job, or did not report annual income. Participants younger than the Chinese legal working age of 16 were also excluded. The final sample comprised 9,830 valid responses, including 5,812 males and 4,018 females, with ages ranging from 16 to 67 years (M = 39.62, SD = 12.13).
Ethics
The CFPS data used in this study received ethical approval from the institutional review board of the affiliated institution, and informed consent was obtained from all participants. All procedures were conducted in accordance with the principles of the Declaration of Helsinki.
Measures
Indicators of SES
SES includes education and annual income.
Indicators of time usage
This study examines individual time allocation between paid and unpaid work, focusing on two key aspects: job-related working hours and housework hours.
Working hours
The study measured individuals’ average weekly working hours, including both paid and unpaid overtime but excluding lunch breaks. Drawing on prior research (e.g. Bannai and Tamakoshi, 2014; Gao et al., 2019), working hours were categorized into four levels: 1 = ⩽34 hours/week, 2 = 35–48 hours/week, 3 = 49–55 hours/week, 4 = ⩾56 hours/week. Scores below 2 suggest insufficient working hours, whereas scores above 2 indicate excessive working hours (Gao et al., 2019).
Housework hours
Participants reported their daily hours spent on housework, including tasks like cooking, housekeeping, laundry, and grocery shopping. For those with different schedules on workdays and non-workdays, the average daily housework hours were calculated by weighting workday hours by five and non-workday hours by two, summing these, and then dividing by seven (Hu and Mu, 2021). Finally, drawing on previous studies (e.g. Adjei and Brand, 2018; Karaca et al., 2009), these hours were categorized into four levels: 1 = 0 hours/day, 2 = more than 0 and up to 2 hours/day, 3 = more than 2 and up to 4 hours/day, 4 = more than 4 hours/day.
Outcome variables
Health-related outcomes
Health status is examined through physical, mental, and lifestyles dimensions.
Well-being-related outcomes
To capture individuals’ well-being comprehensively, three dimensions were assessed: job satisfaction, interpersonal satisfaction, and overall happiness.
Statistical analysis
To achieve the study objectives, we initially conducted the LPA to identify distinct SES-time usage profiles based on four indicators: education, annual income, working hours, and housework hours. However, annual income (skewness = 4.61, kurtosis = 47.76) and housework hours (skewness = 2.48, kurtosis = 9.16) exhibited substantial departures from normality, exceeding commonly accepted thresholds (|skewness| < 2, |kurtosis| < 7; West et al., 1995). Such deviations risk over extracting latent profiles (Lubke and Muthén, 2005). To strengthen the plausibility of model assumptions and improve interpretability, these variables—together with working hours—were recoded into ordered categories based on theoretical and policy-relevant thresholds. Because latent class analysis (LCA) has limited ability to incorporate ordinal information, LPA was adopted as the more suitable analytic approach (DeSantis et al., 2008; Rammohan et al., 2023).
We explored models ranging from two to five profiles to determine which offered the optimal fit. All analyses were performed using Mplus 8.3 with Full Information Maximum Likelihood (FIML) estimation to handle missing data (Muthén and Muthén, 1998).
To identify the optimal model, we considered both statistical and non-statistical criteria. Statistically, we evaluated the relative fit of different models using the Akaike Information Criteria (AIC), Bayesian Information Criteria (BIC), and adjusted Bayesian Information Criterion (aBIC), where lower values indicate a better model fit. Additionally, entropy was used to measure the precision of assigning individuals to profiles, with values above 0.80 suggesting effective class separation. We also implemented the Bootstrapped Likelihood Ratio Test (BLRT) and the Lo-Mendell-Rubin Likelihood Ratio (LMR) test to determine if a model with “K” classes offered a statistically significant improvement over a model with “K-1” classes (Spurk et al., 2020). Non-statistical criteria such as parsimony, prevalence, fit with theoretical constructs, and interpretability were considered (Collins and Lanza, 2009).
Following identification of the optimal latent profile model, we examined differences in health and well-being outcomes across the identified profiles using the Bolck-Croon-Hagenaars (BCH) approach implemented in Mplus. This method accounts for classification uncertainty while effectively handling both categorical and continuous distal outcomes (Asparouhov and Muthen, 2021).
Results
Identifying distinct profiles of SES and time usage
Table 1 presents the fit statistics for the LPA models with varying numbers of profiles. The two- to four-profile models successfully converged, whereas the five-profile model did not, suggesting an over-extraction of latent profiles (Schoppe-Sullivan et al., 2023). The entropy values for all converged models indicated excellent classification accuracy. Furthermore, the LMR and BLRT were significant for these models, indicating that each additional profile significantly enhanced the model fit. The AIC, BIC, and aBIC all showed decreasing values as more profiles were added, suggesting improved fit with an increasing number of profiles.
Fit statistics for LPA models with 2–5 profiles (N = 9830).
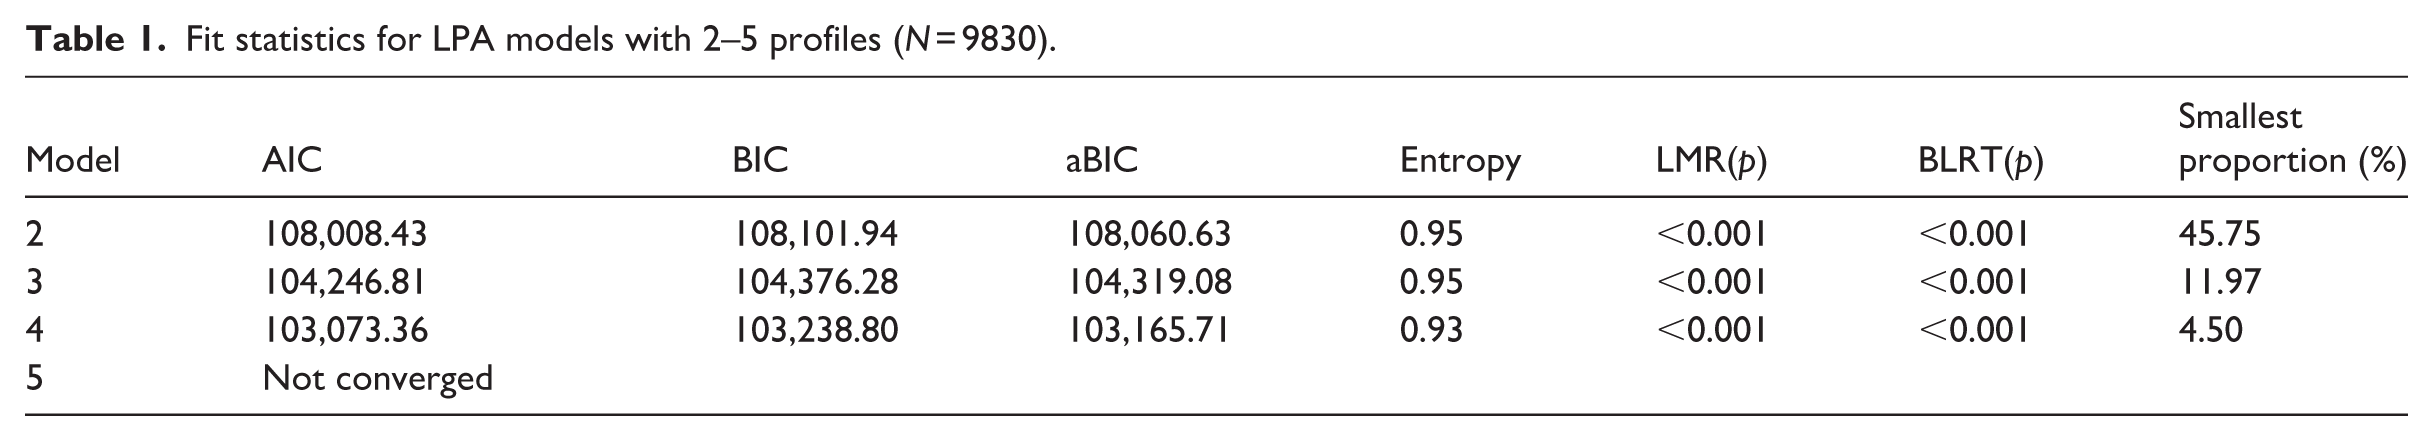
Compared to the three-profile model, the four-profile solution identified an additional group characterized by both income and time poverty. Although this group accounted for 4.5% of the sample, this proportion is acceptable in large-scale LPA studies (>3%; Nylund-Gibson et al., 2023; Spurk et al., 2020). Considering superior fit indices and the theoretical and policy relevance of distinguishing this vulnerable subgroup, the four-profile solution was selected as the most appropriate model.
Profile 1 is characterized by lower income and the shortest working hours, aptly labeled as “Low Income-Short Working Hours” (i.e. Income Poverty; n = 1177, 12.0%). Profile 2, contrastingly, features middle income and long working hours, thus identified as “Middle Income-Long Working Hours” (i.e. Time Poverty; n = 4097, 41.7%). Profile 3 includes participants who have the lowest education levels and annual income, yet spend extensive time on both work and housework, suggesting a likelihood of experiencing both income and time poverty. This group is labeled as “Low Income-Long Working Hours” (i.e. Double Poverty; n = 442, 4.5%). Finally, participants in Profile 4 report the highest annual income and education levels and manage a reasonable amount of work and housework hours, indicating a potential for achieving work-life balance. This profile is described as “High Income-Appropriate Working Hours” (i.e. Balance; n = 4114, 41.9%; Figure 1).
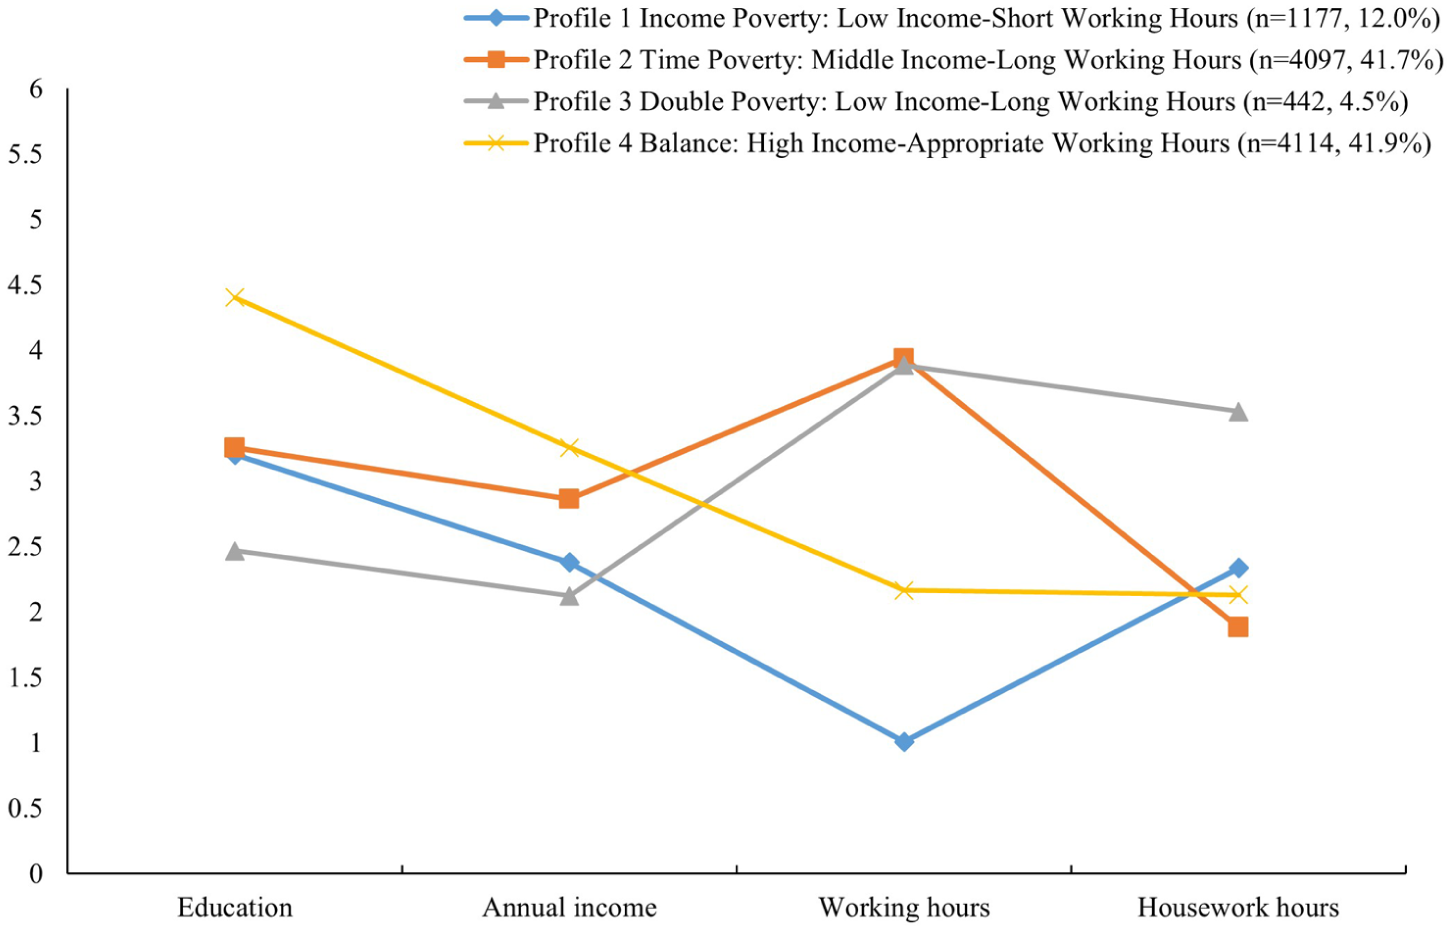
Mean scores of each SES and time-use component across the four profiles.
Outcome-related differences in distinct profiles
As indicated in Table 2, health and well-being outcomes varied significantly across the four distinct profiles. Regarding health-related outcomes, the Time Poverty group reported the highest self-rated health, followed closely by the Balance group, while the Double Poverty group exhibited the lowest self-rated health. For depressive symptoms, the Balance group reported the fewest symptoms, while the Income Poverty and Time Poverty groups showed moderate levels, and the Double Poverty group demonstrated the highest symptom levels.
Means and standard errors of health- and well-being-related outcomes across latent profiles.
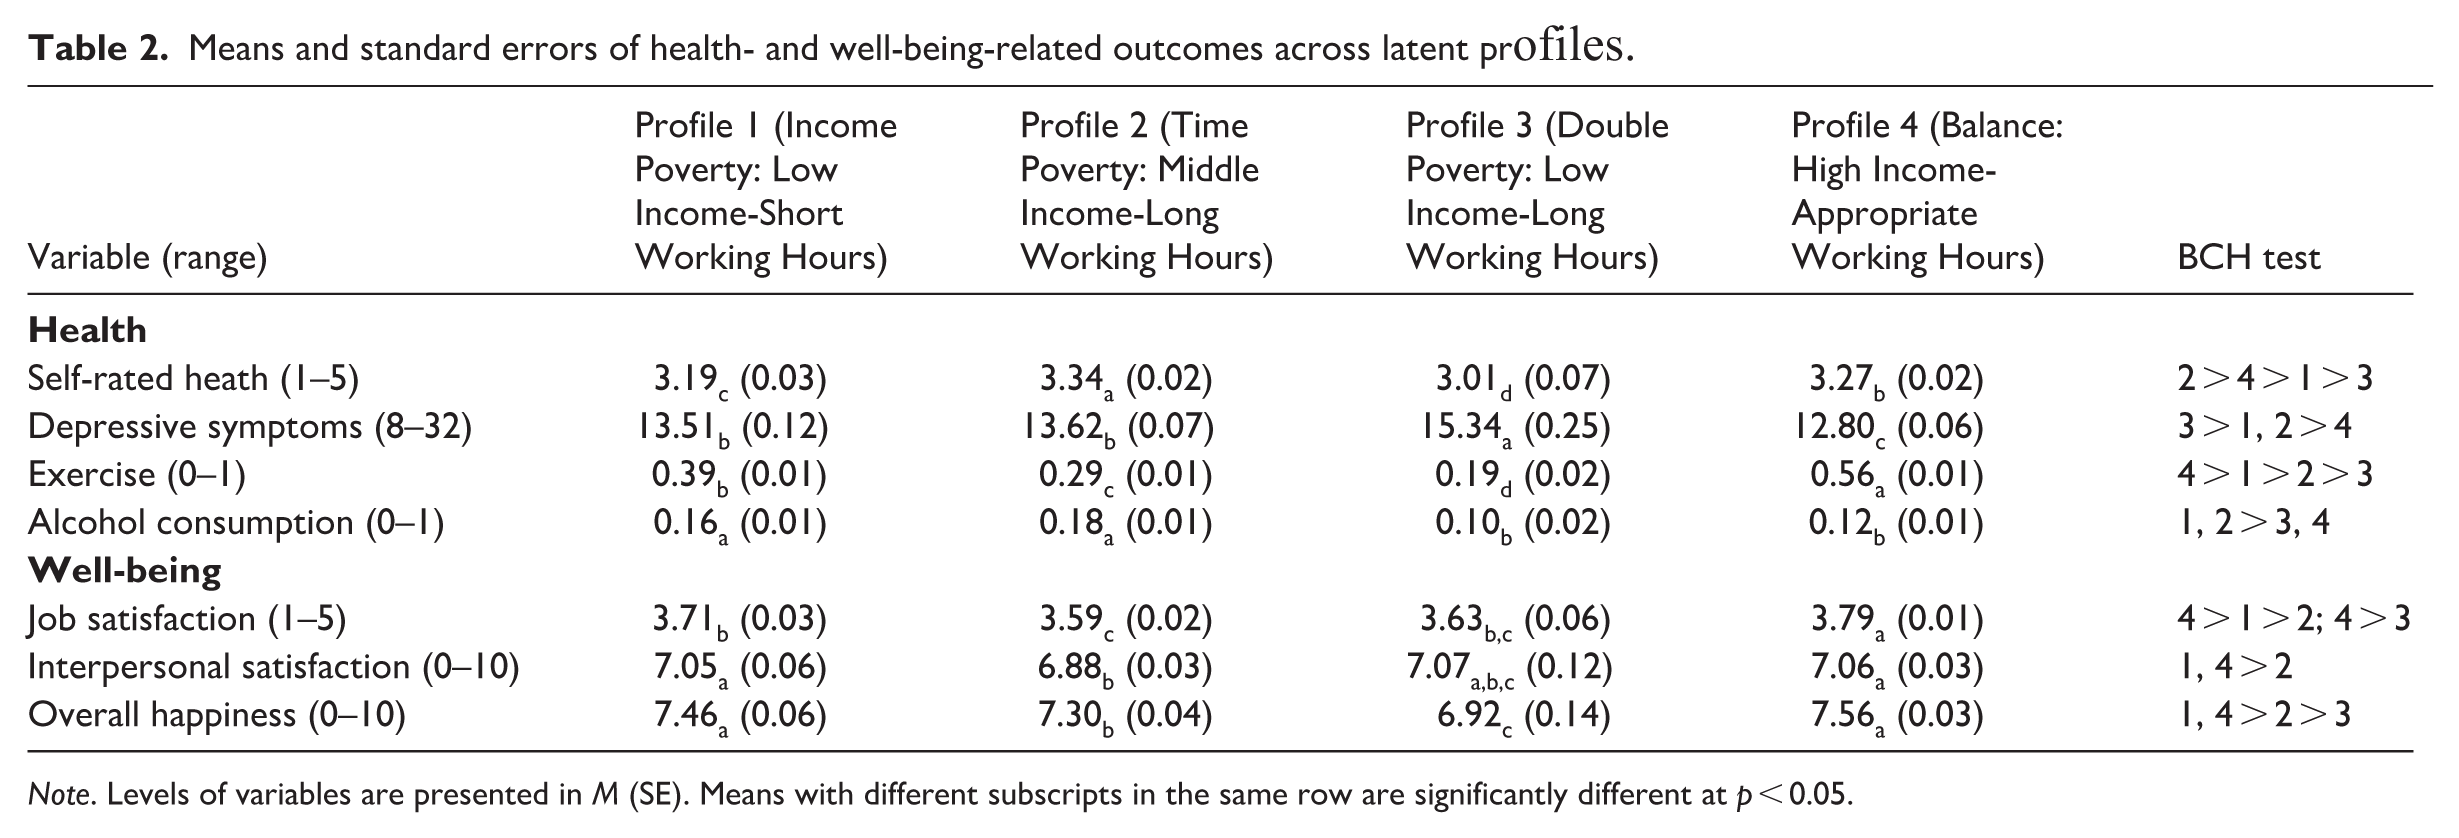
Note. Levels of variables are presented in M (SE). Means with different subscripts in the same row are significantly different at p < 0.05.
Concerning lifestyle behaviors, the Balance group was most physically active, followed by the Income Poverty, Time Poverty, and Double Poverty groups in descending order. Regarding alcohol consumption, the Double Poverty and Balance groups reported lower drinking frequency compared to the Income Poverty and Time Poverty groups.
Regarding well-being-related outcomes, the Balance group demonstrated the highest job satisfaction scores among all profiles. For interpersonal satisfaction, both the Balance and Income Poverty group reported significantly higher levels compared to the Time Poverty group. While the Double Poverty group exhibited the numerically highest mean for interpersonal satisfaction, these differences did not reach statistical significance when compared to other groups. In terms of overall happiness, the Balanced and Income Poverty groups achieved the highest scores, whereas the Double Poverty group reported the lowest levels of overall happiness.
Discussion
This study employed latent profile analysis to identified four distinct subgroups based on combinations of SES and time usage: Low Income-Short Working Hours (Income Poverty, 12.0%), Middle Income-Long Working Hours (Time Poverty, 41.7%), Low Income-Long Working Hours (Double Poverty, 4.5%), and High Income-Appropriate Working Hours (Balance, 41.9%). These profiles demonstrated markedly different health and well-being outcomes, revealing the complex interplay between financial and temporal resources. Additionally, supplementary analyses explored how demographic characteristics and traditional cultural values influence profile membership. Results revealed that age, gender, household size, gender role attitudes, and meritocracy beliefs served as significant predictors of profile classification (see Appendix S1).
Combinations of SES and time usage
Our findings illuminate the complex relationship between SES and time usage, extending prior research through several key ways.
First, our results demonstrate that education serves as a critical mechanism linking SES with time usage patterns. Individuals in the Balance group, characterized by higher educational attainment, consistently reported both higher income and standard working hours. Conversely, those in the Double Poverty group, with lower educational levels, frequently faced nonstandard and excessive work schedules. This pattern substantiates previous findings that higher education enhances access to quality employment that offers both financial security and reasonable time demands (Tran et al., 2018).
Second, among individuals with comparable educational backgrounds, our findings reveal that longer working hours serve as a compensatory mechanism for income enhancement. The Time Poverty group, despite having similar educational levels to the Income Poverty group, achieved higher earnings through increased time investment in work activities. This finding aligns with economic research demonstrating that extended work hours can effectively increase personal and household income (Dutt, 2011), particularly for individuals with limited alternative pathways to income growth.
Third, our results provide clear evidence of the theoretical trade-off between temporal and financial resources (Wang, 2022). To sustain their livelihoods, individuals in the Time poverty group sacrifice personal time to increase earnings, whereas those in the Income Poverty group accept reduced income in exchange for greater temporal autonomy. This trade-off reflects broader constraints within labor markets and highlights the difficult choices individuals must navigate when resources are limited.
Fourth, the profiles reveal systematic differences in how temporal resources are allocated between work and domestic responsibilities. The Time Poverty group’s greater work time commitment necessarily reduces their availability for household activities, while the Income Poverty group reduced work hours allow for greater domestic engagement. This pattern exemplifies the fundamental principle that time represents a finite resource—allocating time to one activity necessarily constrains availability for others (Monga et al., 2017)
Fifth, a striking finding is that over 45% of participants reported working beyond China’s legal weekly limit of 44 hours, reflecting a broader global trend where approximately 36.1% of workers exceed 48 hours/week (Messenger, 2018). This problem is particularly acute in certain occupations, such as ride-hailing drivers, who often work more than 10 hours daily (Tsinghua Academy of Social Sciences, 2021). Driven by financial pressures or “ideal worker” expectations, widespread excessive work hours trade substantial personal time for income (Giurge et al., 2020), posing well-documented health risks (Bannai and Tamakoshi, 2014) and underscoring the need for stronger policy interventions.
Outcomes differences across distinct profiles
The systematic differences in health and well-being outcomes across profiles provide compelling support for scarcity theory (Mullainathan and Shafir, 2013), which predicts that resource scarcity impairs individuals’ capacity to invest in health and well-being, creating cumulative disadvantages over time. The Balance group consistently exhibited optimal outcomes across almost all measured domains—reporting the lowest depressive symptoms, healthiest lifestyle behaviors (more exercise, less alcohol consumption), and greatest satisfaction with job, interpersonal relationships, and overall life. Conversely, the Double Poverty group demonstrated the worst concerning outcomes, with poor physical and mental health, minimal exercise engagement, and lowest overall happiness levels.
These patterns align with extensive research documenting the detrimental effects of low SES, excessive working hours, and heavy domestic responsibilities on physical and mental outcomes (Bannai and Tamakoshi, 2014; Richardson et al., 2017; You et al., 2021). Extended work hours systematically reduce leisure time and exercise opportunities (Artazcoz et al., 2024), which are crucial for happiness and positive well-being (Marmara et al., 2025; Noguchi et al., 2022). In contrast, adequate income and standard working hours facilitate higher job satisfaction and enable quality time with family and friends, enhancing interpersonal satisfaction and overall happiness (Mogilner, 2010; Yeh, 2015).
Two particularly noteworthy findings challenge simple assumptions about resource effects and warrant deeper examination. First, the Time Poverty group exhibited a paradoxical pattern: while reporting the highest alcohol consumption—consistent with evidence that alcohol serves as a common coping mechanism for work-related stress (Dora et al., 2023)—they also reported unexpectedly high self-rated health. This contradiction likely reflects a health-illusion bias exacerbated by time constraints. Time-poor individuals often delay or forgo medical care, fostering neglect and self-deception about their actual health (Hyde et al., 2020). To sustain demanding working schedules, they may engage in motivated reasoning, convincing themselves of good healthy despite objective indicators suggesting otherwise. Indeed, time poverty is frequently associated with adverse lifestyle patterns, including insufficient sleep (Urakawa et al., 2020), and negative health outcomes, including cardiovascular and other chronic conditions (Yan et al., 2003). Future research should incorporate objective health measures to validate these self-reports and better understand this discrepancy.
Second, our findings suggest that temporal scarcity may be more detrimental to well-being than financial scarcity, particularly when basic economic needs are largely met. The Time Poverty group consistently reported lower satisfaction across all life domains compared to the Income Poverty group, despite their higher income levels. This aligns with research demonstrating that prioritizing time over money enhances subjective well-being and social connections (Whillans and Dunn, 2019). Masuda et al. (2021) found that individuals with comparable incomes but less free time reported significantly lower life satisfaction. From a health perspective, the Time Poverty group engaged less in regular physical activity than the Income Poverty group, despite the well-documented benefits of exercise for maintaining good health (World Health Organization, 2019). These findings suggest that once basic financial security is achieved, temporal resources become the primary constraint on well-being.
Implications and limitations
Our study makes several important theoretical and methodological contributions to understanding resource scarcity effects. By adopting a person-centered approach with detailed indicators across a broad age range, we produced more precise classifications and comprehensive characterizations of SES-time usage profiles than previous research. A key theoretical advancement is the demonstration that resource scarcity operates in domain-specific ways: once basic economic needs are satisfied, temporal scarcity becomes more detrimental to well-being than financial scarcity. This finding extends scarcity theory by highlighting the central importance of time in determining quality of life outcomes.
While our analysis draws on Chinese data, the identified profiles and their fundamental implications likely generalize to other contexts, although their relative prevalence may vary depending on national welfare systems and labor market conditions. This suggests that jointly assessing temporal and financial poverty offers a more comprehensive indicator of societal well-being and development than either measure alone.
Our findings have direct implications for policy interventions targeting different population segments. For low-income populations, beyond direct financial assistance, local governments could partner with community colleges and non-profit organizations to provide subsidized vocational training aligned with regional labor market demands, thereby enhancing long-term earning capacity. For middle-income earners—who often fall between policy cracks, being ineligible for public assistance yet unable to afford essentials services like housing and healthcare (Li and Mutchler, 2022)—targeted interventions such as childcare subsidies or tax credits could reduce dependence on excessive work hours and improve quality of life.
To protect worker well-being more broadly, governments should strengthen labor regulations, enforce penalties for excessive working hours, and implement digital time-tracking systems to enhance compliance monitoring. Public health agencies could leverage popular digital platforms (e.g. WeChat, TikTok) to promote evidence-based strategies for achieving work–life balance. At the individual level, continuous professional development and conscious preservation of discretionary time remain essential strategies for sustaining long-term well-being.
Several limitations should be acknowledged when interpreting these findings. First, all participants were from China, a developing country, which may limit generalizability to developed countries with different incomes distributions and work cultures. Future research should conduct cross-cultural comparisons to determine whether these profiles and cultural predictors are context-specific or represent universal patterns of resource allocation.
Second, while the CFPS provides valuable information on primary time-use activities such as work and housework, it captures only a limited range of daily activities. Future studies should employ more comprehensive time-use surveys that include broader spectrum of daily activities to enhance the depth and applicability of findings.
Third, the cross-sectional design limits causal inference. For example, higher income may improve health by increasing access to resources, but healthier individuals may also possess greater capacity to earn higher incomes. Longitudinal research is needed to clarify the temporal dynamics and causal relationships among these variables, enabling more definitive conclusions about mechanisms linking resource allocation patterns to health and well-being outcomes.
Supplemental Material
sj-docx-1-hpq-10.1177_13591053251407798 – Supplemental material for Profiles of time and income poverty: A person-centered examination of health and well-being outcomes using large-scale survey data
Supplemental material, sj-docx-1-hpq-10.1177_13591053251407798 for Profiles of time and income poverty: A person-centered examination of health and well-being outcomes using large-scale survey data by Yanyu Chen, Xiaomin Sun and Siqi Xiong in Journal of Health Psychology
Footnotes
Acknowledgements
The authors would like to thank the participants of the study and the data providers of China Family Panel Studies (CFPS).
Ethical considerations
The data from the CFPS survey obtained ethical approval and informed consent and was approved by the Biomedical Ethics Committee of Peking University (IRB00001052-14010).
Consent to participate
All participants or their proxy respondents provided written informed consent.
Consent for publication
Consent for publication is not applicable to this article as it does not contain any identifiable data.
Author contributions
Yanyu Chen participated in study design, performed the statistical analysis, drafted the manuscript, and revised the manuscript; Xiaomin Sun led the study design and revised the manuscript; Siqi Xiong contributed to manuscript revision. All authors read and approved the final manuscript.
Funding
The authors disclosed receipt of the following financial support for the research, authorship, and/or publication of this article: This study was funded by [National Natural Science Foundation of China] (grant number 72271031); [National Natural Science Foundation of China] (grant number 72571032).
Declaration of conflicting interests
The authors declared no potential conflicts of interest with respect to the research, authorship, and/or publication of this article.
Data availability statement
Supplemental material
Supplemental material for this article is available online.