
Abstract
Aims: An increasing number of people in Europe are living with cancer, either as an active disease or as a past experience. Depressive symptoms may impair quality of life in cancer patients and may constitute increased risks for disability, as well as being a risk factor for increased mortality. Our study compared self-reported symptoms of depression in people who currently or previously have experienced cancer with self-reported symptoms of depression in the general population. Methods: Our study was based on data from the European Social Survey 2014, with representative samples from 19 countries. Depression was measured by an eight-item CES-D Scale, with a cut-point of a mean score of 2 to indicate depression. Multilevel modelling was used to examine the relationship between cancer status and depression. Results: Respondents who at the time of the interview reported to have cancer were more likely to report symptoms above the cut-point on the depression scale than people who never had experienced cancer (unadjusted odds ratio (ORunadjusted)=2.59; 95% confidence interval (CI) 2.20–3.06; and ORadjusted=2.00; 95% CI 1.70–2.36). The difference was smaller comparing people who previously had experienced cancer to people who never had experienced cancer (ORunadjusted=1.46; 95% CI 1.19–1.79; and ORadjusted=1.28; 95% CI 1.05–1.55). The differences in depression by cancer status did not vary among the welfare state regimes.
Introduction
Depressive symptoms may impair quality of life in cancer patients and may constitute increased risks for disability, as well as being a risk factor for increased mortality [1,2]. In this cross-national study, we compared self-reported symptoms of depression in people living with cancer, either currently or as a past experience, to people who have not experienced cancer.
Earlier research based on comparisons of cancer patients with the general population indicates increased risks of depression for cancer patients [1–4]. Although two systematic reviews [5,6] differ somewhat in their findings, the overall risk of depression in cancer survivors was found to be similar to the risk in the general population. Some recent studies [7–10], however, indicate increased risk for depression in cancer survivors, especially in the first year after diagnosis.
Welfare state classifications group countries with similar features into a number of welfare state regimes based on criteria such as the generosity of social benefits and services and whether entitlement is universal or means tested. Esping-Andersen [11] classified welfare states into Liberal, Conservative and Social Democratic welfare regimes. Ferrera [12] added a Southern regime. We added an Eastern welfare regime to include the former communist countries in Eastern Europe. The classification will be used to examine whether living with cancer in the most comprehensive welfare regimes is accompanied by fewer symptoms of depression than in regimes with scarcer resources.
Methods
The data source for this study was the European Social Survey (ESS) Round 7 fielded in 2014, covering 21 European countries (www.europeansocialsurvey.org) [13]. This study reported findings from the module on ‘Social inequalities in health’ [14]. Data for two countries, the Czech Republic and Hungary, were excluded due to errors related to the question on cancer status. The net sample was restricted to respondents aged 25–75 years. The youngest was excluded because of very low prevalence of cancer, and the upper age limit of 75 years was set rather arbitrarily to avoid the sample selection bias for respondents with advanced age.
Measurements
The Center for Epidemiological Studies Depression Scale (CES-D) [15] is a 20-item self-report instrument developed in 1976 for use in the general adult American population (aged ≥18 years). The scale has been found to be a valid and reliable measure of depressive symptomatology in breast-cancer patients [16]. A short form of the scale with eight items, the CES-D 8, was included in ESS Rounds 3, 6 and 7. A study of the Round 3 data for Belgium indicated that the scale can be considered a reliable and valid measurement instrument for depression in the general population and valid for cross-sex comparisons [17]. The symptoms of depression covered in the CES-D 8 were mostly items on affective dimensions; feeling or behaving: depressed, everything was an effort, restless sleep, happy, lonely, enjoyed life, sad, could not get going. An American study indicated that the CES-D may have problems of comparability in multi-ethnic samples, and a scale based on five items tapping the affective dimension is preferable to the 20-item scale [18]. The five items are included in the CES-D 8 used in the present study. In addition, we used the five-item version in a sensitivity test.
The CES-D 8 was constructed as the mean score of at least six of the eight items. The scale is one-dimensional, with a quite satisfactory internal consistency (Cronbach’s alpha=0.82). Although there is no validated cut-point, the most interesting part of the distribution is the upper tail where the cases of clinical depression are most likely to be found. A cut-point of 2.0 was chosen to construct a binary outcome variable with a value of 1 for the 17% of the respondents scoring above the cut-point, and with a value of 0 for respondents with a CES-D 8 score ≤2.0. We could alternatively have used the continuous CES-D 8 scores in an ordinary least squares regression analysis. However, the skewness of the distribution of the CES-D 8 creates problems. Furthermore, the regression coefficient represents the average, uniform effect across the distribution of the scale, whereas we were most interested in the effect at the upper tail of the scale.
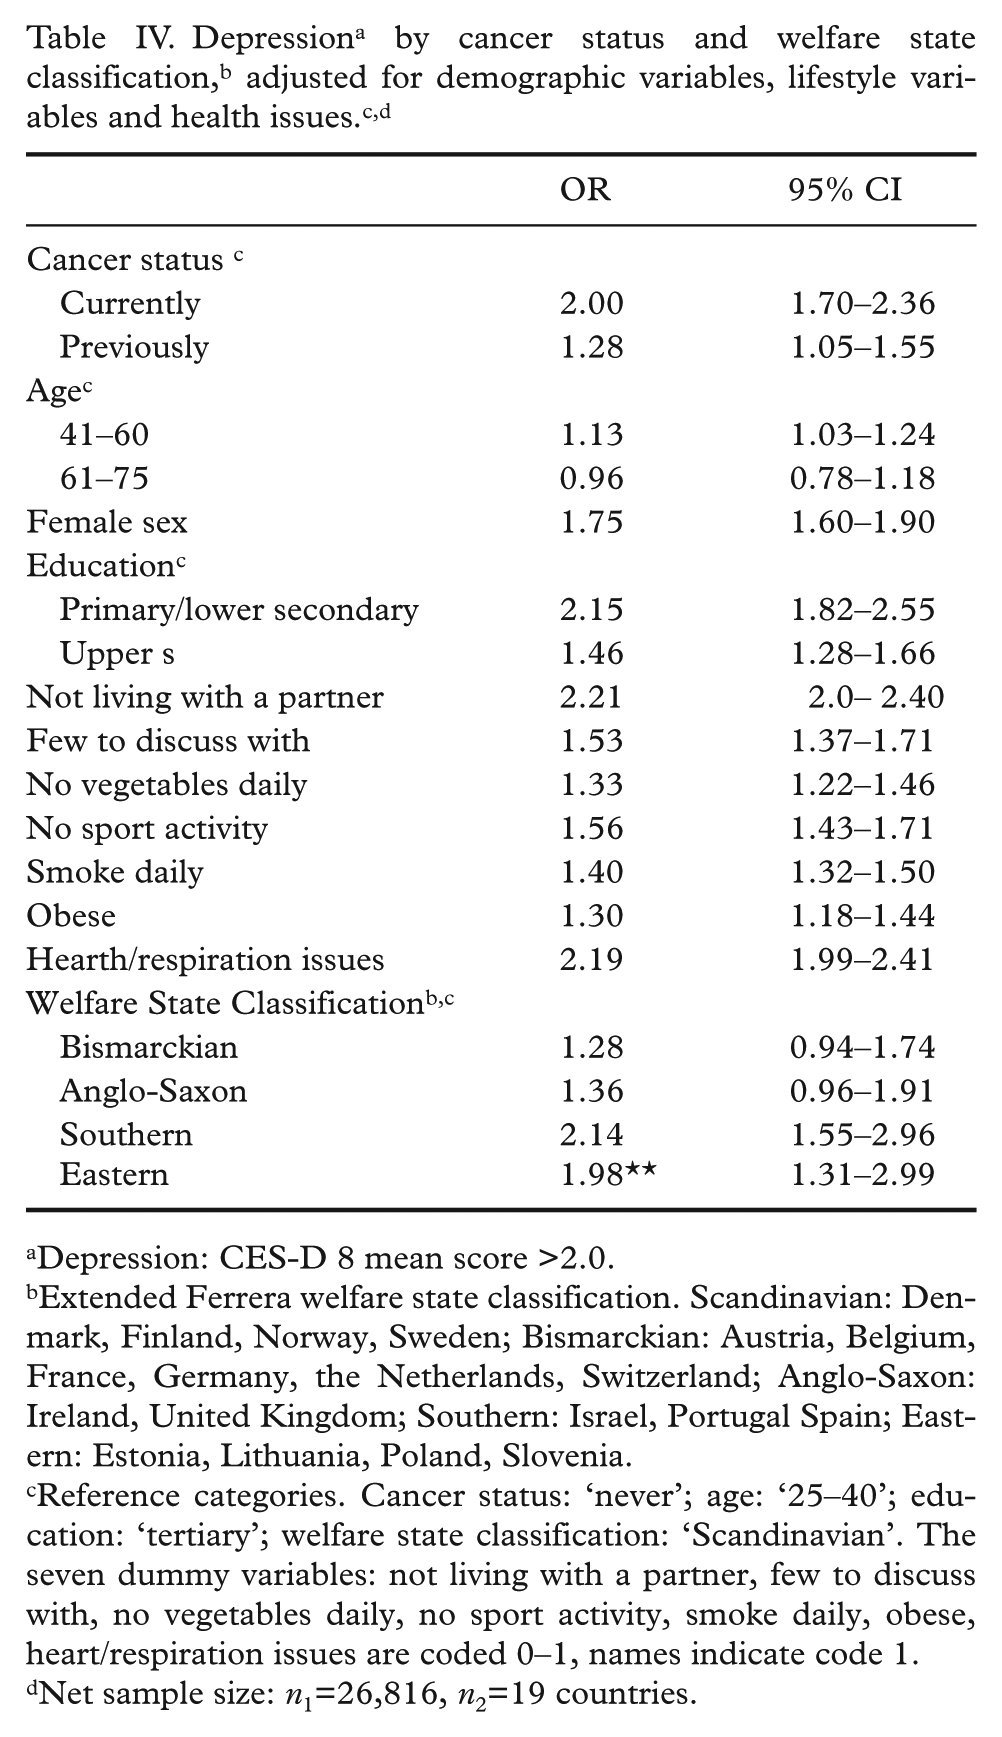
The main explanatory variable is the threefold classification of cancer status. The question was posed in an indirect way due to its sensitivity: ‘Do you have or have you ever had any of the health problems listed on this card. If yes, is that current or previously’. The following health problems were listed on the showcard: cancer affecting any part of the body; leukaemia; malignant tumour; malignant lymphoma; melanoma, carcinoma, or other skin cancer. The interviewer registered the codes ‘Yes, currently’, ‘Yes, previously’ and ‘No, never’, which give our classification of cancer status. The 19 countries were located in the five-category welfare state classification: Scandinavian (Denmark, Finland, Norway and Sweden); Bismarckian (Austria, Belgium, France, Germany, the Netherlands and Switzerland); Anglo-Saxon (United Kingdom and Ireland); Southern (Greece, Israel, Portugal and Spain); and Eastern (Estonia, Lithuania, Poland and Slovenia).
To adjust for confounding, we included sociodemographic variables (age in three categories: 25–40, 41–60 and 61–75; sex; and education: primary/lower secondary, secondary and tertiary). We included additional controls with seven dummy variables covering lack of social support (not living together with a partner, and few (0–1) ‘with whom you can discuss intimate and personal matters’), unhealthy lifestyles (do not eat vegetables daily, no sports activity and smoke daily) and health problems (obesity and heart/respiration problems).
Statistical analysis
The net sample has a two-level structure with 26,816 respondents in 19 countries. The basic two-level random intercept model [19] may be expressed in the following equation:
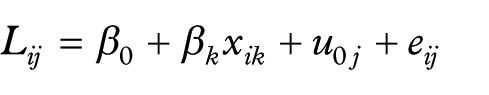
where Lij, the logit of the probability of scoring above the cut-point for depression, is the dependent variable in a two-level logit model. The constant (intercept) may vary randomly across countries. This variation (around
The analytic strategy was as follows. We first presented unadjusted (crude) percentages and odds ratios for depression by cancer status and the welfare state classification. Next, we adjusted for groups of variables in a sequence of blocks starting with demographic variables, followed by social support, lifestyle indicators and health problems. We also tested a model with cross-level interaction between cancer status and welfare state regimes. The terms for the cross-level interaction did not, however, significantly improve upon the full model.
Results
The estimated cancer prevalence for the net sample and for groups by age, sex and country are shown in Table I. An estimated 4.2% reported currently (autumn 2014) having cancer. Another 6.6% reported that they previously had had cancer. The prevalence varied by age and slightly by sex and the welfare state classification, with the highest prevalence rates in Eastern Europe.
Cancer prevalence (%).
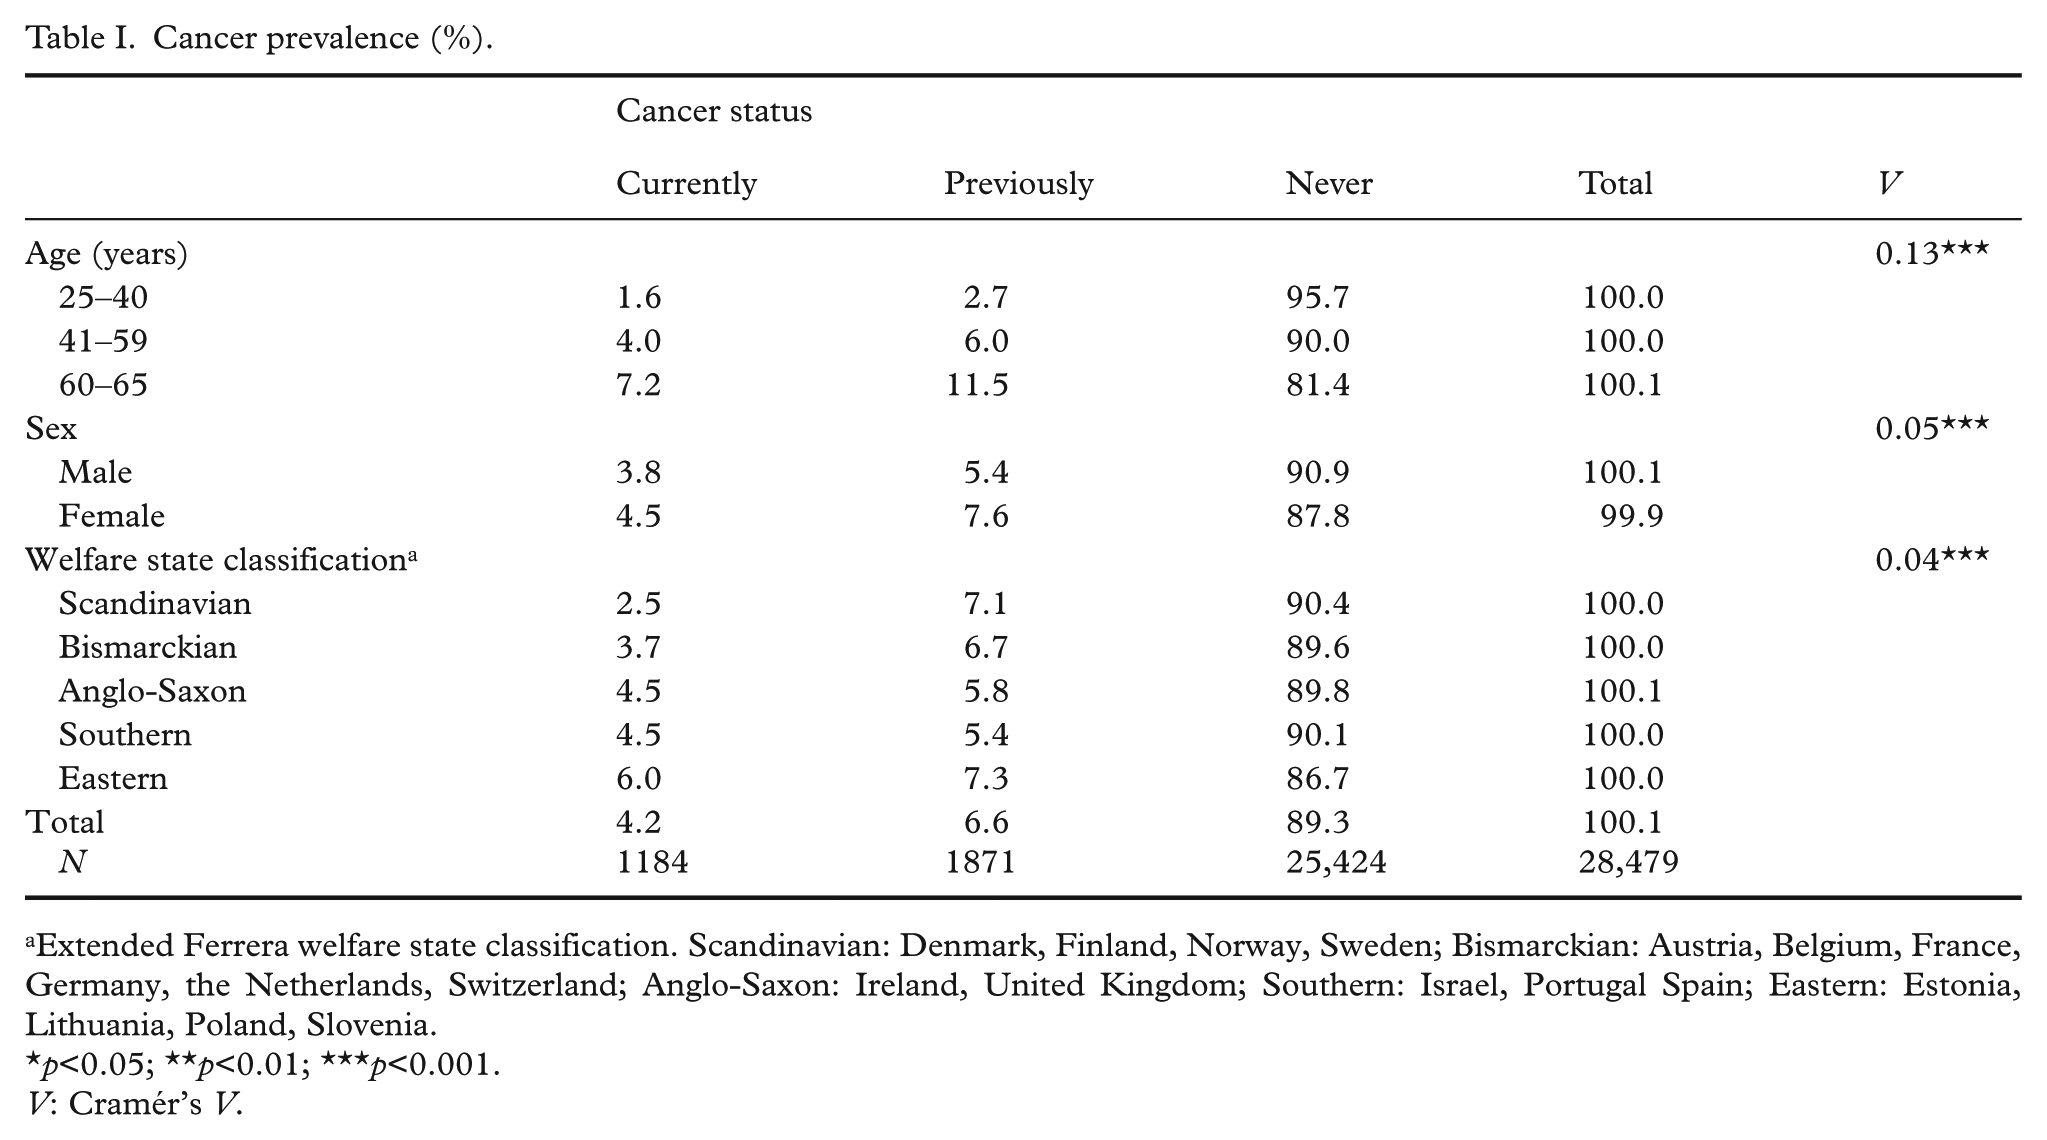
Extended Ferrera welfare state classification. Scandinavian: Denmark, Finland, Norway, Sweden; Bismarckian: Austria, Belgium, France, Germany, the Netherlands, Switzerland; Anglo-Saxon: Ireland, United Kingdom; Southern: Israel, Portugal Spain; Eastern: Estonia, Lithuania, Poland, Slovenia.
p<0.05; **p<0.01; ***p<0.001.
V: Cramér’s V.
The percentage above the cut-point on the depression scale varied from 16 among those who had never experienced cancer to 32 for respondents with a cancer disease (Table II). The odds on a high score on the CES-D 8 for the latter group were 2.59 times higher than for the former group. High scores on CES-D 8 also varied by welfare regimes, with the highest percentage and odds ratio for Eastern Europe (compared to the Scandinavian countries).
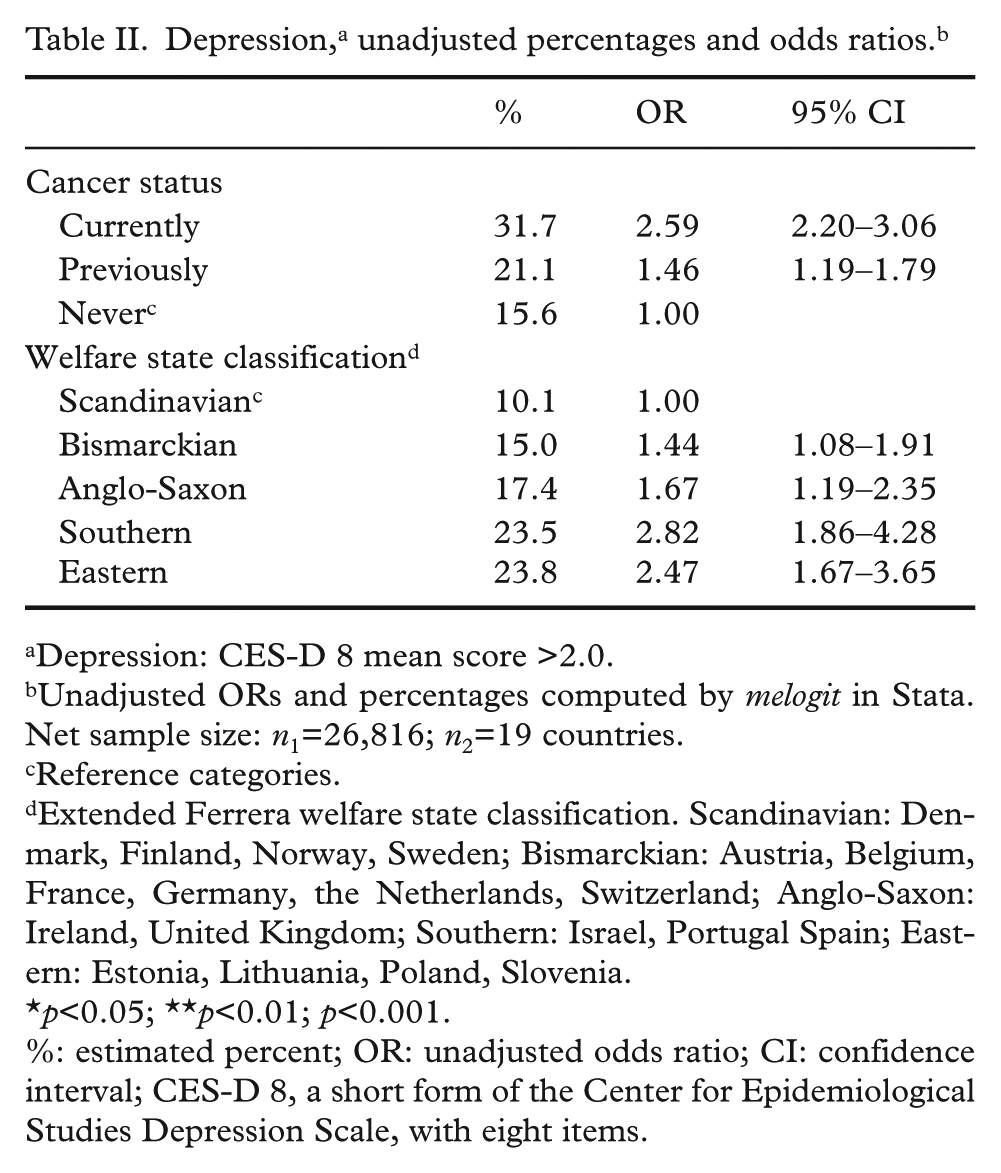
Depression: CES-D 8 mean score >2.0.
Unadjusted ORs and percentages computed by melogit in Stata. Net sample size: n1=26,816; n2=19 countries.
Reference categories.
Extended Ferrera welfare state classification. Scandinavian: Denmark, Finland, Norway, Sweden; Bismarckian: Austria, Belgium, France, Germany, the Netherlands, Switzerland; Anglo-Saxon: Ireland, United Kingdom; Southern: Israel, Portugal Spain; Eastern: Estonia, Lithuania, Poland, Slovenia.
p<0.05; **p<0.01; p<0.001.
%: estimated % OR: unadjusted odds ratio; CI: confidence interval; CES-D 8, a short form of the Center for Epidemiological Studies Depression Scale, with eight items.
The multilevel modelling started with the null model without covariates (not reported in the tables). The estimated intra-class correlation indicated that around 6% of the variation in the dependent variable stems from between-country differences. Next, we estimated five multilevel models with the introduction of controls in blocks to observe how the odds ratio on depression among people with cancer would be further reduced (Table III). First, we entered the welfare state classification, which only slightly lowered the odds ratio for the ‘Previously’ group. Next, demographics variables were added. This lowered the odds ratio for the ‘Currently’ group from 2.58 (95% CI 2.19–3.05) to 2.30 (95% CI 2.01–2.65) and the corresponding odds ratio for the ‘Previously’ group from 1.46 (95% CI 1.19–1.79) to 1.32 (95% CI 1.10–1.58). Two indicators of lack of social support were then added, with only a minor effect. The unhealthy lifestyle variables may also function as controls for reverse causality or selection. This group of variables brought the odds ratios for the ‘Currently’ group down from 2.26 (95% CI 1.93–2.64) to 2.18 (95% CI 1.86–2.56) but left the odds ratio for the ‘Previously’ group unchanged. Finally, we added an indicator of obesity and one for comorbidity, with a value of 1 for persons who either reported ‘heart or circulation’ problems or ‘breathing’ problems. This further lowered the odds ratio on depression for the ‘Currently’ group (OR=2.00; 95% CI 1.70–2.36) and for the ‘Previously’ group (OR=1.28; 95% CI 1.05–1.55).
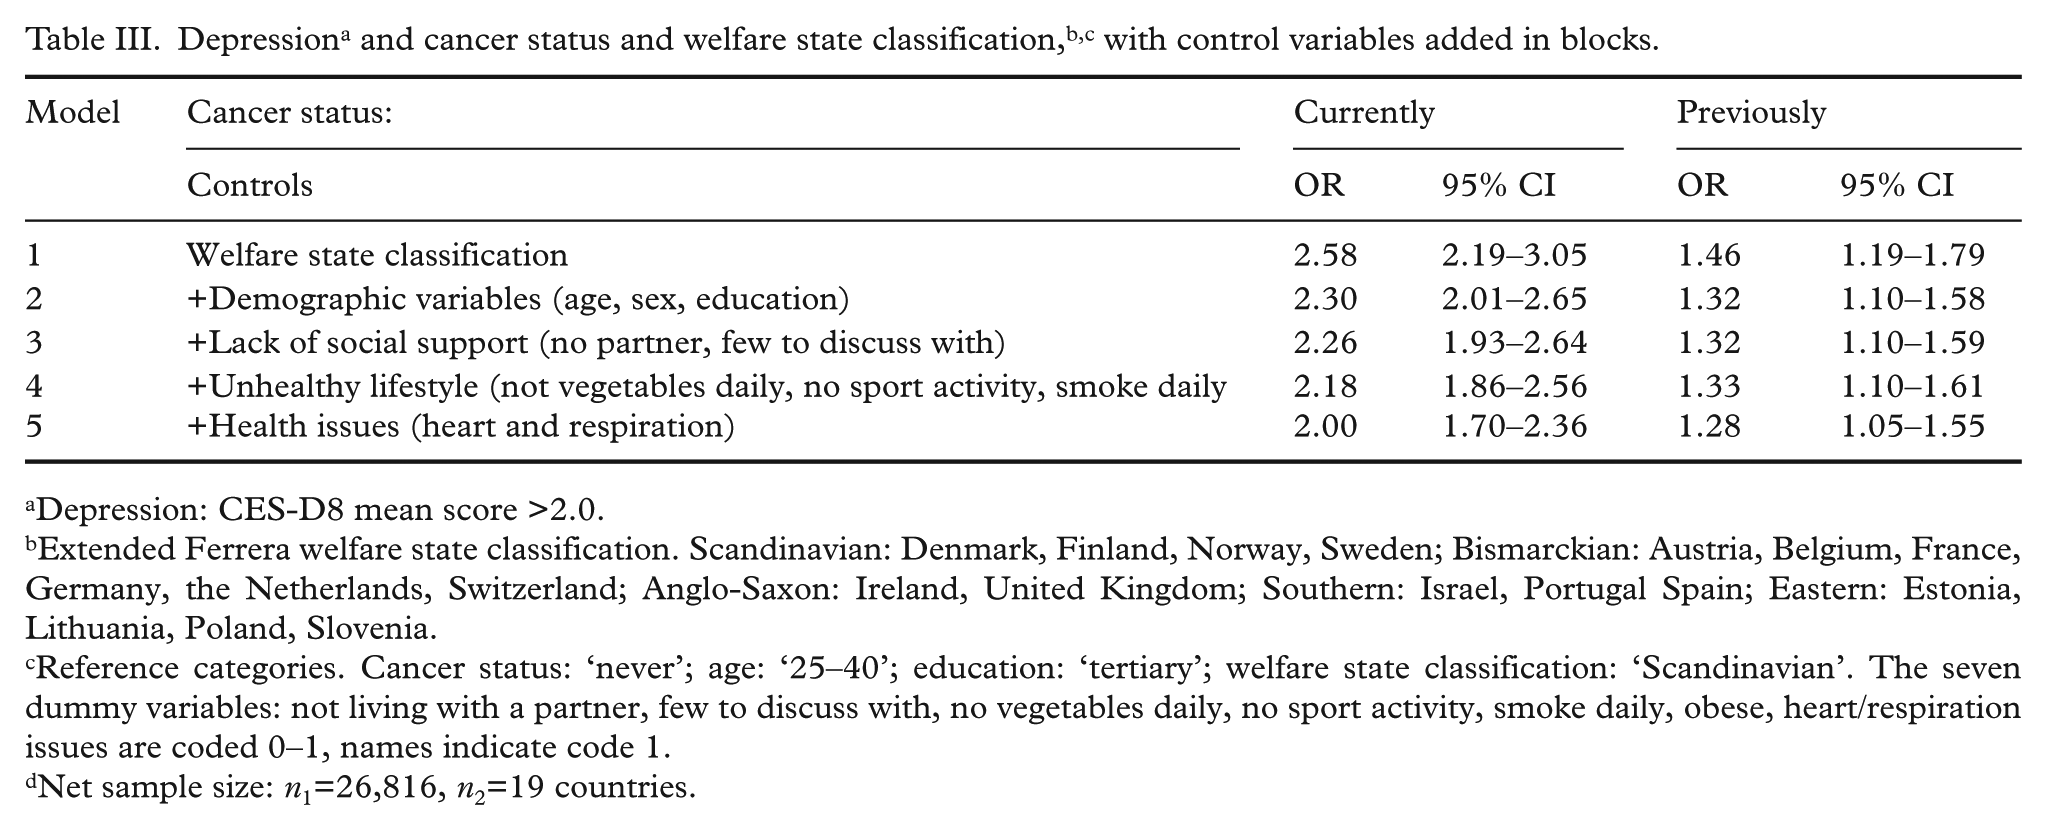
Depression: CES-D8 mean score >2.0.
Extended Ferrera welfare state classification. Scandinavian: Denmark, Finland, Norway, Sweden; Bismarckian: Austria, Belgium, France, Germany, the Netherlands, Switzerland; Anglo-Saxon: Ireland, United Kingdom; Southern: Israel, Portugal Spain; Eastern: Estonia, Lithuania, Poland, Slovenia.
Reference categories. Cancer status: ‘never’; age: ‘25–40’; education: ‘tertiary’; welfare state classification: ‘Scandinavian’. The seven dummy variables: not living with a partner, few to discuss with, no vegetables daily, no sport activity, smoke daily, obese, heart/respiration issues are coded 0–1, names indicate code 1.
Net sample size: n1=26,816, n2=19 countries.
Table IV shows the detailed estimates for the full model. Among the demographic variables, age showed only a weak relationship with depression, whereas women were much more likely than men (OR=1.75; 95% CI 1.60–1.90) to have scores above the cut-point on the CES-D 8. Education was clearly related to depression, with the highest odds ratio for people with primary and lower secondary education compared to people with tertiary education (OR=2.15; 95% CI 1.82–2.55). Among the social support indicators, not living with a partner was the most important predictor of depression (OR=2.21; 95% CI 2.04–2.40). The three (unhealthy) lifestyle indicators, which may control for reverse causality or selection, were moderately related to depression, with odds ratios around 1.5 compared to the reference categories of healthy lifestyles. The co-morbidity indicator, with a value of 1 for respondents who reported heart/circulation problems and breathing problems during the last 12 months, and 0 otherwise, was an important predictor of high scores on the CES-D 8 (OR=2.19; 95% CI 1.88–2.41). In sum, the most important predictors of high scores on the depression scale in the full model were: level of education, not living with a partner, experiencing problems with heart or respiration and reporting suffering from cancer at the time of the interview, each with odds ratios around 2.0.
Depression: CES-D 8 mean score >2.0.
Extended Ferrera welfare state classification. Scandinavian: Denmark, Finland, Norway, Sweden; Bismarckian: Austria, Belgium, France, Germany, the Netherlands, Switzerland; Anglo-Saxon: Ireland, United Kingdom; Southern: Israel, Portugal Spain; Eastern: Estonia, Lithuania, Poland, Slovenia.
Reference categories. Cancer status: ‘never’; age: ‘25–40’; education: ‘tertiary’; welfare state classification: ‘Scandinavian’. The seven dummy variables: not living with a partner, few to discuss with, no vegetables daily, no sport activity, smoke daily, obese, heart/respiration issues are coded 0–1, names indicate code 1.
Net sample size: n1=26,816, n2=19 countries.
Discussion
We compared three groups in terms of depression: people who had cancer at the time of the interview (‘Currently’), people who previously had had cancer (‘Previously’) and people who had never experienced cancer (‘Never’). The results for depression by cancer status may be summed in this way. The unadjusted odds ratio on depression for the ‘Currently’ group (ORunadjusted=2.59; 95% CI 2.20–3.06) was reduced after adjusting for some potential sources of confounding (ORadjusted=2.00; 95% CI 1.70–2.36). The unadjusted odds ratio for the ‘Previously’ group was also reduced after adjusting for confounding (ORunadjusted=1.46; 95% CI 1.19–1.79; and ORadjusted=1.28; 95% CI 1.05–1.55). To illustrate further the differences between the groups by cancer status, the predicted probabilities of depression (scores above the cut-point) from the full model are presented in Figure 1.
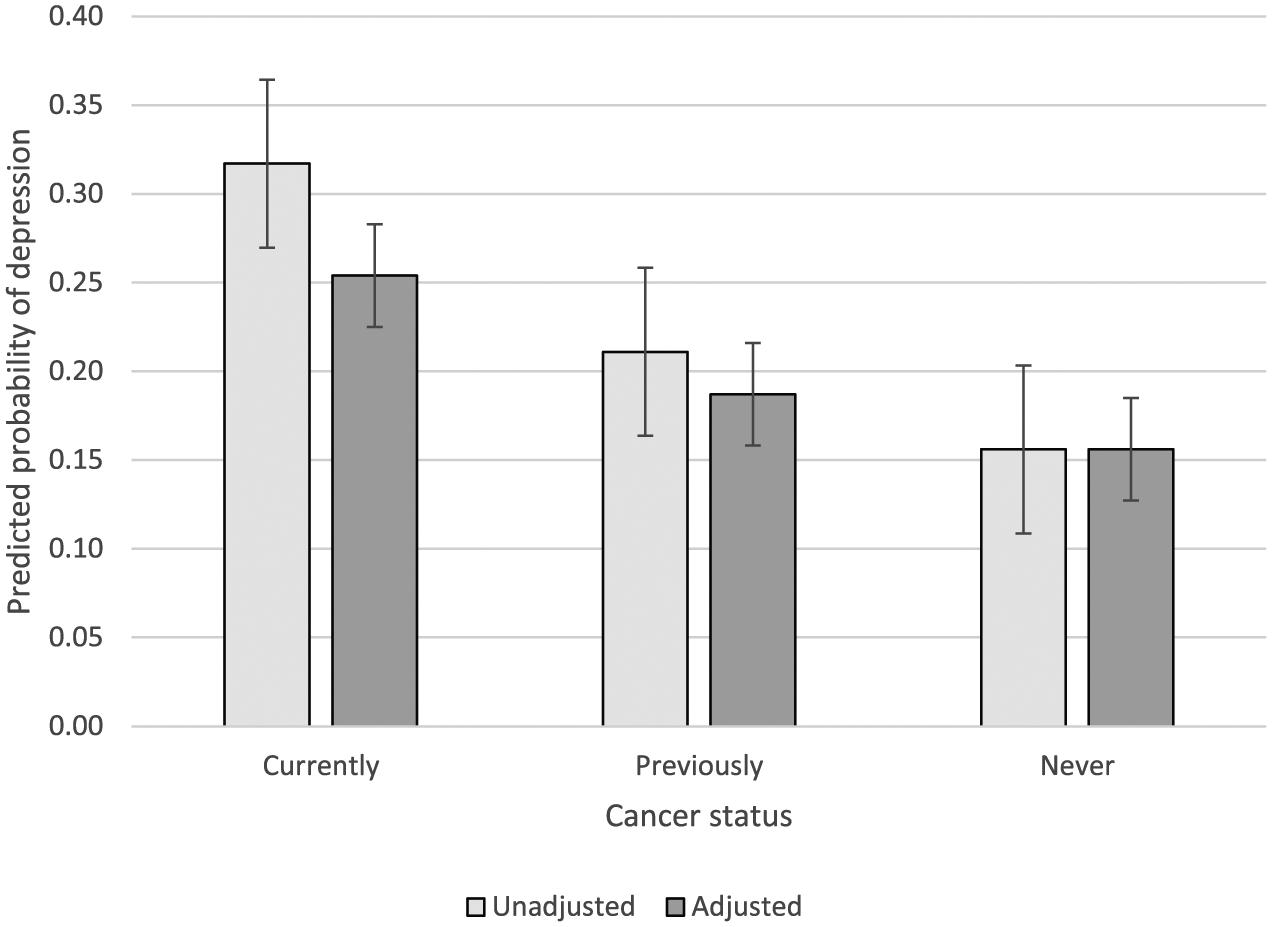
Predicted probabilities of depression by cancer status with error bars (95% confidence intervals).
In their review, Nezu et al. [2] concluded that previous research shows a robust relationship between cancer and depression, although the estimates from the studies did vary considerable due to a combination of different methods to assess depression and samples with different types of cancer. We found an overall difference in depression between people with cancer and people who had never experienced cancer, which is consistent with a ‘robust relationship’. Our study cannot, however, show details regarding types of cancer, since this information was unavailable in our data.
A systematic review [5] compared the diagnosis of depression in cancer survivors with healthy controls and found the relative risk of depression to be similar between long-term cancer survivors (two years since diagnosis) and healthy controls. A register-based Danish study [7] based on rates of hospitalisation for depression found that an initial increased risk for depression for cancer survivors in the first year after the diagnosis diminished in subsequent years. Furthermore, the increased risk for depression varied considerably with the type of cancer. Our finding of a small but statistical significant adjusted overall difference between the ‘Previously’ and the ‘Never’ group is inconsistent with the above-cited comprehensive review [5] but largely consistent with the Danish study [7], although neither type of cancer disease nor the date of the diagnosis were available in our data.
Furthermore, we performed two sensitivity tests. Some respondents tend to give the same response category for all questions in a set of questions. In the net sample, we found that 372 picked an identical response category for all eight questions on symptoms of depression. We omitted these 372 respondents with zero variance and reran the full model. The results were almost identical to those reported in Table IV. A study of the general US population [18] raised some doubts about the psychometrical equivalence of the CES-D across race/ethnicity groups, whereas a subscale of five items measuring positive or negative affective symptoms showed satisfactory comparative validity. The CES-D 8 includes these five items plus three items on consequences of depression. We therefore, reran the full model with a CES-D 5 scale. The results were quite similar to those based on the CES-D 8.
We found country differences in depression, with high scores most likely in the Southern and Eastern welfare state regimes. The welfare regime by cancer status cross-level interaction did not, however, attain statistical significance. The interaction included eight parameters, but this was problematic for the statistical power in a sample with only 19 countries. We collapsed the classification to distinguish between the Southern and Eastern regimes, on the one hand, and the Scandinavian, the Bismarckian and the Anglo-Saxon regimes, on the other hand. In this way, the cross-level interaction involved only two parameters. Still, the results largely confirmed the results for the full parametrisation, and we conclude that the relationship between cancer status and depression does not show variation across welfare state regimes.
To our knowledge, our study is the first to compare symptoms of depression in cancer victims in a large-scale cross-national data set which also enabled us to examine whether the differences in depression by cancer status varied by welfare state regimes. Our study does have several limitations. First, the cancer status classification is a crude self-reported measurement not based upon clinical diagnoses, and we did not have information on the type of cancer. Therefore, it is only possible to provide a general picture of the cancer population, although earlier research indicates that there is variation in depression among types of cancer. For those who reported having had cancer previously, we lack information on when they became cancer free. It is not possible in the present study to control for prognosis and potential selection effects of people who have died of cancer. In sum, although the data have limitations in terms of the level of detail, we do not think these limitations bias our findings in any particular direction. Another limitation is our use of a non-validated cut-point of the CES-D 8, which is less robust than a validated one.
In conclusion, respondents with cancer showed a substantial elevated risk of depression, even after adjusting for a range of potential confounders. Respondents who had recovered also showed a significantly higher adjusted risk of depression than respondents who had never experienced cancer. The differences in depression by cancer status did not appear to vary among the welfare state regimes.
Footnotes
Declaration of conflicting interests
The author(s) declared no potential conflicts of interest with respect to the research, authorship, and/or publication of this article.
Funding
The author(s) received no financial support for the research, authorship, and/or publication of this article.