
Abstract
The sorption of airborne polychlorinated biphenyls (PCBs) by 20 building materials and their re-emission (desorption) from concrete were investigated using two 0.053 m3 environmental chambers connected in series with a field-collected caulk in the source chamber serving as a stable source of PCBs and building materials in the test chamber. During the tests, the PCB concentrations in the outlet air of the test chamber were monitored and the building materials were removed from the test chamber at different times to determine their PCB content. Among the materials tested, a petroleum-based paint, a latex paint, and a certain type of carpet were among the strongest sinks. Solvent-free epoxy coating, certain types of flooring materials, and brick were among the weakest sinks. For a given sink material, PCB congeners with lower vapour pressures were sorbed in larger quantities. Rough estimates of the partition and diffusion coefficients were obtained by applying a sink model to the data acquired from the chamber studies. A desorption test with the concrete panels showed that re-emission is a slow process, suggesting that PCB sinks, e.g. concrete, can release PCBs into the air for a prolonged period of time (years or decades). This study could fill some of the data gaps associated with the characterization of PCB sinks in contaminated buildings.
Keywords
Introduction
Polychlorinated biphenyls (PCBs) are a class of 209 chlorinated organic compounds known as congeners. Commercial production of PCBs started in 1929 and was banned by the U.S. Congress in 1978. PCBs were once used as plasticizers in caulking materials because of their compatibility with the base resin or binders such as polysulphide and polybutene. 1 PCBs were also used in closed system and heat transfer fluids (e.g. transformers, capacitors, and fluorescent light ballasts). 2 The phenomenon of PCB transport from primary sources to building materials and other indoor constituents in PCB-contaminated buildings is well known but poorly understood.3–7 There has been a general acknowledgment that PCB sinks, often referred to as secondary sources in the literature, can cause elevated concentrations of PCBs in indoor air after the primary sources have been removed, 8 impacting the mitigation effort. Mitigating large quantities of contaminated building materials by decontamination, encapsulation, and removal has enormous environmental and economic implications. Therefore, understanding the process of PCB transport and the behaviour of PCB sinks is critical to exposure assessment and risk management for PCBs in buildings.
In this study, a primary source is defined as an indoor constituent that contained PCBs when it was brought into the building. Most frequently mentioned primary sources are PCB-containing caulking materials and sealants and PCB-containing light ballasts. A PCB sink is an indoor constituent that did not contain PCBs initially but later “picked up” PCBs as a result of exposure to contaminated indoor air or as a result of direct contact with a primary source. Field measurements have demonstrated that PCB sinks are widespread in PCB-contaminated buildings. 9 A study by Weis et al. 6 identified 16 “secondary sources” in four heavily contaminated schools in Germany, where the air concentrations of PCBs ranged from 7.4 to 39 µg/m3. The PCB content of those secondary sources ranged from 360 to 7600 mg/kg. Several studies10–12 noted the potential contribution of secondary sources to the PCB concentrations in indoor air. A recent literature review of mitigation methods for PCBs in buildings identified over a dozen likely secondary sources in contaminated buildings. 5 Gabrio et al. 13 reported the similarity in congener patterns between the primary and secondary sources. Overall, information related to secondary sources of PCBs in buildings is scarce in the literature. Little or no information on the transport process between primary and secondary sources of PCBs is available.
Laboratory testing of the sink effect in buildings started in the late 1980s. As a result, much has been learned and many models have been developed. Thorough reviews of experimental methods and models have been published in the literature.14–20 In addition to the conventional chamber method 21 and microbalance method, 22 several methods have been developed mainly for the determination of partition and diffusion coefficients for building materials, i.e. the cup method, 23 the twin chamber method,24,25 the diffusion metric method, 26 the twin-compartment method 27 , and the porosity test method. 28 In general, these methods are suitable for testing volatile chemicals. The major challenges for testing the sink effect for PCBs include: (1) low concentrations of the PCBs in air, which leads to long sampling times (at least several hours) or large sampling volumes; (2) very small mass gain in the sink material (usually in the microgram range), which makes it difficult to measure the changes using a microbalance; and (3) sorption of PCBs by the walls of the chamber because of low volatilities of PCBs.
This paper summarizes the laboratory research results for PCB transport from primary sources to PCB sinks, including PCBs from air to interior surface materials. In this study, we identified potentially useful mathematical tools for predicting the behaviour of PCB sinks in PCB-contaminated buildings and estimated the key parameters such as sorption capacity, partition coefficients, and diffusion coefficients required by the tools.
Materials and methods
Test specimens
Sink materials tested. a
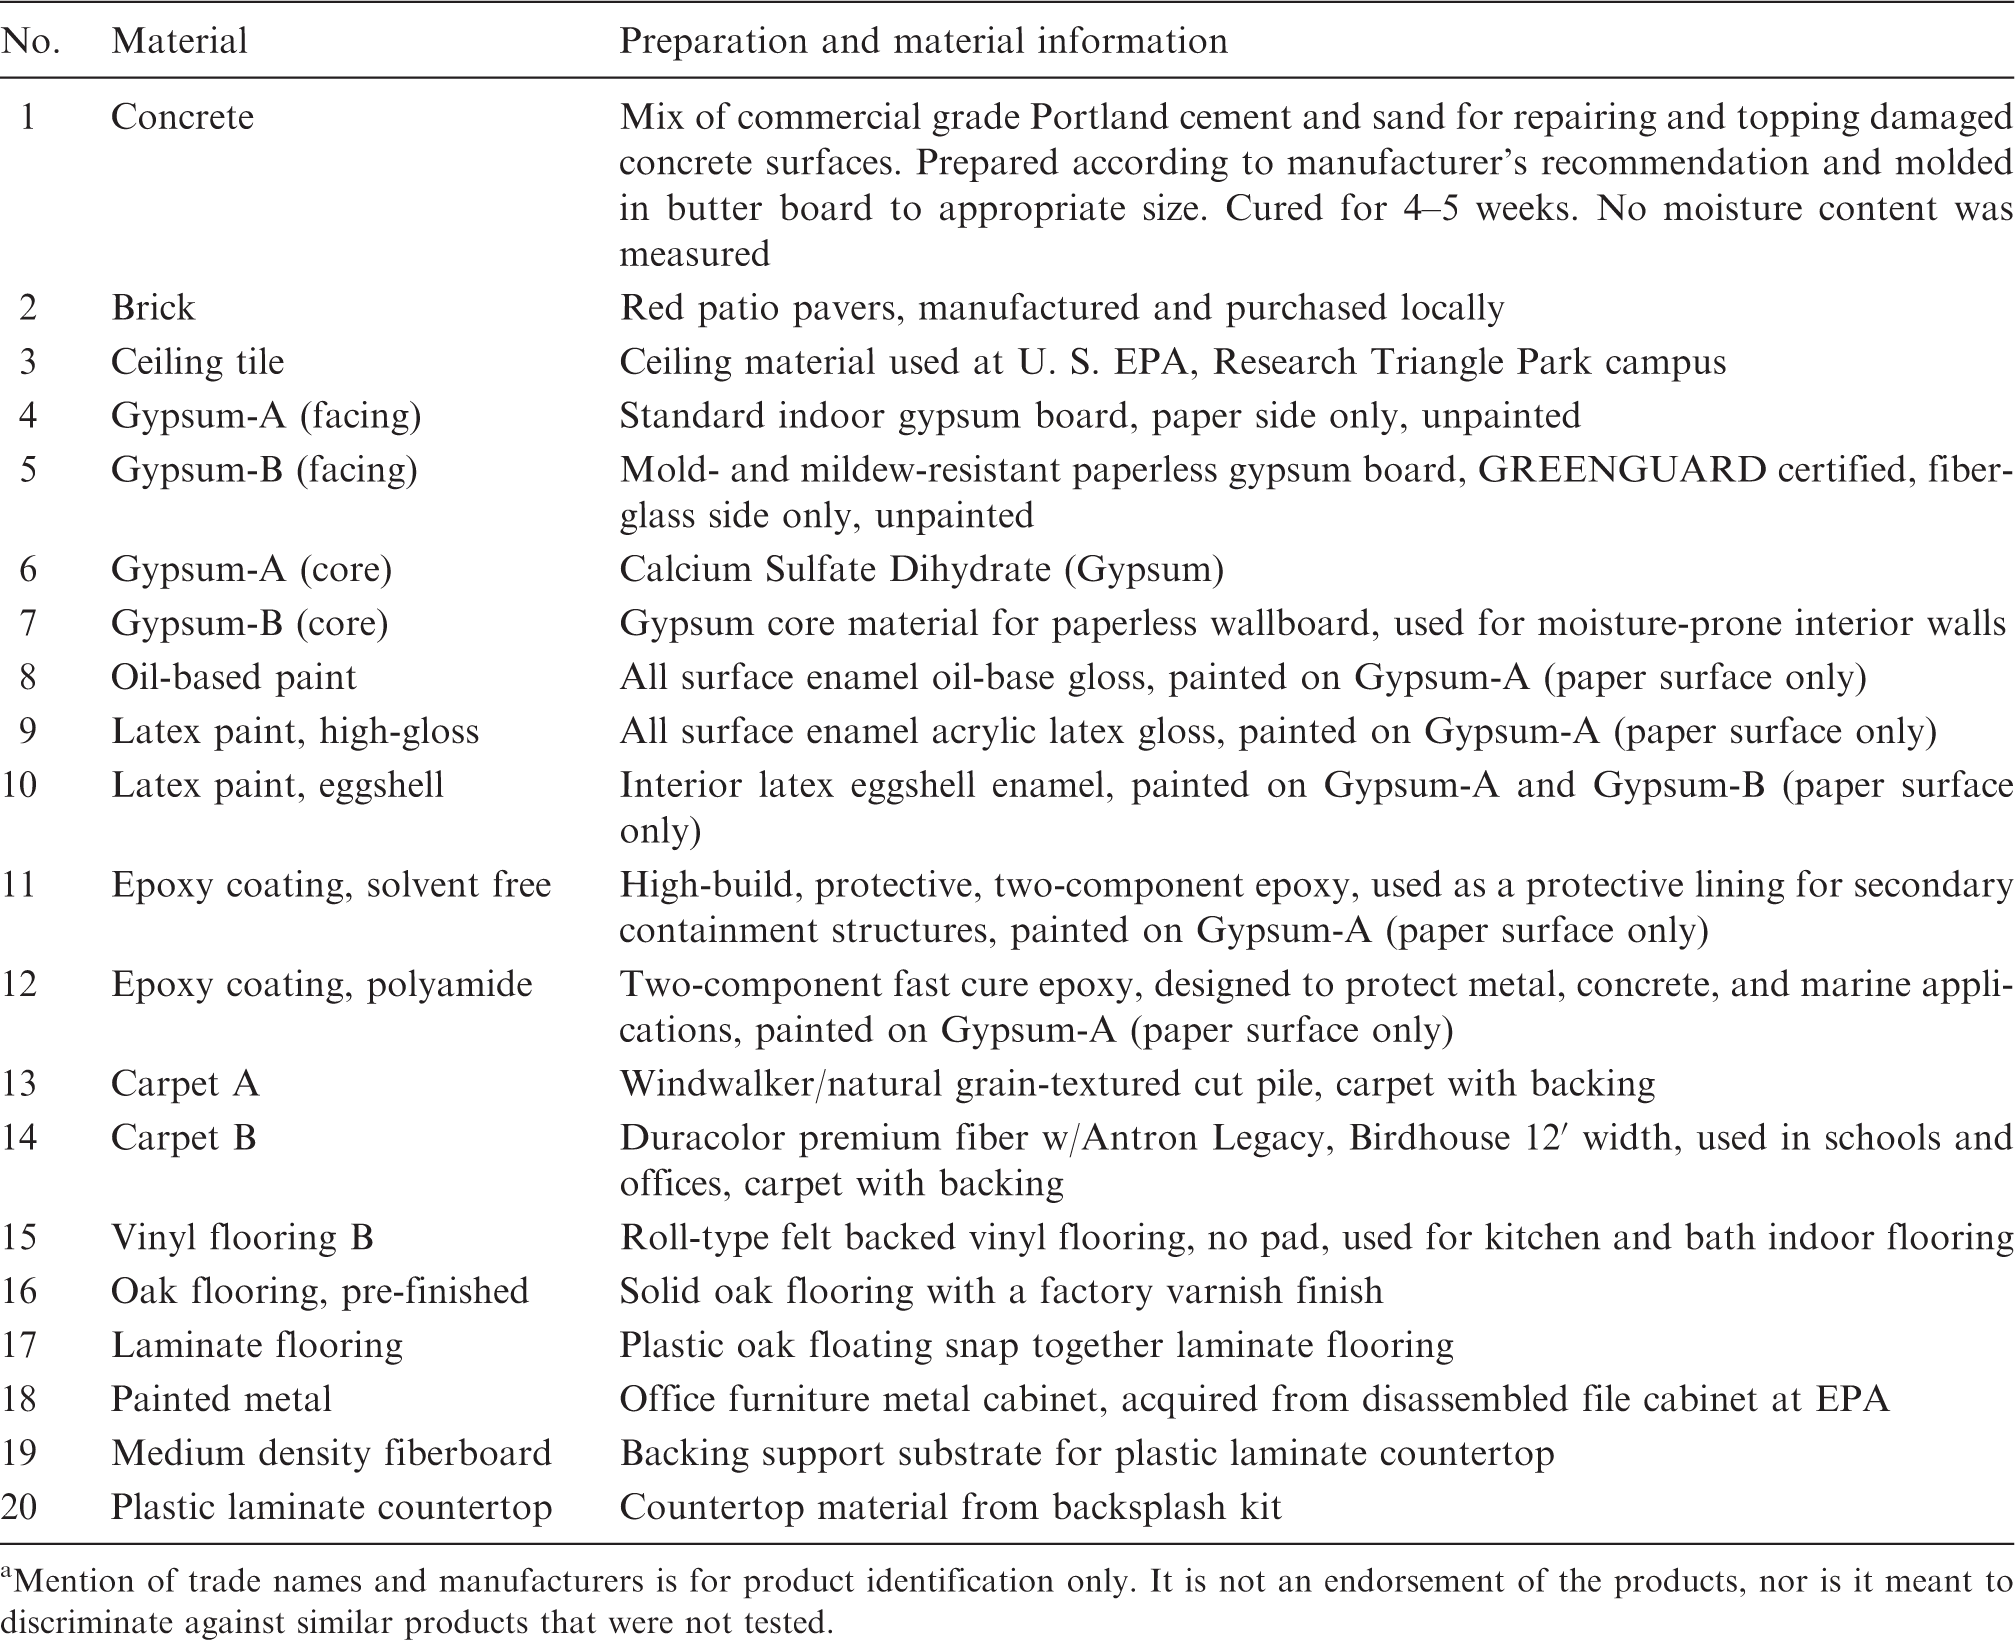
Mention of trade names and manufacturers is for product identification only. It is not an endorsement of the products, nor is it meant to discriminate against similar products that were not tested.
Concentrations (µg/m3) of the target congeners in chamber air during an emission test. a
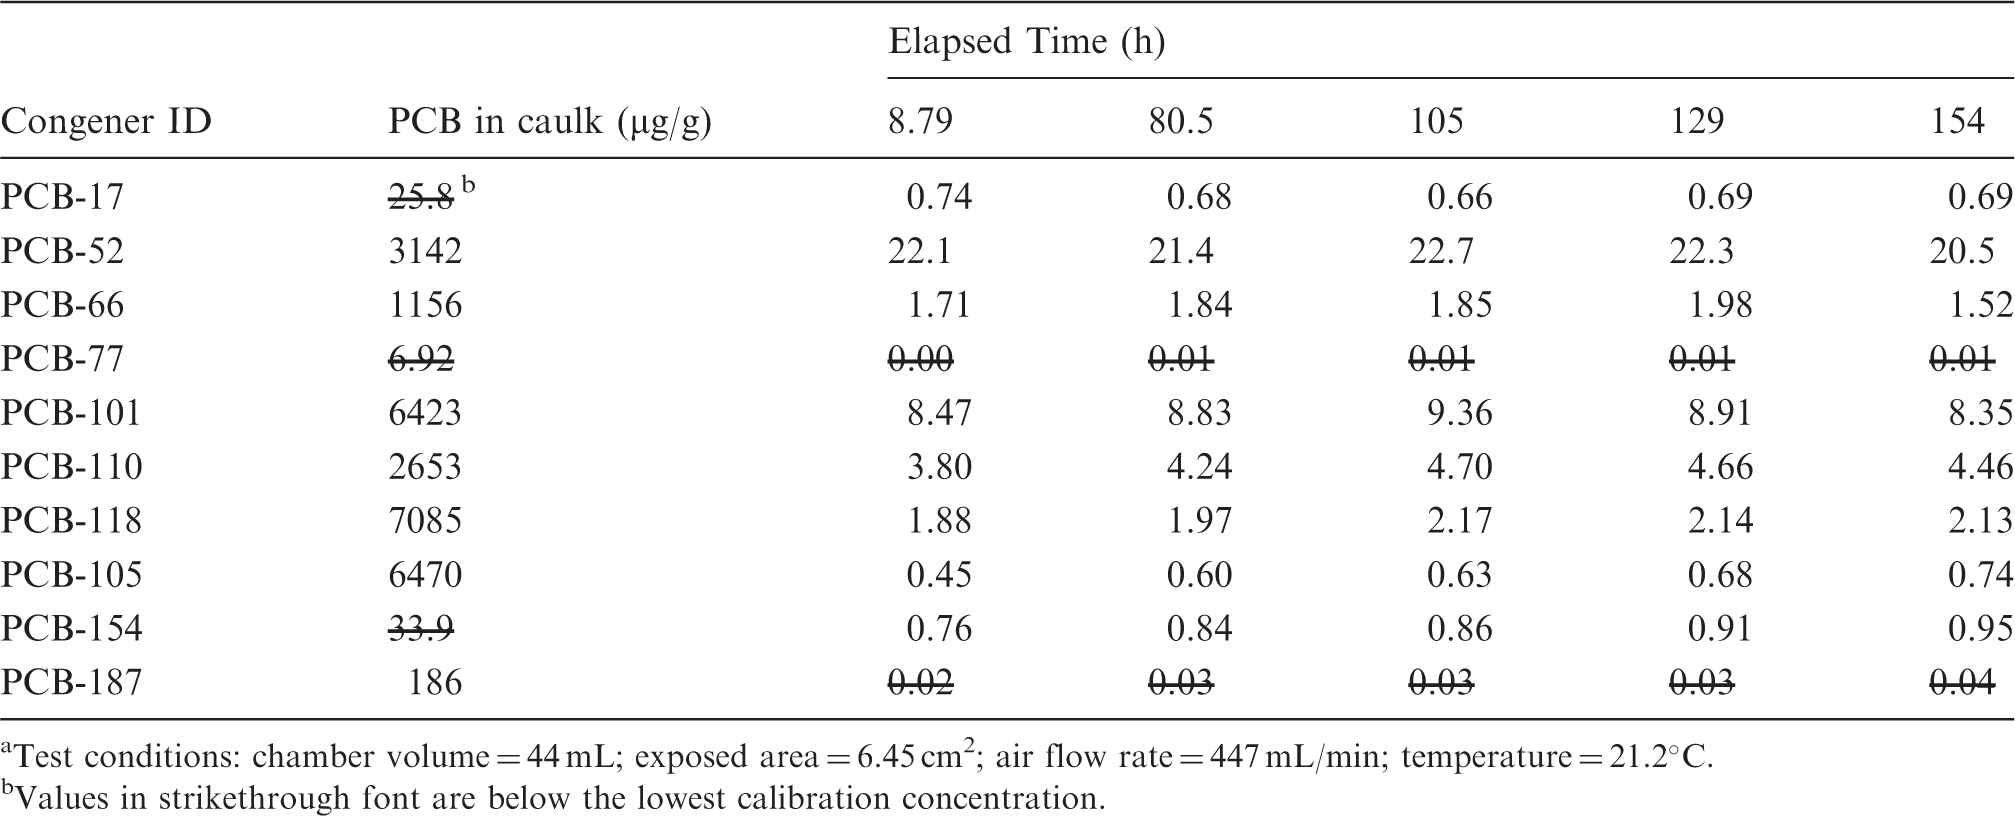
Test conditions: chamber volume = 44 mL; exposed area = 6.45 cm2; air flow rate = 447 mL/min; temperature = 21.2℃.
Values in strikethrough font are below the lowest calibration concentration.
Small chamber tests
Material sink tests (S-2 and S-3) were conducted in two 0.053 m3 stainless steel chambers, a source chamber and a material test chamber connected in series. The two chambers were housed in a temperature-controlled incubator (Model 39900, Forma Scientific Inc, Marietta, OH, USA) that conformed to ASTM D5116-10. 29 An OPTO 22 data acquisition system (OPTO 22, Temecula, CA, USA) continuously recorded the outputs of the mass flow controllers, temperatures, and relative humidities. During tests, sink materials were exposed to a roughly constant concentration of PCBs emitted from the caulking material. Environmental parameters (23℃, 50% relative humidity, and 1 air change per hour) were established in both chambers. The test material buttons were placed in the flow-through test chamber, which was connected to the PCB source chamber. During a sink test, the material buttons were removed from the test chamber at different times and extracted for determination of PCB content in the sink material as a function of time. The PCB concentrations in the outlet of the chamber air were determined by sampling using polyurethane foam (PUF) (pre-cleaned, certified, Supelco, St. Louis, MO, USA). The air samples were collected at 0.021 m3/h at the outlet of the test chamber to a volume of 0.336 m3. This experimental method was designed to minimize the sink effect of chamber walls as only air concentrations monitored at the outlet of the chamber will be used. More details of the chamber setup and test procedures are described in the literature.17,18,30
One sink test (S-4) was designed to observe the re-emissions from concrete by dosing PCBs into the test chamber first, and then flushing the chamber with clean air. The test was performed with six concrete panels, 150 mm by 150 mm by 8 mm each. The chamber loading (i.e. the area of the material divided by the volume of the chamber) was 5.8 m2/m3. In addition to the concrete panels, four concrete buttons were prepared using the same concrete and placed in a custom-made cage, which was inserted into the chamber through a hole in the wall of the chamber. This device allowed concrete buttons to be removed from the chamber for the determination of the PCB content on the concrete panels at the end of the dosing period with minimal disruption to the air concentration in the chamber. During the PCB dosing period, inlet and outlet air samples were collected on PUF at timed intervals. At 167 h, two of the concrete buttons were removed from the holder for extraction and analysis of the PCBs in the gas chromatography/mass spectrometry (GC/MS) calibration range. After the PCB source was disconnected from the inlet of the test chamber and replaced with the conditioned clean air source, PUF samples were collected immediately from the outlet of the test chamber to monitor PCB’s re-mission and determine the decay of PCB concentrations in the chamber air. Chamber air samples were continued to be collected during the following 160-h decay period.
Sample extraction and analysis
Solid samples (i.e. building materials) were extracted by using a sonicator (Ultrasonic Cleaner FS30, Fisher Scientific, Pittsburgh, PA, USA) with 10 mL of hexane (99.9%, Fisher Scientific) and 100 mg of sodium sulphate (100%, Fisher Scientific) for 30 min in a scintillation vial. Before extraction, 100 µL of the 5 µg/mL recovery check standards, including 2, 4, 5, 6-tetrachloro-m-xylene (TMX), 13 C-PCB-77, and 13 C-PCB-206, were added to the extraction solution for an extraction efficiency check. After extraction, 990 µL of the extract was placed in a 1-mL volumetric flask containing 10 µL of 10 µg/mL internal standards, including 13 C-PCB-4, 13 C-PCB-52, and 13 C-PCB-194, and then transferred to GC vials for analyses. The collected PUF samples were stored in a refrigerator at 4℃ and extracted within seven days and analysed within 40 days. The PUF samples were extracted using Soxhlet method by following EPA Method 8082 A. 31 Fifty microlitres of 5 µg/mL recovery check standards were spiked onto the PUF samples before extraction. Ten µL of 10 µg/mL internal standards was added to 1 mL of the 5 mL final solution before GC/MS analysis. For both extraction methods, the final concentrations of each recovery check standard and each internal standard were 50 ng/mL and 100 ng/mL, respectively.
Ten individual PCBs (PCB-17, PCB-52, PCB-66, PCB-77, PCB-101, PCB-105, PCB-110, PCB-118, PCB-154, and PCB-187) identified as predominant components in the Aroclor 1254 were selected for quantification. Certified PCB standards were purchased from AccuStandard Inc. (New Haven, CT, USA). Certified 13 C-labelled internal standards and recovery check standards were purchased from Wellington Laboratories, Inc. (Guelph, Ontario, Canada). Certified TMX standard was purchased from ULTRA Scientific (North Kingstown, RI, USA). The samples were analysed by using Agilent 6980/5973 N GC/MS (Agilent, Santa Clara, CA, USA) with CTC PAL Auto Sampler (CTC Analytics AG, Zwingen, Switzerland) and Agilent 6980/5973+ GC/MS with 7683 Agilent Auto Sampler. The instruments were calibrated with PCBs at six levels in the range of 5–200 ng/mL. The GC/MS calibration and quantitation were performed using the relative response factor method under selected ion monitoring mode. The procedures are detailed in the literature. 32
Quality assurance and quality control
Standards that contained PCB-52, PCB-101, and PCB-77 obtained from a second source (ChemService, West Chester, PA, USA) were analysed after each calibration to verify the accuracy of the calibration within 100 ± 25% (% RSD, percent relative standard deviation). Standards at the middle point of the calibration were analysed to evaluate the daily performance of the GC/MS with the percent recovery within 100 ± 25% (% RSD). The method detection limit (MDL) was investigated for the PUF Soxhlet extraction and solid sonication extraction methods. The MDLs were in the range of 1.44–3.90 ng/mL and 0.23–1.09 ng/mL, respectively. The analytical results are considered acceptable if the percent recovery of laboratory controls was in the range of 60–140% for at least two of the three recovery check standards, and the precision of the duplicate was within ±25%. Chamber background and field control samples were collected and analysed. Extraction method blank and field blank samples were prepared and analysed as well. The measured PCB concentrations in the field controls were all below the lowest calibration concentrations.
Determination of sorption concentration
The sorption concentration (Cm) is the congener concentration in the building material as a result of the material/air partition. Cm has the unit (µg/m2), which can be converted to other units such as (µg/m3) or (µg/g) when the density and dimensions of the sink material are given. Sorption concentrations were determined experimentally. Normalized sorption concentration (Cm*, (µg/m2)sink/(µg/m3)air)) is the sorption concentration that corresponds to an air concentration of 1 µg/m3 as defined by equation (1)

Sorption rate (Rm, µg/m2/h) is defined by equation (2)

Note that Rm is the time-averaged sorption rate between times 0 and t. Rm is not the sorption rate at time t. Normalized sorption rate (Rm*, (µg/m2/h)sink/(µg/m3)air) is the sorption rate that corresponds to an air concentration of 1 µg/m3 and is defined by equation (3)

Estimation of partition and diffusion coefficients
Most diffusion-controlled sink models describe the properties of the sink material with three parameters17,20: the material/air partition coefficient (Kma, dimensionless), the diffusion coefficient of the adsorbate in the material (Dm, m2/h), and the thickness of the material (δ, m). To apply the existing models to PCB contamination in buildings, these three parameters are needed for the congeners of interest. In this study, the partition and diffusion coefficients for the tested materials were estimated by applying the degree of sorption saturation (DSS) model, also known as sorption saturation degree (SSD) in the literature, developed by Deng et al.
33
for the sorption data from Tests S-2 and S-3 via non-linear regression. The DSS is defined by equation (4)

The correlations between the DSS and the three dimensionless numbers (i.e. N1, Θ, and Fom) are given by equations (5) to (7), and equations (8) to (10) provide the respective definitions of N1, Θ, and Fom


Thus, M(t) in equation (4) can be expressed in a general form as equation (11)


In this method, PCB-52 was used as the reference congener, and index nd was 6.5, based on the literature. 37 The data-fitting software MicroMath Scientist 2.0 (MicroMath, Saint Louis, MO, USA) was used for the nonlinear regression. A more detailed description of the parameter estimation method was described in the literature. 30
Results
PCB transfer from air to interior surface materials
Four tests (S-1 through S-4) were conducted. The first test (S-1) was a scouting test and test S-4 was a re-emission test. Sink tests S-2 and S-3 measured the sorption concentrations as a function of time for 20 materials. The sorption concentrations increased over time as shown in Figure 1(a). PCB-52 was the most abundant congener in all the sink materials tested. However, the sorption process does not necessarily favour PCB-52. Rather, the abundance of PCB-52 was observed simply because PCB-52 produced the highest concentration in the air inside the chamber. Calculating the normalized sorption concentration allowed the comparison of sorption behaviour between congeners in the same material. The normalized sorption concentration of PCB-52 was the second lowest (Figure 1(b)), next only to PCB-17, which is more volatile than PCB-52.
(a) Sorption concentrations (Cm) and (b) normalized sorption concentrations (Cm*) for concrete in Test S-3 (in (a), concentrations of PCB-17, PCB-105, and PCB-154 were very close).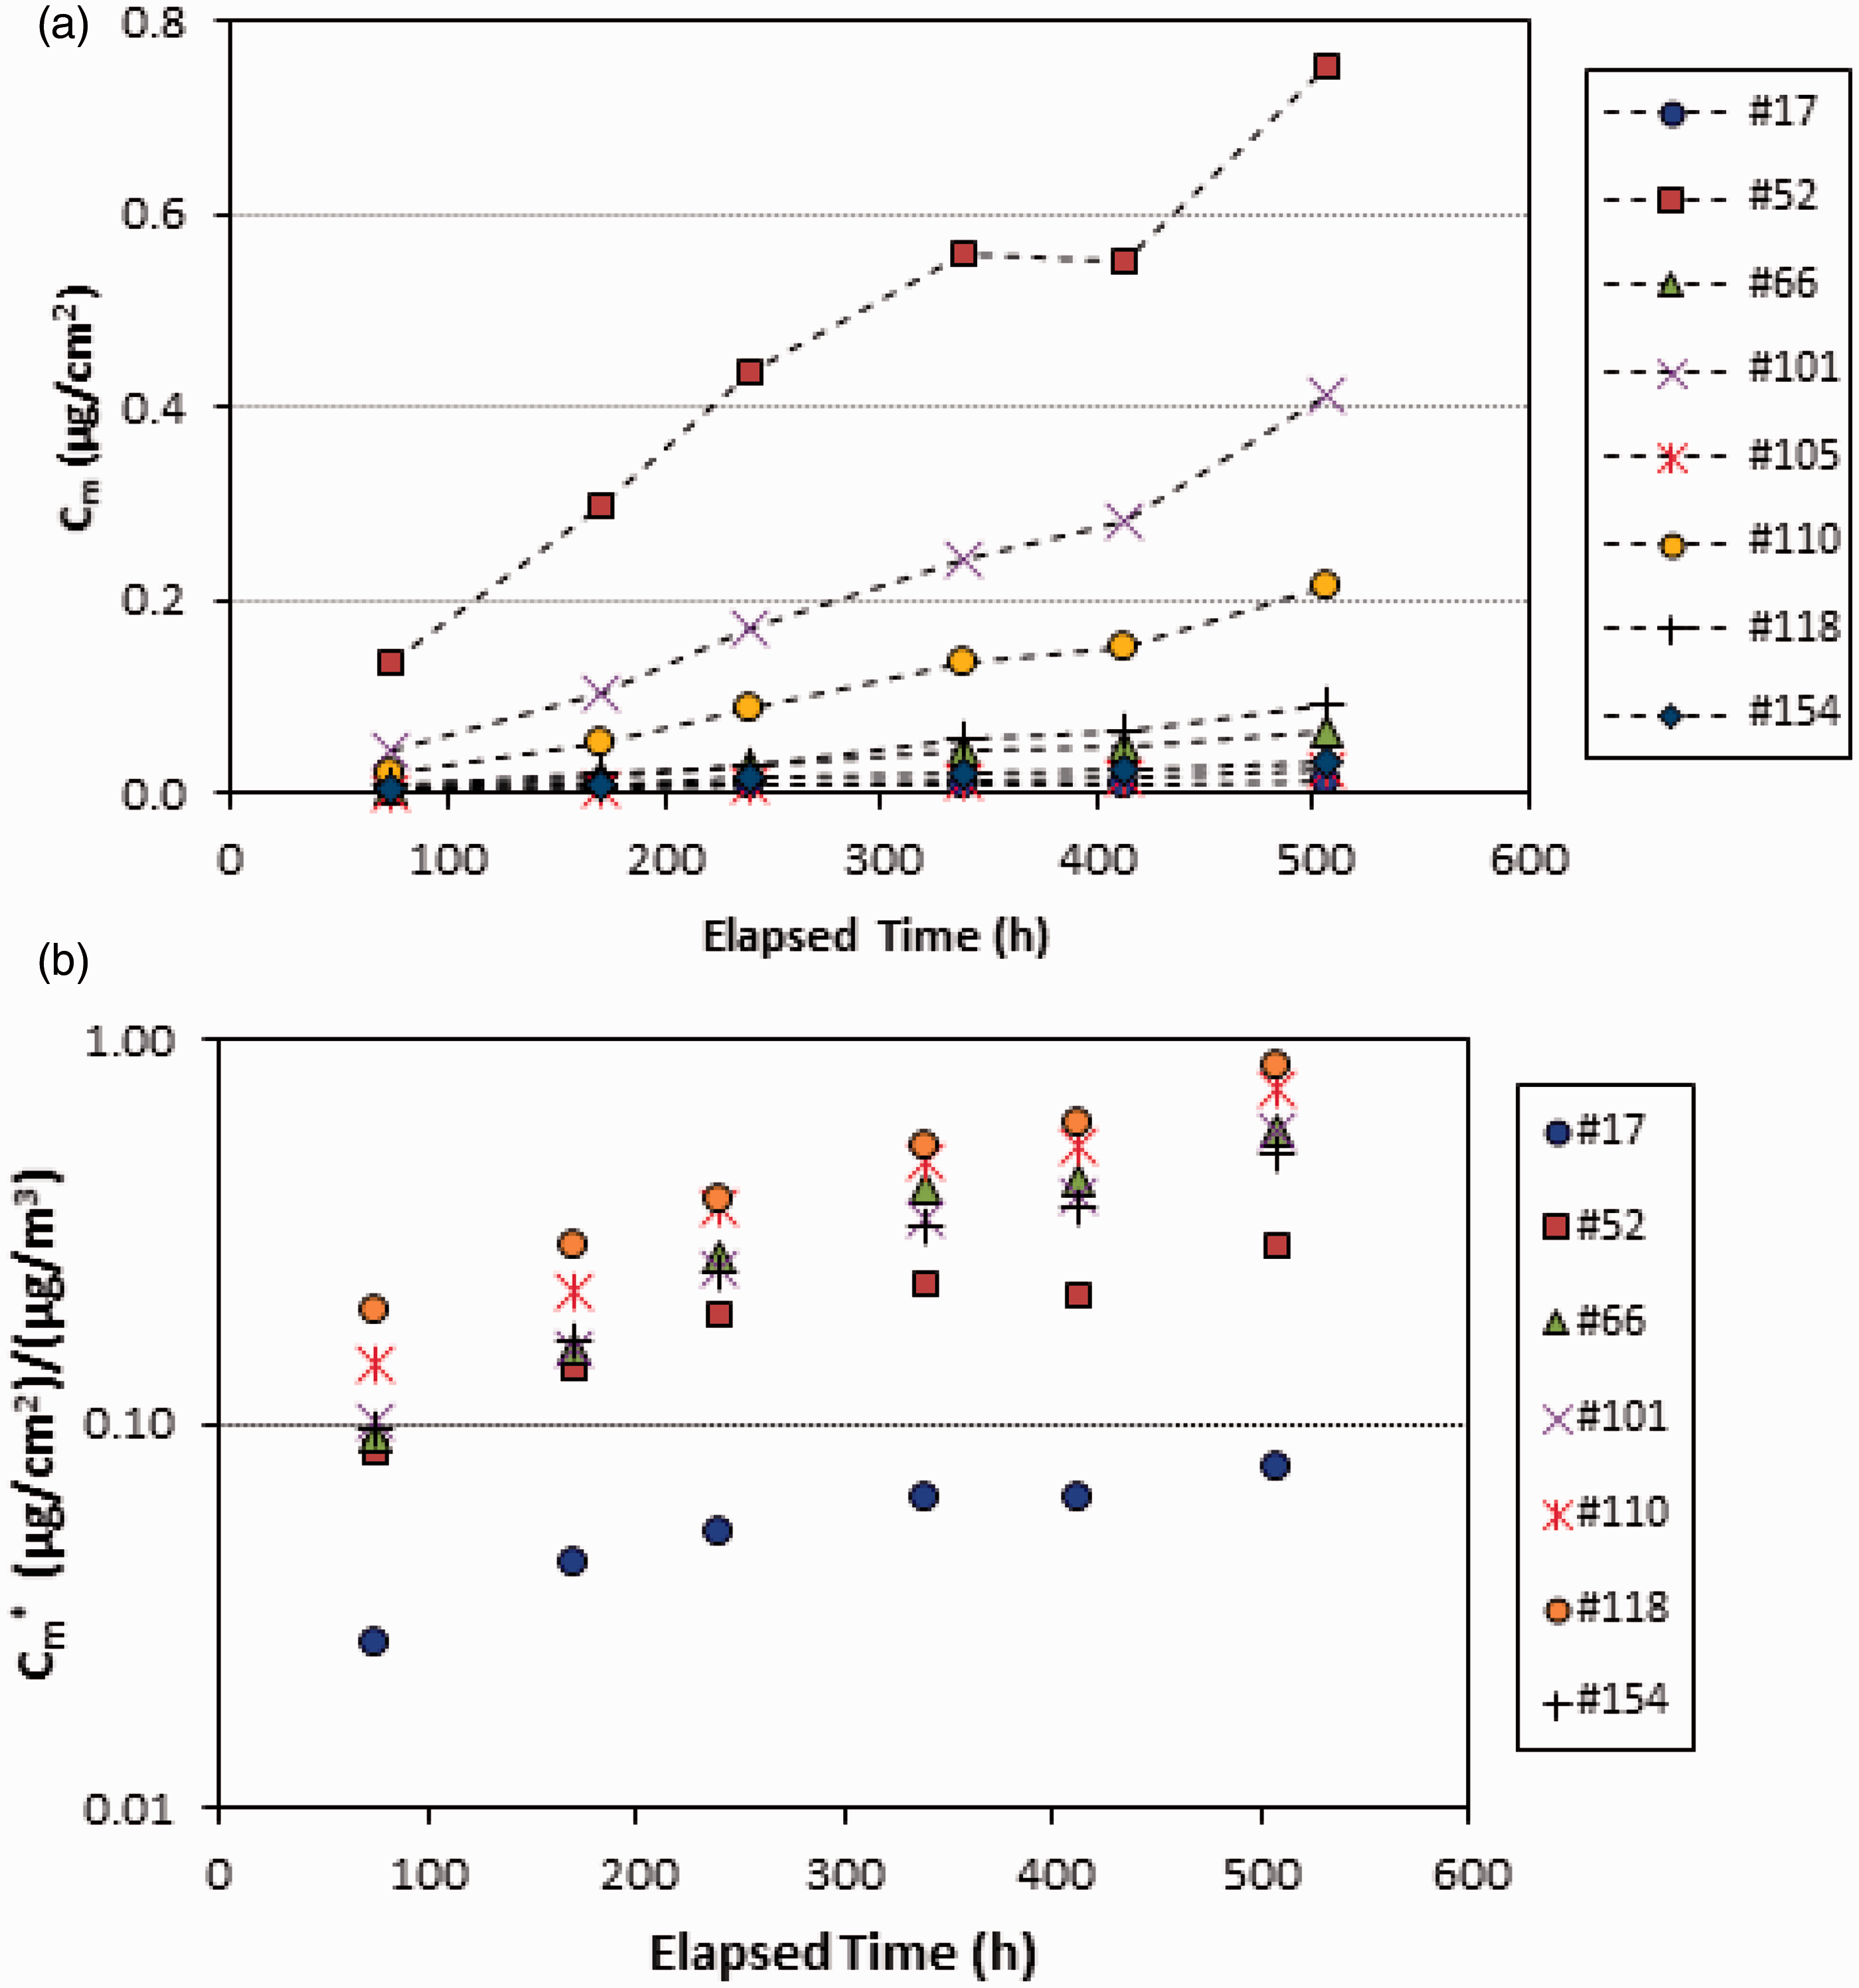
Introduction of the normalized sorption concentration also makes it possible to compare the data from different tests. Figure 2 compares the normalized sorption concentrations for PCB-52 and PCB-110 for all 20 materials tested in Tests S-2 and S-3. As shown in Figure 2, petroleum-based paint, latex paint, and certain carpets showed the strongest adsorption among the materials tested, whereas solvent-free epoxy coating, certain types of flooring materials, and brick were among the weakest sinks. The area for the carpet was based on the physical dimensions, not the actual surface areas. The normalized sorption concentrations varied greatly from material to material, indicating significant difference in sorption capacity.
Normalized sorption concentrations (Cm*) for PCB-52 (a) and PCB-110 (b) for the materials in Test S-2 (t = 269 h) and Test S-3 (t = 240 h).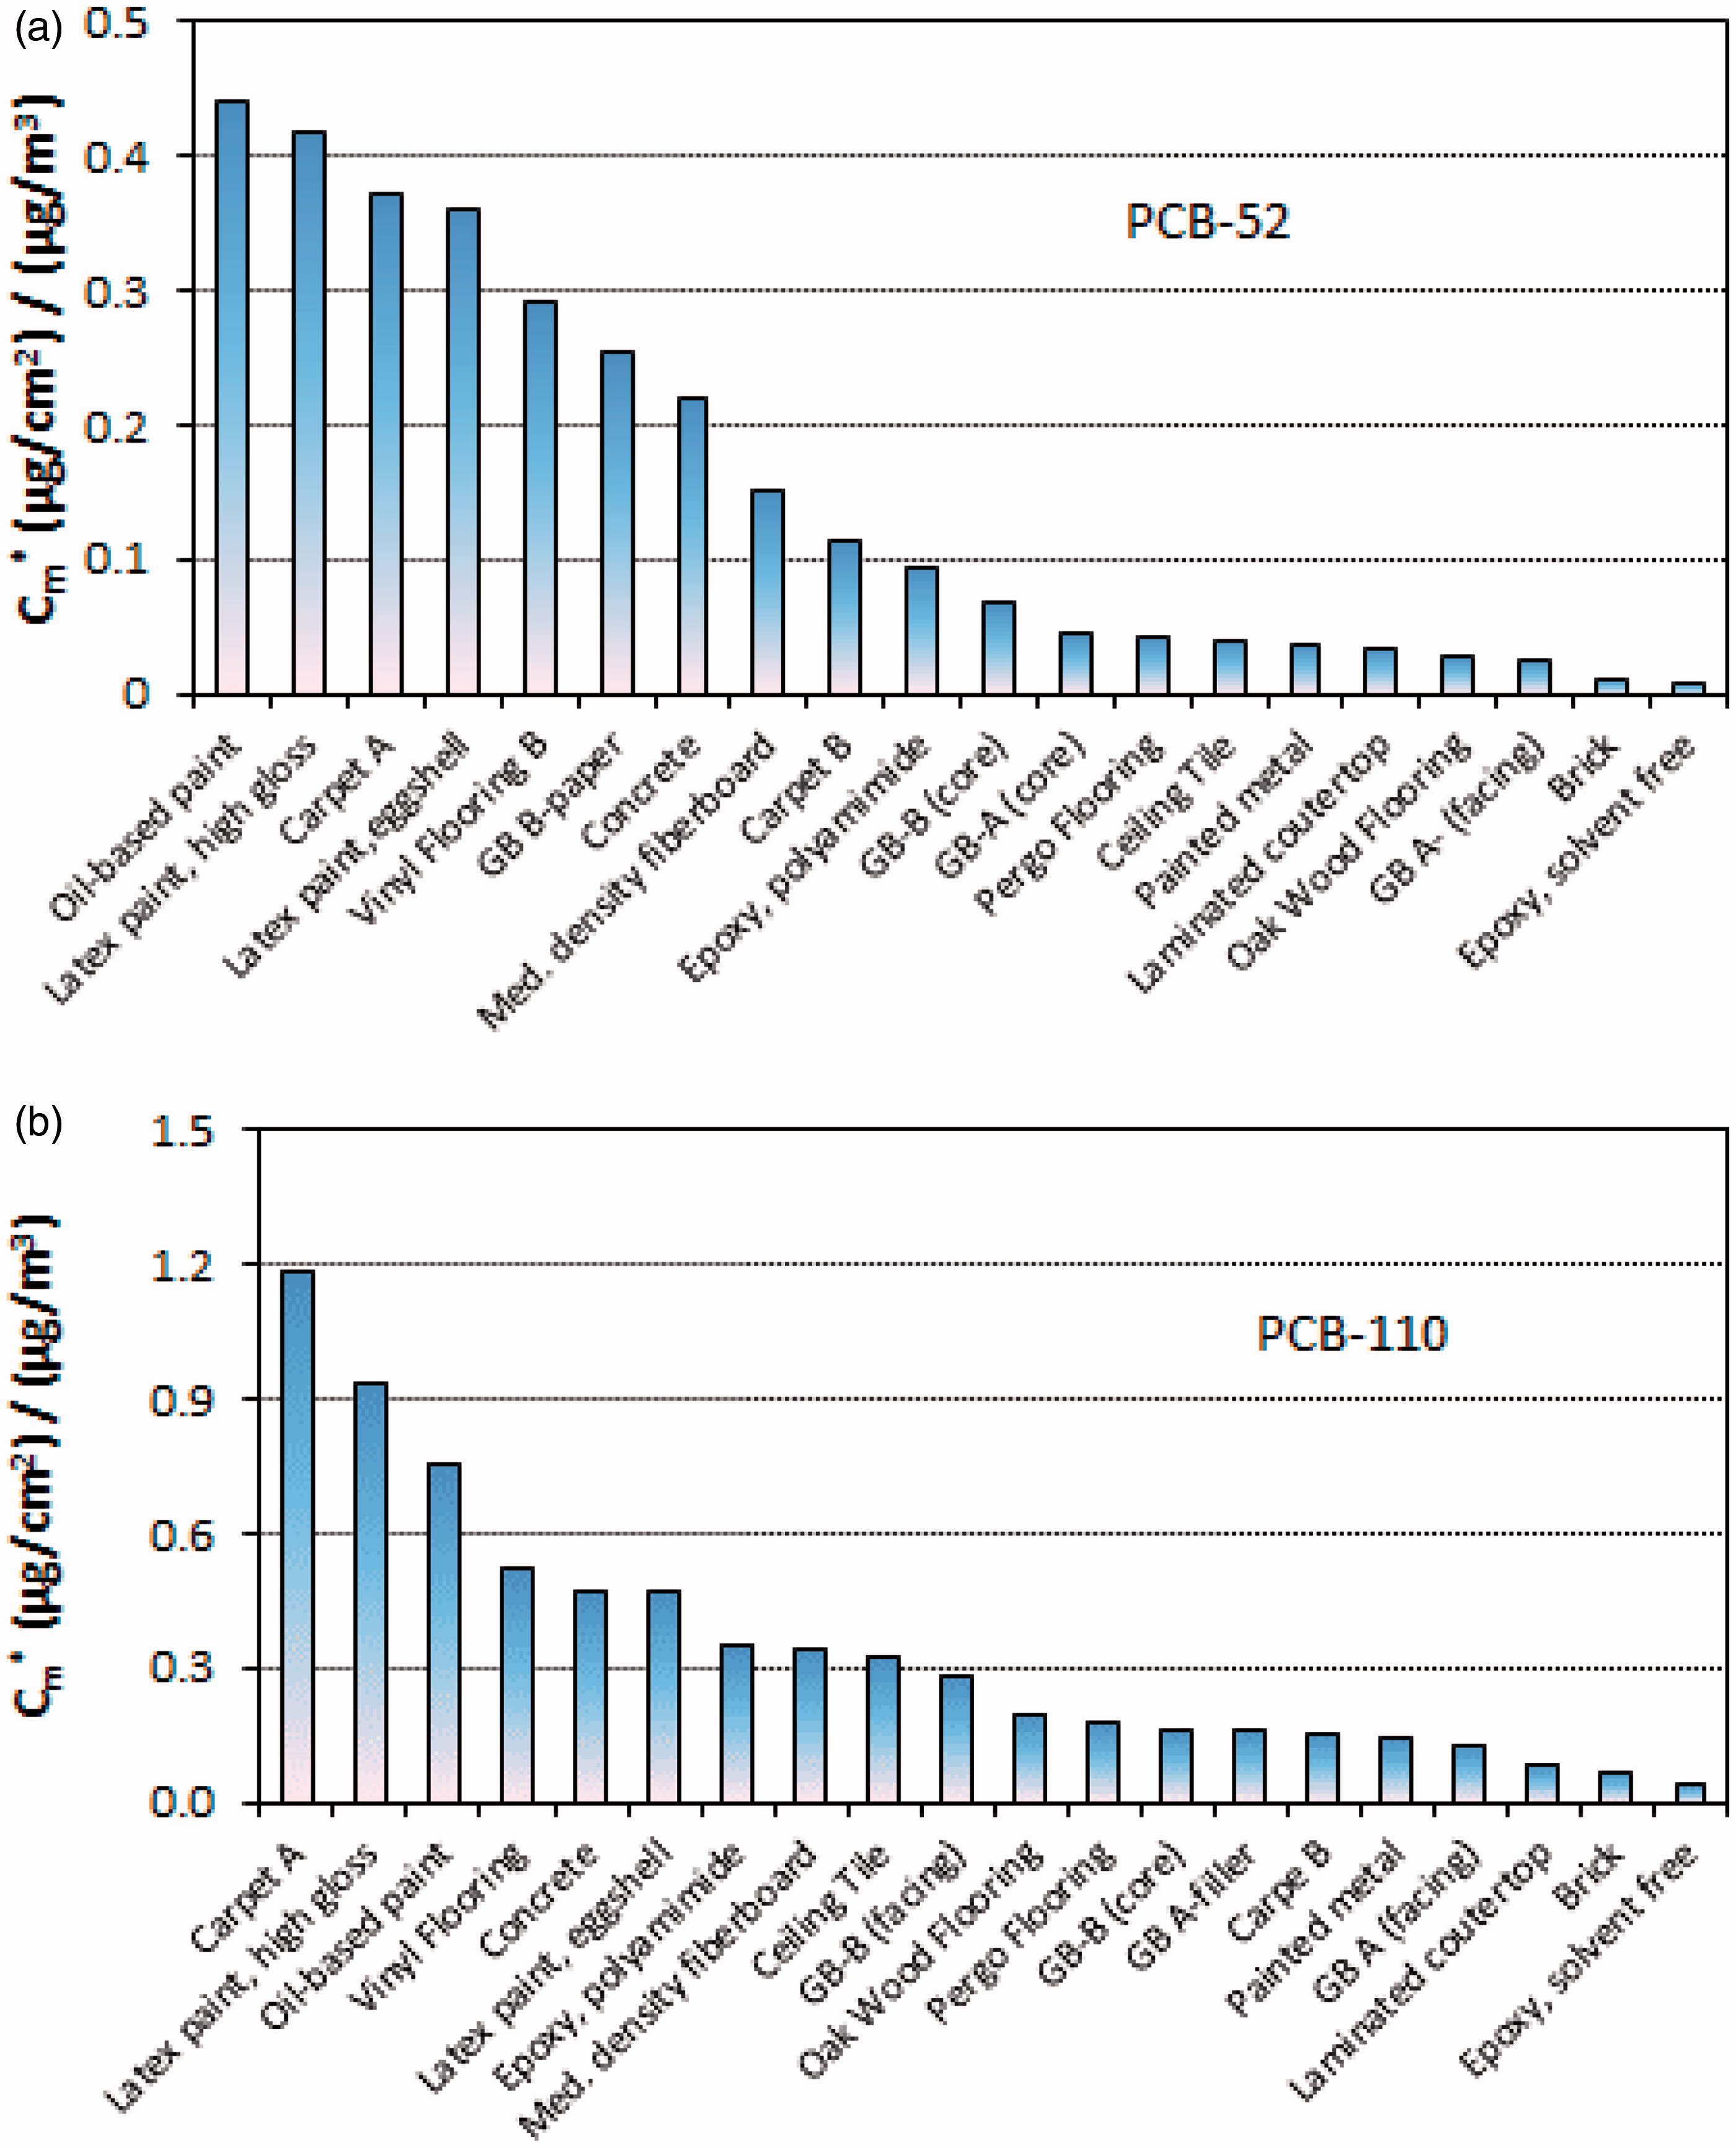
Although the sorption concentrations continued to increase over time (Figure 1), the rate of the increase decreased as the PCB congeners accumulated in the sink material. If the exposure time is sufficiently long, the sink material will become saturated, and the sorption rate will approach zero. Figure 3(a) shows the time-averaged sorption rates as a function of time for concrete. The rate appears to decrease faster for congeners with higher volatility. For concrete, the sorption rates for PCB-101, PCB-110, and PCB-118 were rather stable over the entire test period. Similar to normalized sorption concentration, the normalized sorption rate allowed the comparison of sorption rates for different congeners. Although PCB-52 was shown to have the highest sorption rate among the four congeners, its normalized sorption rate was the lowest among the four congeners (Figure 3(b)). The normalized sorption rate favoured the less volatile congeners.
(a) Sorption rates and (b) normalized sorption rates for concrete in Test S-3.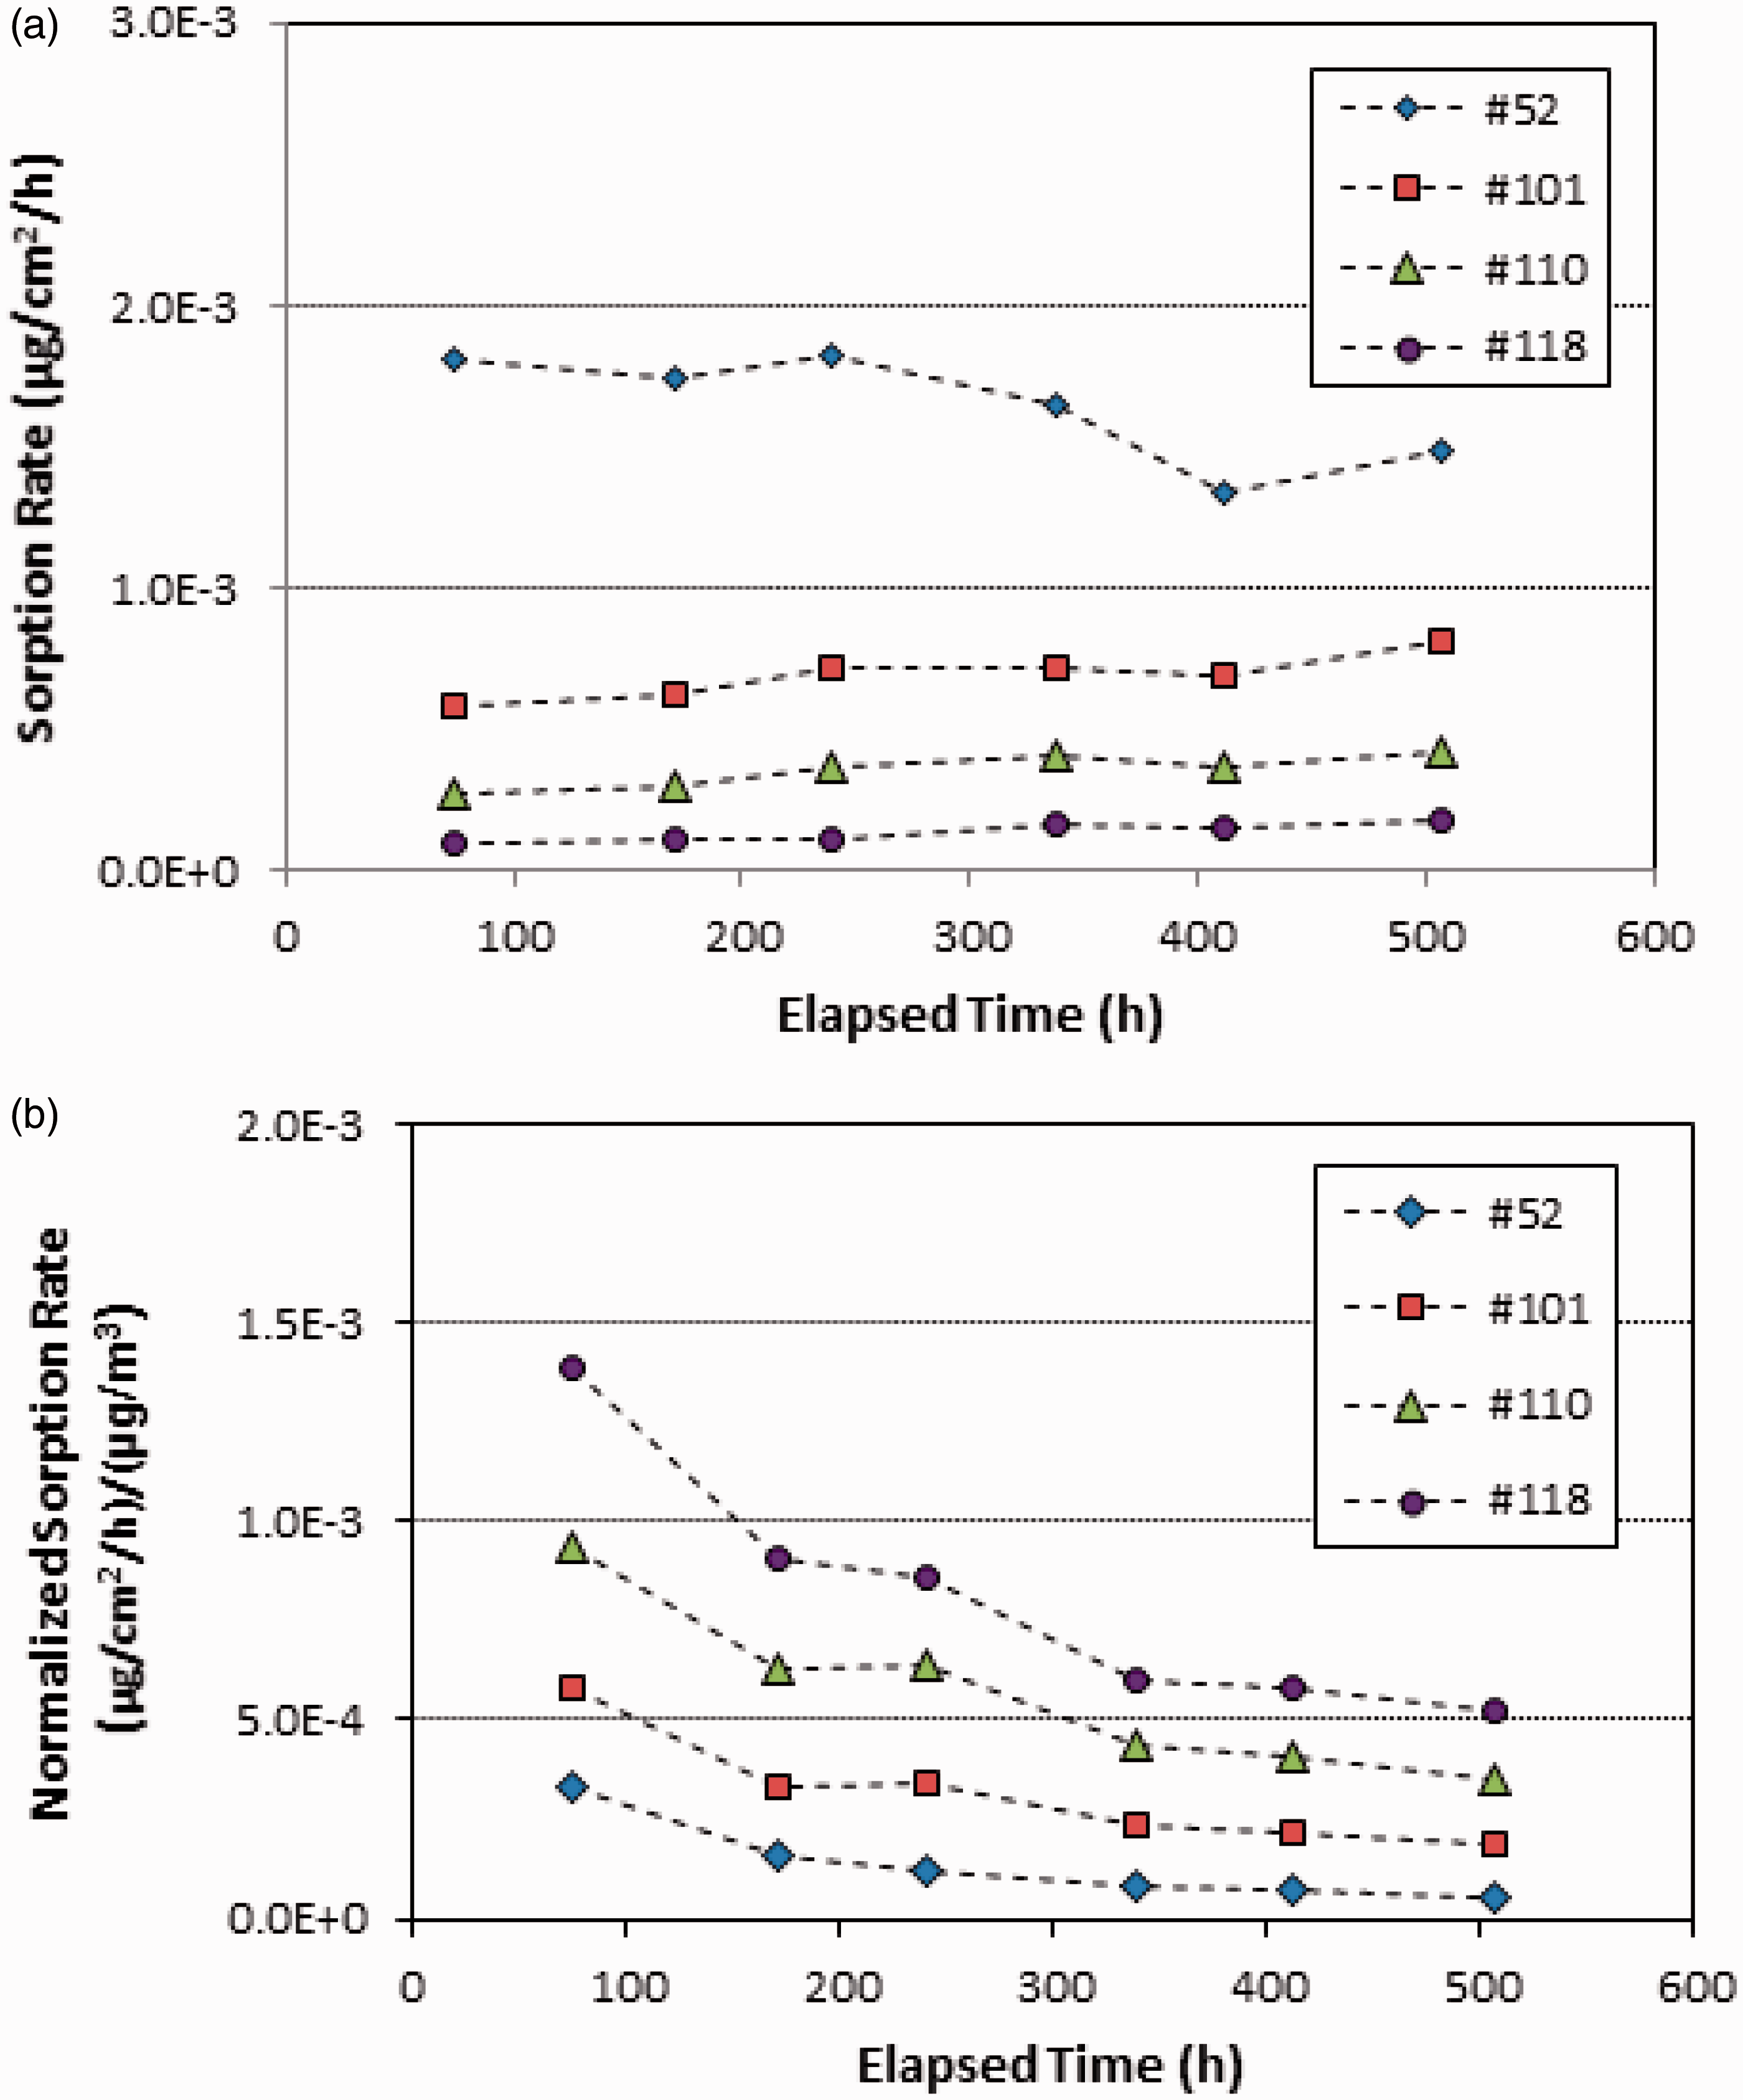
Re-emission of PCBs from interior surface materials
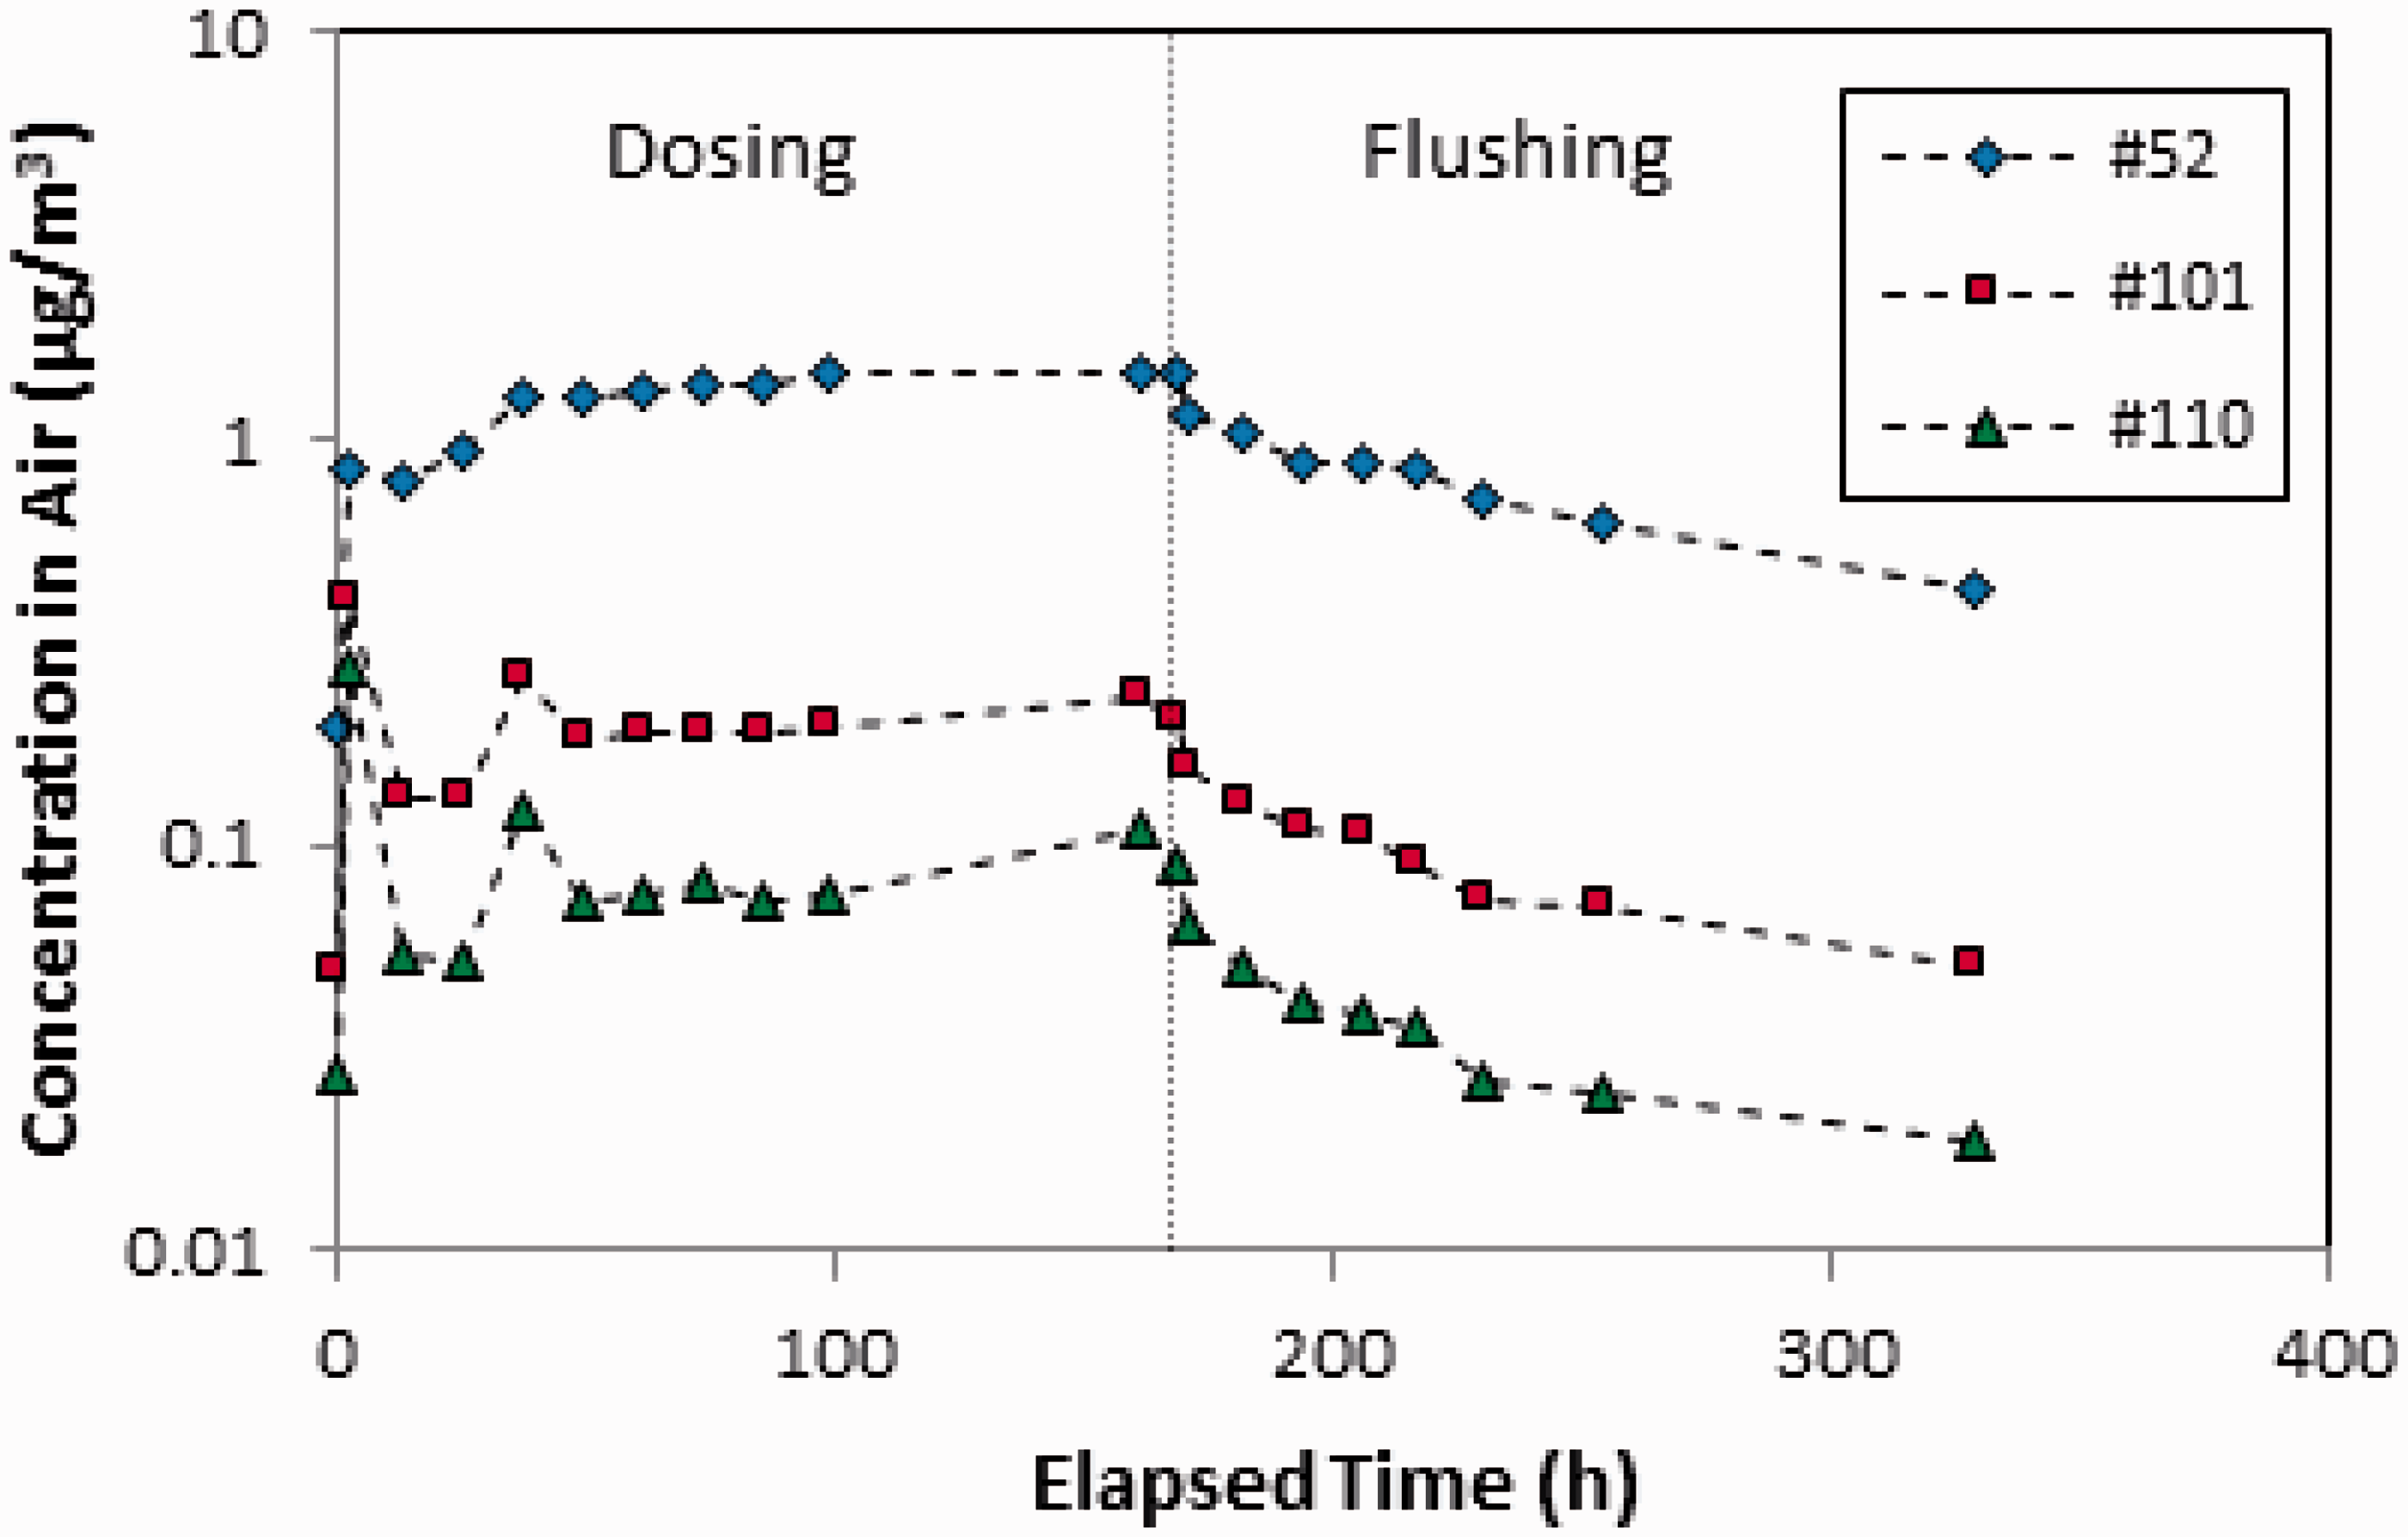
Test S-4 was designed to observe the re-emission of PCBs from concrete panels after the source was shut off after 167 elapsed hours. The concentration profiles of the outlet air for the three congeners with the most data above the practical quantification limit are shown in Figure 4. Prior to stopping the PCB source dosing to the test chamber, a set of concrete “buttons” was removed from the chamber to determine the sorption concentrations at the end of the dosing period. The amounts of congeners re-emitted from the concrete panels during the 160-h purging period were calculated by the mass balance equation of equation (14)
Air concentration profiles in Test S-4 for concrete panels.
Congeners re-emitted from concrete panels during the 160-h purging period.
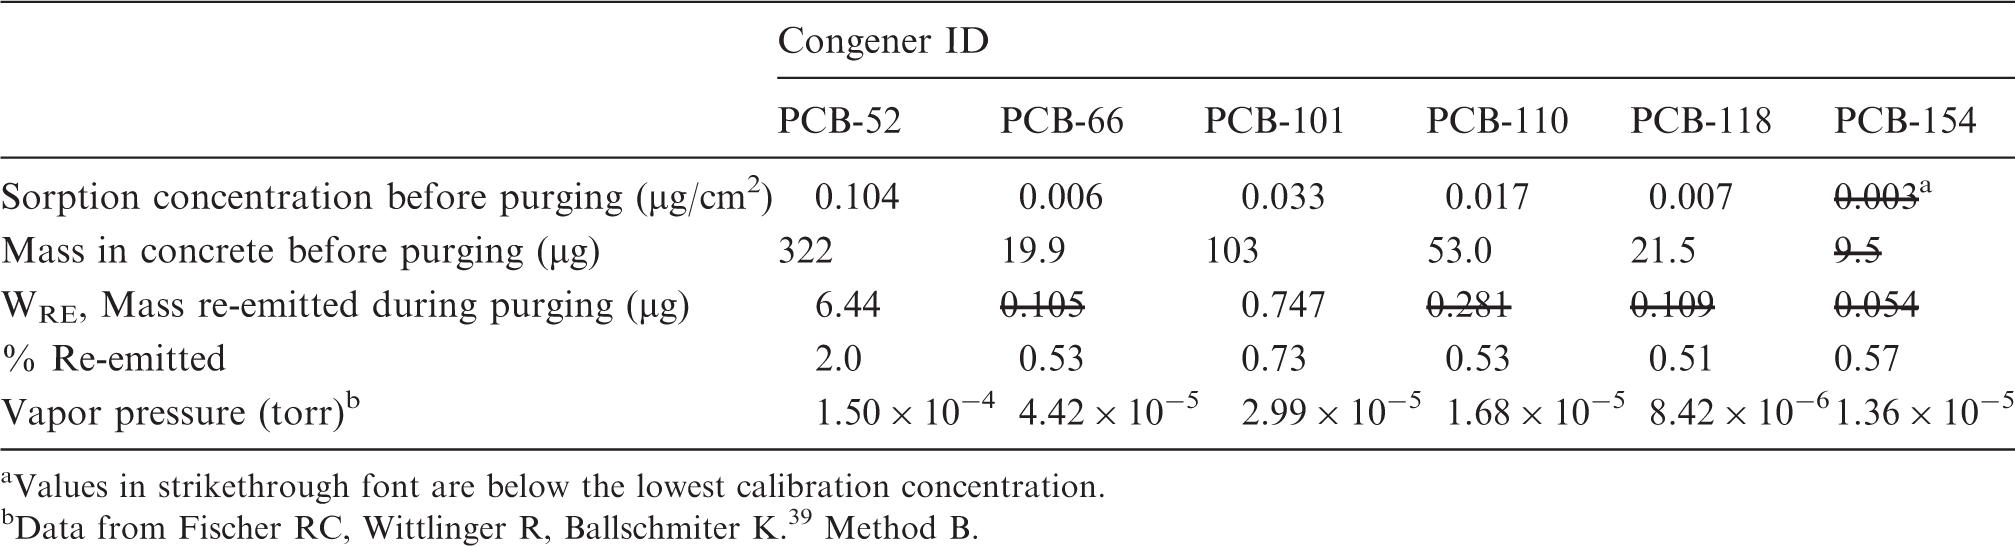
Values in strikethrough font are below the lowest calibration concentration.
Data from Fischer RC, Wittlinger R, Ballschmiter K.39 Method B.
Estimation of partition and diffusion coefficients

Rough estimates of partition and diffusion coefficients of PCB-52 for 20 materials based on data from Tests S-2 and S-3. a
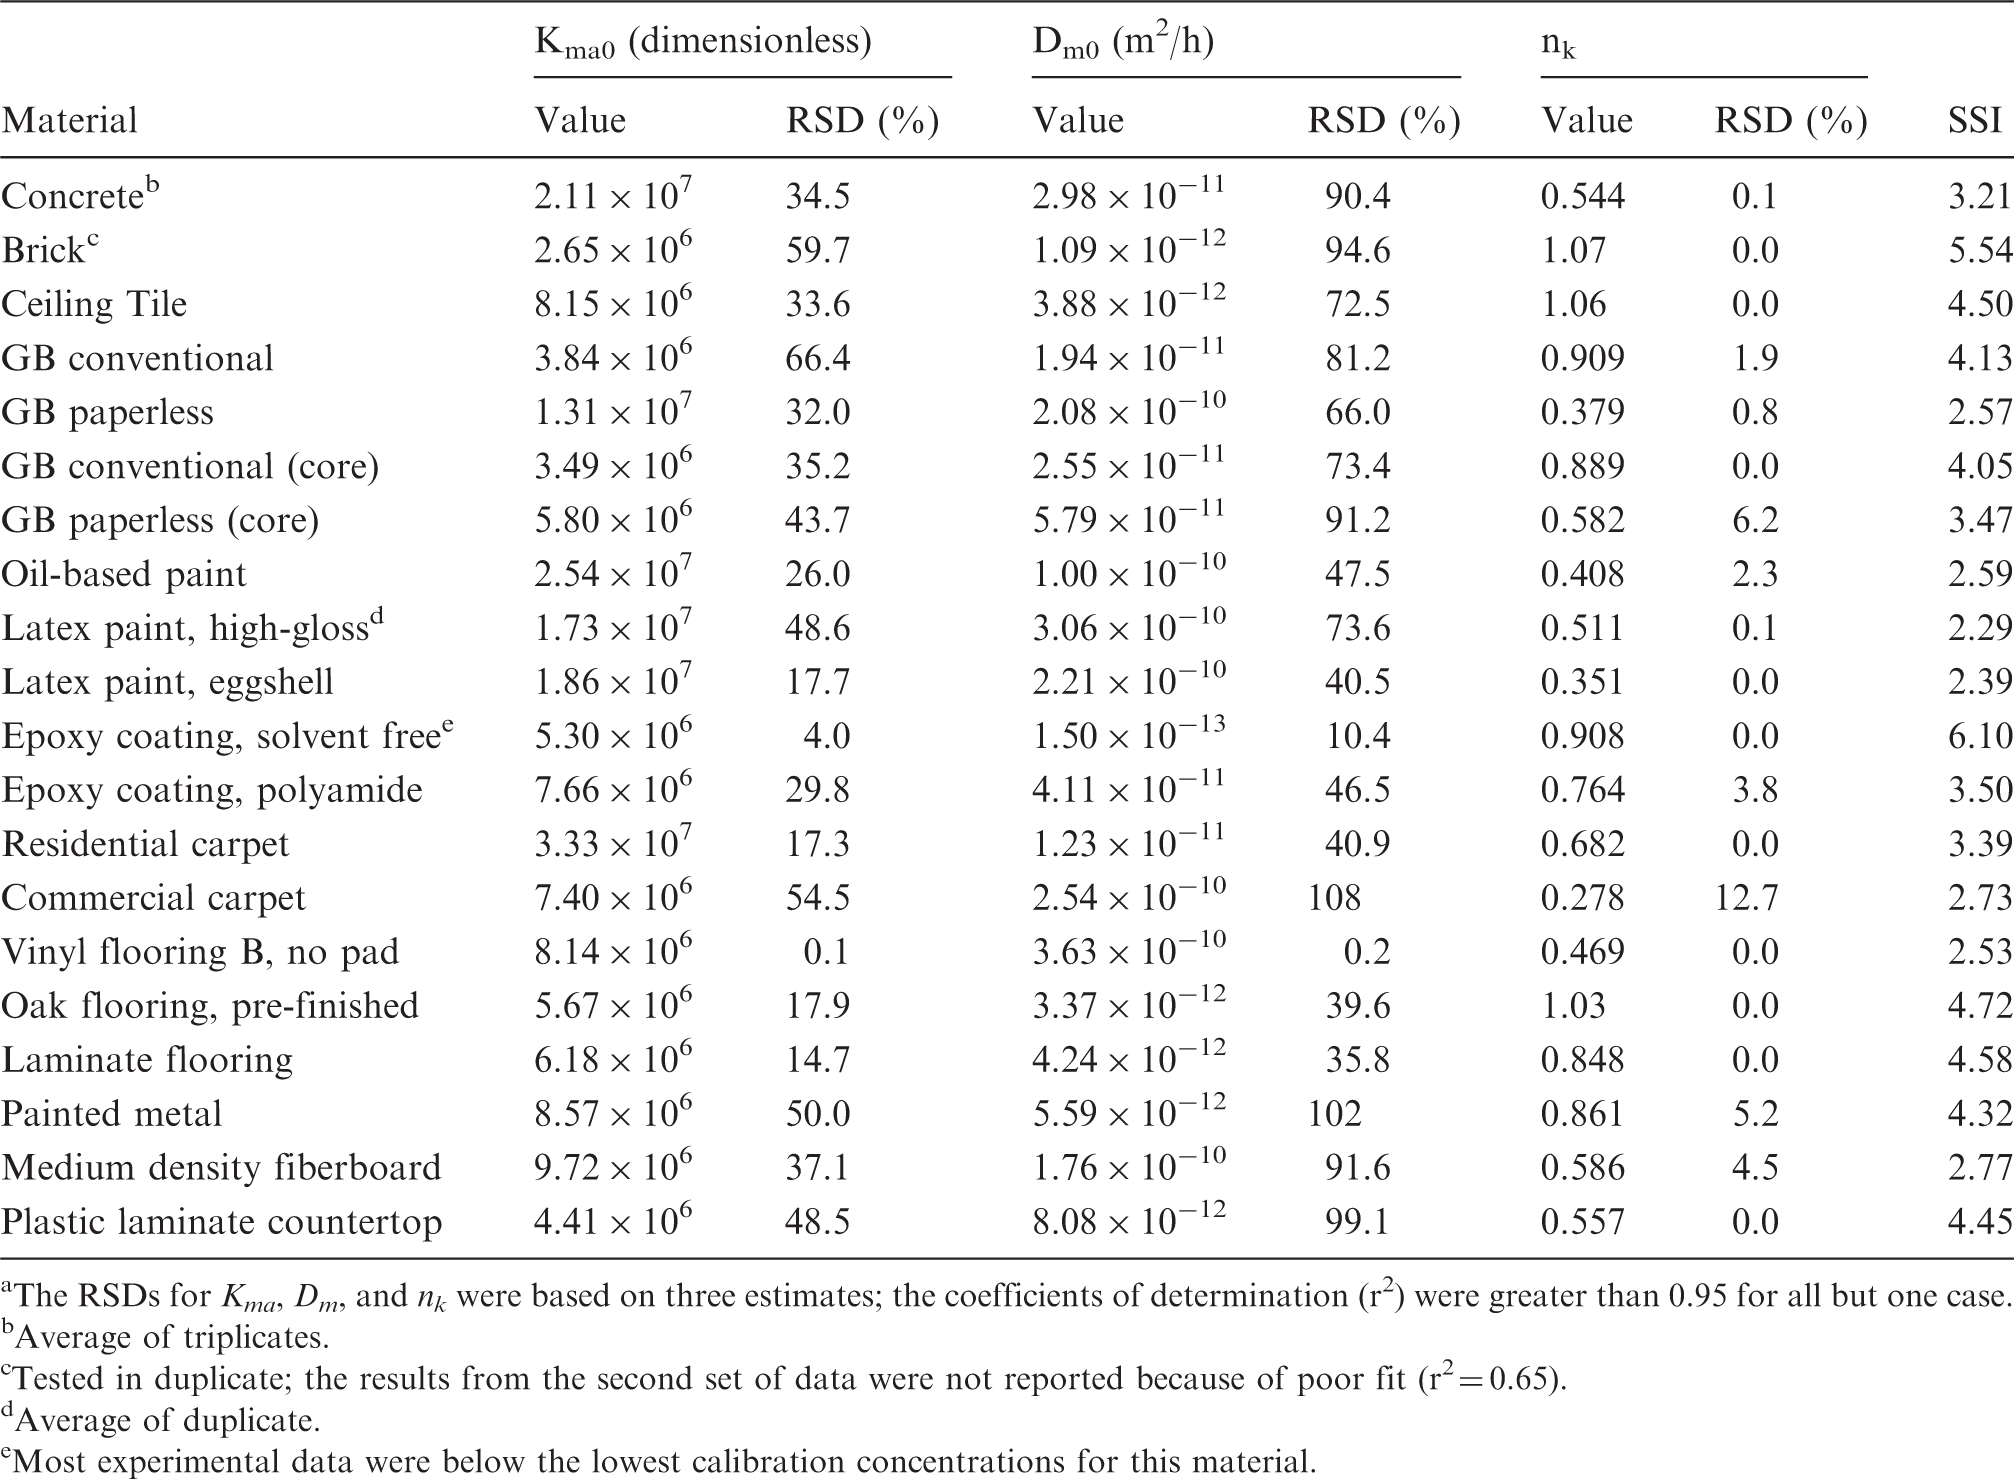
The RSDs for Kma, Dm, and nk were based on three estimates; the coefficients of determination (r2) were greater than 0.95 for all but one case.
Average of triplicates.
Tested in duplicate; the results from the second set of data were not reported because of poor fit (r2 = 0.65).
Average of duplicate.
Most experimental data were below the lowest calibration concentrations for this material.
Discussion
Significance of PCB sinks as secondary sources
The results of the sink tests demonstrate that the PCB flux between the air and the sink material can go in either direction (hence the term “reversible sink”). In the presence of a primary source, the sink material usually adsorbs PCBs from the air (i.e. negative emission rates). After the primary source is removed, the sink material becomes a re-emitting source. The PCB sinks can affect indoor environmental quality and exposure in several ways, including elevated air concentrations due to re-emissions, as a source for dermal exposure, and generation of PCB wastes. Although the PCB concentrations in the sink materials are much lower than in the primary sources, which is especially true for material/air partitioning, the exposed areas of the sink materials are often much larger than the primary sources. Such behaviour helps explain the results of some remediation efforts in the field where major primary PCB sources had been removed, but the PCB concentrations in the air remained higher than expected. 5 Thus, the effect of re-emissions from PCB sinks after removal of primary sources may not always be negligible. Therefore, control of potential re-emissions from sink materials after the primary sources are removed must be considered in the remediation plan. Understanding the behaviour of reversible sinks is also important to exposure assessment. It is not recommended to estimate the total source strength in a building by summing all potential sources. Primary sources and PCB sinks should be evaluated separately.
Ranking building materials as PCB sinks
Understanding the relationship between material type and sink strength is of practical importance because such knowledge may help environmental engineers to identify the most important PCB sinks in a building. In this study, the experimentally determined sorption concentrations showed significant differences from material to material (Figure 2). The authors cannot explain, however, why carpet A can adsorb three times more PCBs than carpet B and why the concrete can adsorb 25 times more PCBs than the brick. Cseh et al. 38 studied the adsorption and desorption of PCBs by polymers in aqueous solutions and found that soft polymers tend to adsorb more PCBs than hard polymers. Similar screening methods can be developed for studying material/air partitioning for PCBs. In addition, the determination of key properties of materials such as lipophilicity and porosity is equally important.
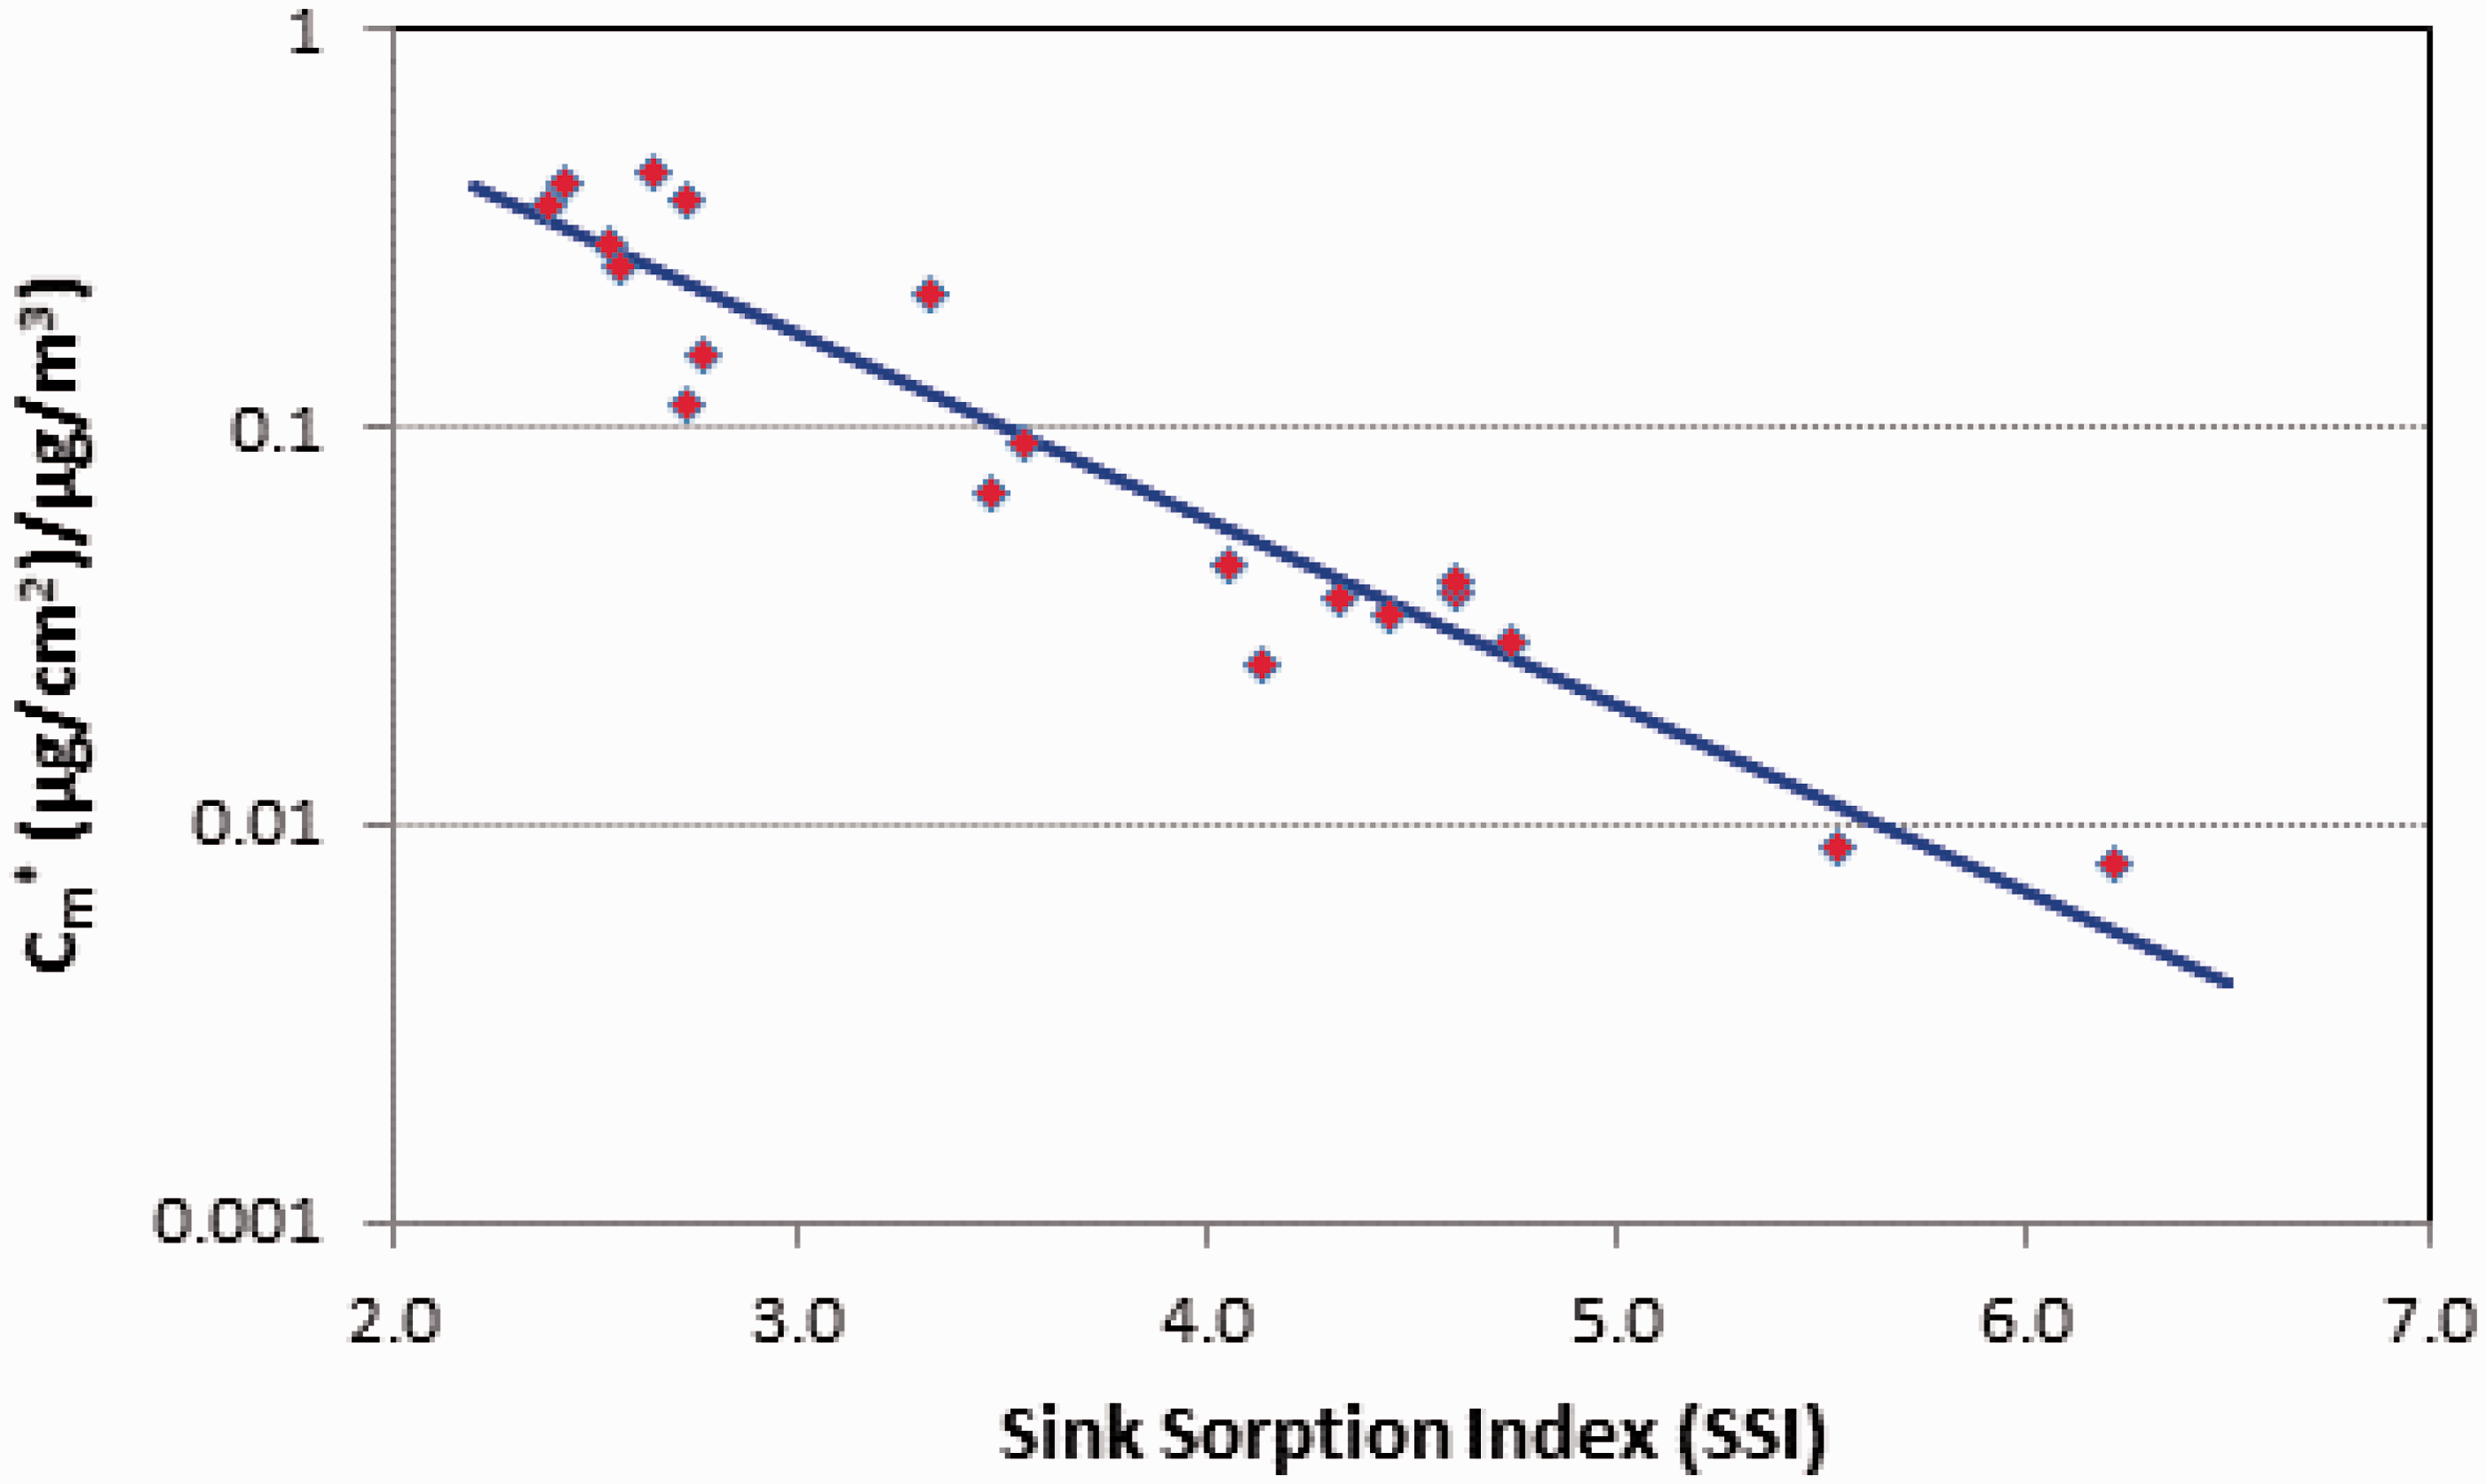
There are at least three ways building materials can be ranked for their PCB sink strengths: (1) using the experimentally determined normalized sorption concentrations (Cm*), (2) using the sorption capacity (Cm∞, i.e. pollutant concentration in the material in equilibrium with Ca, µg/m3), or (3) using the SSI. Although comparing the normalized sorption concentrations is straightforward, their values are a function of time, and the test method is difficult to standardize. The sorption capacity is determined by two parameters, i.e. the Ca of the congener and the Kma for the congener and the material. With the roughly estimated material/air partition coefficients presented in Table 4, the sorption capacity can be calculated from equation (16)
Correlation between SSI and experimentally determined normalized sorption concentrations (Cm*) for PCB-52 (t = 269 h for data from Test S-2 and t = 240 h for data from Test S-3).
Predicting PCB concentrations in air and the sink material
The sorption of PCB congeners by a sink material can be predicted by using the model derived by Crank
40
and by Little and Hodgson,
22
given as equation (17)
Predicted (a) DSS and (b) concentrations for PCB-118 and PCB-156 in concrete.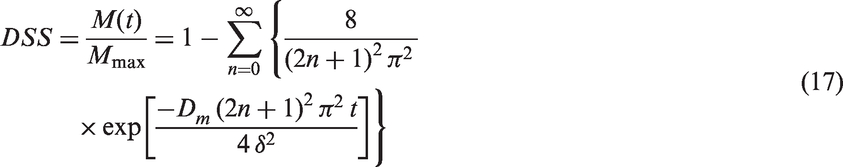
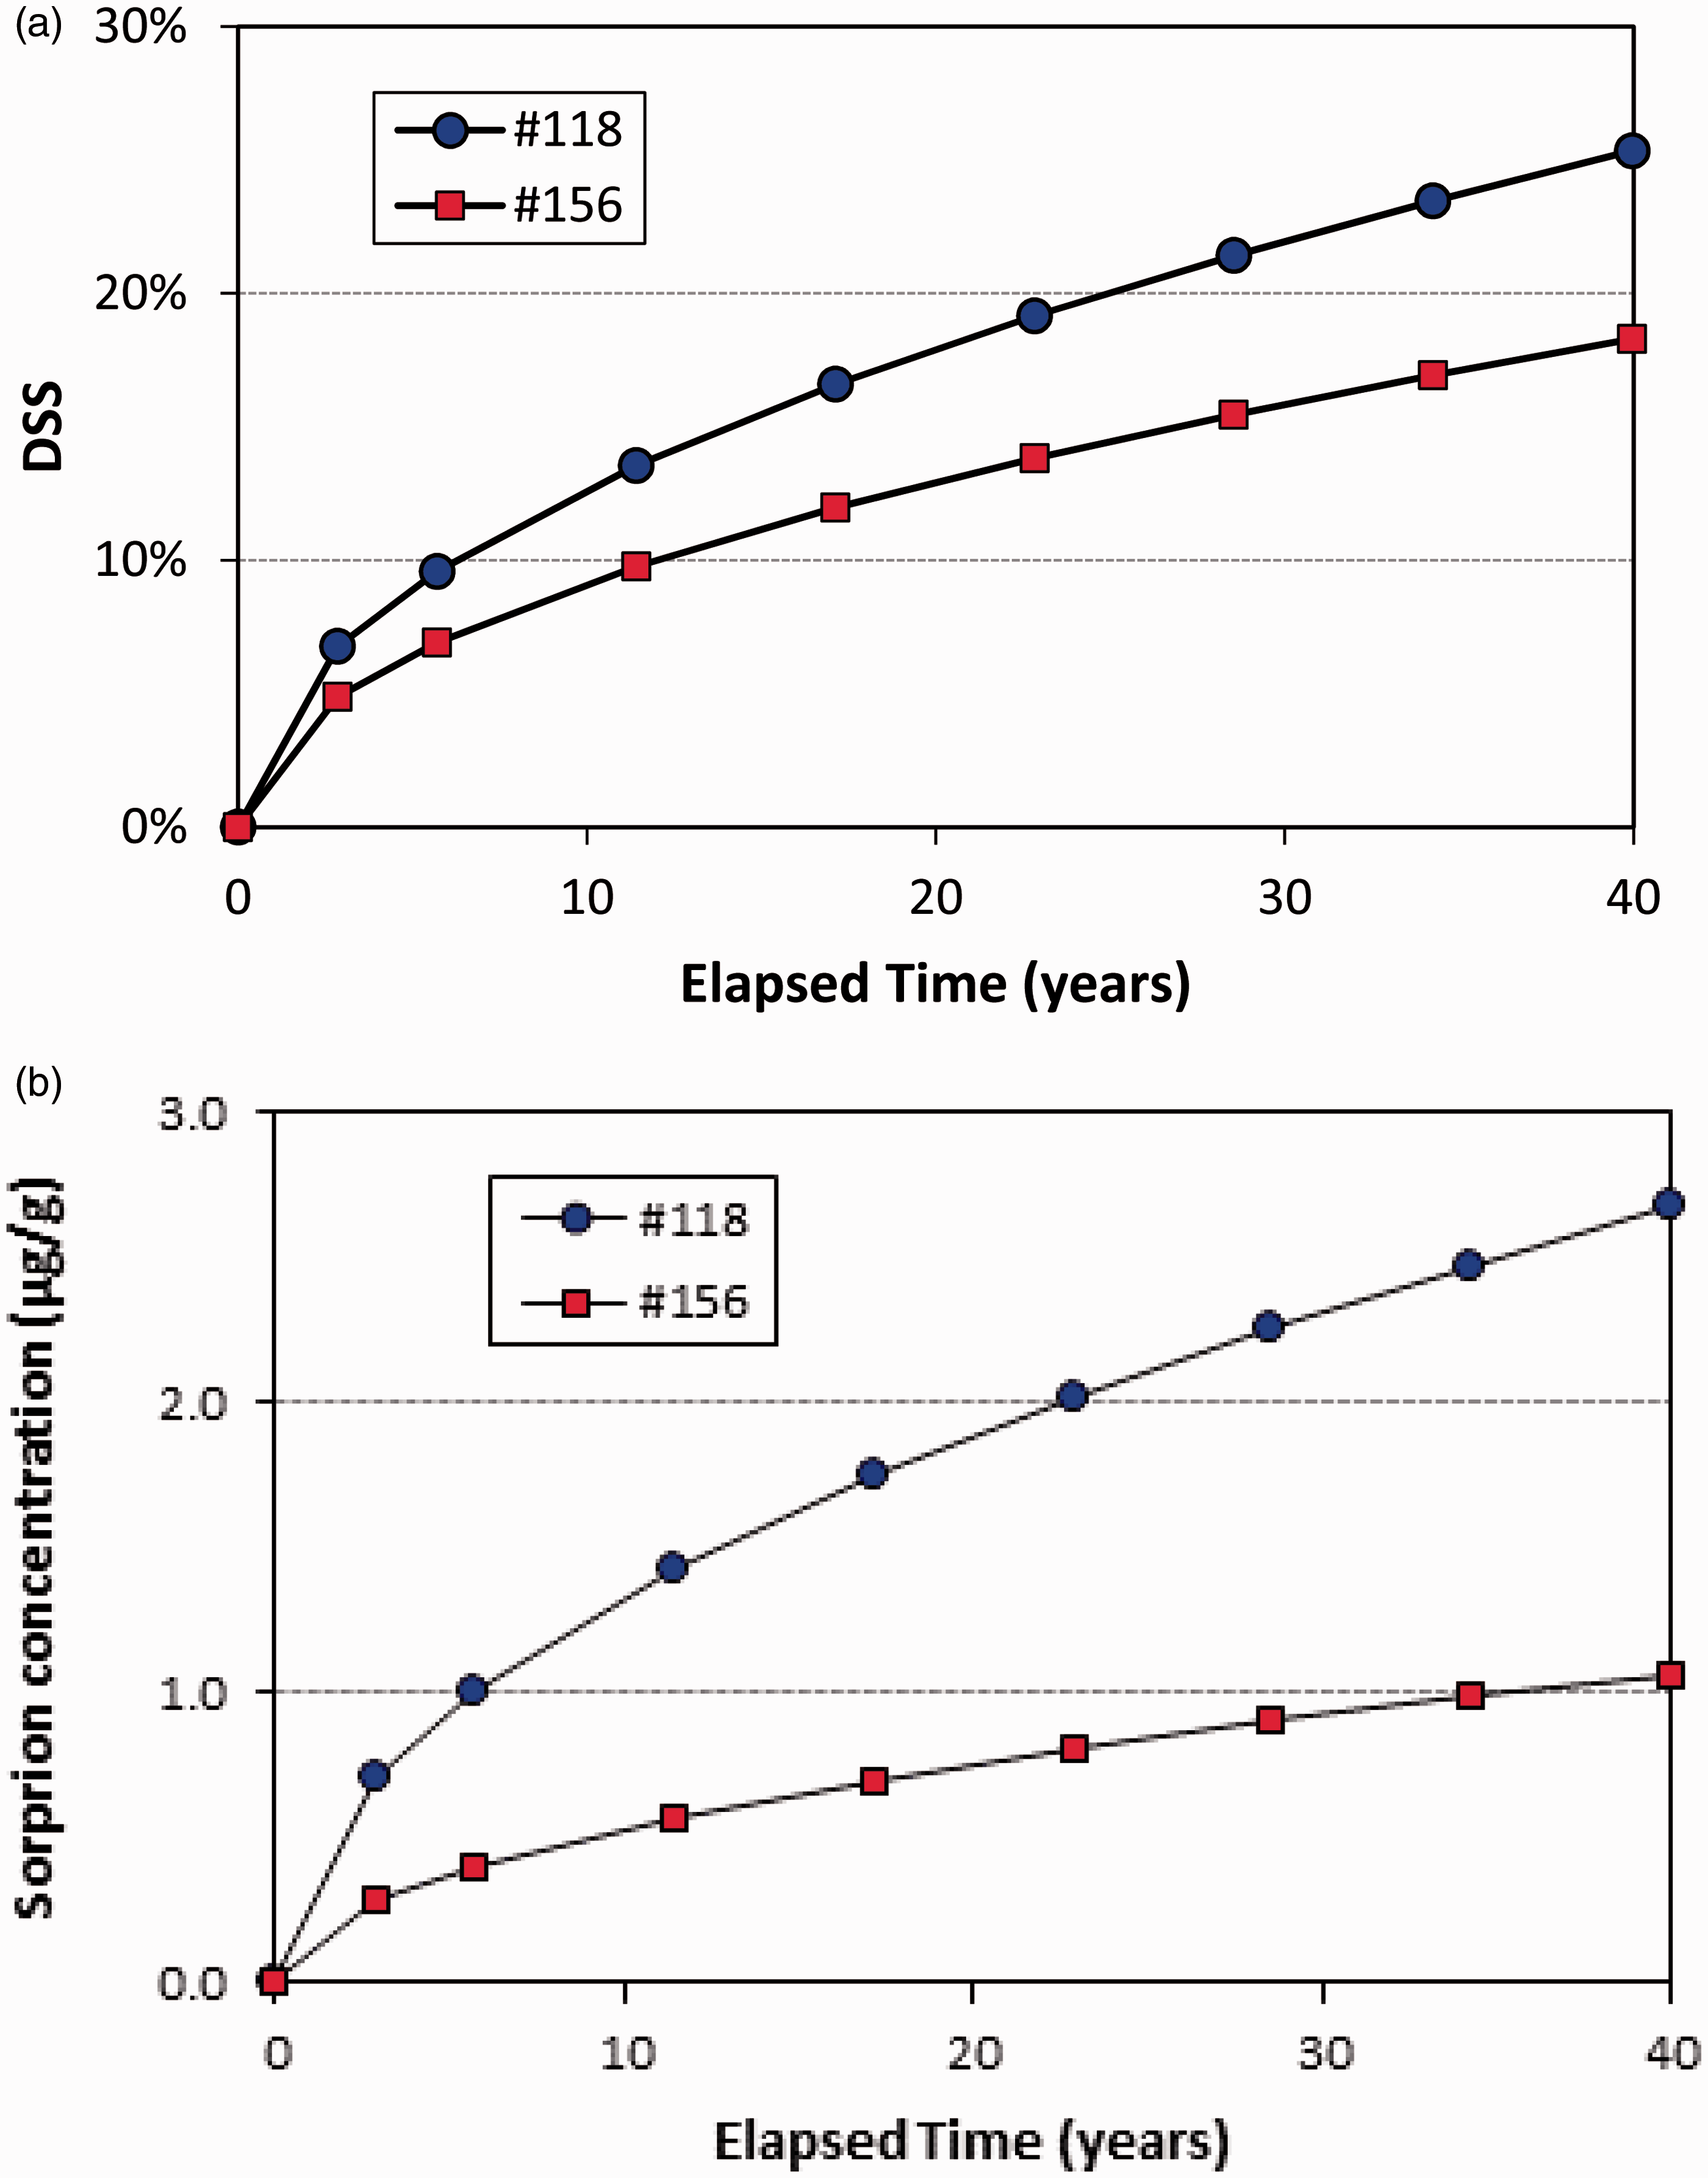
The predicted congener concentrations in the material are presented in Figure 6(b). In Figure 6(b), the results were converted to the mass unit (µg/g) assuming the density of concrete was 2 g/cm3. This DSS model does not predict the concentration profiles in the sink material as a function of depth. To predict the distribution of congeners in the sink material, dynamic sink models must be used.
There are two types of dynamic sink models, i.e. those based on Langmuir isotherms
21
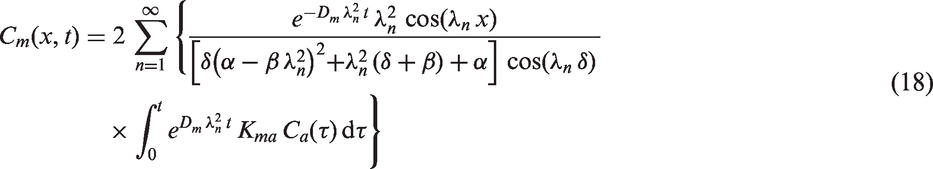
and those based on the material/air partition and solid-phase diffusion.22,41–43 The Langmuir sink models are suitable for simulating the short-term sink effect. They work better for nonporous and impenetrable materials such as metal sheets than for porous materials. In the diffusion-controlled models, the sink material is characterized by three parameters, i.e. Kma, Dm, and δ. These models require extensive computational effort, but they are more suitable for describing the long-term effect than the Langmuir models, especially for porous materials. In the demonstration below, the model (equations (18) to (21)) developed by Little and Hodgson
22
was used to predict the re-emission of PCB-52 in room air as a function of time from concrete walls in a room.


Input parameters for predicting the re-emission of PCB-52 from concrete walls after the primary source is removed after 40 years have elapsed.
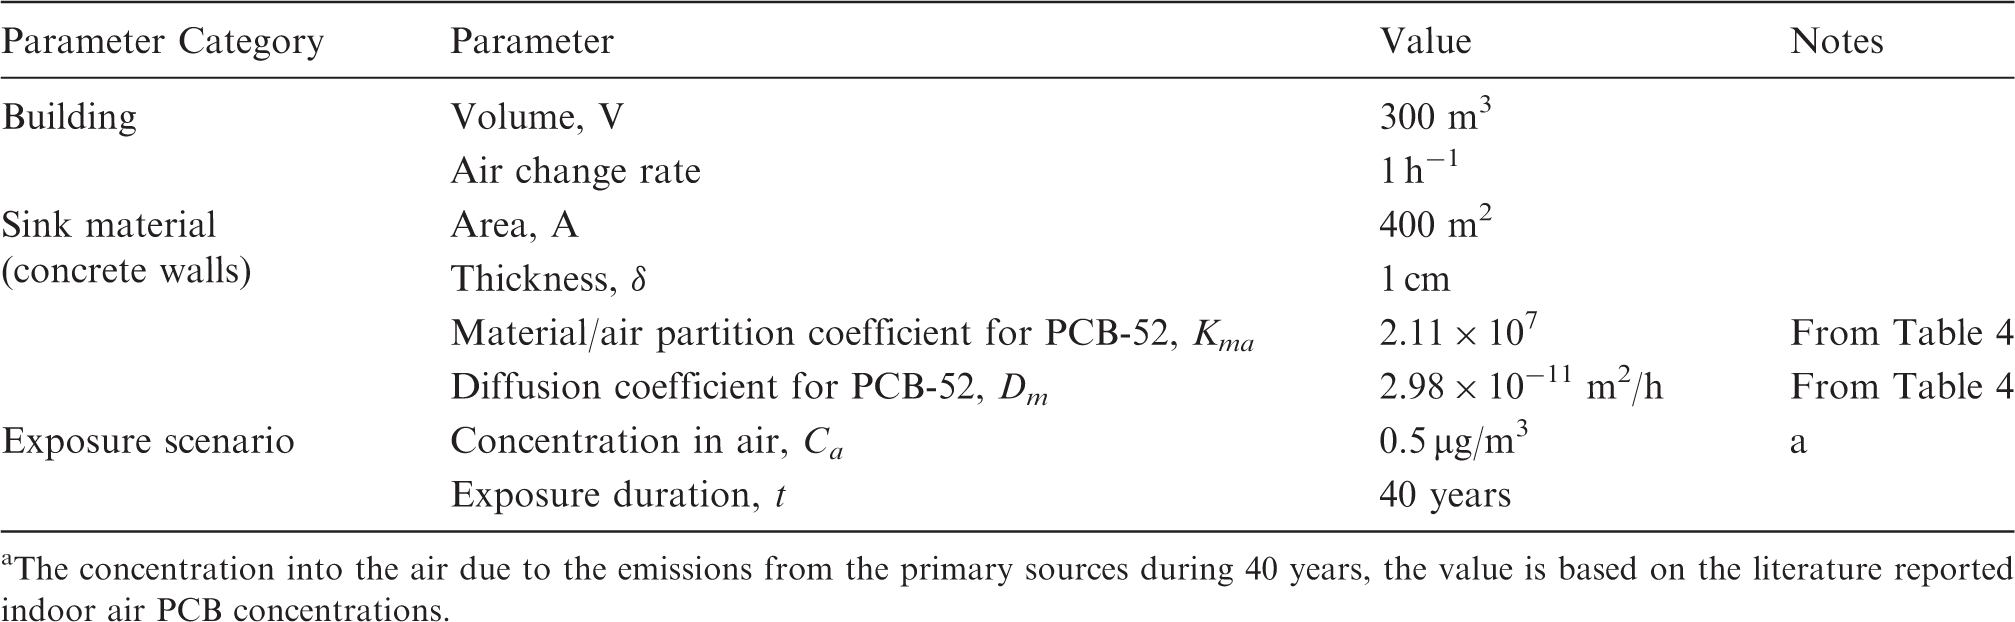
The concentration into the air due to the emissions from the primary sources during 40 years, the value is based on the literature reported indoor air PCB concentrations.
(a) Re-emission of PCB-52 from concrete walls after the primary source was removed after 40 years have elapsed. (b) Predicted distribution of PCB-52 in the 1-cm-thick layer of concrete.
The dynamic sink model above can also be used to predict the distribution of the PCB congeners in the sink material. The results can be used to determine the level of contamination as a function of the depth of the material. In the demonstration below, the parameters in Table 5 were used except the concentration in air was 0.1 µg/m3. The simulation results are presented in Figure 7(b).
Study limitations
In this study, methods, data, and tools are presented that should help decision makers, environmental engineers, researchers, and the general public to better understand the PCB sinks in PCB-contaminated buildings. However, since a single study cannot address all the important questions that must be answered, this study represents only the beginning of the effort to fill an important data gap in PCB sorption by sink materials and the re-emission of the PCBs from these materials.
This study, limited to only laboratory testing, complements and supplements a field study conducted by EPA. Because of time constraints, this study tested only a small number of sink materials. The number of tests conducted was also rather small. There are many types of building and furniture materials, and there are many brands and varieties of each type, all of which have different physical and chemical properties. Thus, care should be taken when applying the test results to seemingly similar materials in real-world situations. This study focused on the material/air partitioning mass transfer mechanism for PCB transport from indoor sources to sink materials. PCB transport via material/material partitioning between two adjacent building materials was not studied. The material/air partition coefficient and solid-phase diffusion coefficient are two key parameters for characterizing sink materials. The values presented in this study are rough estimates. New experimental methods are needed to determine these two parameters more accurately. More accurate estimation requires that the parameters be determined independently. The DSS model used to estimate these parameters is more suitable for porous materials than for nonporous and impenetrable materials such as uncoated metal sheets. Several mass-transfer-based sink models are available and can be used to better understand the behaviour of PCB sinks in contaminated buildings. The applicability of those models to multiple sink materials in a room should be evaluated. This study did not investigate the effects of temperature and relative humidity on the behaviour of PCB sinks.
Conclusions
The sorption and subsequent re-emission of PCBs from building materials were investigated. Twenty building materials were tested as PCB sinks. The experimentally determined sorption concentrations for 20 materials differed by as much as a factor of 50, indicating that the sink strengths vary significantly from material to material. Experimental observations confirmed that PCB sorption by the sink materials favoured the less-volatile congeners if the congener concentrations in the air were the same. The test results can help identify the most important PCB sinks (i.e. re-emitting sinks or secondary sources) in buildings. Both experimental results and mass transfer models show that, in the presence of a primary source, the sorption concentration increases over time, but the sorption rate decreases over time. PCB sorption on sink materials is a reversible process. Therefore, an indoor air quality remediation plan must consider the potential effect of PCB sinks as secondary sources.
The material/air partition coefficient and solid-phase diffusion coefficient are two key parameters that can be used to describe the properties of PCB sinks. The roughly estimated material/air partition coefficient for PCB-52 (i.e. the reference congener) ranged from 2.65 × 10⁶ to 3.33 × 10⁷ (dimensionless) and diffusion coefficients ranged from 7.08 × 10⁻¹⁴ to 3.63 × 10⁻¹⁰ (m2/h). The partition and diffusion coefficients for other congeners can be calculated by using equations (12) and (13) and data in Table 4. When both the partition and diffusion coefficients are known for a given material, its sink strength can be described by its sink sorption index, which can be used to rank sink materials. The results described are based on laboratory testing only.
Footnotes
Acknowledgments
The authors thank Drs John Little and Zhe Liu of Virginia Polytechnic Institute and State University for providing the MATLAB code for a sorption model; Jacqueline McQueen of EPA’s Office of Science Policy for assistance in communications and technical consultation; Russell Logan and Corey Mocka of Arcadis, US Inc for laboratory support; and Robert Wright of EPA’s National Risk Management Research Laboratory and Joan Bursey of EPA’s National Homeland Security Research Center for QA support.
Declaration of Conflicting Interests
The author(s) declared the following potential conflicts of interest with respect to the research, authorship, and/or publication of this article: This manuscript does not represent and should not be construed to represent any U.S. Environmental Protection Agency policy. Mention of trade names or commercial products does not constitute endorsement or recommendation for use.
Funding
The author(s) received no financial support for the research, authorship, and/or publication of this article.