
Abstract
Cold homes contribute to 20,000 to 40,000 excess winter deaths each year in the UK and approximately 300,000 hospital admissions. Using fuel poverty as an identifier for those at risk does not always capture everyday exposure to cold homes due to variations in financial trade-offs and behavioural factors. Few fuel poverty studies have combined environmental measurements with qualitative data on lived experiences of fuel poverty and cold homes. This paper looks at strengths and limitations of using a mixed method, environmental and qualitative interviewing approach. A series of six discreet studies were conducted between 2001 and 2015 using a similar methodology with a mixed methods design, where in-depth interviews were conducted alongside temperature and humidity measurements. The research studies found that combining environmental monitoring with qualitative research methods allows both cross-validation and triangulation of data in order to provide a richer and more insightful examination into the lives of people living in cold homes. The studies demonstrate how a combined methodological approach can help explain the choices, decisions and behaviour of households experiencing cold homes and fuel poverty. The paper concludes with recommendations for future development and implementation of the research method.
Keywords
Introduction
Every year in the England and Wales, there are 20,000 to 40,000 excess winter deaths, and for every death there are an estimated eight excess hospital admissions. 1 The cost of fuel poverty to the NHS alone is estimated to be over £850 million, these costs would be more if costs to social services and employment were also considered. 2 Whilst there is an assumption that these deaths and hospital admissions are the result of cold weather, identifying causal pathways and who is most at risk is not at all clear. Although the majority of these deaths can be attributed to cold, it is not known exactly if these are caused by exposure to cold indoors, outdoors or a combination of both. 3 However, it is estimated that between 10% and 25% of excess winter deaths are attributable to cold homes and fuel poverty. 4 Identifying people experiencing fuel poverty is a widely accepted method of identifying people most vulnerable to cold-related harm. 5
The official definition of fuel poverty in the UK has changed from the cost of maintaining a living room at 21°C for most of the day being 10% or more of the household income 6 to the newer low Hills-income high-cost (LIHC) definition. 7 The LIHCs definition considers the three factors of household income, household energy requirements and fuel prices. Under this definition, a household is considered to be fuel poor if they have fuel costs above the national median level, and if they were to pay for these required costs they would be left with an income that would leave them below the official poverty line. 8
There are benefits to the LIHC Hill's method because it takes into account more details of the dwelling such as the size of the house, but many find the formula too complex to apply in practice. The change in definition has been widely criticised by academics, practitioners and policy makers and has also changed the demographics of those included in national statistics of fuel poverty, including more family households but fewer older people. 9 Identifying income levels of households is also complex. Even if participants of studies do not mind having their finances intimately probed, participants may not actually have all the details at hand or be sure of their total income. Often income proxies, such as being on a certain state benefit is used to judge the risk of fuel poverty. However, household income alone does not help predict who is or isn’t prioritising spending on fuel and sacrificing other essentials. Meeting the definition of fuel poverty does not necessarily mean these households will be cold, whilst those who fall outside the definition may be struggling to pay fuel bills or have a cold home for other reasons. 10 Although households on low incomes or certain qualifying benefits may be entitled to affordable warmth interventions, concerns have been raised that they are poorly targeted 11 and those at most risk and most vulnerable to the adverse effects of the cold struggle to access such interventions. 12
In terms of health effects of cold, health and social care services need to know who is actually cold at home for any reason, not if people can theoretically afford to heat their homes or not.13,14 Several studies have shown that income is only one factor influencing heating behaviours and that those most at risk may not be heating their homes due to thrift, inability to work heating systems, etc. 15 – 18 However, it could be that knowing who is cold, according to the recommended room temperatures at home, 19 is still not sufficient for us to identify all of those whose health is at risk. 20 People with different health conditions, ages and body types react to cold differently. A fit, active 80-year old, for example, may safely tolerate a room several degrees cooler than a frail, immobile individual of the same age. 21 In terms of health conditions, a child with sickle cell disease may become hospitalised with severe complications of a sickle cell crisis at temperatures above the safe recommended temperatures. 22 Whilst awareness of the health impacts of cold exposure has been building up over the past few decades and annual excess winter deaths statistics are published and the Department of Health Cold Weather Plan, 13 there are huge gaps in knowledge regarding who exactly is most at risk of cold at home and why and how we identify them.
A recent evidence review on healthy room temperatures concluded that 18°C was still the evidence-based recommended safe temperature for homes. The review acknowledged that there was a lack of literature to draw from in relation to individual health conditions. 19 Additionally, the evidence review for the National Institute for Health and Care Excellence (NICE) focused on a small group of health conditions acknowledging their limited capacity to review every possible condition because they were far too numerous. NICE indicated a larger study could have included more conditions and studies. 23 In the light of the challenges and limitations of existing evidence and in the methods used for finding the fuel poor and those most vulnerable to a cold home, it is important to adopt an innovative approach in research and to strive for finding solutions to overcome methodological obstacles.
Quantitative methods such as measuring temperatures in homes have the advantage of being able to capture a large number of dwellings and examine fluctuations in temperatures in different rooms. Such data could then be matched to health data, for example, on hospital admissions and health conditions. Other data that could be added include the size, condition and tenure of the property and an energy efficiency measure. However, measuring environmental factors alone cannot reveal the complexities of heating behaviours or indicate whether thermal stress is experienced. Qualitative studies have this capacity and can provide deeper insights into people’s behaviours, intentions and practices. Increasing the use of qualitative methods is essential to advancing the field of energy studies as these methods are under-used in this field. 24
This paper aims to look at how qualitative methods can gain additional strength and value in combination with quantitative methods to yield data that can be used to provide a deeper analysis of how people are interacting with and reacting to their home environment. Whilst the specific method of using data loggers (DLs) with qualitative interviewing is under-used in fuel poverty research, it fits with more general methodological approaches such as those described as mixed methods, triangulation of methods and cross-validation. 25 – 27 The advantages of triangulation of methods have been applied in several studies and the method has developed to combine different methodologies and fields of research.28,29
Details of the six studies using environmental monitoring and qualitative interviewing.

The Warm Front scheme (project 1 above) was targeted at low-income households in England and provided grants for the improvement of home insulation and heating in the owner occupier and private rented sector. At the time of the evaluation, householders could apply for grants of up to £2,500 depending on eligibility. The scheme ran from 2000 to 2013 and full details of its eligibility at the time of the evaluation can be found in Gilbertson et al. 40 Households assisted in 2002 around the time the study took place received, on average, a grant of £445. 41
There was a common method throughout the studies whereby DLs recorded room temperature and relative humidity (RH) over regular intervals for a period of up to two weeks. An in-depth interview was conducted, usually at the end of the temperature and humidity measurement period to understand the heating behaviours and challenges over the monitoring period. An example of the process is provided in Figure 1, taken from the Warm Well Families project
33
(project 3 above). The DL device used in this study was a Gemini Tiny Tag2.
The research process for the Warm Well Families project (project 3).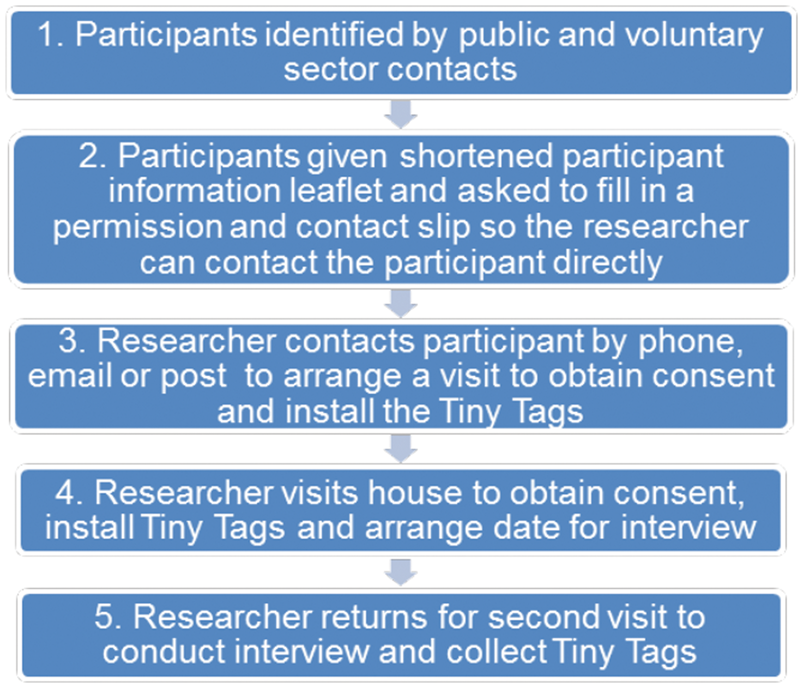
This current paper aims to provide insights into the usefulness and drawbacks of this methodology, and to make suggestions on how this method could be refined for future applications. This article also addresses the practicalities of using DLs in vulnerable households and how to minimise any disruption or concerns experienced by research participants. The latter aim is intended to help anyone planning to use these methods in their research and focuses particularly on the practicalities of using the method. Sharing information about the process, advantages and disadvantages of this method are essential in the highly multi-disciplinary field of fuel poverty research. The field of fuel poverty research may attract people from various disciplines such as engineering, environment, poverty studies, psychology, housing, public health, economics and so on. Therefore, it may be useful to provide more information on the uses and practicalities of doing multi-disciplinary, mixed methods research.
Method
A step-by-step process was adopted to combine relevant information from the six studies. The following were considered. First, the challenges and limitations of using the DLs and the adaptations made in response to challenges encountered in the field. Second, the different experiences and outputs from the analysis and dissemination of the six studies were compared and reviewed. All of the authors of this paper were involved in the conduct of one or more of the studies as well as in the discussions about the methods and learning that took place during the research. Using the discussions, field notes, reports and publications, the first author of this paper collated the information to create some initial themes. This initial analysis was shared with the other authors for discussion and development.
The use of DLs was broadly similar across the studies but the qualitative methods varied and included in-depth interviewing, case studies, questionnaires and diaries kept by participants. The studies were conducted between 2001 and 2015 and focused on a variety of health conditions known to be vulnerable to cold. Some took a population approach, where a large number of participants are included in a study, such as the Warm Front study, to identify differences between people with greater and lesser vulnerabilities to cold. The study sizes also varied. A doctoral study of dementia and cold homes used a case study methodology where DLs provided data for triangulation of methods for six case studies. In comparison, a large-scale evaluation of the health benefits of the Warm Front scheme included DLs placed in 1604 households, alongside interviews and participant diaries. In the Warm Front study, interviews were conducted after the Warm Front intervention and monitoring period. Participants were asked to recount a typical day in their home in winter before they had the Warm Front improvements and then invited later in the interview to discuss what a typical day in winter was like now (i.e. after the Warm Front improvements) to see what had changed in terms of warmth, comfort, daily routines, heating regimes, behaviour, cost, etc. More details of the interventions offered as part of the Warm Front programme are available in the study by Gilbertson et al.
40
This government scheme provided improvements to home heating such as insulation, energy advice and heating repairs to eligible clients between 2000 and 2013. In Figure 2, there is an example of a graph of room temperature and RH produced from the DL software.
Example of a graph of temperature and relative humidity produced by two weeks of DL recording (Warm Well Families study)
33
. Outdoor temperatures for the same time period were obtained from the Met Office.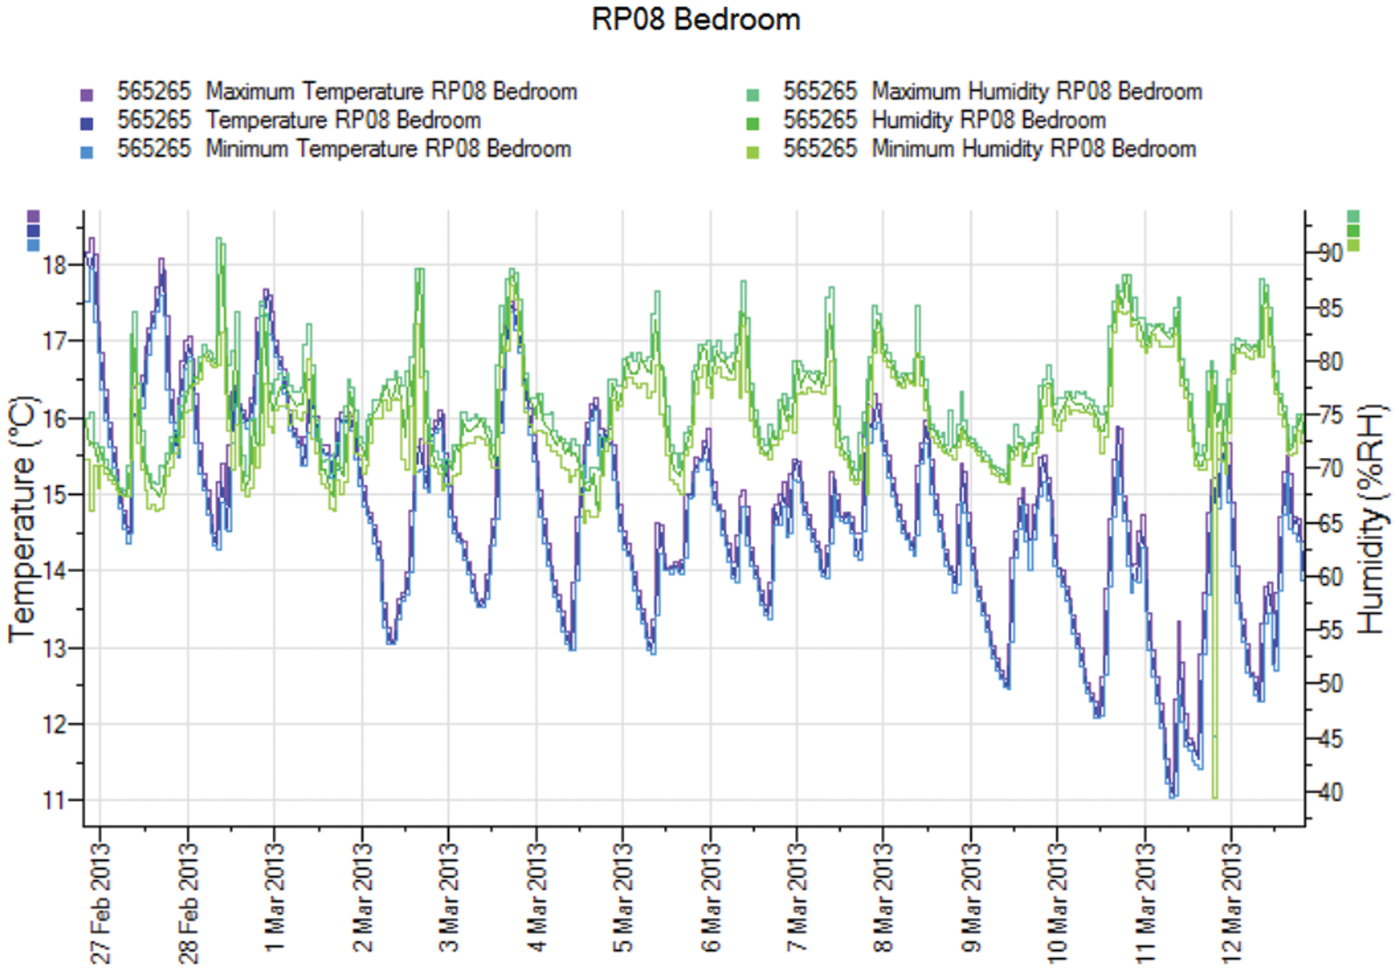
Results
Summary of themes and sub-themes emerging from the six studies.
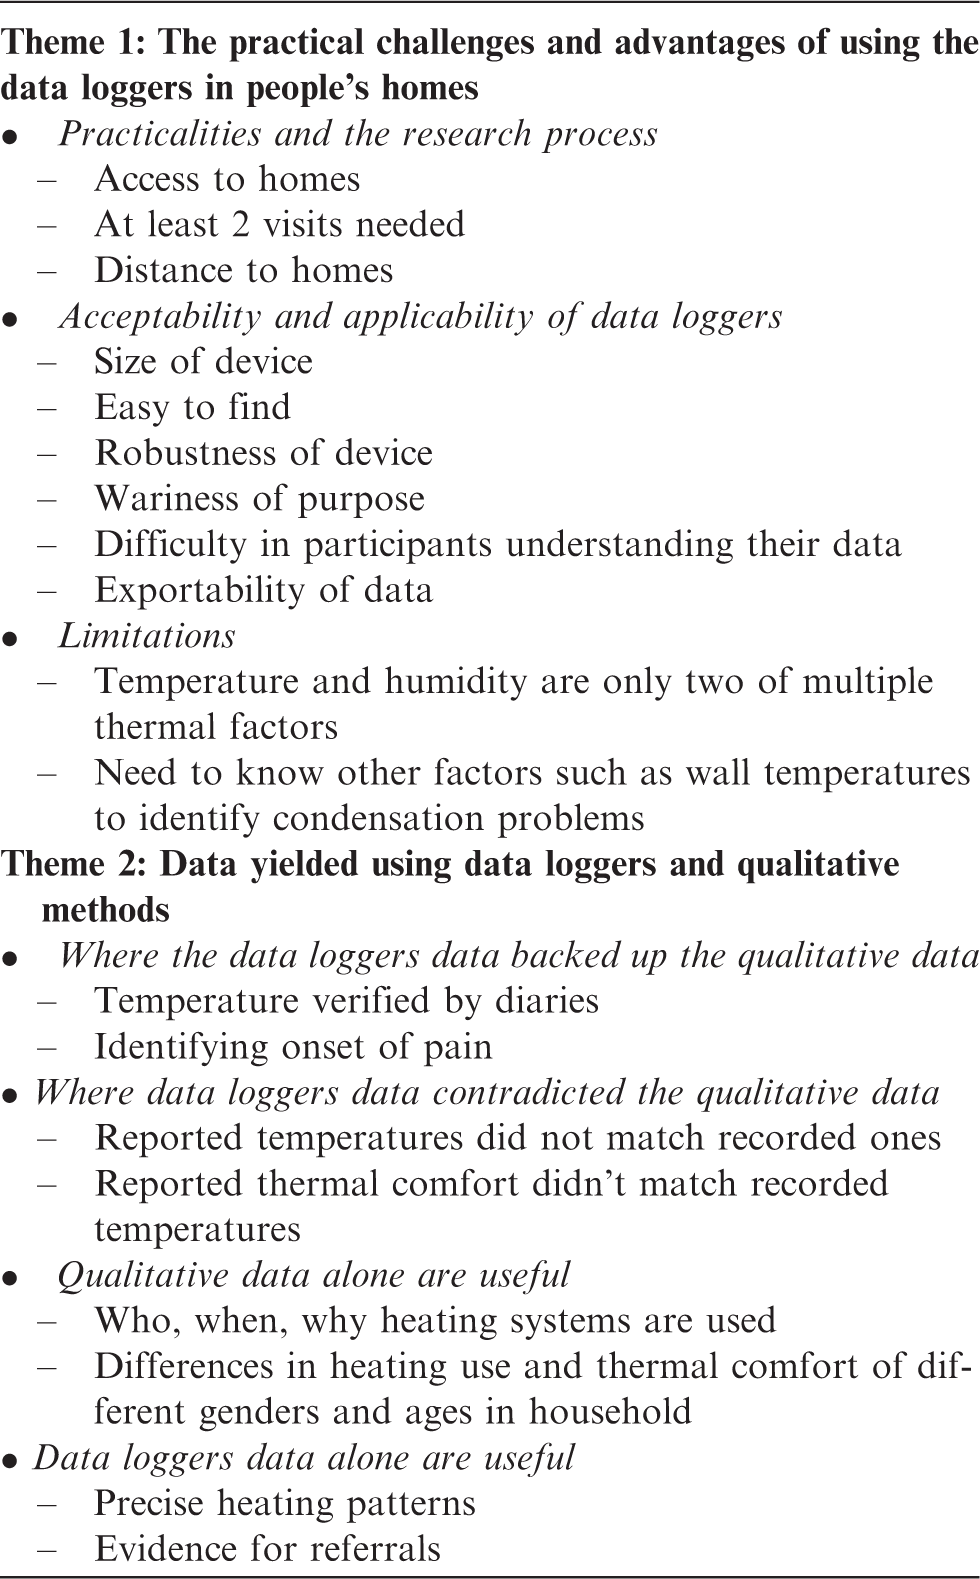
Theme 1: The practical challenges and advantages of using the DLs in people's homes: Practicalities and the research process
Getting the DLs into people’s houses and getting them back again was a frequent challenge across the studies. The method required accessing the households twice, first to gain consent and drop off the DLs and then to pick them up and conduct the main interview. In the Keeping Warm with Sickle Cell disease (study 6), some participants lived too far away to make two visits within the constraints of the project timing and budget. Participants preferred a telephone interview or an interview in a different location and it was not always possible to interview people in their own homes. Including two visits in research runs the risk of attrition if the participant agrees to the first visit but is unable to commit to the second. 29 Whilst the research teams could choose to partially or fully exclude such participants, it still left the problem of getting the DLs back or of finding the funds to replace them. In these studies, all the DLs were collected and the participants agreed to be interviewed.
The timing of the main interview and whether it is best to conduct the main interview on the first or second visit can also produce challenges. Ideally the in-depth interview is best conducted at the second visit so the researcher can ask detailed questions about the heating behaviours in the specific time period that had just been measured with the DLs. Also, conducting the interview before recording the environmental data may induce a “Hawthorne effect” 42 whereby the content of the interview and raised awareness of being monitored could change participants heating behaviour. 43 To avoid this, the ideal time to conduct an in-depth interview was after the monitoring period. However, in practice, explaining a study to a number of participants naturally encourages people to want to talk about the study topic, even if the plan is to record the answers in the second visit. Additionally, there is a possibility that the participant may need to drop out from the study before the second visit, for example, due to ill health. There are ways around the above challenges. If the first contact is when people are most likely to find triggers to talk about their experiences, then the in-depth interview can be planned for that visit. Heating use over the recording period can then be discussed in the second visit for insight into the DL data, but the potential for the interview to impact on the heating behaviour during the monitoring period must be taken into account. As the devices are small, portable and installation instructions, i.e. one in the living room and one in the participant’s bedroom, it is possible to give the device to the participant to take to their own homes to install themselves, with the appropriate instructions regarding avoiding proximity to radiators and windows. In theory, it should be possible to post the DLs to participants if the research team is prepared to accept the risk of losing the device in the post or it not being returned. Being present whilst giving the DLs to participants to place in their rooms did not guarantee that they would stay installed correctly. In the sickle cell study, one participant decided to move a DL around the house to see what the different temperatures were but when interviewed couldn’t remember where she put it. This limited the use of the data. Young children may spend part of the night in their own room and part with their parents, and even adults can sleep in different rooms on different days. 44 For example, in the condensation study (study 5), one couple’s main bedroom had severe mould making it hard for the participants to sleep in that room. On some days, when the daughter was staying with her biological father, the couple would sleep in the daughter’s room to escape the mould. These kind of details can be discussed when deciding where to place DLs, and the second visit can explore more about place of sleep used during the measurement period, or captured with the use of a diary.
Acceptability and applicability
In all the projects, a range of issues emerged related to acceptability of the DL devices. The DLs used were small enough to hide, the bright colours make them easy to find and their small size makes them portable enough for researchers to transport even when using public transport. Whilst the DLs were generally accepted, there were some more vulnerable participants that expressed initial concerns. Parents were worried that their children might play with the DLs and damage them, Warm Well Families project (project 3). There was a small red flashing light on the DL to indicate it was recording. This was a concern in the dementia and fuel poverty study (study 4) and the Warm Well Families study (study 3) as it may be too bright in a bedroom at night. Some older people in the Keeping Warm in Later Life (KWILLT) study (study 2) were concerned that the device was being used to spy on them, and needed reassurance. For the Warm Well Families study, parents found places to keep the DLs out of the sight and reach of young children. For most studies, the small flashing light was taped over or turned away from view so it did not disturb anyone. Participants were reassured that the flashing light was normal. All participants were given contact telephone numbers in case they had any concerns about the DLs. Reassurance was also given that the devices were robust so the participants didn’t have to worry about damage.
The use of DLs may help engage people in the research process. In practice, however, even well-educated participants found it hard to make sense of simplified graphs and data on their temperature and humidity readings, but most participants appreciated the opportunity to see the results of the recording and to be able to keep a copy to show a landlord even if they did not fully understand it. Several of the participants had raised issues around heating and mould to their landlords and where the problems had not been resolved they hoped the graphs provided further evidence to support their complaints. In one case, the graph was used by a resident to support the case of a household complaining of severe condensation and mould. In another case, when a participant with sickle cell disease woke up in pain brought on by cold, information on temperature and time of night was fed back to the participant.
An advantage of the DL data is that results can be expressed in different ways through the variety of graphs and statistics produced through the DL software. Data can be exported to other statistical packages making it acceptable for a variety of different audiences from statisticians to policy makers and participants. If numbers are sufficient, a detailed, statistical analysis can be performed on the DL results, as produced for the Warm Front study, 32 combined with a thermal comfort scale (which includes hot/warm/slightly warm/neutral/slightly cool/cool/cold) to determine which temperatures people felt most comfortable at.
Limitations
Many of the limitations of using DLs relate to what data are required for a comprehensive thermal audit for human health. Caution must be exercised not only in the sample size for statistical power but in interpreting data and understanding the limits of just measuring room temperature and RH in relation to health and housing. There are several additional environmental and physiological factors involved in the regulation of body temperature, including air velocity, radiative heat, clothing and bedding, metabolic rate, constriction of peripheral blood vessels, skin surface area and so on. 45 Thermal comfort adds even more variation because it depends on the sensation and preferences and judgements of participants. In terms of housing conditions, RH is only one thermal factor, the capacity of the air to hold water and is directly linked to the air temperature. 46 This is different to absolute humidity, which indicates how much water the air holds. Condensation is a common cause of mould growth in homes in the UK and residents are usually advised to reduce humidity by opening windows and avoiding drying laundry indoors. RH may indicate humidity but the temperature of the wall is also a predictor of where the condensation will occur and cold spots on walls and ceilings can cause condensation and mould in homes where RH isn’t that high. 47 In the condensation study (study 5), a thermal imaging camera was trialled to identify where cold spots matched mould. The results indicated where structural changes to the home could supplement lifestyle changes to reduce humidity in the home to reduce mould growth. Another limitation to the data that cannot be circumvented by this kind of DL is that one cannot be sure exactly when people were in the rooms being recorded. The point of the qualitative data is to gain some insight into the use and occupation of rooms through interviewing but also, as used in the Warm Front study, participants can be asked to keep a diary over the monitoring period to provide further detail.
Theme 2 Data yielded using DLs and qualitative methods: where the DL data backed up the qualitative data
There were several examples of DL data backing up qualitative evidence where reported heating patterns matched the DL temperatures. In the Warm Front study (study 1), there was a high degree of correlation between temperatures logged by the DLs and those recorded using liquid crystal display thermometer strips in residents’ temperature diaries.31,40 In the Warm Well Families research (study 3), many of the families reported turning the heating off while children were out of the house, which was verified by the DL data. A dramatic example of this congruence was with a participant in the sickle cell study who could remember the exact time in the night she felt the cold trigger her pain one night, which then lead to her being hospitalised. This time matched a sudden drop in temperature to one of the lowest temperatures of the recording period for her bedroom. In this case, it would have been useful to consider the role of physiological factors in heating behaviours alongside the DL and qualitative data because in terms of the harmful effects of thermal stress, a drop in temperature can have as much impact as an absolute temperature. Another example is that of a participant who could not understand why her heating bill was so high when she did not feel that she had used her heating much, which was confirmed by the DL data. This participant was referred for help from a fuel poverty advice team with reducing her bills and improving her home’s energy efficiency.
Where DL data contradicted the qualitative data
There were several occasions where DLs provided apparently contradictory evidence to the qualitative data. In the Warm Well Families study (study 5), parents reported turning the heating off while their children were at school. However, in some cases the DL data showed heating was coming on for a short period in the middle of the day. This may suggest that some parents did not understand how to use their heating and were unaware of their heating settings, especially where thermostats weren’t used. Another interesting and understandable contradiction was the temperature participants reported they liked to keep the house at versus the actual temperature recorded, which was sometimes different. Such a contradiction highlights the difficulties participants have in judging temperature if they are not using recording devices themselves, even thermostats set to a particular temperature may not reflect the actual temperature in all rooms.
There were some cases where participants were estimating the room temperature to be adequate but were puzzled as to why they still felt cold. For example, in the Warm Well Families project a mother was told by her husband and teenage sons that the house was warm and that there must be something wrong with her if she felt cold. The DL data showed that the room was consistently below the recommended room temperature, explaining why she complained of feeling cold. The conflict here may be the differences in metabolism and thermal comfort between genders and ages living in the same space. 45
Another contradiction was in the sickle cell project (study 6), where a participant reported waking up in the middle of the night in pain and went through her usual routine of reversing the pain by turning the heating on and putting more clothes on. This remedy did not work and she became hospitalised with pain a few hours later as mentioned above. On checking the DL data, it appears that the participant had not managed to turn the heating on. This confusion could be explained through the qualitative data where the participant explained that her pain can be so intense that she could get confused about what she was doing.
In the KWILLT study (study 2), it was possible to evidence that some homes were very cold even though the participant didn’t report feeling cold. Information collected by DLs, therefore, has the advantage of picking up an ‘invisible’ public health concern and can help to determine if vulnerable people are not detecting that they are cold. For example, if they suffer nerve damage, or neuropathy or cognitive impairments that reduce their ability to physically feel or detect the cold or to understand what the sensation of cold signifies. 45 Analysis of the large Warm Front data set with DL data and temperature diaries was used to show that even after heating improvements, a sizeable proportion of study participants experienced persistent cold temperatures and that those with cold temperatures were more likely to experience anxiety and depression. 30 DL data were able to show that the Warm Front intervention led to a slight increase in temperature at which point most participants in the study felt thermally comfortable (from 18.9°C to 19.1). These data contradicted the predicted mean vote (PMV), which is a standardised thermal comfort model matching physical conditions to human thermal comfort in the ISO 7730 standard. The PMV model predicted a higher thermally comfortable temperature of 20.4°C to that which was recorded amongst average Warm Front households. 32 Evidence from the Warm Front study linking recorded temperature, thermal comfort and stress to health outcomes has been extensively used in health and fuel poverty policy such as the Marmot Review. 4
An additional benefit to using this combined approach was to get feedback on whether the DLs were moved around at all by participants. In our studies, only one person reported having moved the DL around the house in the study period. This information allowed us to treat that participants data with an appropriate level of caution.
Qualitative data alone are useful
To understand the human element of home heating systems, qualitative methods have the potential to reveal unexpected behaviours and beliefs not captured by quantitative methods. In the six studies, qualitative data revealed significant insight into behaviours and beliefs.
Information was gained on who managed the heating system and when. Multiple reasons were identified to explain why people had turned heating systems off even when it was very cold. These included the more obvious inability to pay, but people also cited thrift, not being able to fix or work a heating system and fear of debt. Understanding how people judged room temperatures was also useful, with people commonly judging the room temperature by how they felt themselves more so than looking at actual temperature readings.
People gave explanations as to why they prioritised heating at certain times, such as when children were in the house. Participants also explained what happened when they were in the house and why, and described how they sometimes went outside the house to find a warmer place. In the Warm Well Families study, children talked about going outside to warm up through running around and one teenager would stand outside his house when it was too hot for him but not warm enough for his mum. With regard to turning heating off when it was cold, a range of alternatives was revealed in the qualitative research such as using outdoor clothing inside, bedding in the living room during the day, hot water bottles, wearing extra layers but also a fear of the fire risk of electric blankets. The use of fleece blankets as an alternative to heating during the day was common, e.g. as revealed by KWILLT and Warm Well Families (studies 2 and 3). However, participants noted this restricted movement around the house because of the discomfort of leaving the warm pocket created by being enclosed by the blanket when the room was very cold.
Thermal comfort differs between ages, genders and generations even in the same environmental conditions. There are, therefore, great challenges to providing a single comfortable environment for each individual and this may also conflict with recommended temperatures. Whilst parents in the Warm Well Families (study 3) and condensation study (study 5) frequently cited how they reserved the heating for their children, some children reported feeling too hot at times. One example was when they went upstairs to bed before the adults, the heat having risen upstairs and the children were under duvets. Their protests resulted in the parents turning the heating off and using blankets to stay warm downstairs. In the Keeping Warm with Sickle Cell Disease study (study 6), the sensitivity of cold of one older person was used positively where a teenage girl with sickle cell disease went to live with her grandmother opposite her mother’s house. The mother couldn’t afford to keep the house warm enough for her daughter to prevent her experiencing sickle crisis pain through getting cold, and the grandmother had a warm home irrespective of whether the granddaughter was living there or not.
As well as cold, mould in people’s homes was an important concern for participants. The issue of mould, whilst a significant risk to health and related to cold homes, does not always come under the remit of fuel poverty and energy efficiency research that focuses on cold homes. It was useful to include the concerns, such as unacceptable levels of black mould, raised by the participants despite not necessarily being fully within the intended remit of the research. In addition to the experience of living in, and attempting to fix homes blighted by mould, issues of terminology were revealed, as were a range of assumptions made by tenants as well as landlords. Participants frequently described having damp and mould in their homes and reported frustration that their landlords would not come and remedy the problem. Landlords insisted on using the term condensation and insisted in most cases that the problem was caused by tenant behaviour of not opening windows enough and producing excess humidity through cooking, laundry and hot showers. Whilst making behavioural and structural changes to reduce mould in homes is complex, a starting point in the dialogue is to understand the use of language and the experience of the tenant and the landlord. This was achieved through the qualitative data gained in many of the six studies. In addition to the desperation, some participants expressed about living with mould in their homes, the qualitative data also revealed the resultant impact on physical and mental health, the costs of replacing mould ruined clothes and furniture and re-plastering or redecorating. Such cases illustrate the extent of harm caused by mould and the need for mould, damp and condensation to have a higher priority in fuel poverty research and practice.
DL data alone are useful
The DLs provided stand-alone data that were of use, such as the precise heating patterns, actual rather than estimated temperatures and a wealth of detail that people would not have been able to recall otherwise. These data were also useful for referrals where a health or housing concern was raised by a participant and they had accepted or requested a referral to an organisation that could help them. It was also useful in comparing and determining heating patterns and the typical temperatures people were exposed to in their homes.
Discussion
Whilst there are a large number of quantitative studies and a lesser number of qualitative studies on fuel poverty, combining environmental monitoring with qualitative methods is a relatively novel method. The six studies led to useful insights through quantitative and qualitative data separately. Adopting a method which combined in-depth interviews alongside temperature and humidity measurement produced much greater value by cross-validating and triangulating the data obtained to reveal information that could not be generated by one or other of the methods alone. Combining the DLs and qualitative data provides much richer and more meaningful data about the lives of people living in cold homes and fuel poverty. Such a method can be effective at illustrating how various factors can influence and help to explain householder’s behaviour and choices in terms of risks, experiences and responses to fuel poverty. The six studies discussed here have individually and collectively gone some way to challenging a number of the assumptions about cold homes and fuel poverty and one or two illustrations of this from each study are given below. The Warm Front study31,40 showed that energy improvements had a positive effect on mental health among other positive health impacts, and that energy efficiency improvements are not necessarily followed by warmer temperatures and some homes still remain cold after heating and energy efficiency improvements. The KWILLT study 10 demonstrated how there were multiple reasons, other than income, why older people didn’t use their heating. The Warm Well Families study18,35 highlighted conflicting messages that participants received from professionals about keeping their homes warm and dry and heating patterns prioritising children’s warmth. The dementia study 37 showed some people with dementia were living in cold homes, which could be linked to their condition and associated issues with the control of finances and heating systems. The condensation study 38 showed that differences in RH readings did not correlate with the severity of mould growth in people’s homes and that participants' mould reduction efforts, such as cleaning and redecorating, could explain some of the mould patterns visible to the eye of the professional assessing the severity of the mould. The Keeping Warm with Sickle Cell disease study 39 showed that whilst the participants reported needing higher room temperatures than people without the condition, the recorded temperatures were not as high as their ideal temperature, which could be partly explained by lack of income.
This method can also be easily replicated with relatively low cost due to the same devices being able to be reused in subsequent and concurrent studies. Developments in new technologies both for monitoring the home environment for research and for people to use in their own homes (such as smart meters) offer new opportunities for researchers and consumers and could be utilised in a mixed method/triangulation approach such as this. Many of the currently available technologies were not available at the time of some of the studies, and this paper focuses on the use of the DLs. In theory, new technologies could make monitoring studies easier to undertake but at the same time there is a possibility that they could influence occupant behaviour in fundamental ways. For example, the introduction of smart meters may result in people modifying their use of appliances. Whatever the opportunities offered by technologies, old and new, they do not necessarily help vulnerable people overcome barriers to warmth. Moreover, a major element of the method used across the six studies is the qualitative data, which should not be overshadowed by the quantitative data. Our aims were chiefly to use the technologies to support the qualitative data and not the other way round. The study design was primarily qualitative because it was looking at heating behaviours, and the DLs were seen as a way of supporting and testing out the reported behaviours.
Data from this method could also be effectively applied to fuel poverty interventions. There are several schemes, particularly aimed at frail older people living independently, that link room temperatures to alarm systems. However, it is still unclear at what room temperature an alarm should be triggered. As discussed above, individual reactions to cool environments can vary greatly. There are also ethical concerns around advising people to use more heating where there is a concern that their home is too cold, because there is rarely financial support to pay for additional heating costs. However, using the temperature monitoring data, advice could be given on making heating more cost-effective. For example, where DL data show regular extremes of peaks and troughs, this could indicate that the participant is turning the heating on and off when they feel too hot or cold. A thermostat might be an easier and cheaper way to achieve thermal comfort if used correctly to achieve the required room temperatures. In terms of interventions, DLs can be used in evaluation as much as in research, for example, to see if fixing a heating system and/or improving energy efficiency has improved temperatures in a home someone has said is difficult or impossible to heat.
A main focus of this paper has been to describe the practical and academic challenges and advantages of using this combined method in fuel poverty research. It is hoped that the insights shared will help enable the application of this method (or a modified version of it) more widely within fuel poverty research. With this in mind, listed below are some recommendations for the further refinement of the method:
If conducting the main qualitative interview at the first visit and concentrating on heating patterns in the second visit, researchers need to consider the potential for the Hawthorne effect in their data collection. The timing of a main interview at the first research visit can potentially influence participant behaviour during the subsequent monitoring period. There is also a risk that having monitors in the home might lead to participants modifying their behaviour during the monitoring period. Finding unobtrusive locations for DLs and discussing where to place them with participants can help to ensure that the effect of the presence of DLs is minimised. Include in the planning of the research, ways to reassure participants regarding the measurement devices, e.g. placement concerns, flashing lights, worries about surveillance Include the costs of very detailed DL analysis in funding bids and identify someone with the specific skills required for the data analysis using the required software. In order to avoid having to travel back to the office to reset the timing of the DL install DL software on computers accessible from different locations or on hand held devices. Keep written records of exactly where the DL was placed in each room in case the participant forgets where it was placed. Record when the participant is out of the home. Participants could be asked to complete a diary of when they are in or out of the house. Or new technologies, for example footfall analytics technology, could be used to record this movement. This enables the analysis to identify when the participant was exposed to the recorded room temperature and when heating may have been turned off because they were not in. Use a DL with a temperature display so that participants can see the temperatures for themselves after the monitoring period and once awareness of the temperatures may have been raised through the study. If this is done during the study period, it may lead to the Hawthorne effect where participants change their behaviour in response to participation in a study, especially where extra information is available.
Conclusion
Future studies in fuel poverty could contribute to our understanding of how and why people are cold and ill at home. This article demonstrates that the use of DLs to support other data collection methods, such as interviews, has a place in future mixed methods research. However, there are challenges to be considered and modification is required for different populations and groups. The learning from the six studies presented here can assist future fuel poverty studies wishing to employ and refine this method to deepen our understanding of how to reduce cold-related harm to vulnerable people at home. Practitioners could use this method to tailor interventions to specific individuals who may not be prioritised in general fuel poverty or excess winter deaths prevention policies, for example, NICE guidance on excess winter deaths focuses on flu, heart disease, falls and stroke in older people. 14 Housing and health practitioners may regularly come across people whose health is at risk because of cold homes and using the DLs could add evidence to practitioner interviews of how their clients or patients report fuel poverty-related issues. This mixed method approach used by academics can also provide evidence in relevant formats for practitioner use and can involve practitioners in the data collection, analysis and impact. This, in turn, can feed into the gaps in policy making between academics, policy makers and practitioners. 48
Footnotes
Authors’ contributions
A Cronin de Chavez did a significant amount of the writing of this article and revising versions and was responsible for or involved in the data collection, analysis and conclusions for four of the mentioned studies. J Gilbertson made a significant contribution to the writing of the text, made critical revisions and was responsible for or involved in the data collection, analysis and write up of the largest study in the paper and advised on the other studies. AM Tod made a significant contribution to the writing of the text and revisions and was responsible for or involved in the data collection, analysis and write up of two of the studies. P Nelson, V Powell-Hoyland, C Homer, A Lusambili and B Thomas contributed to the ideas and formation of the paper, made critical revisions and were significantly involved in the data collection, analysis and write up of at least two of the studies in the paper. All authors have approved this version to be published.
Declaration of conflicting interests
The author(s) declared no potential conflicts of interest with respect to the research, authorship, and/or publication of this article.
Funding
The author(s) disclosed receipt of the following financial support for the research, authorship, and/or publication of this article: The Warm Front study was funded by the Energy Saving Trust, The Keeping Warm in Later Life was funded by the National Institute for Health Research under its Research for Patient Benefit. The Warm Well Families study was funded by Consumer Focus, Doncaster Primary Care Trust, Doncaster Metropolitan Borough Council, Rotherham Primary Care Trust and Rotherham Metropolitan Borough Council. The dementia and fuel poverty was funded by a Sheffield Hallam University studentship. The Rotherham Condensation Study was funded by Rotherham Metropolitan Borough Council. The Keeping Well with Sickle Cell disease funded by the Chesshire Lehmann Fund.