
Abstract
Investigating the total heating energy consumption over the entire heating season and its distribution data can help policymakers to adequately understand the current status and development trend of heating energy consumption, as well as to formulate effective policies to improve the indoor comfort and energy performance of residential buildings. This paper aims to explore a method for obtaining the space heating energy consumption demand of dwellings to guide energy conservation and energy supply with heating. A survey questionnaire was carried out to obtain detailed information on the occupant behaviour on space heating in a multi-unit high-rise residential community in Nantong. The statistical results of some factors were obtained from the questionnaire, such as occupants’ space heating behaviour, window-opening behaviour, and indoor temperature setting. Then, energy consumption by space heating was simulated and analysed based on the survey data, and the reliability of results was verified by comparing modelled results with measured energy consumption from 1625 households. The results reveal that the heating energy consumption simulation method based on occupant behaviour survey can be used to predict the distribution of the energy consumption over the entire heating season in this region and areas with similar climate.
Introduction
The hot summer and cold winter (HSCW) climate region in China is located between latitudes 25°N and 35°N. This region mainly covers China’s densely populated, economically developed eastern coastal areas and the middle and lower reaches of the Yangtze river.1,2 The most prominent features of this climate are its hot and rainy summers and mild and humid winters. This particular climate zone is not located in the region configuring the city-scale central-heating system 3 ; hence, the indoor thermal comfort of buildings is far less than expected during winter.4,5 However, with the development of the social economy and improvement of residents’ economic ability, the demand for heating in winter become increasingly intense in this region and 88% of respondents in this region desire to develop a city-scale central-heating system. 6 Over the past few years, a growing number of residential communities in the HSCW urban areas have installed the small-scale district heating system with a heat source provided by an urban heat network or residential property company, which has obviously the effect to result in a substantial increase in the energy consumption for heating in winter. 7
In recent years, the high inclination towards the residential energy consumption in the HSCW region has concerned researchers and policymakers. Space heating is counted as the most energy-intensive end-use in both urban and rural households due to the requirement of the indoor environment for residents.8,9 For example, residential heating energy consumption accounts for more than 36% of the total building energy consumption in China. 10 Firth et al.’s 11 study showed that the space heating accounted for 61% of the total household energy consumption in the UK, and they achieved this result through the Community Domestic Energy Model. Because of the similar climate conditions in the HSCW region of China and the UK in winter, 7 space heating in this region is considered a potential source of major energy consumption and domestic carbon emissions. According to recent research, the heating energy accounts for one-third of the energy consumption of residential buildings in the HSCW region, 12 and therefore space heating has become the key focus of the building energy conservation in this climate region in the future. 13
A good understanding of heating energy consumption and its demand by dwellings would help comprehend the characteristics and trends of the building energy consumption for space heating of residences in the HSCW region. The lack of information on total heating energy consumption and its distribution have hindered policymakers from an adequate understanding of the current situation and trend of heating energy consumption, as well as formulating effective policies to improve the indoor comfort and the energy performance of residential buildings in the HSCW region. 14
Measurements and surveys of household heating energy consumption are regularly conducted by government agencies and utility companies in many countries, such as the US Energy Information Administration (EIA) 8 and the US Department of Energy (DOE). 15 Currently, a similar field measurement and investigation of residential energy consumption does not exist in the HSCW region 8 and it is difficult to obtain the distribution data of the space heating energy consumption in a specified area. In order to obtain the energy consumption data, field measurement is suggested as a reliable method.16,17 Considering the cost and feasibility of the large-scale research, the heating conditions are not widespread in the HSCW region. In addition, it is not feasible to implement the long-term and large-scale field measurement of the heating energy consumption in this region.
Another method to obtain the energy consumption is by prediction using the simulation tools. However, considerable researches have revealed that there is frequent divergence between the predicted and actual energy consumption of buildings.18–22 This performance gap is due to not considering the differences between building design and as-built building in the energy simulation process, including the energy consumption related behaviour of occupants.23–27 The International Energy Agency (IEA) Energy in Buildings and Communities Programme (EBC) Annex 53 defined energy-related occupant’s behaviour as ‘observable actions or reactions of a person to adapt to ambient environmental conditions such as temperature, indoor air quality or sunlight’. 28 The occupant’s behaviour has been observed to cause up to 71% of the variation in the energy consumption of buildings. 29 Potential energy savings of the increased building insulation heavily depend on the occupant use of terminal heating systems. 30 Control of the household heating31,32 and windows opening 33 is a significant parameter of the occupant’s behaviour during the heating season 34 and is a significant issue in the occupant’s behaviour models in computer simulations. 35
Investigation and survey on the occupant’s behaviour is considered a reliable method to provide the practical input data for energy consumption simulation. The reliability of the method of investigation and survey to estimate the short-term heating energy consumption has been verified by many studies.36–38 Researchers have provided numerous valuable information from their investigation and survey data to enable a better understanding of effects of occupant’s behaviour on the heating energy consumption in the HSCW region. Quite a large number of occupants in the HSCW region open their windows for natural ventilation during the heating season, which leads to a sharp increase in the energy used for heating. 39 Furthermore, due to different habits, customs and household economic levels, the occupants typically turn their heating on and off at different times of the day and for different durations.7,38,40 These different behavioural patterns might lead to significant differences in heating energy consumption over the entire heating season.7,38,40 Compared to the northern China, the investigation showed that the heating behaviour possessed a more obvious influence on the energy consumption intensity of heating than other factors in the HSCW zones.7,13,37,38,41,42 According to the sensitivity analysis, the heating triggering/setting temperature had a considerable influence on the energy consumption of the residential heating.7,43 For example, the average heating energy consumption of the retired families was 47% higher than those of not retired people because of the longer heating duration for the retired families. 7 Based on the above-mentioned research results, the key intensity factors to the heating energy consumption include the occupants’ space heating behaviour, window-opening behaviour and indoor temperature.
In summary, the aim of this paper is to determine the residential space heating energy consumption and its distribution in the HSCW region and to provide guidelines for policymakers. In previous studies, such energy consumption data were obtained from on-site measuring instruments. However, there is currently no large-scale installation of measuring instruments in this region. Some studies have researched short-term space heating energy consumption by investigating data for one week. Therefore, a new method based on survey and simulation, and not large-scale field measurement, is required to determine the space energy consumption for the whole heating season for a large number of dwellings. This paper describes a method for obtaining an example of the distribution of space heating energy consumption for the whole heating season over a large-scale for dwellings located in China’s HSCW region. A questionnaire survey was conducted in a residential community in the city of Nantong, located in the HSCW region. Based on the questionnaire, a residential space heating energy simulation model was used to calculate the heating energy consumption for the whole heating season. This model was then validated by comparing the modelled energy consumption distribution to the measured data. The adopted research method can be applied to other research on the prediction of heating energy consumption and its distribution in a large population.
Methodology
Selection of investigation and survey
China’s urban dwellings are mainly multi-unit high-rise residential buildings. Gated communities are the most popular model of urban residential planning in China, and all buildings in a residential community are designed and built by the same developer. There are typically dozens of residential buildings with the same or similar layouts in a residential community. Mandatory targets, such as plot ratio, building density and green space ratios in the residential community, are supervised and controlled by the government.
To determine the distribution of the total space heating energy consumption of a large population in the HSCW region for the whole heating season, a questionnaire survey was conducted in a residential community in the city of Nantong situated in the HSCW region, during the 2014 to 2015 heating season (from December 1, 2014 to March 31, 2015). A total of 32 multi-unit high-rise residential buildings with heights ranging from 36 to 52 m and numbers of storeys ranging from 11 to 18 are located in the residential community, according to data collected in 2007. The first floors of all buildings are used for commercial purposes or as garages. The second floors and above often serve as residential areas. Currently, 1625 households reside in this area, and the interior area of each house varies from 110 to 150 m2. District central heating systems, using a ground source heat pump (GSHP) as the heating source, were installed in this residential community so that the heating of each room is entirely controlled by occupants – they can turn it on and off, and adjust the indoor temperature according to their needs. Fan coil units are utilised in the terminal system of the heating system, and each room can be controlled separately. In addition, heat energy metering devices were set in each household to measure the heat consumption during the heating season.
Questionnaire survey
To obtain the input data for simulating heating energy consumption, the behavioural patterns of household occupants in accordance with their practice are required. Real-time investigation and monitoring can provide more detailed and accurate information on the heating behaviour of occupants. However, promoting and implementing such methods at a larger scale over a long period of time are difficult. In contrast, questionnaires are relatively feasible on large scales.
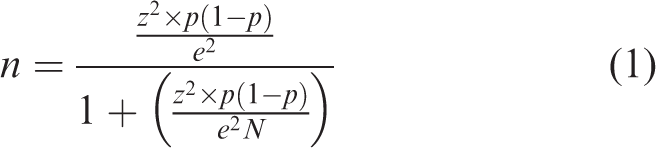
To suitably analyse the collected data, a sufficient sample size is required. Based on the law of larger numbers, the average results of a series of experiments should be close to the expected value, and those obtained from a greater number of data points should be closer.44,45 However, according to probability theory, the central limit theorem states that when the sample size increases, any set of data reaches a normal distribution.44,45 Based on these two principles, the sample size (n) can be calculated according to equation (1)
Therefore, based on the determined sample size, the anonymous questionnaire survey was conducted among 800 household respondents in the residential community in Nantong city. Of these, 519 were collected, resulting in a 65% effective rate. The results of the survey were statistically analysed to obtain the required data about the types of equipment, household appliance behaviour, occupant’s behaviour, and their possible influences. After the survey, the behaviour patterns were summarised and classified into some typical models, and then these behavioural patterns were used as input data to simulate and predict the energy consumption for a typical day or a period.36,46
The questionnaire survey was carried out to obtain the distribution of the total space heating energy consumption for the whole heating season. In contrast to previous research, the questionnaire designed in this study asked respondents to report their daily routine of heating-related behaviour patterns, i.e. a summary of the daily average heating behaviour pattern of household respondents was collected during the whole heating season. The design of the questionnaire was according to the occupant’s behaviour model proposed by Wang. 47 This questionnaire method was used to investigate large sample data on the air-conditioning behaviour patterns of occupants. 36
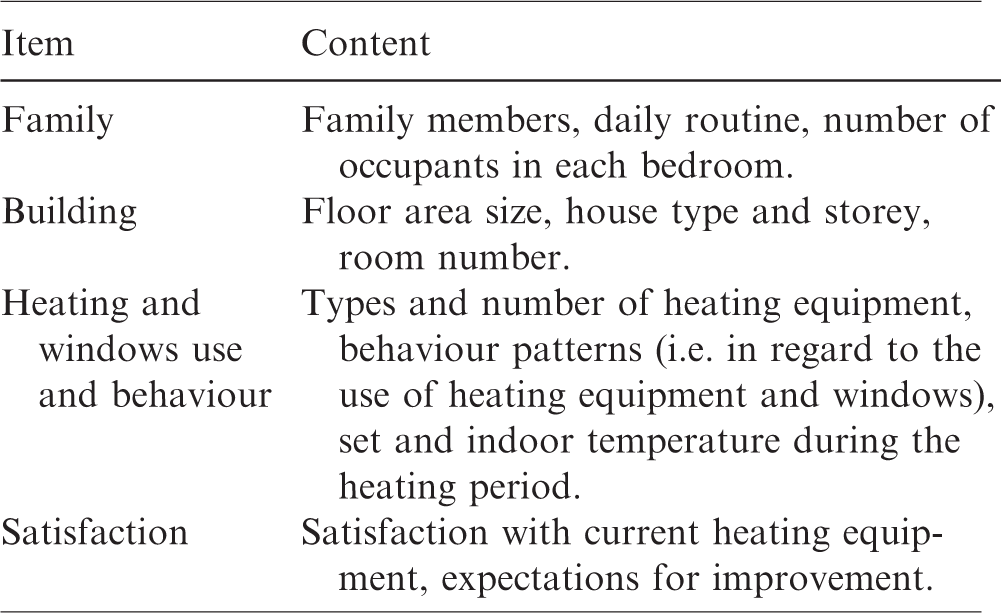
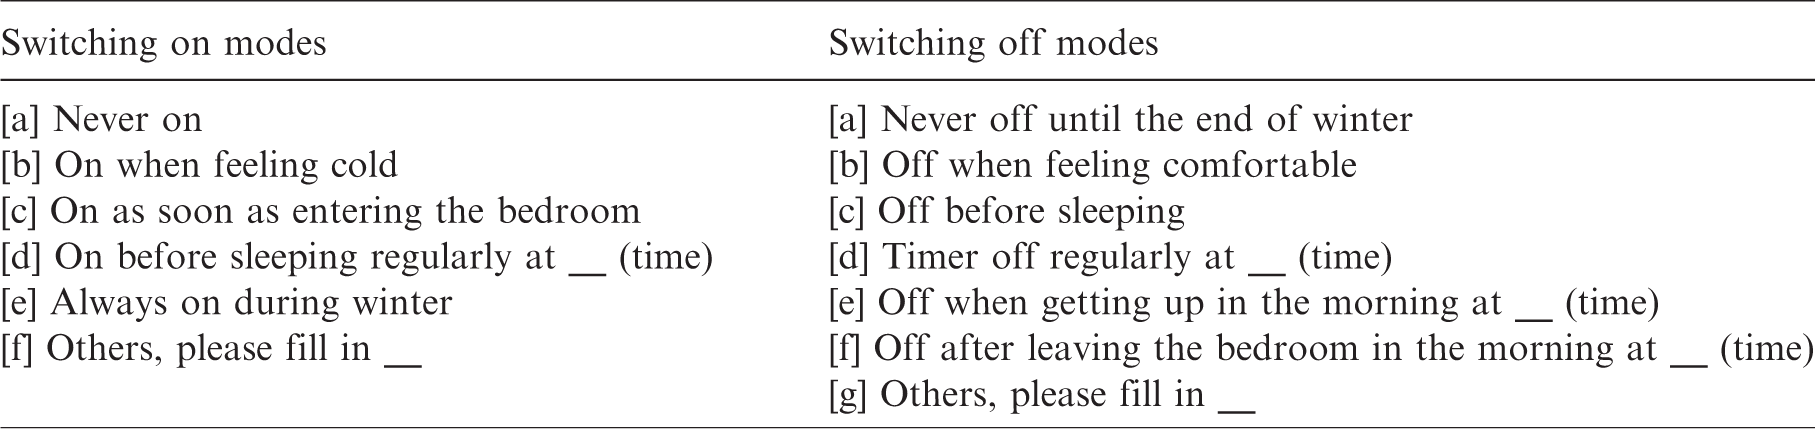
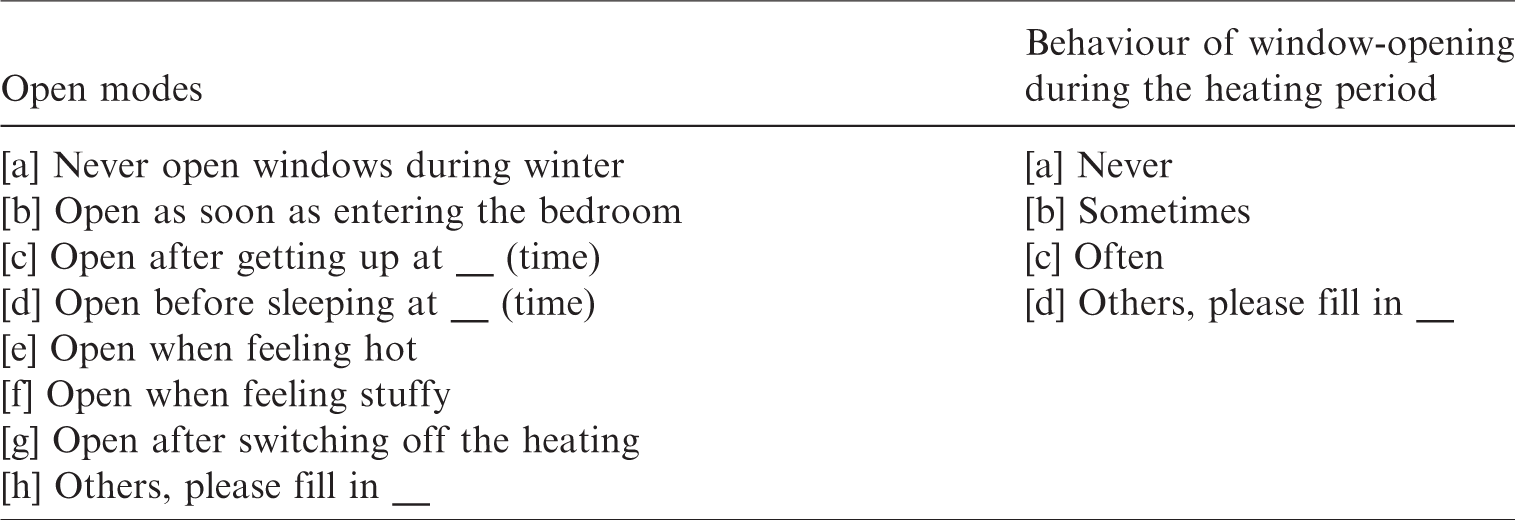
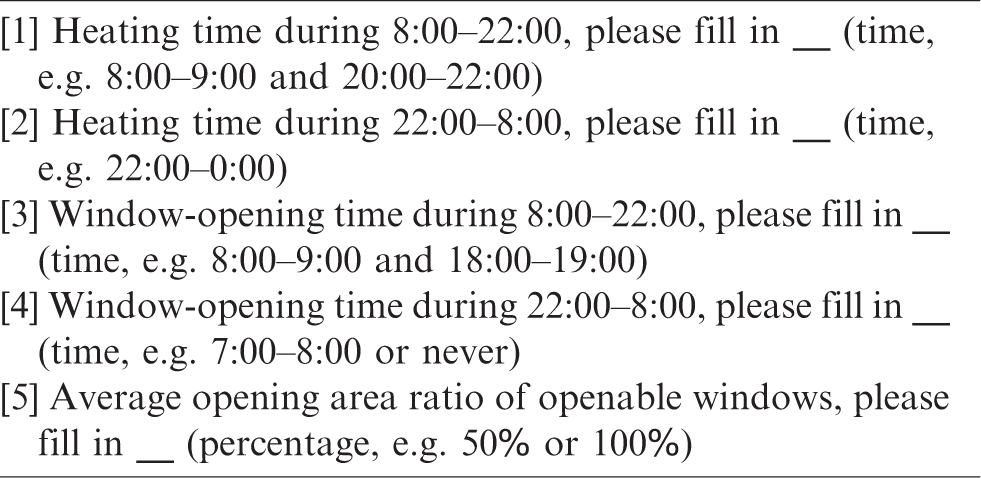
The questionnaire contained 25 questions accompanied by additional sub-questions. A summary of questionnaire items is presented in Table 1. The questionnaire included demographic questions such as family and building information as well as a list of options about when occupants turn on or off the heating, and open or close the windows in their bedrooms and living rooms. Moreover, the indoor comfort and satisfaction with the current heating equipment were investigated. The behaviour patterns were described as conditions for the occupant to turn on/off their heating equipment, e.g. ‘turn on as soon as entering the room’, or ‘turn off when getting up in the morning’. Tables 2 to 4 show the options and questions of the heating and window modes in the bedroom listed in the questionnaire, respectively.
Items of the questionnaire.
Options for heating modes in the bedroom.
Options for window-opening modes in the bedroom.
Questions for heating and window-opening periods in the bedroom.
The questionnaire was conducted online by a professional survey company, and was randomly distributed to half of the households in the residential community mentioned above. In the survey, a repeat-prevention mechanism was implemented to prevent multiple responses from the same IP address. In order to ensure a sufficient quality of the survey and an effective response to the data, the final samples were selected from among the participants under different screening conditions. Specifically, participants were excluded from the screening process who (1) failed to answer the question of verification correctly (i.e. the answer of two related questions were contradictory or inconsistent), and (2) filled out invalid answers (e.g. the number of bedrooms were more than four).
Furthermore, the time taken to answer the questionnaire was also calculated. The answer time of samples was from 3 to 17 min, and the average answer time was found to be 5 min. This answer time is acceptable in large-scale survey.
Energy consumption simulation
For determining the energy consumption of a building, an energy model of Building F (below) was developed using simulation software-DeST (Designer’s Simulation Toolkit, which was developed by Tsinghua University, China) based on survey results, and the add-on DeST-VentPlus was used to couple multi-zone airflow models for this study,48–50 which considers the hourly outdoor wind speed and direction.
Building F is a 17-storey building in which the height of each storey is 2.9 m. The first floor is used as a garage, and the second floor and above are for residential use. There are six households in each storey (three units) with two types of apartment layouts: one has a floor area of 145.3 m2 with three bedrooms, a living room, a study, a kitchen and two bathrooms; the other has a floor area of 118.3 m2 with three bedrooms, a living room, a kitchen and two bathrooms. The building model is shown in Figure 1.
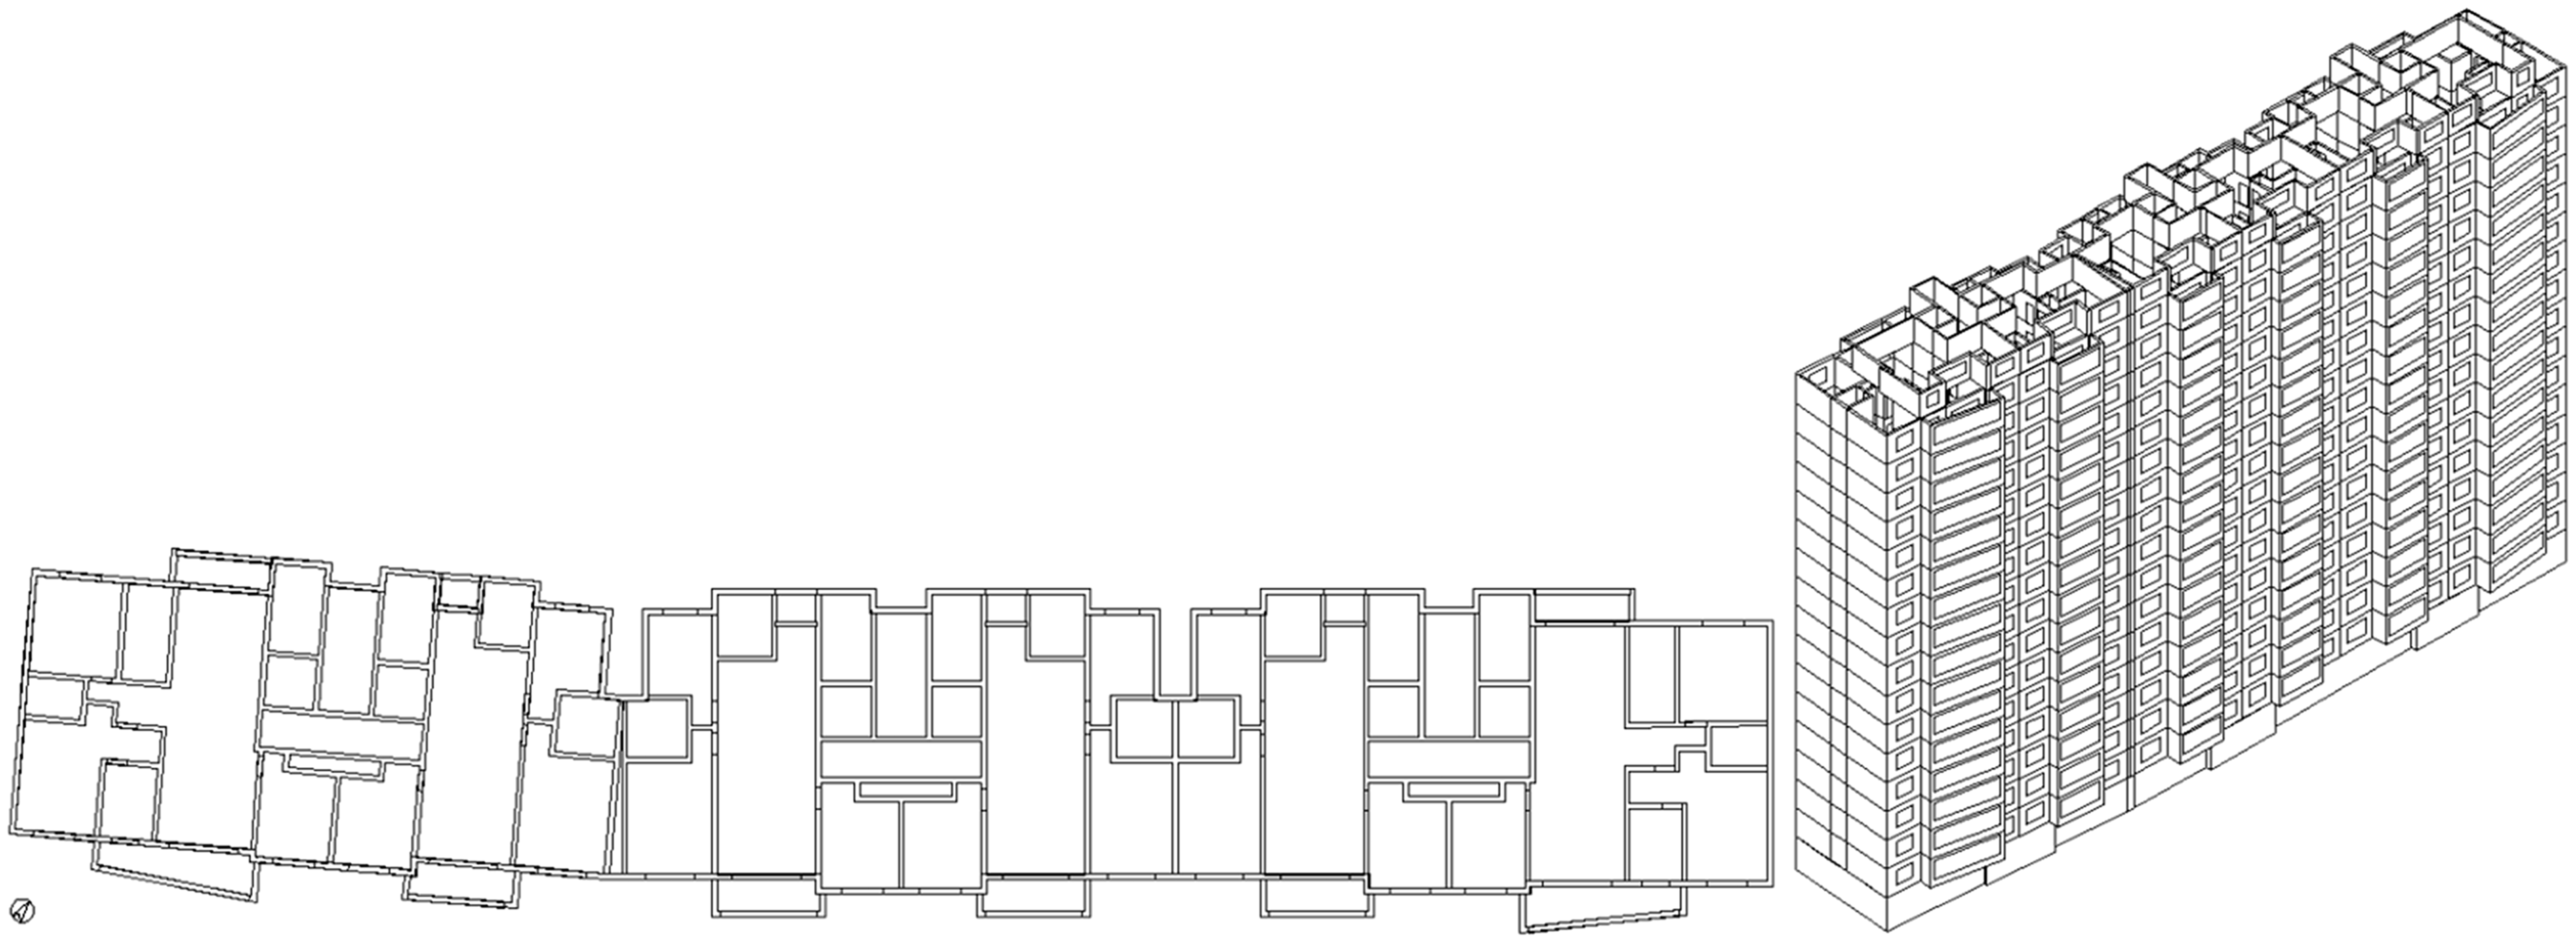
Simulated floor plan and building diagram.
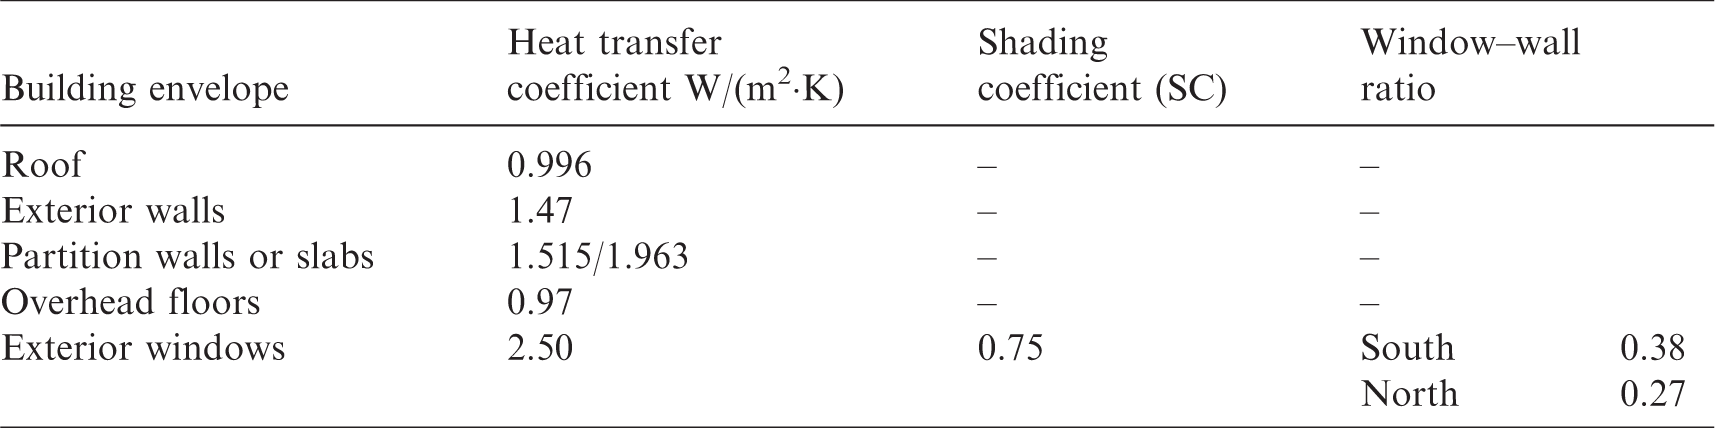
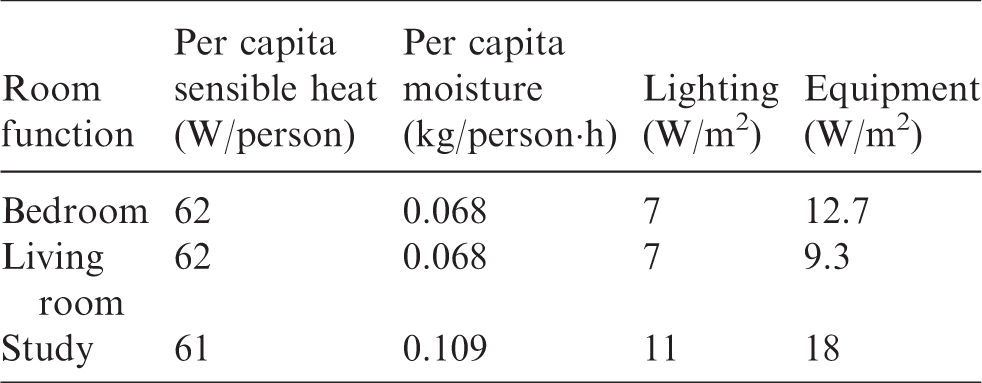
In this building, bedrooms, living rooms and studies are all equipped with heating, whereas there are no heating facilities in kitchens, bathrooms and staircases. Table 5 lists some of the important thermal parameters of the building envelope used in the simulation. These parameters were set according to the architectural design data and conformed to the Design Standard for Energy Efficiency of Residential Buildings. 51 The indoor thermal disturbance parameter setting in rooms with heating is given in Table 6. 52 The actual number of people in each room for the simulation models was obtained from survey results.
Statistics for the thermal parameters of a building’s envelope.
Indoor thermal disturbance parameter settings.
This study adopted the method for the annual hourly coupled simulation of natural ventilation and building energy consumption, which can accurately calculate the impact of natural ventilation on a building’s heating load. A multi-zonal model was used by the simulation to continuously calculate the airflow rate from natural ventilation, which integrates with a thermal model.
Meteorological data for the simulation were collected from the annual hourly meteorological data of Nantong city using Medpha, 48 a meteorological module for DeST. The data include the hourly dry-bulb temperature, wind speed, wind direction and the solar radiant intensity incident on a horizontal surface calculated throughout the 8760 h of the year.
Figure 2 illustrates the daily outdoor temperature during the heating season of a typical meteorological year in Nantong. During the heating season, the outdoor temperature varied between −3.4°C and 24.8°C with an average degree of 5.8°C.
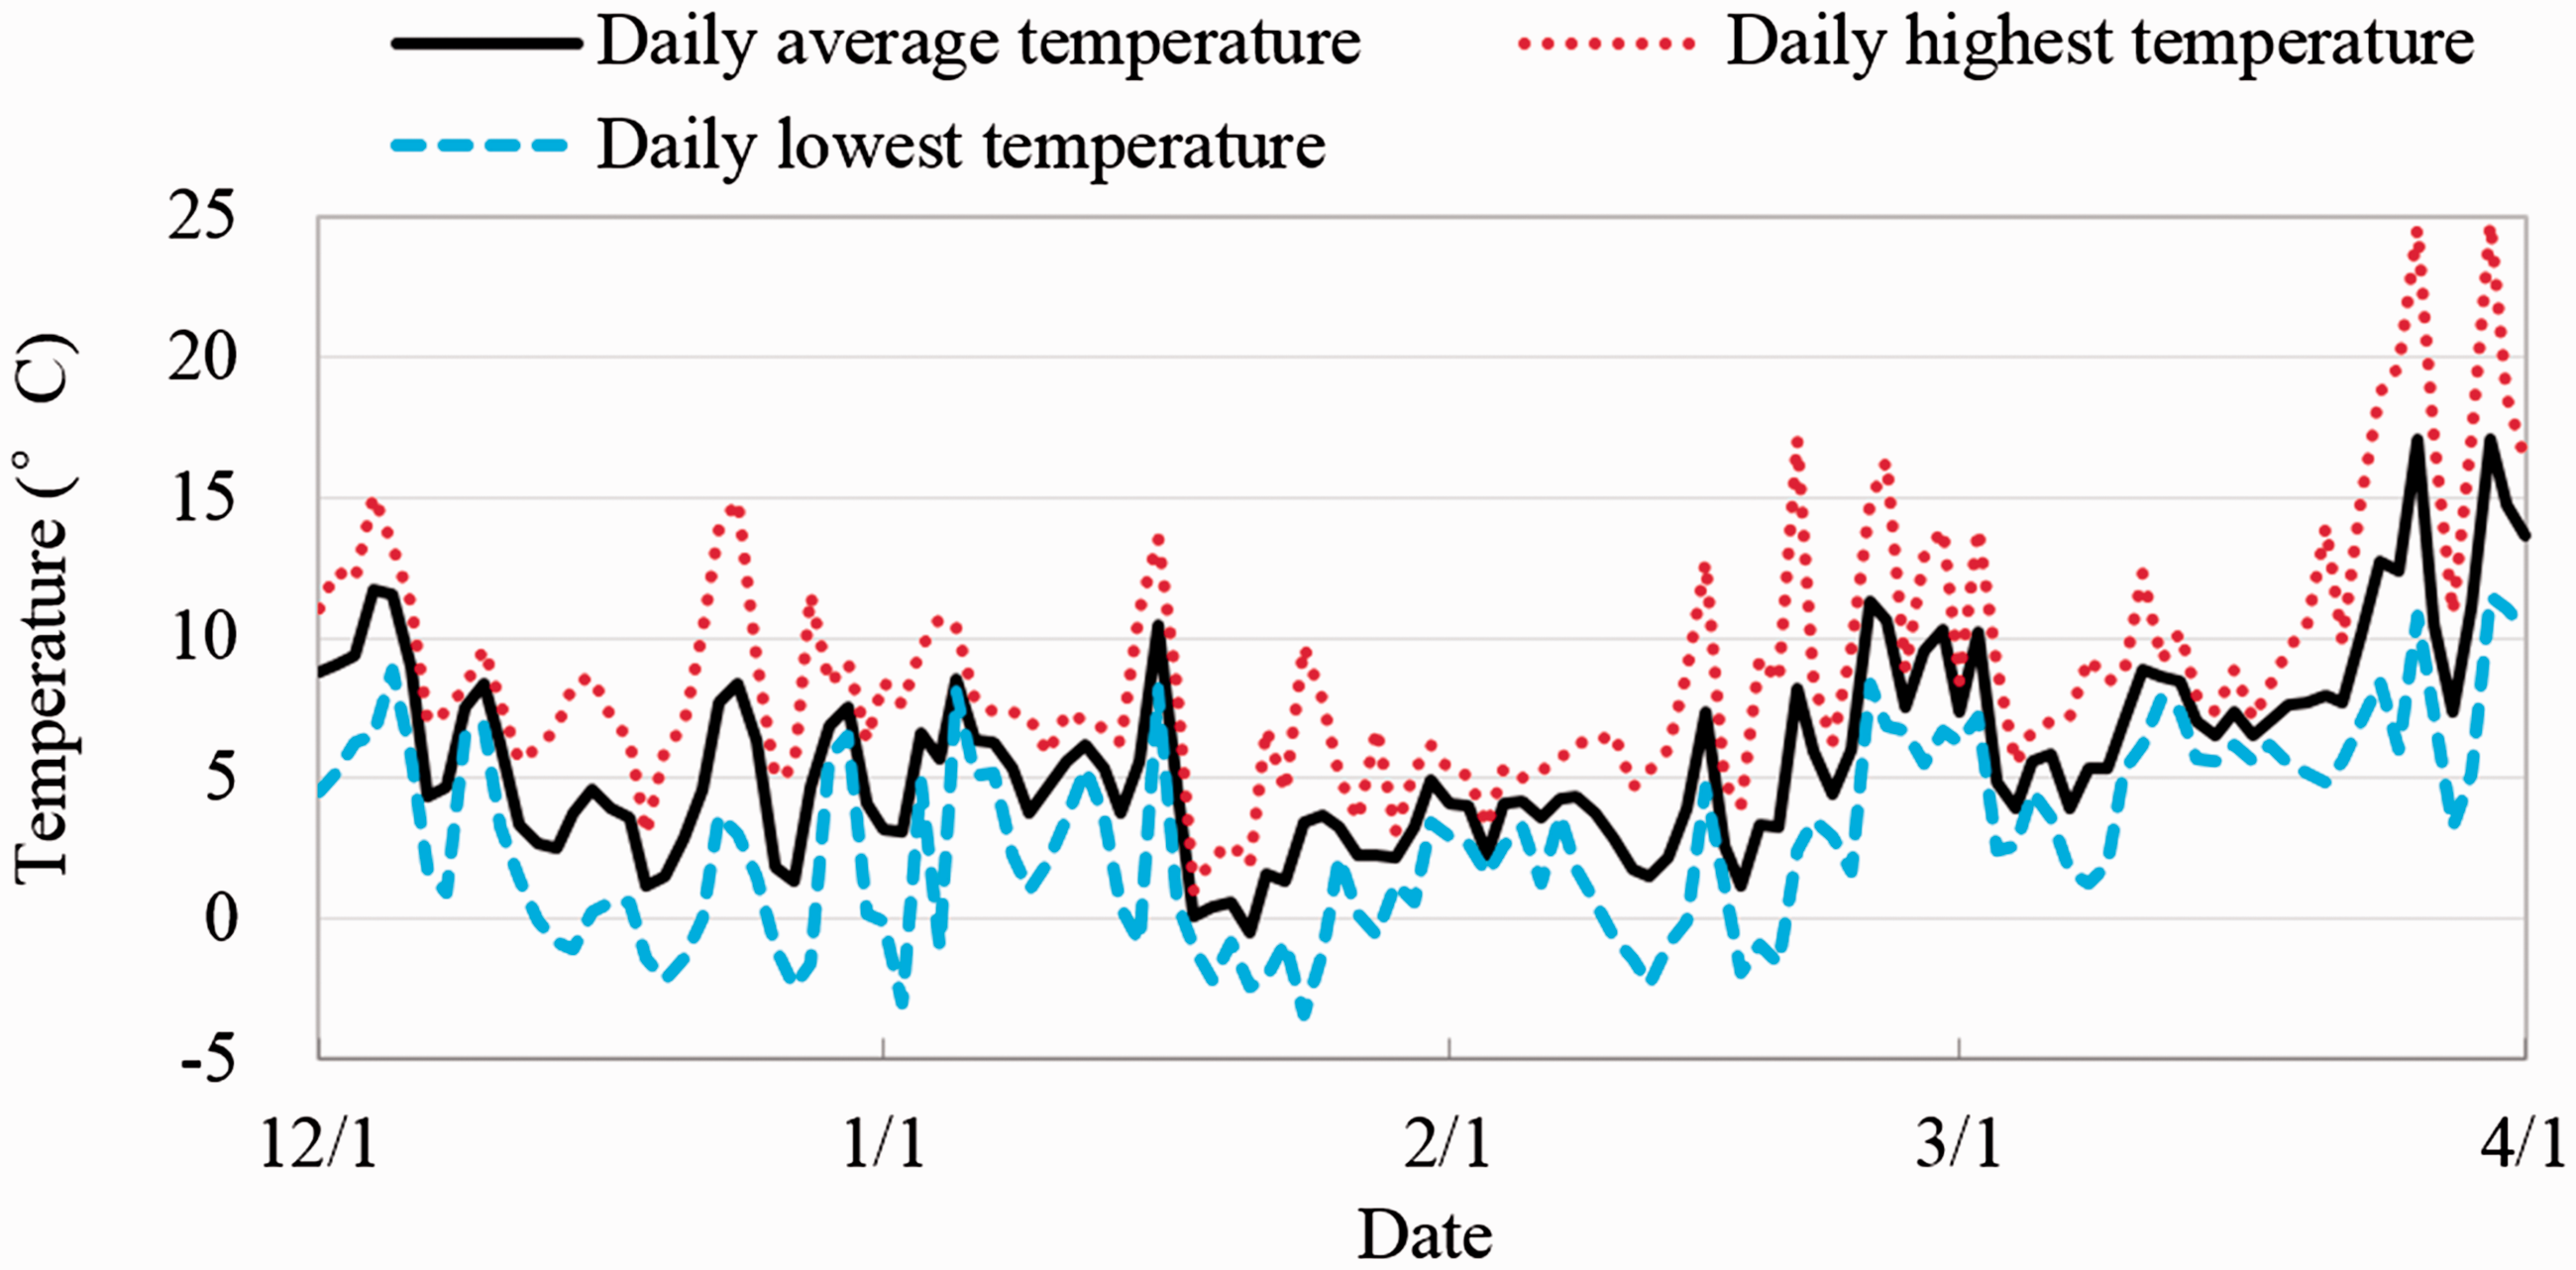
Daily average dry-bulb temperature in Nantong.
The frequency distribution of wind velocity and direction in the heating season of Nantong are shown in Figure 3. The average wind velocity in this city during the heating season is 3.8 m/s. The prevailing wind during the heating season blows from the WNW direction with a frequency and average velocity of 11% and 4.0 m/s, respectively.
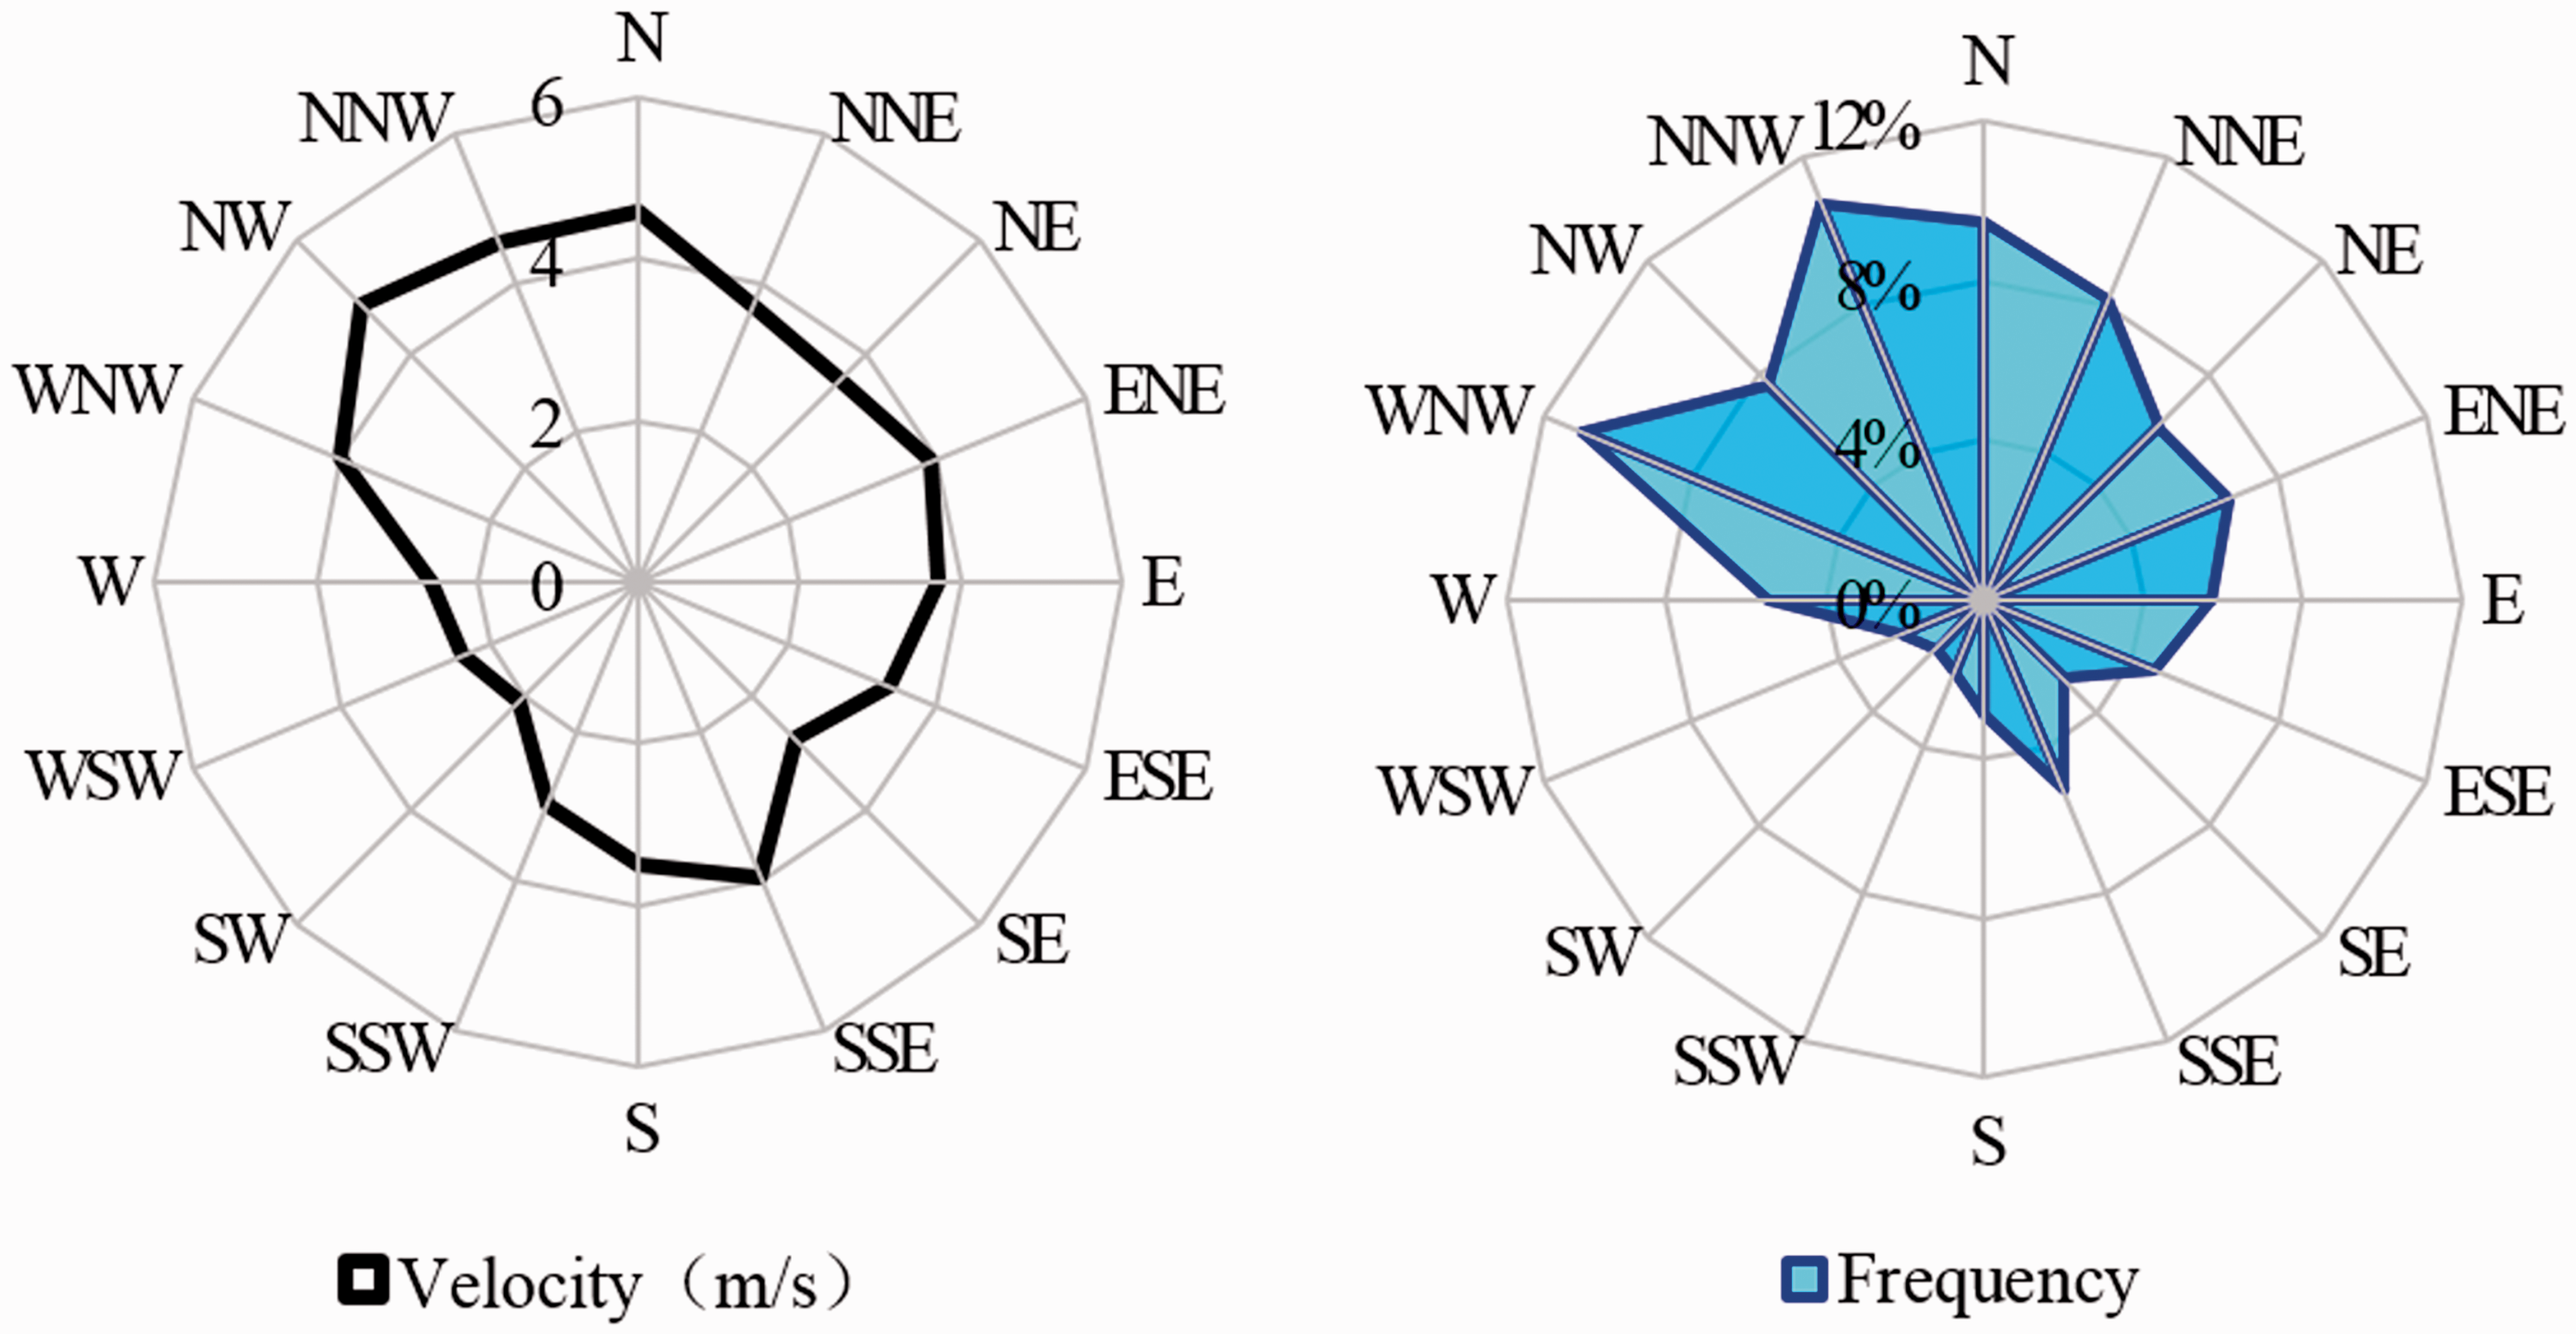
Wind velocity and directional frequency during the heating season in Nantong.
The heating behaviour, window-opening behaviour, average opening area ratio of openable window and indoor temperature obtained from questionnaires were simulation inputs. Based on the 519 completed questionnaires, 519 simulations were conducted to analyse the impact of the different window-opening and heating behaviour on the energy consumption.
The simulation modelled a whole building with 102 apartments to consider the influence of floor area and storeys on the simulation results of space heating energy consumption. According to the analysis of survey results, there is no correlation between building information (such as floor area and storey) and behaviour of occupants. Moreover, due to the random selection of respondents in the surveyed residential community, the probability of the survey households living in each apartment in the community area is the same. Therefore, each apartment in the simulated building was set up with the same schedule when simulating the heating energy consumption under a specific behaviour pattern. Accordingly, the average heating energy consumption of the whole building was calculated to represent the heating energy consumption under the specific behaviour pattern. A total of 519 different behaviour patterns were individually simulated. Finally, the heating energy consumption under the 519 different behaviour patterns were obtained.
Results and analysis
Survey results
Occupant behaviour data
A total of 519 collected samples of behaviour patterns were obtained through the questionnaire survey (99% confidence level, ±5%). According to our survey results, most households adopt intermittent heating, which means that heating facilities are turned off when no one is at home. In general, only rooms with inhabitants have their heat turned on. The survey results also showed that most occupants were in the habit of keeping their windows open for ventilation and that they do so regularly even when the outdoor temperature is low.
The statistics of the average daily heating and window-opening hours from the 519 household surveys are shown in Figure 4, with the number of samples arranged in the order of the mean number of heating hours. The ordinate in Figure 4 is the number of samples, and stripes of different colours represent the average daily operating hours of heating and window-opening in living-rooms and bedrooms in their respective order. According to the survey data, approximately 10% of surveyed households almost never use their heating, and those using heating for more than 6 h constitute 17%.
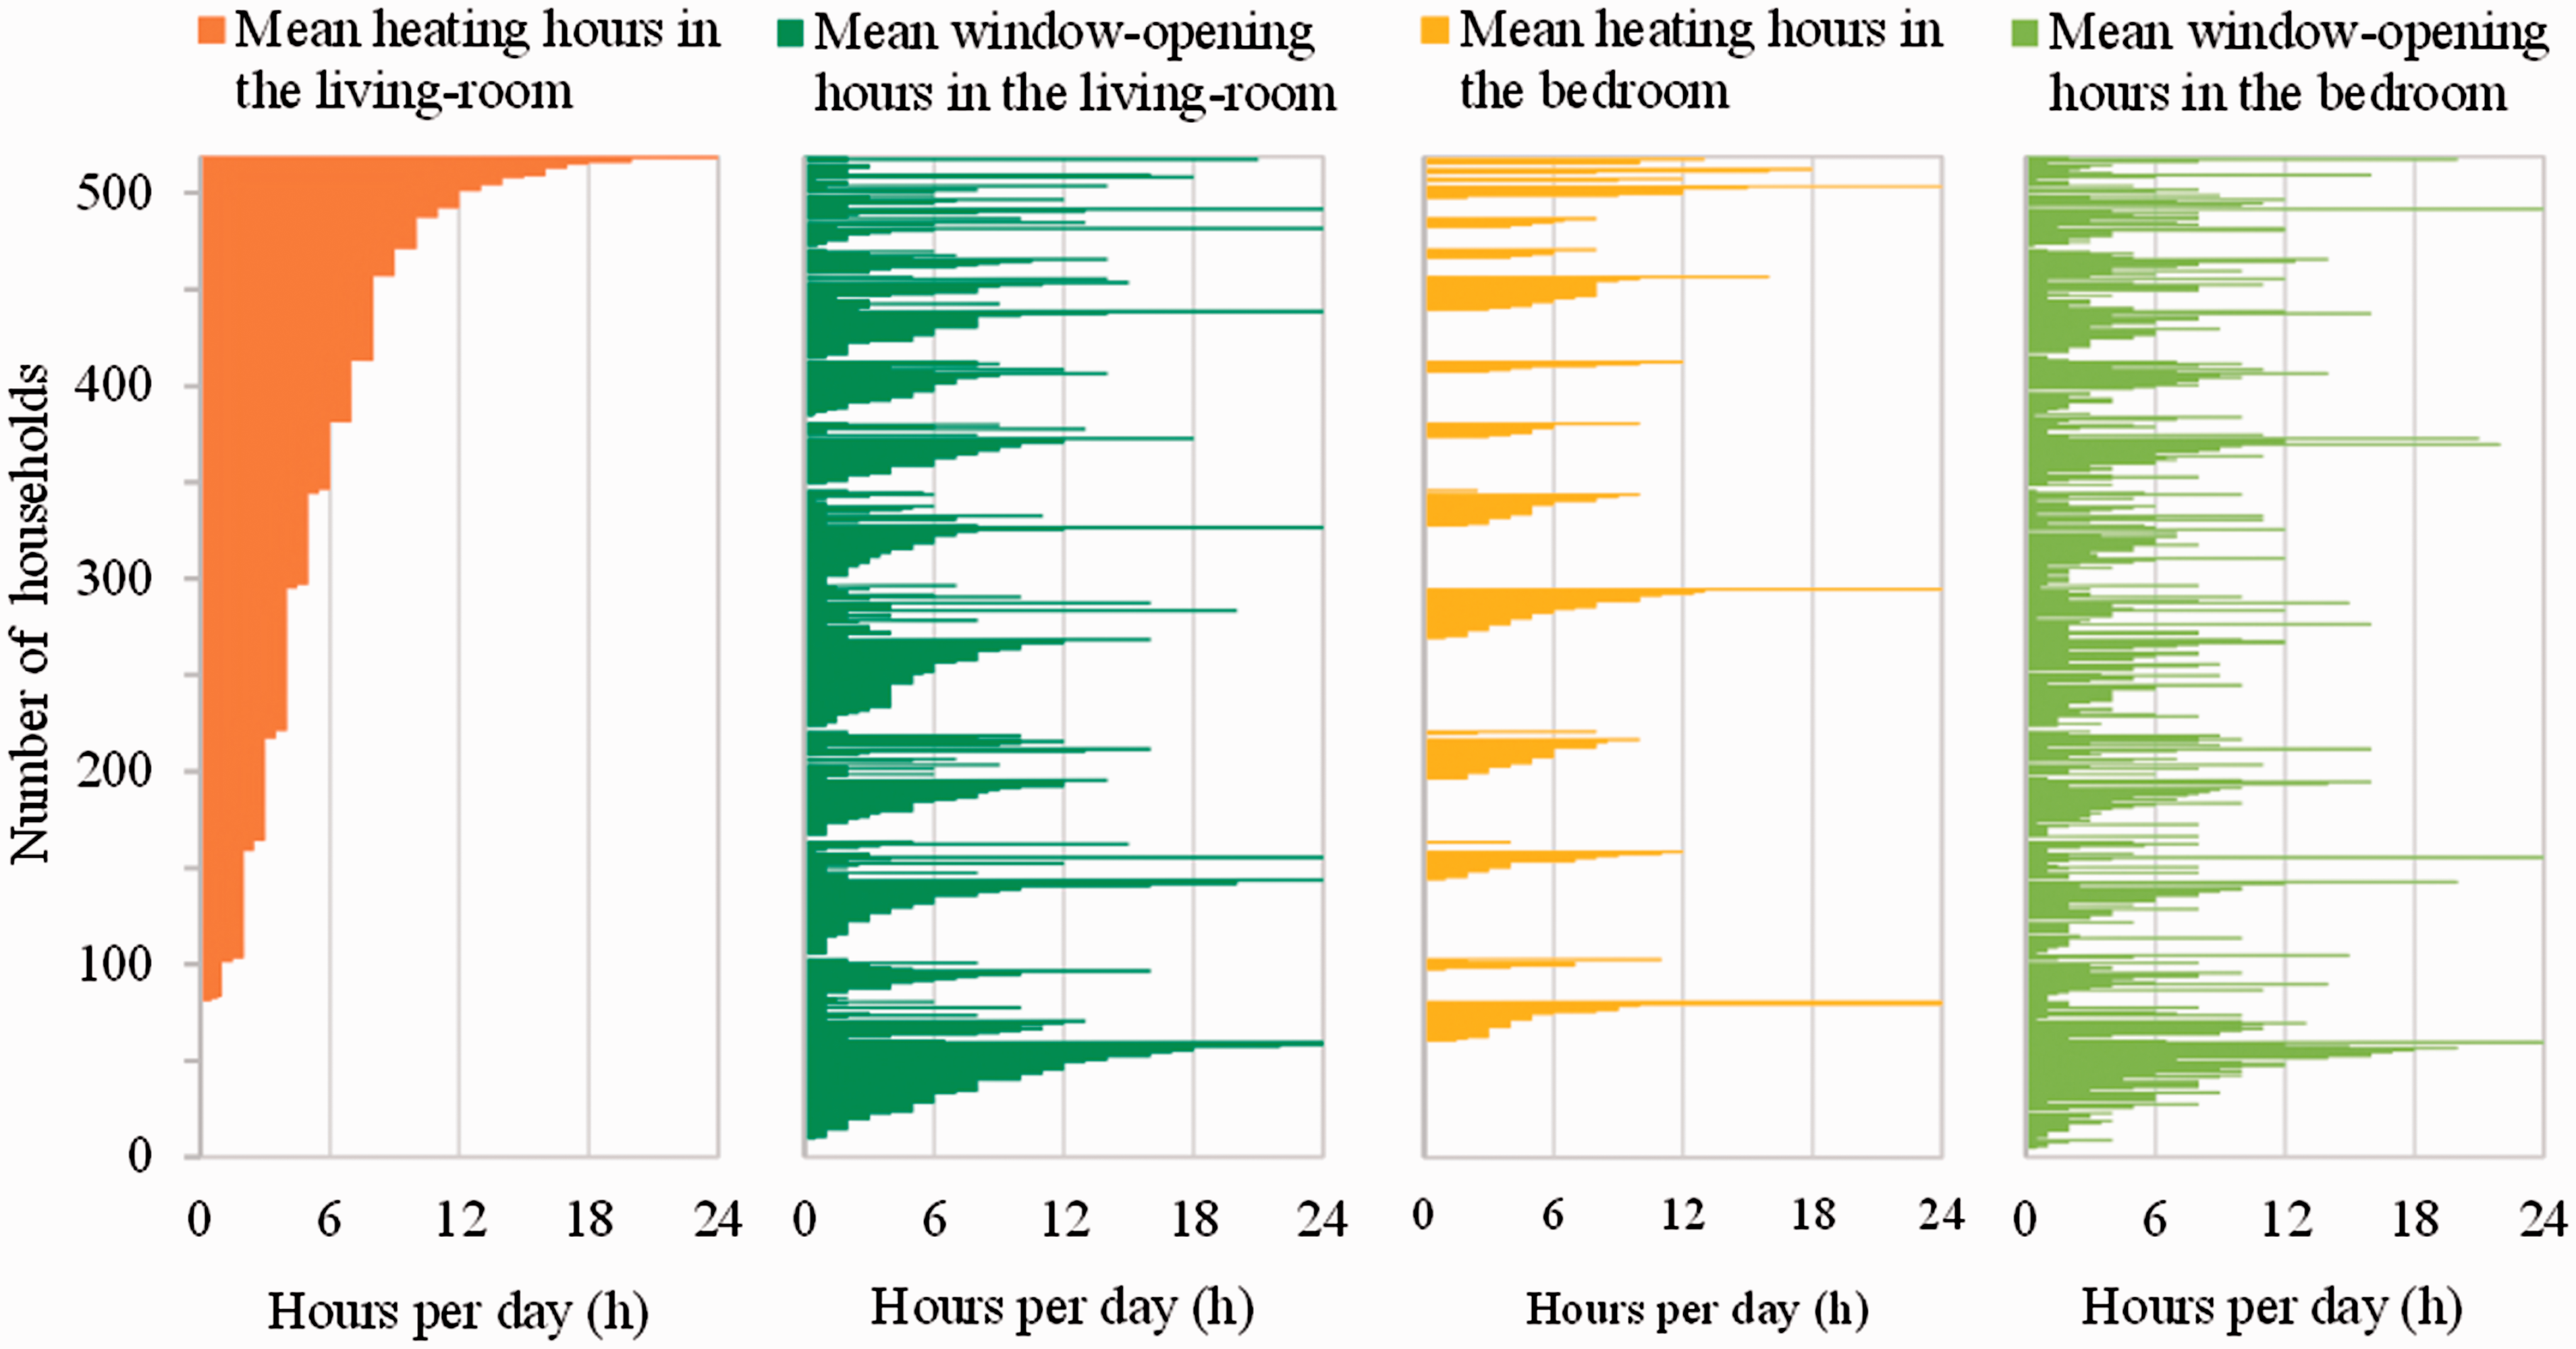
Statistics of the average daily heating and window-opening hours.
Investigation of window-opening habits revealed that only about 3% of households surveyed keep their windows closed in winter, and 11% of households had natural ventilation in winter over 12 h per day. Moreover, most occupants are accustomed to keeping their windows slightly open during the heating season, and close their windows when they feel comfortable after keeping their windows slightly open for a while. For instance, they might keep 10% of windows open for around 1 h of ventilation, instead of opening all windows for 10 min.
Indoor temperature
As mentioned above, most households adopt intermittent heating, and in this case, the indoor temperature is typically set higher than that during continuous heating. According to survey results on the indoor temperature distribution as shown in Figure 5, occupants always keep within a fixed range of indoor temperature during heating, and the set indoor temperature differs greatly between different households. For example, the indoor temperature of 21% of households is between 24–26°C, and that of 81% of households is between 20–28°C during the heating period.
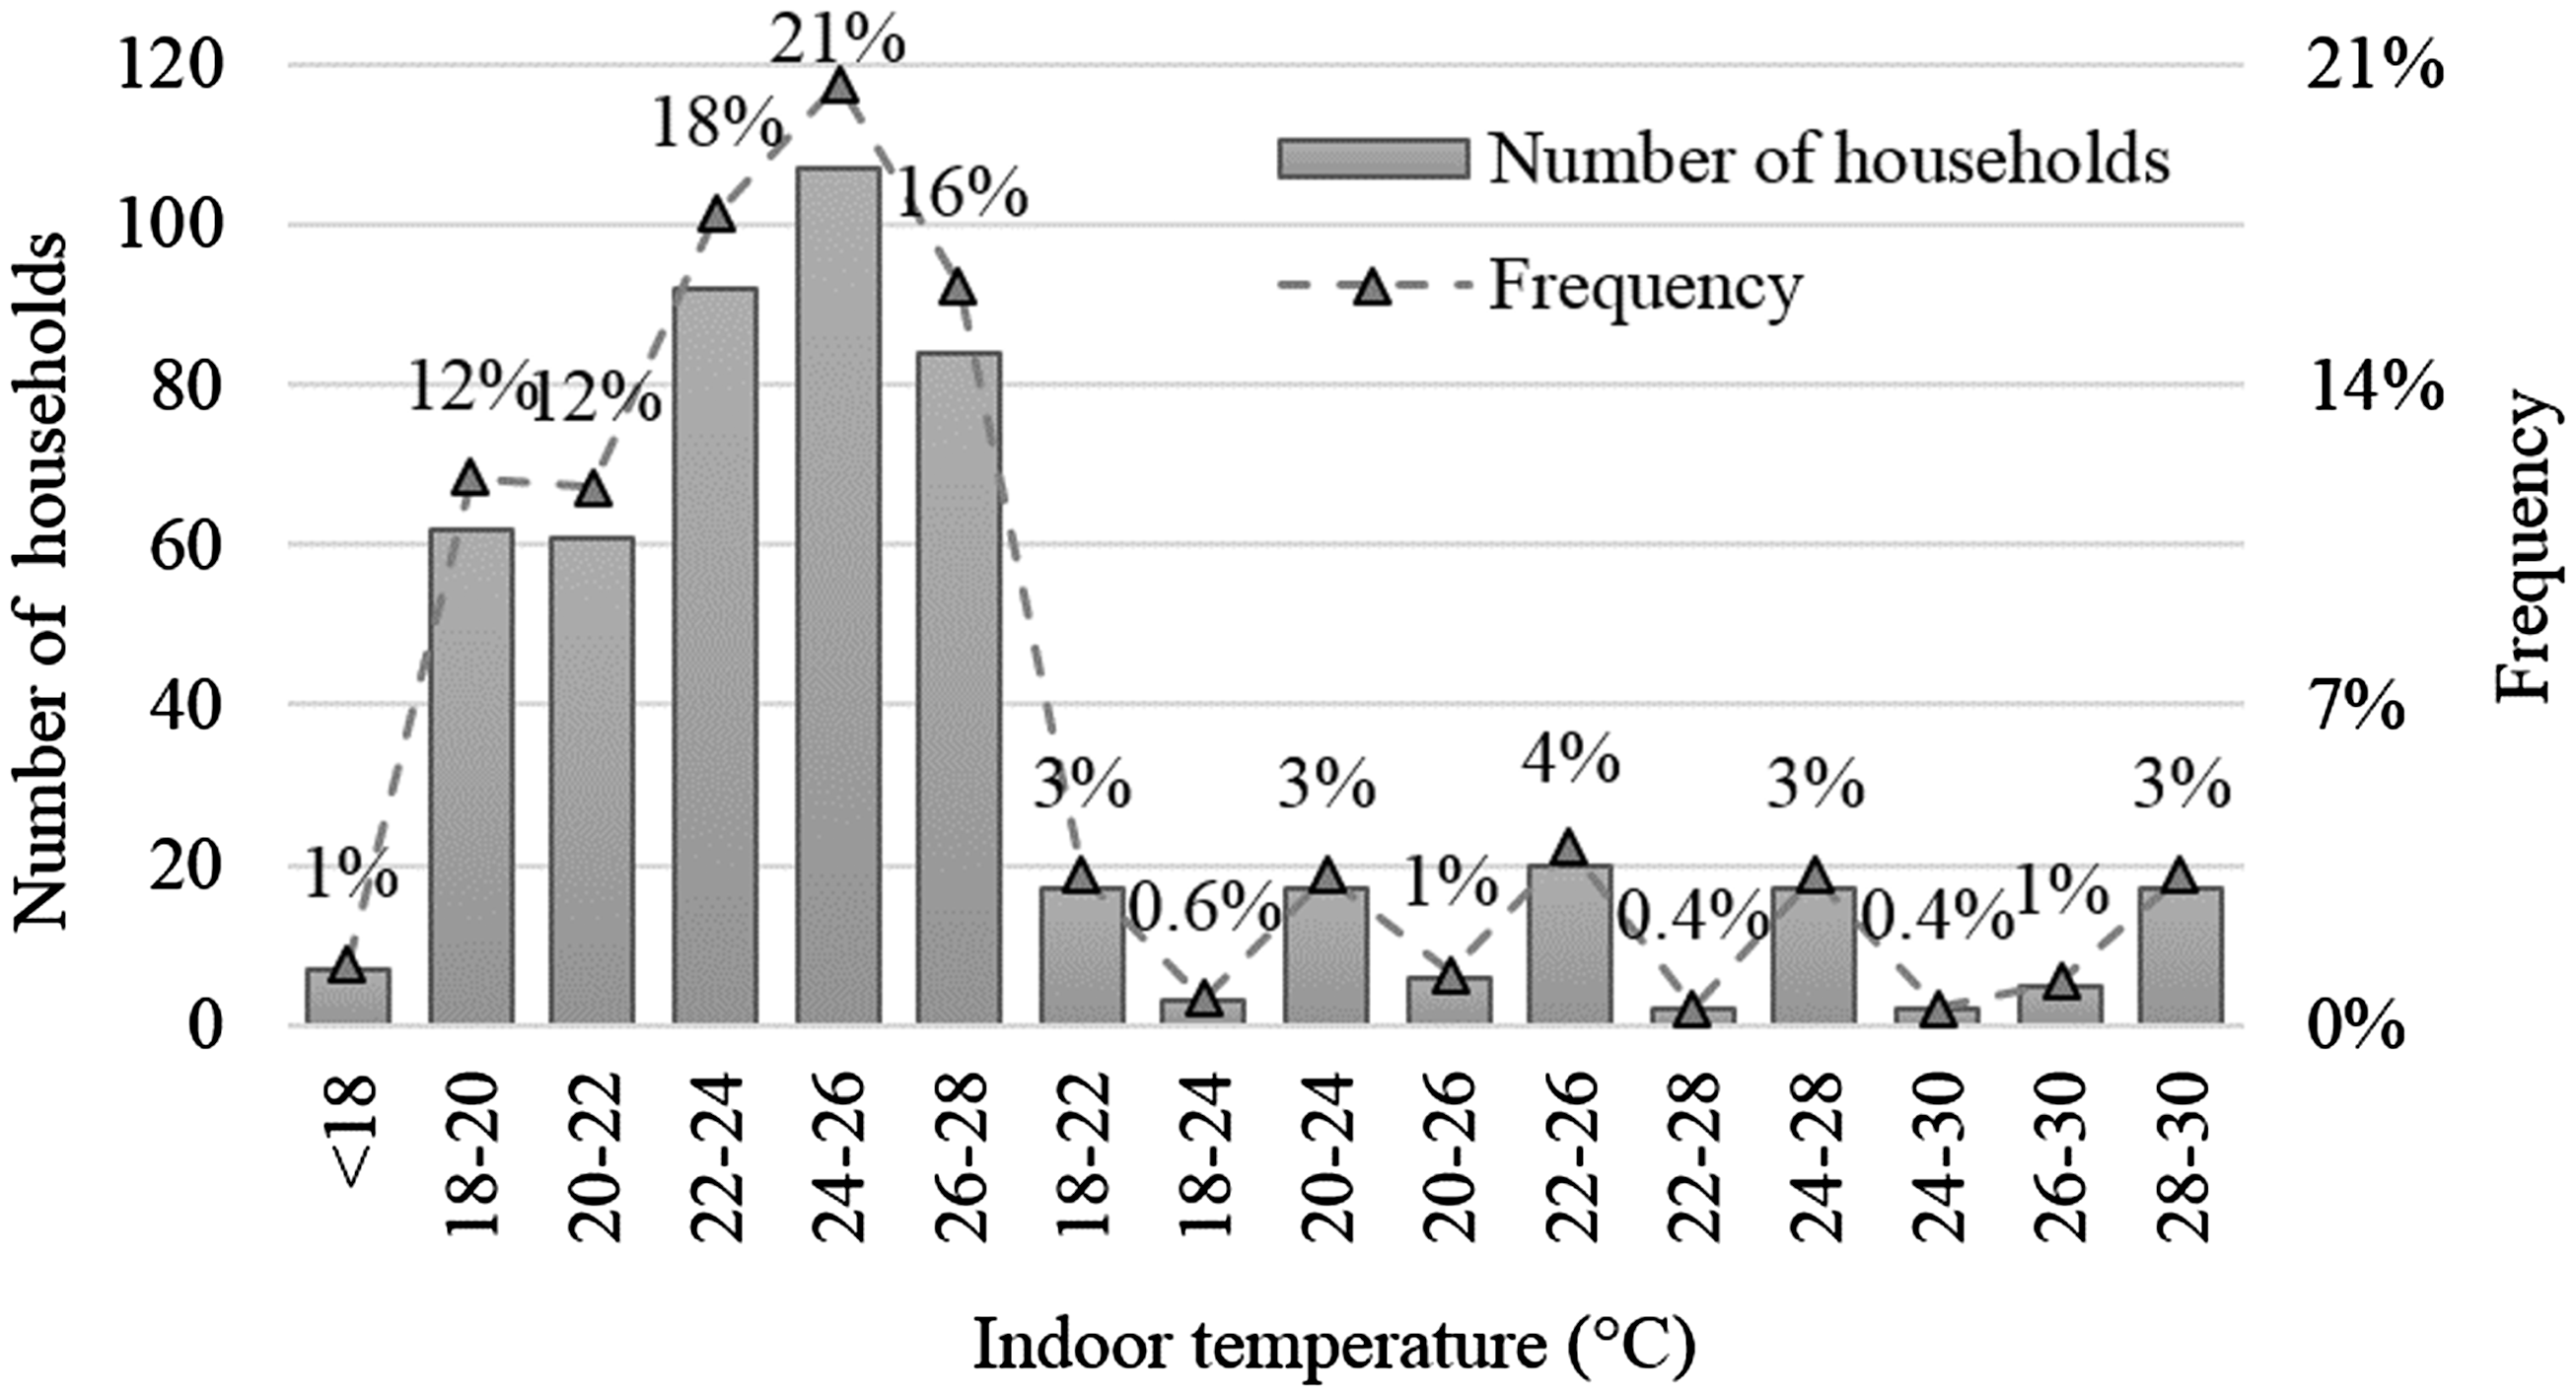
Distribution of indoor temperature during the heating period.
Simulation results
Results analysis
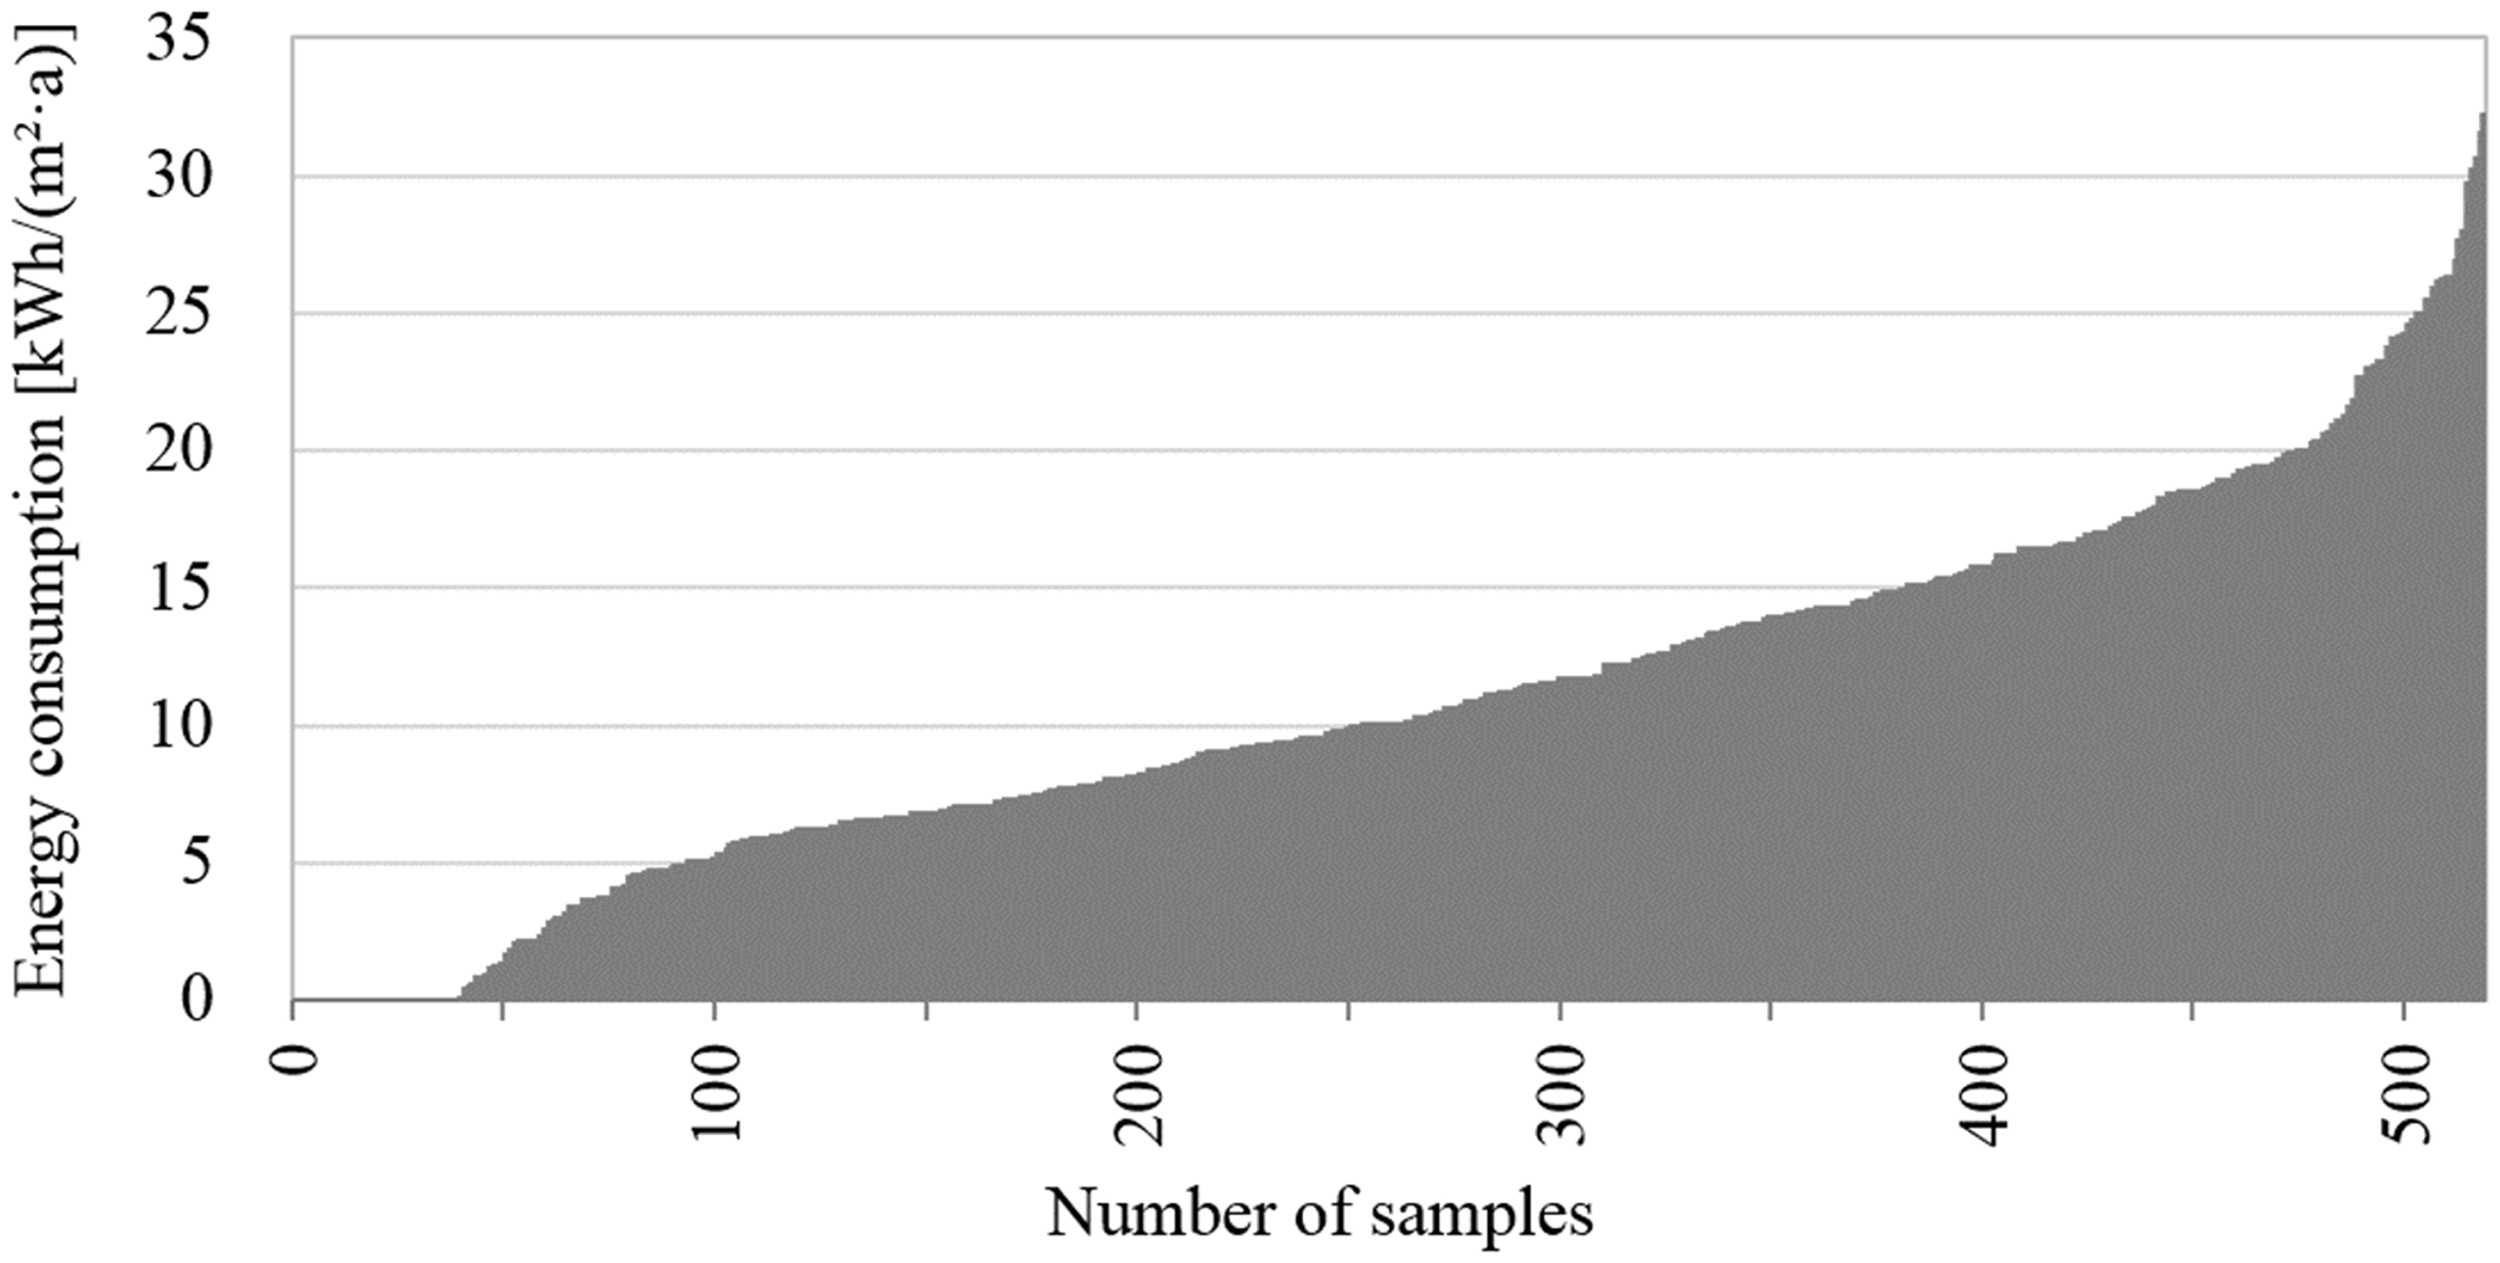
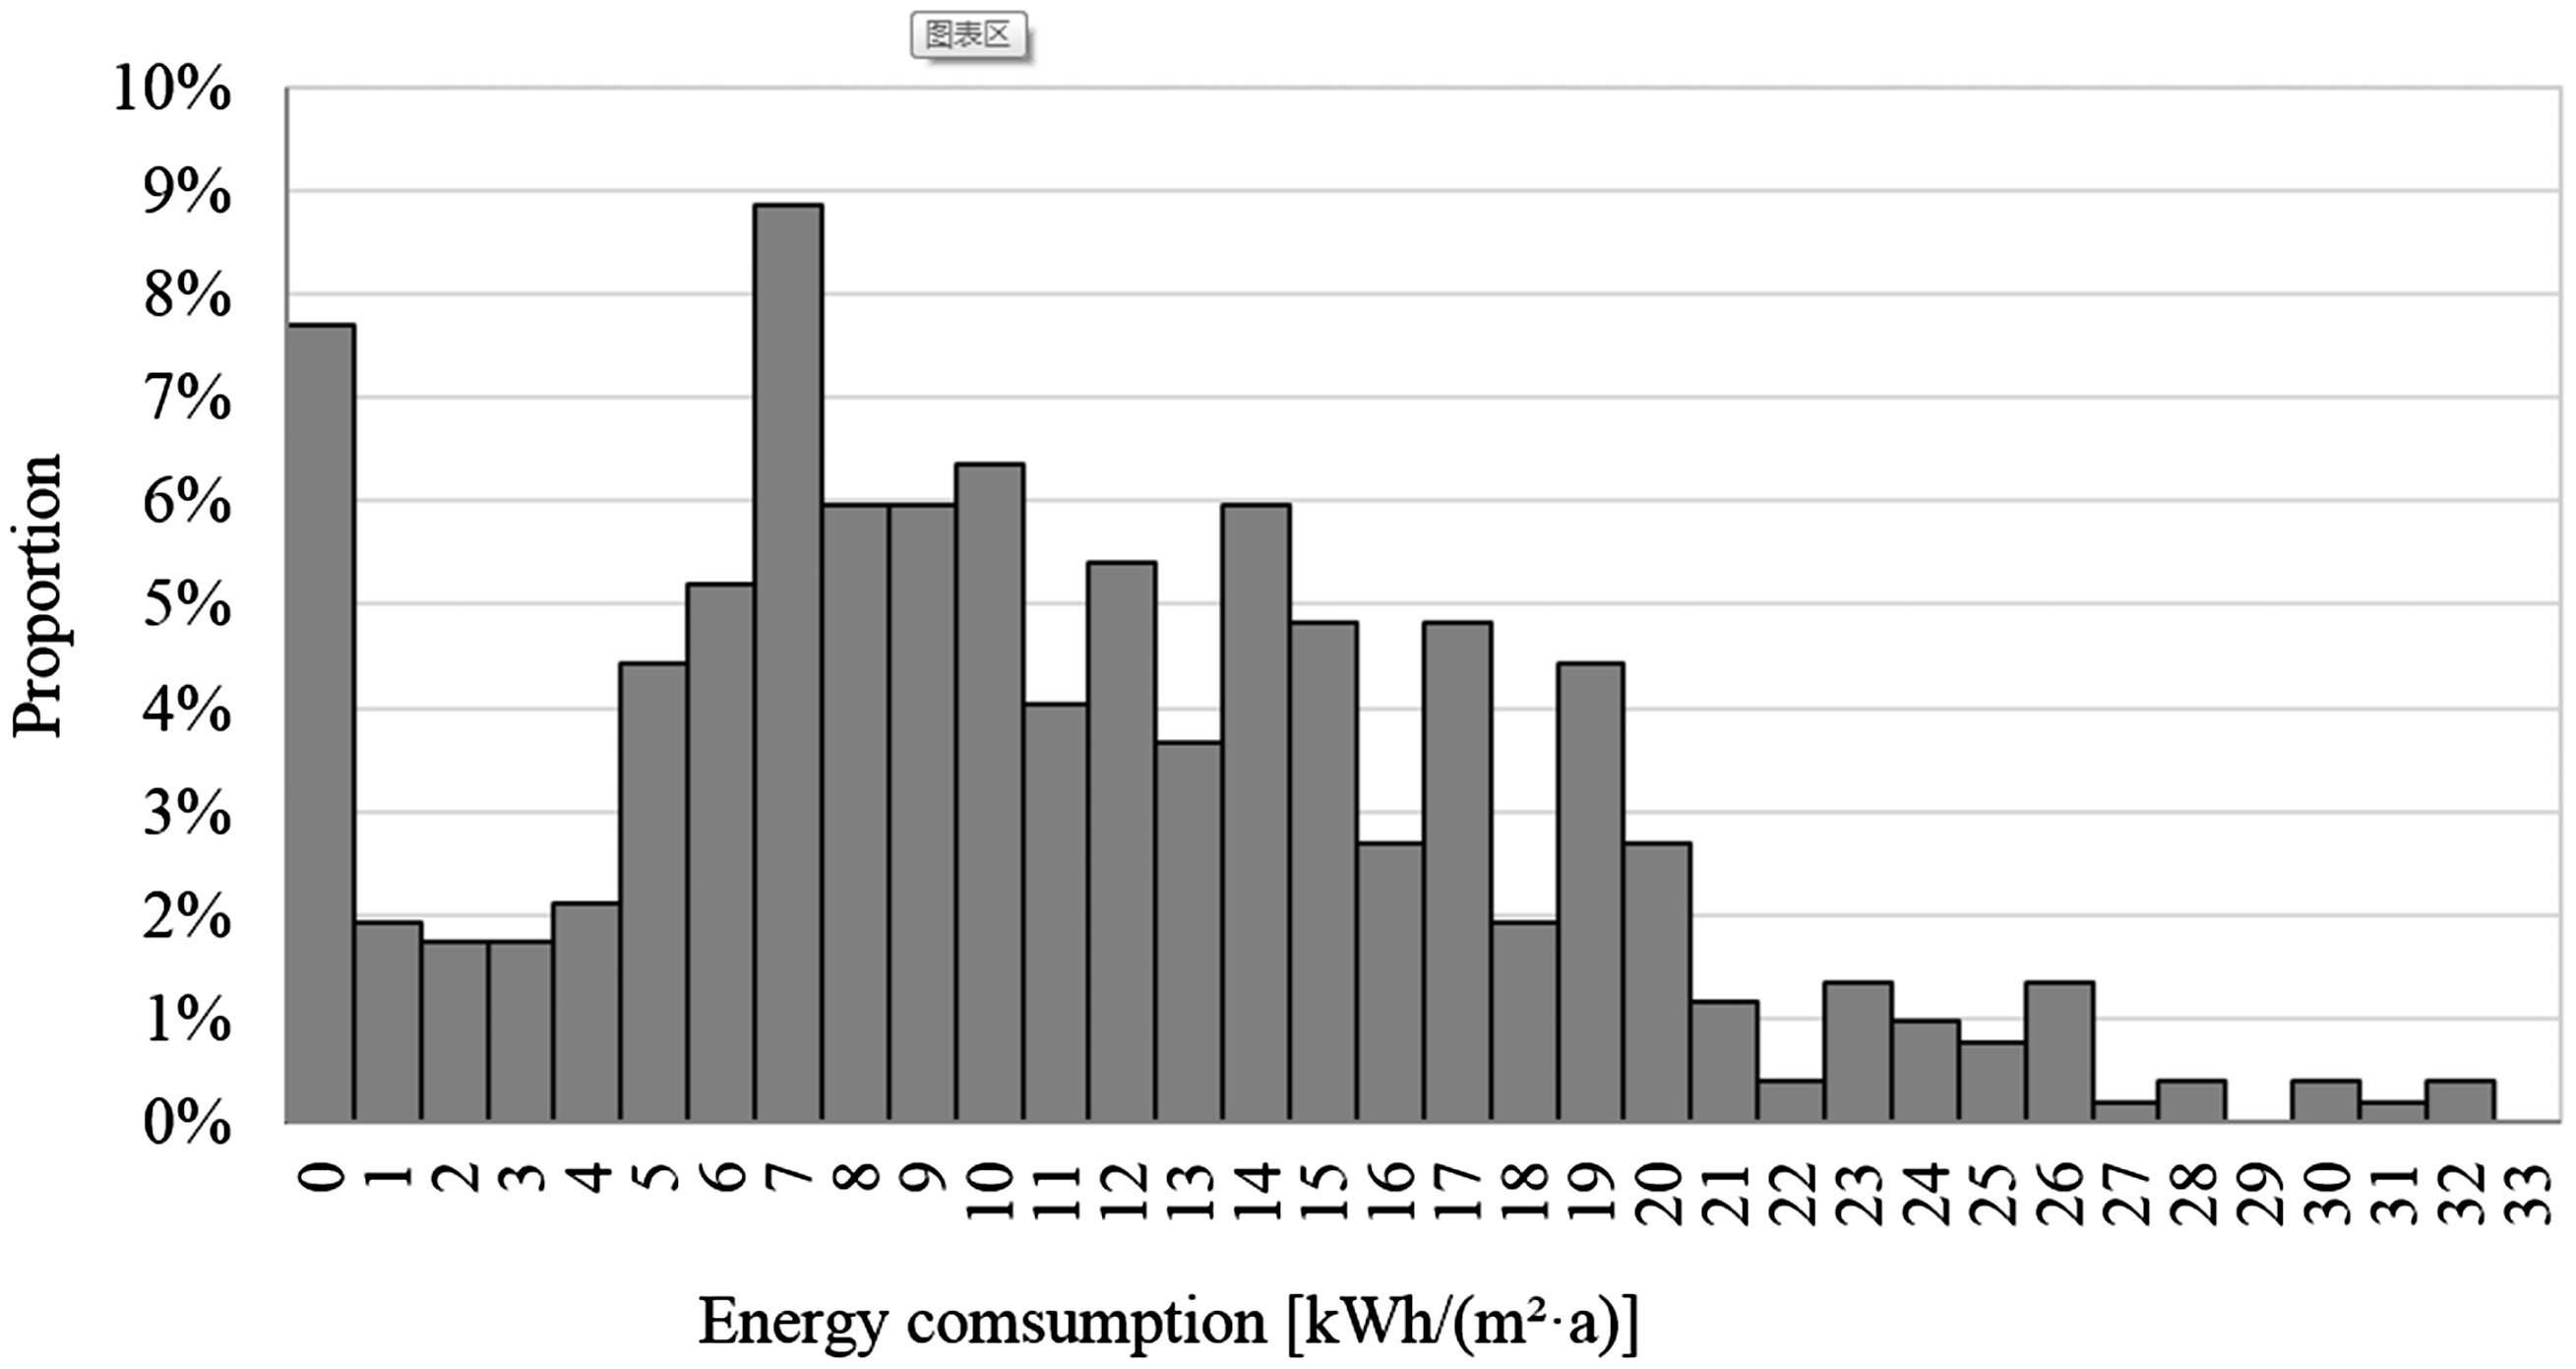
For residential buildings selected in this study, the heating season runs from 1 December to 31 March of the following year. Figures 6 and 7 show results of the simulated energy consumption for heating based on different behaviour patterns. The occupants’ space heating behaviour, window-opening behaviour and indoor temperature were the decisive variables in this study. The indoor temperature operational mode and the heating and window-opening behaviours notably impacted heating energy consumption. Among 519 different simulated schedules, the energy consumption for heating ranges from 0 to 33 kWh/(m2·a), with an average of 11.7 kWh/(m2·a). Approximately 39% of households consume energy at a level higher than average, while over 7% of households consume less than 1 kWh/(m2·a). The latter are households that seldom use heating facilities during the heating season, and they pay a minimal heating bill. In contrast, the consumption level of 8% of households exceed 20 kWh/(m2·a).
Energy consumption for heating under different occupant behaviour patterns.
Distribution of energy consumption for heating over the entire heating season.
Verification
To allow the distribution of energy consumption used for heating to be investigated, the amount of energy consumed for heating by each household in the selected residential community was measured by heat energy metering devices. An ultrasonic heat meter consisting of a flow sensor, a temperature sensor pair and a calculator was installed to measure the heating energy consumption of each apartment in the selected residential community. The ultrasonic flow sensor was used to measure the flow rate of hot water, the temperature sensor pair was used to detect temperatures of the hot water at the supply and return pipes of the apartment, and the calculator was used to receive signals and calculate the amount of energy consumption for heating.
To evaluate the goodness of fit between the simulated and actual values, the statistical indices R-squared (i.e. R2), coefficient of variation of root mean square error (CV-RMSE), and percent error were used in this study. 53 Since the amount of actual heating energy consumption data points is greater than that of simulated values, the 1625 actual data were processed into 519 data by a linear difference method when calculating the percent error.
The heating season of this area ranged from 1 December 2014 to 31 March 2015, lasting for a total of four months. Figure 8 compares the simulated energy consumption based on the survey, the actual energy consumption and the percent errors between simulated and actual values. The simulated results based on survey data are mostly consistent with measured results, and simulated results of the energy consumed for heating with an average of 11.7 kWh/(m2·a) are close to the actual consumption (11.5 kWh/(m2·a)). The percent error of the average heating energy consumption was 1.7%.
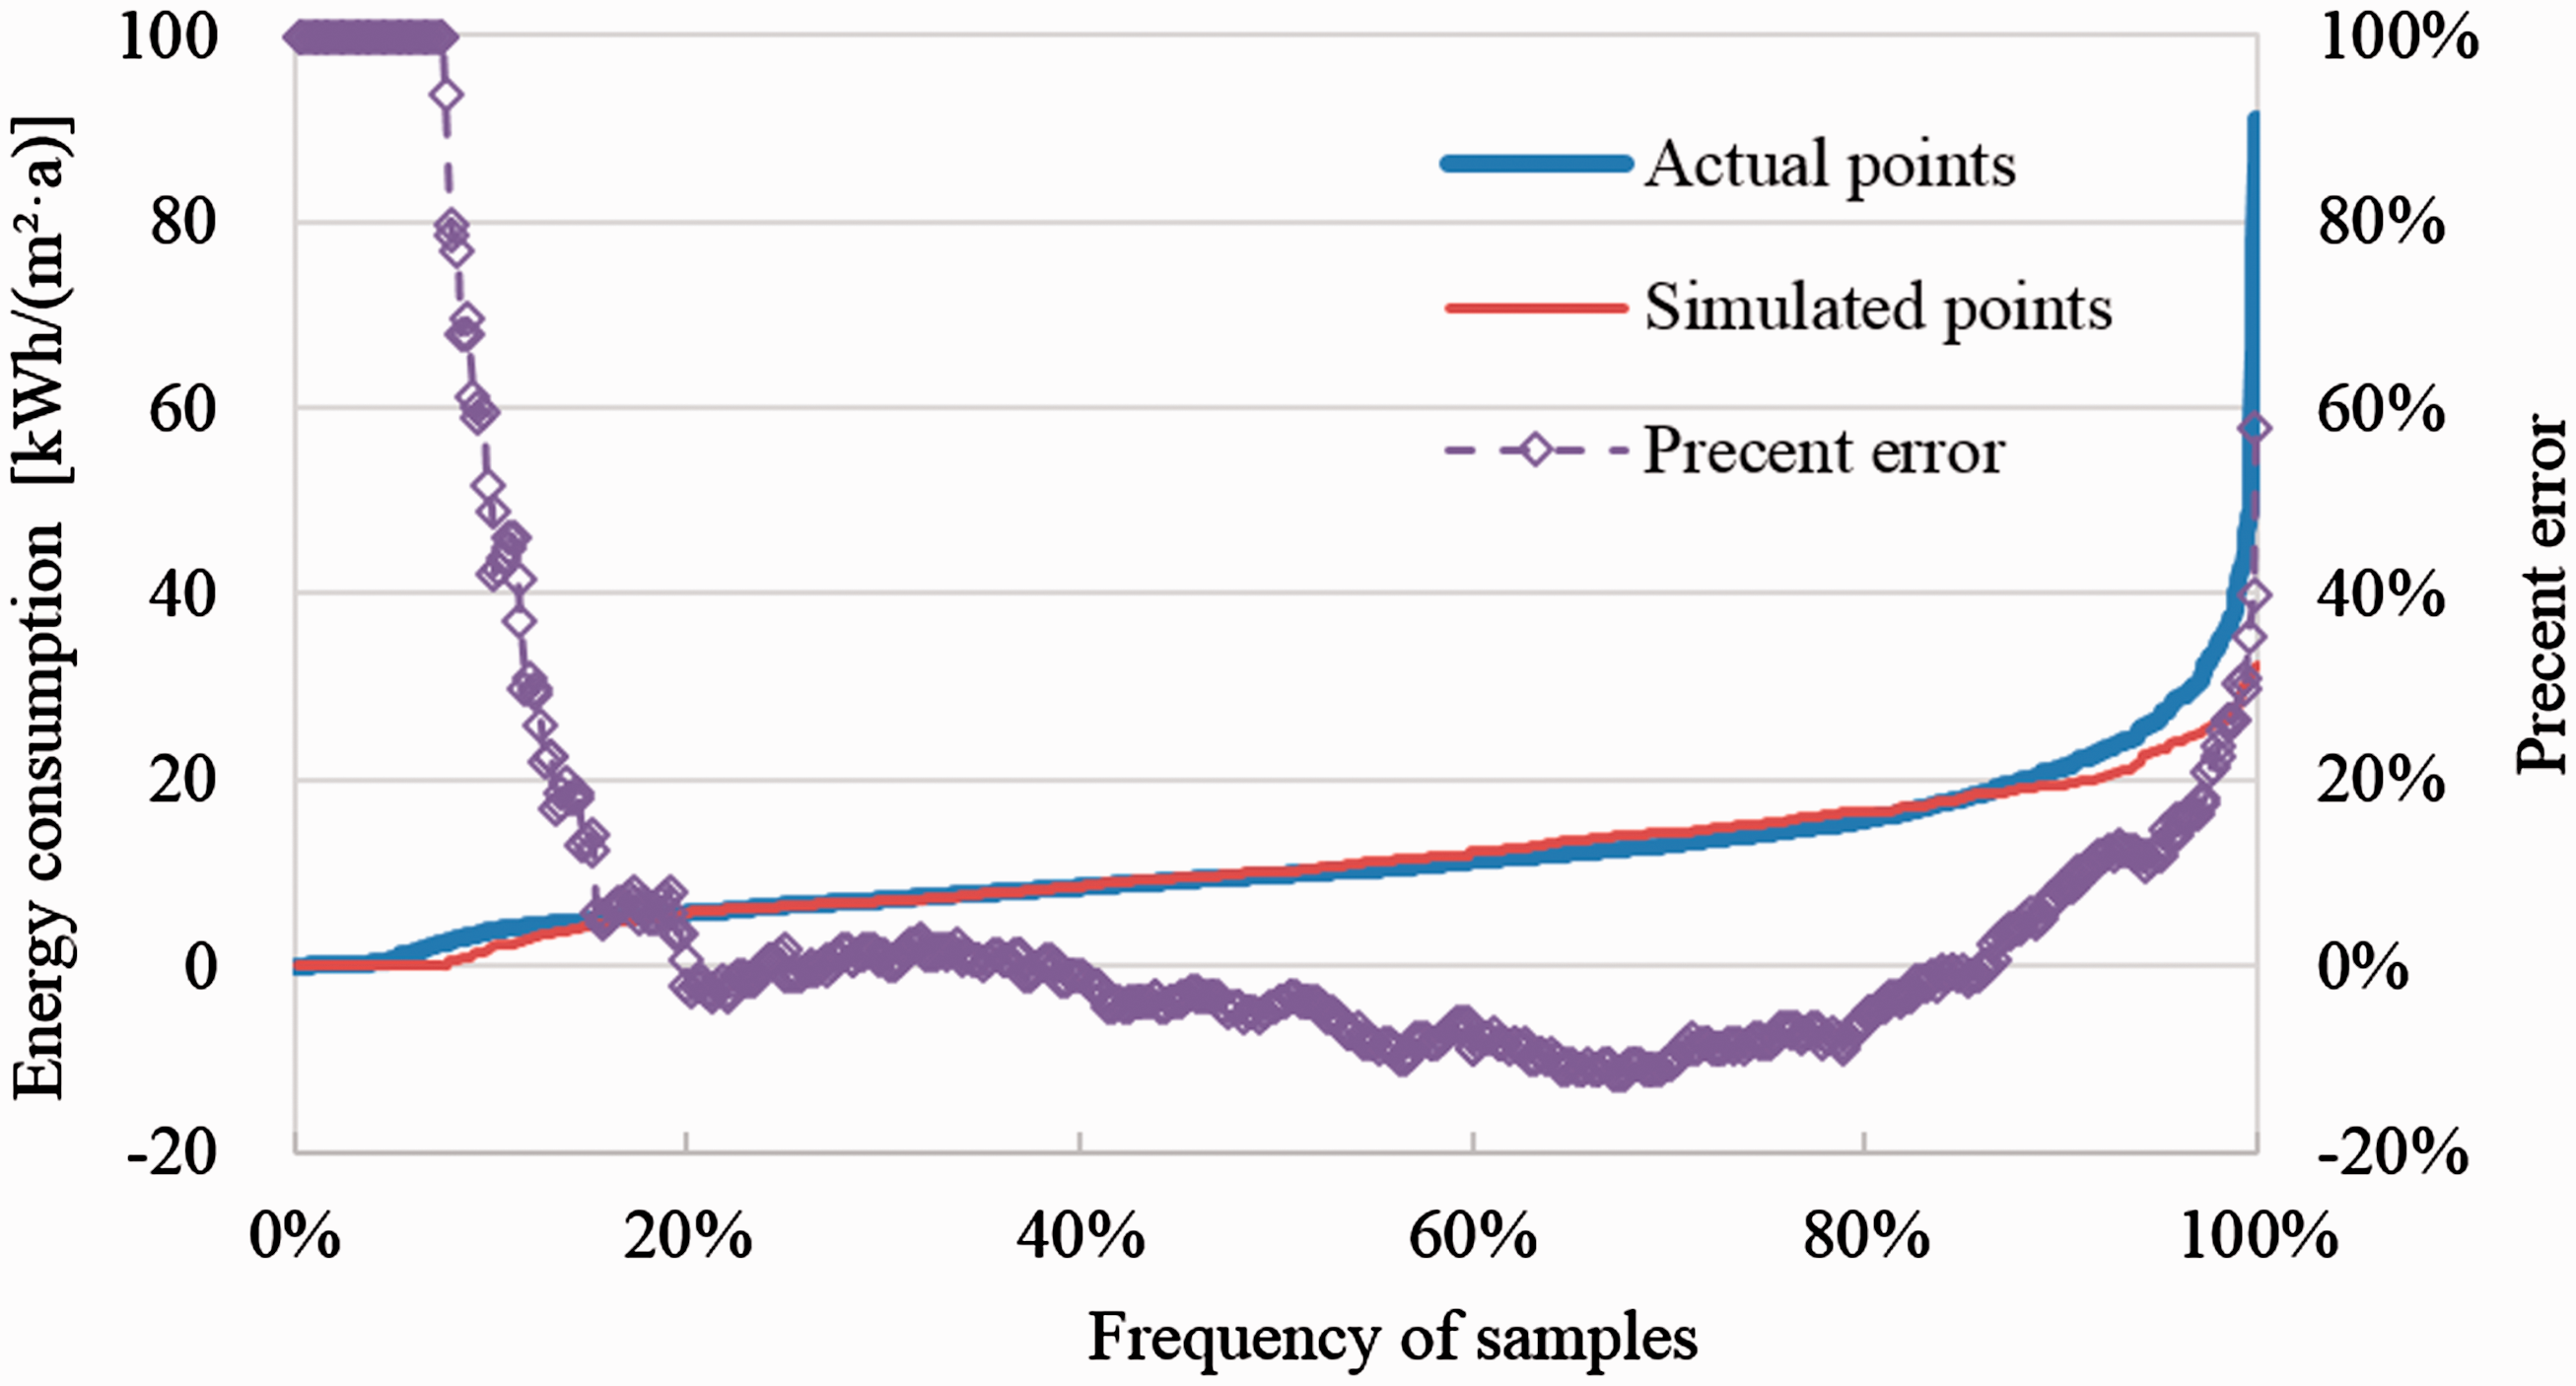
Comparison of the simulated results and actual heating energy consumption.
Generally, an R2 value exceeding 70% is considered acceptable, and a CV-RMSE value from below 15% to 30% is considered to be a good model. 53 In this study, the results show that the R 2 and CV-RMSE values from the analysis were 87% and 26%, respectively, which are considered acceptable and indicate that the heating energy consumption of the simulation model is in good agreement with the actual data from the studied population.
As shown in Figure 8, the larger percent errors were observed in the intervals with the lowest and highest heating energy consumptions. Compared with previous research results, the inaccuracy of 13% to 19% is considered acceptable in comparison between actual and predicted annual energy consumption. 54 Thus, the studied households are divided into three intervals by taking the percent error of 15% as a segmentation point, as shown in Figure 9. In Figure 9, a further comparison between simulation results and actual data is shown, including differences between the actual and simulated (i.e., Error = Eactural − Esimulated) values and percent errors.

In the first interval (from 0 to 15% of Figure 8), the population with the lowest heating energy consumption, the percent errors are greater than 15%, as shown in Figure 9 (a1) and (a2). The underestimation of their heating hours by occupants could be a cause of this result. However, results are acceptable as the impact of this group of samples on the total heating energy consumption is only about 2%.
In the second interval (from 15% to 95% of Figure 8), simulated values exhibit a percent error of −12% to 15%, as shown in Figure 9 (b1) and (b2). The total heating energy consumption of this group accounts for approximately 86% of the total energy consumption of the studied population. This group of samples appeared to accurately predict the specific heating energy consumption.
In the third interval (from 95% to 100% of Figure 8), the population with the largest heating energy consumption, the percent error is greater than 15%, as shown in Figure 9 (c1) and (c2). The total heating energy consumption of this group accounts for approximately 12% of the total energy consumption of the studied population. This was due to occupants’ underestimation of their heating hours. This group of results is considered acceptable, because there were only 0.8% of the studied population which had a percent error of more than 30%.
Therefore, the model used in this study can be considered, to accurately predict the actual heating energy consumption distribution of the investigated households.
Discussion
An understanding of residential heating energy consumption and its distribution has a great significance for guiding policy formulation and the promotion of energy conservation technology. Such energy consumption data are usually obtained from large-scale and high-cost field measurements. However, there are no large-scale installation of measuring instruments in many regions at present because of cost. Therefore, this paper provides a feasible approach to obtain the distribution of space heating energy consumption for the whole heating season in a large-scale area of urban households. A residential space heating energy simulation model based on a survey of occupants’ behaviour was used to calculate the annual heating energy consumption.
The ideal sample size was determined to accurately estimate target households. This paper verifies the accuracy of the model by confidence level of 99% and 5% margin of error with the sample size of 519. 44 Thus, to assess the workload of large-scale research, Figure 10 gives a rough estimate of the sample size required for different target households. Based on sample size determination, a sample size of 666 is required for more than 1 million target households. Thus, the workload of using this method based on survey conducted to simulate and predict the heating energy consumption is considered to be acceptable.
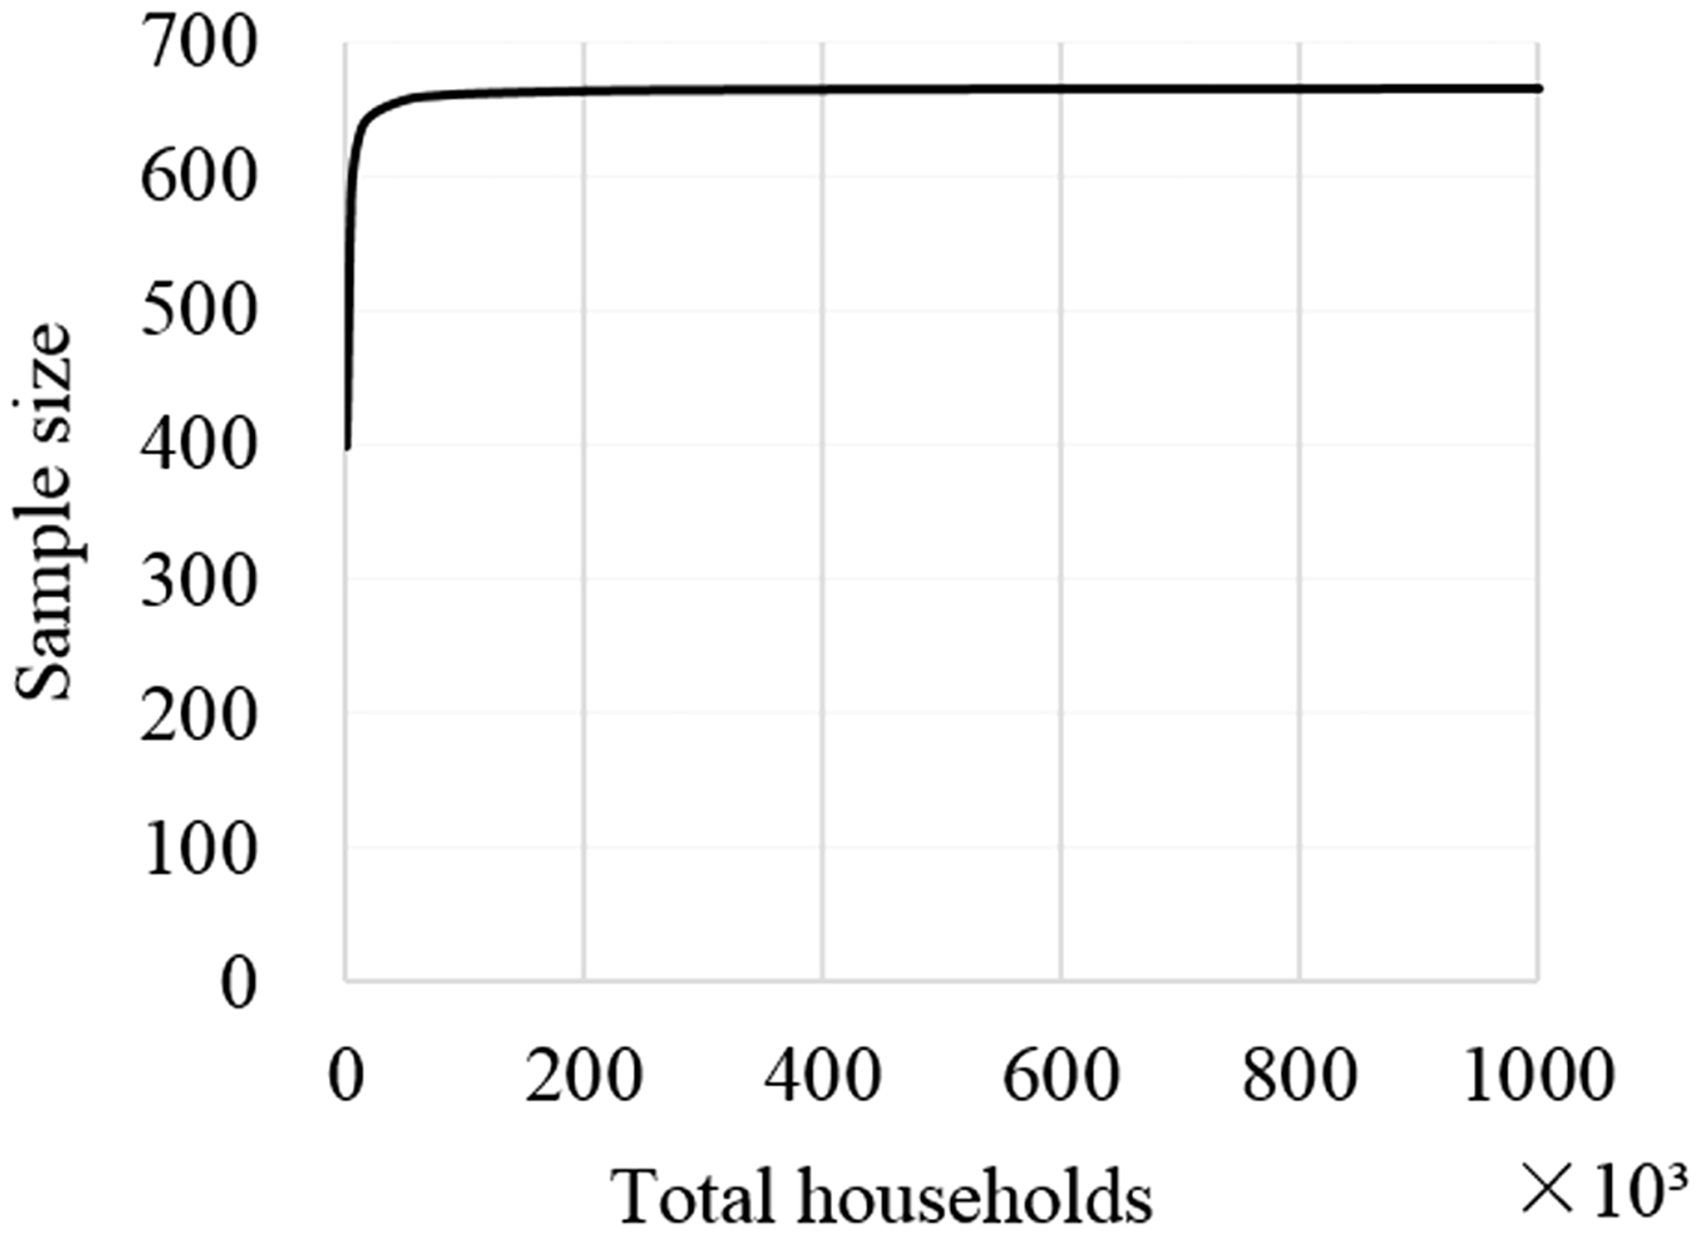
Sample size for different target households.
Conclusion
The purpose of this study was to provide a feasible approach for obtaining the distribution of the total space heating energy consumption for the whole heating season of a large population in the HSCW region. Therefore, a questionnaire survey of occupants’ behaviour with regard to heating and window-opening behaviours, as well as the indoor temperature, was conducted in a residential community in Nantong. Then, the distribution of the annual space heating energy consumption was simulated based on the survey’s results. The reliability of the simulation results was verified by comparing these results with the actual heating energy consumption. The analyses show that the method used in this paper can accurately predict the distribution of the actual heating energy consumption for the entire heating season. This method can be used to investigate and predict the space heating energy consumption over the whole heating season for a large number of dwellings in China’s HSCW region and areas with similar needs.
Footnotes
Authors’ contribution
All authors contributed equally to this paper.
Declaration of conflicting interests
The author(s) declared no potential conflicts of interest with respect to the research, authorship, and/or publication of this article.
Funding
The author(s) disclosed receipt of the following financial support for the research, authorship, and/or publication of this article: This work was sponsored by the National Science Foundation of China (no. 51521005).