






Abstract
Overheating in buildings is one of the increasing concerns related to climate change and can lead to an increase in heat-related health issues and higher energy consumption due to the use of air conditioning systems. Literature shows that internal conditions and demand on environmental control systems can vary with height within buildings. However, an architectural trend towards highly glazed façades for tall buildings suggests the vertical gradient of performance is not always considered in the design process. By simulating a high-rise residential building in London, a comparative analysis of the overheating risks and daylighting at different levels in the building was conducted. In this study the model was able to consider the influence of surrounding built environment on solar gain and so influence of urban location on overheating risk was taken into account. Simulations were conducted using typical reference years as well as meteorological data for specific heat-wave periods experienced in London and that are expected to become more intense and frequent due to climate change. Passive mitigation options (external shading) are demonstrated to help reduce overheating occurrence by 74%, at the same time the impact of decreased daylighting (30%) is less problematic at higher levels where daylight factor is greater.
Keywords
Introduction
Overheating in buildings is a growing issue across many countries with differing climates in Europe. According to Brotas and Nicol, 1 the drive towards improved thermal performance of buildings during the heating season has led to overheating problems during summer. The majority of European building regulations focus on winter heating and fuel efficiency, with emphasis on airtightness and heat loss. However, an expected increase in frequency and intensity of heat waves due to climate change, 2 and milder winters projected within the lifetime of current building stocks, makes it increasingly important that buildings are optimised for both heating and cooling efficiencies.
Europe experienced a heatwave during the summer of 2003 with temperatures 3 to 5°C higher than the average for the season, the extremely high temperatures resulted in an excess of 35,000 deaths for the period. 3 Of these excess deaths, 2000 occurred in the UK, 4 making evident the need to evaluate the risk of relatively high temperatures, even in regions with temperate climates. Since Klepeis et al. 5 first demonstrated the high proportion of time spent indoors in US populations, concern over the implications of prolonged exposure to potentially harmful indoor environments has grown. 6 Within this wider concern of poor indoor environment exposure, indoor overheating represents one of the biggest heat-related health risks in European countries as a combination of ageing demographic and people spending over 70% of their time indoors.4,7
One of the most significant impacts of climate change will be the exposure to more frequent heatwaves with higher temperatures. Since the 1960s, the yearly number of hot days in Europe has been rising and it is expected that the temperatures experienced in heatwaves such as of 2003 will be closer to typical summer temperatures by the 2040s. 8 Even in Sweden (a cold climate 9 ) Dodoo and Gustavsson10 were able to demonstrate increased cooling demand and overheating risk under climate change scenarios.
Whilst this study is presented with a UK case study, the Building Regulations in the UK do not currently stipulate the criteria of overheating and no statutory maximum limit for internal air temperature is given. 11 The Chartered Institute of Building Service Engineers (CIBSE) 12 suggest overheating relates to proportion of building population discomfort, whilst Jenkins et al. 13 demonstrate the need for careful consideration of the consistency and clarity in any calculation approach adopted by future overheating policy.
Despite the lack of overheating definition in the UK Building Regulation, 11 recent studies present evidence that some existing buildings are experiencing internal temperatures that can be harmful to their occupants and that new buildings with similar designs and characteristics (thus susceptible to the same high temperature conditions) are currently passing through planning permission. 11 Nicol et al. 14 affirm that overheating is one of the most dangerous issues emerging with climate change due to the increasing lack of capacity that buildings have to provide a proper response to high temperatures and heat waves. A proper response is dependent on the building type and type of occupant, as highlighted in BS EN 15251:2007. 15 Different levels of vulnerability in populations, activity and appliance use in buildings, mode of environmental control (passive, mixed, active), and outdoor temperatures all impact on overheating. For passively controlled buildings, a temperature threshold for comfort can be evaluated as a function of the exponentially weighted running mean for outdoor temperature and the level of expectation associated with identified categories of building. 15
Adaptation to these warmer conditions is likely, with a greater adoption of air-conditioning systems expected in developed, affluent, regions. However, such adoption in current low energy buildings (highly insulated with low ventilation rates), will offset the energy savings made by heating season focused designs. Though not fully explored, the increased cooling demand of building stocks could significantly hinder climate change mitigation strategies and the ability to alleviate projected future energy system stresses. It is necessary, therefore, to take additional measures to reduce the propensity of buildings to overheat. 16
Review of overheating assessment and competing factors
Building for the future is not simply a challenge of reducing energy consumption, but rather achieving energy reduction targets without compromising environmental quality and well-being. The many facets of environmental quality make it difficult to optimise designs for all scenarios; airtightness can improve the thermal environment, but it can also create issues for air quality. In some circumstances, these control problems can be transformed – as is the case for airtightness under heatwave conditions in highly polluted cities. To simplify the problem, focus can be given to the most energy demanding factors. Vanhoutteghem et al. 17 show that to create an efficient built environment it is essential to balance energy consumption with thermal comfort and daylighting.
Previous overheating assessment for buildings without cooling, such as the one presented in the 2006 edition of CIBSE Guide A, 18 assumed that a maximum internal temperature limit, regardless of external conditions, would be enough to determine if a building is prone to overheat. Using an overheating threshold of no more than 1% of occupied hours with an indoor operative temperature higher than 28°C can become too prescriptive when considering the variety of building types and occupants. Under projected climate change such rigid criteria could see many building designs unnecessarily failing overheating criteria because adaptive capacity in response to external conditions is not properly considered. To model these effects, CIBSE TM52 18 developed a new assessment method based on BS EN 15251:2007 that is related to the external thermal environment and is divided into three criteria.
CIBSE Technical Memorandum 52 (i.e. TM52) presented three criteria to assess the risk of overheating. 18 The first criterion limits to 3% the number of occupied hours that the indoor temperature exceeds the comfort temperature upper limit by 1 K. The analysis is made from the beginning of May until the end of September. Criterion 2 analyses the daily intensity of overheating as a function of temperature rise and its duration, in response to adaptive capacity. Criterion 3 establishes an absolute maximum daily temperature for the indoor environment at 4 K above the comfort temperature, recognising that there are still temperatures above which adaptations and tolerances are meaningless. A building that fails in two of the three listed criteria is categorised as overheating.
Design choices can be made to mitigate the risk of overheating with well-established methods such as control of solar gain through shading and glazing considerations, and exposure of a building’s thermal mass. Though perhaps not core to all design practices, these passive design choices are important to low energy building design and meeting CO2 emission reduction targets. In more extreme (i.e. heatwave) conditions, when passive measures are exhausted, mixed-mode buildings are considered to be of great value in combating overheating. A recent study shows that enabling user response in mixed-mode buildings leads to a greater capacity to respond to overheating. 19
Modes of operation are dependent on design choices, and the high levels of glazing incorporated in to the high-rise vernacular makes shading and glazing thermal properties key passive measures for alleviating risk to overheating. The application of such measures, however, is not straightforward.17,20 Whilst shading and solar control systems are effective at reducing solar gain, they can contribute to an increase in heating and artificial lighting demand. 21
Daylight has an important role in reducing the energy consumption of artificial lighting, contributing to a healthier indoor environment and improving occupants’ visual comfort. It is necessary, therefore, to consider beneficial daylighting aspects at the design stage of buildings in order to achieve a satisfactory result, 22 whilst also avoiding excessive sunlight that can lead to issues of glare and uncontrolled solar gains. 23
The architectural trend of using extensive unshaded glazed façades from bottom to top of a building 24 evidences that the difference of performance in different levels of a building is usually not taken into consideration during the design stage. In addition to the trend in unshaded glazed façades, there is a growing tendency of designing high-rise buildings as a solution to increasing value and demand of land in urban areas. 25 The difference in thermal and daylighting performance at different levels within high-rise buildings is, therefore, an issue of increasing importance.
The adaptive capacity associated with mitigation measures to overheating can depend on occupant use and acceptance of these measures such that the risk of overheating will be dependent on occupants. The overheating in a high-rise block of flats 26 was shown to vary considerably between flats over the course of one summer in the UK – suggesting design should account for the different needs of inhabitants in dealing with high temperatures. Baborska-Narozny and Grudzinska 27 have shown that the overheating risk between two flats in the same building can be different due to orientation, but the effectiveness of different design measures under a more comprehensive comparative analysis of overheating risk remains unanswered.
Pathan et al. 28 demonstrated a greater propensity to overheating in more recently built dwellings as well as in multi-storey flats. Differentiation within a building is typically limited in scope where studies focus on small example comparisons. For the case of multi-storey buildings, the idea of top floors presenting a greater risk to overheating is often based on looking at overheating factors in isolation, which is an approach that was presented 29 as too simplistic. Although monitoring buildings is presented in many studies as the best approach to representing actual overheating concerns, the approach does not enable overheating to be easily separated from non-design issues such as occupant behaviour and environmental system operation.
The performance of a building is impacted by its surroundings, not just the meteorological conditions but also topography. Densely built-up areas create complicated radiative environments with many radiative exchanges and shading effects impacting on energy gains and losses as well as levels of natural lighting (i.e. daylight). Tightly packed buildings and surrounding tall structures will reduce the levels of daylight and solar heat entering the indoor environment, particularly on lower floors.30,31 Pisello et al. 31 demonstrated a 1 to 2.5 K difference between indoor temperatures when considering solar shading effects in building models. Lu and Du 32 also concluded that the daylight penetration varies between levels of the building due to the influence of its surroundings, they found an increasing availability of daylight from the bottom to the top of their case study. However, there are no studies (to the knowledge of the authors of this paper) that have investigated the difference in performance on distinct floors of a building and so how a higher or lower location within the same building can affect overheating and daylighting is unclear.
This paper presents a study on the comparative performance between flats of different position within a high-rise building in the UK, London. The study focusses on performance with regard to overheating risk and daylighting and considers the impact of different passive design features on reducing overheating risks under different urban (shading) topography. Keeping other influencing parameters and profiles consistent across the building allows for direct analysis of the influence that design conditions have over a base level of overheating risk.
Research design
Building simulation
A comparative analysis was conducted on the simulated thermal performance of a high-rise building in London, using the Integrated Environmental Solution – Virtual Environment 33 as a recognised and widely used building simulation tool in industry. 34 Mousavi and Khana 22 demonstrated IES as a valid tool for daylight analysis with RADIANCE-IES and although discrepancy between dynamic building simulation model output and that of real building energy consumption is widely acknowledged. Literature35,36 have shown that dynamic simulation tools (including IES) demonstrate good internal consistency for modelling temperature response to environmental conditions. This makes it a valid tool and approach for the comparative analysis presented in this paper.
The tool provides hourly output of many physical properties, as well as comfort metrics that were used in evaluating the difference in overheating risk on different levels of the building.
A planned 25 storey residential building, located in London, was used as a case study. Each floor composed of seven apartments of different layouts, sizes and orientations (Figure 1(a)). Each level of the building comprises the same seven apartments. Within each apartment the bedrooms, kitchen and living room areas were considered occupied at all times; these spaces accounted for 18 out of 41 rooms per floor and were those used in evaluating overheating risk.

Building layout and dimensions. (a) Floor plan of the building selected for this research. Divided in seven flats that account for a total of 41 rooms per floor 38 ; (b) Building base model for 9 floors out of a 25-storey building using IES-VE. Building divided in bottom, middle and top floors.
Computational constraints meant it was not possible to analyse all 25 levels of the building. Therefore, the model consisted of three height zones (bottom, middle, top) with each zone consisting of three adjoining levels. The bottom zone made of the 1st to 3rd level; the middle zone of the 12th to 14th level; and the top zone of the 23rd to 25th level (Figure 1(b)). The levels below the first simulated floor (i.e. 1st floor) have a different floor plan than the analysed floors and therefore were not considered for this comparative study. To account for site influences, the model was situated within three regions of London as well as an isolated case.
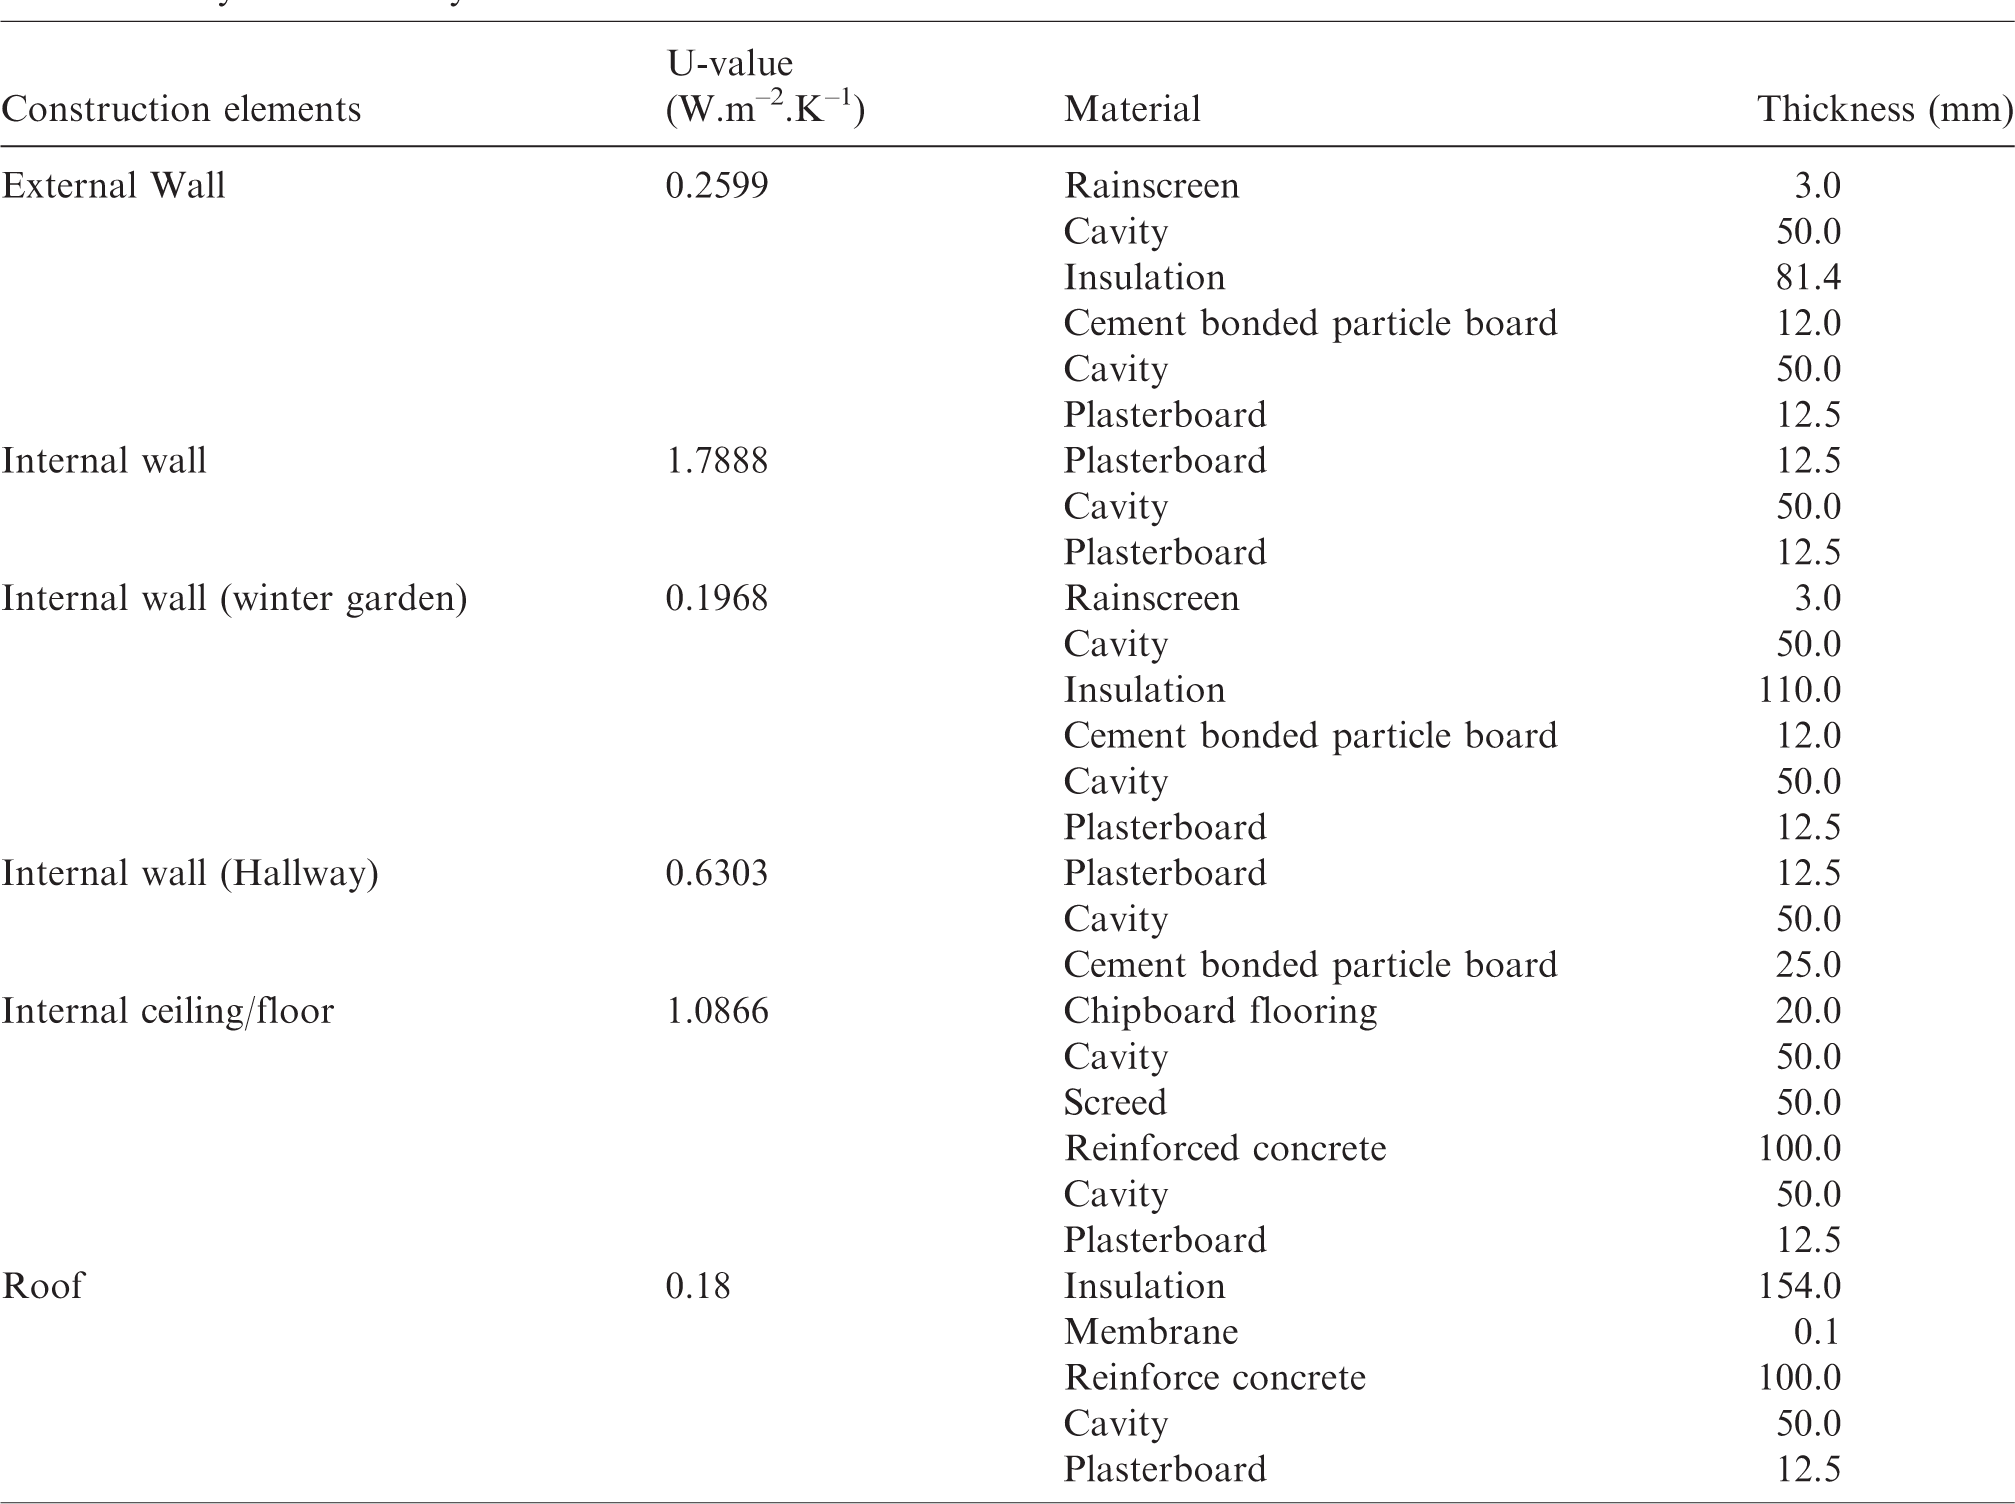
The building materials and construction remained constant for all simulated scenarios (as given in Tables 1 and 2) of varying window-to-wall ratio (WWR), glazing U-value and G-value. These were varied under the rationale of being relatively simple design elements to adjust in the vertical plane of a façade for influencing both solar gain and daylighting. Each of these parameter values was varied within a range informed by the building regulations – recognising regulatory limits that inform design. 37 Building orientation was fixed as shown in Figure 1(a) and four separate locations identified to represent impact of surrounding urban form (see Figure 2).

The three considered location scenarios for London: (a) Bevis Marks; (b) Melior St; (c) Long Ln.
Table of thermal and physical properties of material types used by all construction elements in all considered building model scenarios.

Table of construction elements used in all building model scenarios, showing the layers of material construction from outer layer to inner layer.
A balance between a building’s energy performance and glazing area is necessary; general guidance suggested by the UK Building Regulation is that if the window-to-floor ratio (WFR) is less than 20% some parts of the indoor environment can experience low levels of daylight. However, the WFR in residential buildings is limited by the same UK Building Regulation to 25%. Using these as limiting criteria for maximising availability of daylight without compromising the energy performance of the building and ensuring a range that is regulation compliant, the WFR was varied between 20% and 25% coinciding with reported data.37,39
In total, 80 combinations of three variables were considered for each of the four locations, repeated with the addition of external shading fins (Figure 3) and under two different weather scenarios (Heathrow typical reference year (TRY) and 2003 heat-wave conditions). The external shading was applied here to single storey on South and West facing façades. The design applied was informed by advice from respected industry bodies as a way of representing a realistic design option.11,12 The base-case WWR of 55.33% was the maximum allowable and four alternatives were given down to the minimum allowed under the building regulations of 25.20% (i.e. 20% of floor area). U-value and G-value were increased from the base-case up to the limits imposed by the Building Regulations Part L 37 – see Table 3.

External shading protection designed as a passive solution to overheating.
Simulation variables: WWRs used to create different simulation scenarios along with alternative U-values and G-values – used in combination to provide 80 different design scenarios for each of the four considered building locations (London). The 80 scenarios were also tested with and without shading and repeated under TRY and heatwave conditions.

Four locations were used to represent the influence of different surroundings on solar shading – considered to be the main influencing factor on overheating risk in the vertical plane for this modelling study (i.e. otherwise no vertical gradient in meteorological conditions). The premise of the study is that variation in overheating risk profiles in high-rise buildings will be, in-part, a consequence of variation of surrounding topography in the vertical plane. To capture the impact of surroundings, a base-case location scenario considered the building in isolation. Three further building locations were at identified sites within central London, representing real topography with a mix of high-rise and low-level buildings.
Figure 2 shows the modelled locations with the model building identifiable by the glazed levels used for simulation. An average radius of 150 m from the model building was considered for each location. Buildings lower than the 1st analysed level were not included in the analysis. If surrounding buildings taller than the modelled building were located outside the 150 m, they were considered for inclusion in the model. The maximum distance considered for surrounding influence was 200 m. The surface properties (such as reflectance) of surrounding buildings in each location were not fully considered but assigned uniform values (see Table 1).
The heights of the surrounding buildings for the three locations were obtained using QGIS 40 and the UK Environment Agency’s digital surface model. 41 Data from central London were imported into QGIS and the heights for each surrounding building for each of the three locations were obtained. These were combined with the in-built maps tool of IES-VE to develop the three shading scenarios. In each location, the modelled building maintains its orientation. Bevis Marks represents a region with a high density of high-rise buildings surrounding the site in all directions. The analysed building was surrounded in different orientations by buildings either taller or close to half the height of the modelled building. Melior St was selected in a region next to the tallest building in London. The buildings that are higher than the analysed building are all located to the West. To all other orientations, the surrounding buildings are at the height (or lower) than the lowest simulated floors. Long Lane provides a situation with only one taller building (to the East) and tightly packed buildings of mid-level height to all other orientations.
Monitoring of flats in London 42 demonstrated that vulnerability to overheating exists in warm (non-extreme) summer periods. The TRY for Heathrow provides (without considering localised microclimatic effects) insight into the risk of overheating under typical conditions and the expected typical vertical differences in overheating risk under the model constraints. However, health and well-being concerns are recognised to be more pertinent during extreme conditions, such as during heatwaves. Heatwaves are being projected in regional climate models to be more intense and frequent for the mid to late parts of this century across Europe. The heatwave of 2003 has been highlighted as representative in this regard. 43 Design Summer Year weather files, by the nature of their calculation, do not capture these strong heatwave events,44,45 therefore the heatwave period of 2003 was simulated to provide comparison of risk differences under typical and extreme conditions. Hourly observation data from the MIDAS record, of the UK, 46 were taken for London Heathrow and converted into a TMY2 format file. This file was subsequently converted into an EnergyPlus weather file format (epw) and used in the simulation.
A comparison of temperature and solar radiation between the two files is shown in Figure 4. The distributions highlight the shift to a higher median temperature for 2003 with occurrence of higher temperatures in the extreme – a characteristic of the heatwave. The median and peak global irradiance is much greater for the 2003 weather year that is indicative of the blocking high (clear sky) conditions associated with heatwaves.

A comparison of the distribution of hourly values for the meteorological variables dry bulb temperature (°C) and solar irradiance (W m−2) over the period of the overheating assessment. (a) Temperature distribution. (b) Global irradiance distribution (a,b: Weather data record from 1 May to 30 September). TRY: typical reference year.
Ventilation was constant in all cases (0.25 ach), with no variation in ventilation control and no opening windows. All kitchen/living spaces were set with the same modulated equipment and lighting load profiles, and bedrooms set with a single modulated equipment and lighting profile. Double bedrooms are modulated based on a maximum metabolic load of two people occupying the space, single bedrooms on one person, and kitchen/living spaces modulated on either a maximum of two people for larger flats (Flats 1, 2, 3 and 4) and one person for smaller flats (5, 6 and 7). All load profiles remain the same for all levels of the building and in all scenarios, enabling comparative analysis in overheating risk. Refer to Table 4.
Table of modulating schedules for internal gains in all rooms of all flats simulated on a modulating scale of 0 to 1 applied to the maximum possible value.

Note: All schedules follow a square-wave step at the transition times denoted by *.
Overheating and daylighting assessment
Internal air temperature, CIBSE TM52 18 overheating compliance criteria, and daylight factor (DF) were used in the analysis of overheating and visual comfort risks for all identified scenarios at each of the four locations under typical (TRY) and extreme (2003 heatwave) conditions. The simulations were run for an entire calendar year, but analysis was confined to the cooling season identified in TM5218 – 1 May to 30 September, with analysis further confined to occupied rooms.
Three criteria are used in TM5218 to assess the risk of overheating. The first criterion limits to 3% the number of occupied hours that the indoor temperature exceeds the comfort temperature upper limit by 1 K. The TM5218 Adaptive Comfort tool of IES-VE was used for this analysis. Criterion 2 analyses the daily intensity of overheating as a function of temperature rise and duration by measure of weighted exceedance (We) according to equation (1)18.
Weighting factor (Wf) is zero if ΔT is less than zero, otherwise Wf is equal to ΔT (equivalent to i), h is time at the given ΔT in time steps equivalent to the monitored or simulated time step resolution. ΔT is the difference between the operative temperature and the limiting maximum temperature established by EN15251.
Criterion 3 establishes an absolute maximum daily temperature for the indoor environment at 4 K above the comfort temperature, recognising the limitation of impact from adaptations and tolerances. A building that fails in two of the three listed criteria is categorised as overheating.
The indoor air temperature and frequency of failure against TM5218 criteria across the cooling season were recorded for all the occupied rooms in each flat. Hourly and monthly average temperature differences between the top, middle and bottom levels were used to assess whether relative vertical position of a flat could be used as a vector of relative warmth. Considering that the room position/orientation would influence solar exposure, the temperature comparison between floors was conducted on a room-by-room basis. With three floors modelled at each of the three levels (top, middle, bottom), each room temperature was compared against the three identical rooms at each of the two other levels. For example, each of the three instances of room K/L in Flat 1 on the bottom level (see Figure 1(a)) would be compared against each of the three instances of K/L Flat 1 on the middle and top floors. This totals nine room temperature comparisons at each hourly time-step in the model. With 18 rooms considered per floor, each of the three height levels consisted of 162 indoor temperature comparisons at each time-step.
The daylighting was analysed for the room with highest frequency of failure against CIBSE TM52 overheating criteria. 18 The analysis was made for the scenarios with and without external shading, a working plane was set at a height of 0.85 m from the floor and the average DF of the room was obtained from IES-VE Radiance, for 21 September at 12:00 (set as a standard in IES-VE as is close to the equinox), using the CIE Overcast Sky conditions. DF is the ratio of illuminance at a point on a given plane to light received from a sky of known or assumed luminance distribution, to illuminance on a horizontal plane due to an unobstructed hemisphere of the sky. 47 The average DF of the bottom, middle and top floors was calculated for each of the scenarios on the selected date and time.
There are different compliance metrics for DF levels in buildings; this study made use of the British Standard BS 8206–2 48 that recommends minimum DF values in dwellings of 1%, 1.5% and 2% for bedrooms, living rooms, and kitchens, respectively. Electric lighting is usually not needed if the average DF is 5% or higher and if the daylight distribution is uniform into the indoor environment.
Results analysis
Overheating risk under typical meteorological conditions
When analysing the 80 scenarios, with and without external shading, 41 out of 160 simulations had at least one room that failed to comply with Criterion 2 of the CIBSE TM52 overheating criteria, 18 27 were without external shading and 15 models with. No room failed Criteria 1 and 3 when using the TRY weather file, therefore all the rooms complied with the overheating criteria. Out of the total 738 instances of failure of Criterion 2, 204 were located in rooms on the bottom floors, 248 were located on the middle floors, and 286 were located on the top floors of the modelled building.
Flats 2 and 3 demonstrated least overheating risk, with no failed criterion, whilst Flat 1 was the flat with the highest number of instances of non-compliance with criterion 2 (183 rooms/instances without external shading and 87 instances with external shading considered). Flat 6 had the second highest number of failures of criterion 2 with a 162:29 split between no-shading and use of shading fins.
Figure 5 presents a spatial distribution of failures in each of the three levels when using and not using external shading. Where the first value is the number of failures against Criterion 2 without using an external shading and the second value is the number of failures against Criterion 2 when the external shading was used. The variation of WWR, glazing type and location are combined to ensure the evaluation of risk considers the full range of uncertainties imposed on this building case. The double room in Flat 1 (F1-DR1) was the room with the worst result, a total of 269 failures against Criterion 2.

Spatial distribution of failures given by room and level under TRY conditions. (a) Bottom, (b) middle, (c) top.
The instances of overheating were shown to be dependent on the design options under consideration, as presented in Table 5. Table 5 shows the overheating risk to vary by location. The exposed site has more instances of failure than the other sites considered (i.e. greater irradiance). The level of risk for location 1 (Table 5) consistently has fewest instances of meeting overheating criterion and has greatest density of high-rise buildings (i.e. greater shading). The risk of overheating is more pronounced in locations 2 and 3 (Table 5) though the relative level of risk varies according to considered criterion and weather conditions. The relative proportion of failures between locations 2 and 3 is further affected by use of targeted external shading.
Failures against TM52 when using different weather files and simulation variables.

WWR Basic: 55.33%; WWR 1: 44.26%; WWR 2: 42.01%; WWR 3: 33.19%; WWR4: 25.20%. Glazing Basic: U-value = 0.97 (W/m2.K) and G-value = 0.29; Glazing 1: U-value = 1.07 (W/m2.K) and G-value = 0.32; Glazing 2: U-value = 1.27 (W/m2.K) and G-value = 0.43; Glazing 3: U-value = 1.40 (W/m2.K) and G-value = 0.52. Location Basic: no surroundings; Location 1: Bevis Marks; Location 2: Melior St; Location 3:Long Ln.
Overheating risk in heatwaves
Using the 2003 heatwave weather file resulted in a total of 2841 instances of failure in at least one of the CIBSE TM52 criterion. 18 A total of 67 out of 80 scenarios presented failures to one or more criteria. The majority of instances (2687) recorded failure in a single criterion (criteria 2) for an occupied room, with 154 instances of failure in two or three criteria and therefore deemed to fail to comply with this chosen overheating metric. These instances were distributed in rooms for 14 out of the 80 scenarios. Figure 6 shows a trend in greater overheating risk in the top floors, but higher occurrence of failure in all three criteria for middle and bottom floors.

Number of rooms that failed CIBSE TM52 criteria split according to each considered level within the building. The variation of WWR, glazing type, and location are combined to ensure the evaluation of risk considers the full range of uncertainties imposed on this building case.
Figure 7 presents a spatial map of instances that failed Criterion 2 (7(a) to 7(c)); both Criteria 1 and 2 (7(d) to 7(f)); and maps the instances that failed all (3) criteria (7(g) to 7(i)). The maps show greater risk of overheating in flats 1 and 7 (South to West facing), but with risk across all flats for Criterion 2 is high. Table 5 summarises the results according to the variables used.

Spatial distributions of instances of failed Criterion of TM52 under 2003 observed weather conditions. (a) to (c) show number of instances of failure in Criterion 2 alone; (d) to (f) show instances of failure in Criteria 1 and 2; and (g) to (i) show instances of failure in all three Criterion. The variation of WWR, glazing type, and location are combined to ensure the evaluation of risk considers the full range of uncertainties imposed on this building case.
Internal air temperature
Hourly internal air temperature differences between all the floors of the building were calculated across the cooling season when using the TRY weather file. The analysis removed instances where room temperatures were below 15°C as lower temperatures are likely to motivate use of heating, and the focus of this analysis is on the propensity to overheating. For each room on each of the top and bottom floors, the distribution of temperature difference between bottom and top (Tbottom − Ttop) floors is shown in Figure 8(a). For all flats, the 98% confidence interval is skewed such that there is a slight bias towards warmer top floor flats (negative temperature), yet the interquartile range demonstrates greater occurrence of slightly warmer bottom floor flats. This is evident for all flats considered in isolation, with median values ranging from 0.13 to 0.21°C, and for all flats combined the median being 0.15°C. The outliers in these distributions, however, show that flats 3, 4, 5, and 7 have instances of much warmer conditions in top floor flats than bottom floor flats.

Box and whisker plot of temperature difference at each simulated time-step (hourly) between corresponding rooms in bottom and top floor flats. Temperature difference is (Tbottom − Ttop) with whiskers giving the 98% confidence interval and outliers representing the 1st and 99th percentile in (a). Median values also given. (b) shows the density plot (log Normal colour scale) of recorded temperature in corresponding rooms of flats in the three top floors (abscissa) and three bottom floors (ordinate).
The density plot of Figure 8(b) shows the majority temperature difference between top and bottom floor flats is within 1°C, with greater tendency for the bottom floor flats to be warmer. Using a logarithmic scale to the density plot shows an order of magnitude of 106 between the number of instances of temperature differences less than 1°C and those of more than 5°C at temperatures below 21°C. However, at higher temperatures (21°C), there is a shift towards greater instances of much warmer flats on the top floors of the building and the difference in frequency between small temperature differences (ΔT
Height, design and DF
The double room in Flat 1 (F1-DR1) was the room with the worst performance, a total of 269 failures against Criterion 2 when using the TRY weather file, and for this reason it was selected for the daylighting analysis. Table 6 presents the DF results. Figure 9 presents the percentage of rooms with a given level of DF obtained under different scenarios of WWR. WWR Basic was the design that resulted in the largest number of rooms with a DF greater than 3%, and the simulation results showed decreasing DF with decreasing WWR. At less than 34% WWR, scenarios 3 and 4 resulted in DFs of less than 1% for 4.2% and 12.5% of rooms, respectively.

Percentage of rooms and respective DF results according to the window-to-wall ratio used in the simulations (combined with and without shading). WWR Basic: 55.33%; WWR 1: 44.26%; WWR 2: 42.01%; WWR 3: 33.19%; WWR 4: 25.20%.
Average DF on different levels with and without external shading considered.

Figure 10 shows the percentage of rooms and the DF obtained when using different glazing materials. The proportion of rooms within the given bands of DF is fairly consistent for all glazing options. However, there is a shift of 1–2% towards rooms with a greater DF that coincides with increasing G-value.

Percentage of rooms and respective DF results according to the glazing material used in the simulations (combined with and without shading). Glazing Basic: U-value = 0.97 W/m2.K and G-value = 0.29; Glazing 1: U-value = 1.07 W/m2.K and G-value = 0.32; Glazing 2: U-value = 1.27 W/m2.K and G-value = 0.43; Glazing 3: U-value = 1.40 W/m2.K and G-value = 0.52.
Figure 11 shows DF is most sensitive to location for the considered variables. The isolated building case (location Basic) has the greatest proportion of rooms with DF greater than 3%, whilst the high density of high-rise buildings in location 1 (Bevis Marks) significantly change the proportional make-up of the room DF. The level of building shading resulted in instances of DF less than 1%.

Percentage of rooms and respective DF results according to the location (combined with and without shading). Location Basic: no surroundings; Location 1: Bevis Marks; Location 2: Melior St; Location 3: Long Ln.
DF and overheating
Focussing on room DR1 in Flat 1 (Figure 1(a)) as representing the greatest tendency for overheating under TRY conditions, Figure 12 shows the instances of failed overheating criteria for different bands of DF. This shows a greater number of failure of criteria for DF greater than 1%. There is no clear trend above DF of 1%, however, as a greater proportion of failures is evident for a DF between 1% and 2% than for between 2% and 3%.

Number of instances of failure to comply with CIBSE TM52 overheating criteria when at different levels of DF. The variation of WWR, glazing type, and location are combined to ensure the evaluation of risk considers the full range of uncertainties imposed on this building case.
Discussion
Uniform (homogeneous) façade design of tall buildings in cities presents a question of whether better informed, less uniform design is needed for overheating risk in such buildings to be reduced. By comparative modelling of a real building design, there are certainly differences to be seen in overheating risk, not only in relation to orientation of internal rooms (horizontal plane), but also in the vertical plane. The picture, however, is nuanced by factors of façade design, city locale, summer conditions and metrics used to assess overheating.
The probability distributions of temperature difference between bottom and top floor flats (Tbot − Ttop), at all times of the day, show the median of temperature difference distributions to be positive; indicating that lower floors are more frequently warmer than those on the top floor. Of course, the model set up means buoyancy driven effects within the building are not taken into account. The extended tails of the distributions, however, show instances of significantly higher temperatures in top floor flats. For the implication to overheating risk it is important to understand when these positive and negative temperature differences occur and whether there are sufficient differences at sufficiently high temperatures to show a vertical component to overheating risk. The density plot of Figure 8 shows that at higher temperatures the trend in temperature difference starts to reverse, with less pronounced difference in frequency of small and larger ΔT, but a clear skew towards warmer conditions in top floor flats.
Under TRY conditions the case study building only demonstrated instances of failure in one of the three TM52 criteria. 18 Strictly adhering to the definition of overheating would suggest there was, therefore, no risk of overheating under current typical meteorological conditions on any floor of the building. However, considering the failure in any one criterion as an indicator of vulnerability demonstrated that a greater risk presides in rooms on the higher floors of the homogeneous building design. The top floors presented 40.19% more rooms that failed criterion 2 than the bottom floors and 15.32% more than the middle floors. Failure was specifically in criterion 2 a function of temperature rise and duration – indicating that on the higher floors the rooms become more responsive to heat gains.
Simulations under the 2003 heatwave period not only showed an increase in failed criterion, but also provided instances of two or more failed criteria to constitute overheating. The number of rooms that failed criterion 2 increased almost five times (from 546 to 2687) and the number of rooms that failed to comply with CIBSE TM52 18 increased from 0 to 154. Whilst the higher floors experienced a greater number of instances of failed criterion, the lower floors had a greater number of failures in all (3) TM52 overheating criteria. Due to the modelling framework, the general tendency of a lower occurrence of overheating on the bottom of the building can only be explained by lower levels of solar heat gain.
Overheating risk was shown to vary between flats and rooms in flats. Within the range of variation of density of internal gains observed across the rooms in all seven flats, there is no observed influence of occupant density. Greater frequency of overheating instances was noted in South to South-West facing rooms, where shading from surrounding buildings was not significant to these orientations. All flats demonstrated some element of overheating risk under a cooling season with heatwave, but with failure in two or more criterion limited to flats 1 and 7. The issue of orientation is already established as an important design consideration to comfort conditions, however, when combined with building height, influence of surrounding buildings, and climate change their combined influence on overheating risk is not so clear. The higher floors (middle and top) showed greater vulnerability in criterion one and two, suggesting that frequency, intensity and duration of high temperatures exceeds the adaptive capacity of occupants to cope with such conditions, whilst the lower floors under criterion three are more susceptible to peak daily temperatures reaching significantly (4°C) above the comfort threshold.
The modelled temperatures for indoor environment would likely contain some level of difference to actual temperatures experienced in the built building. However, the works of others 35 indicate that differences between modelled and actual building temperatures can be less than 1°C and that relative temperature and temperature response are typically strongly correlated to observed temperature behaviour in dynamic building simulation models. With this acknowledgement, the actual risk presented by the model should be treated as uncertain, whilst the relative levels of overheating risk across the building can be concluded on with a greater confidence.
The results show that passive design measures to control for overheating should be considered differently at all points in the horizontal and vertical plane of high-rise building façades. Whilst this would lead design away from uniformity, it would create more targeted overheating mitigation measures. The importance of targeted design is demonstrated by the competing issue of natural lighting. As a higher level of daylighting is experienced for the majority of TM52 criterion failures, there is an associated increased capacity in natural lighting comfort for adoption of façade shading devices, different WWR, and glazing design options. An increase of 44.6% in the U-value and of 77.9% in the G-value when comparing the Glazing Basic to Glazing 4 design option resulted in 81.2% more failures in criterion 2. Whilst reducing WWR from 55.3% to 25.2% resulted in an 82.2% reduction in failures (from 214 to 38). Combining the lower WWR with external shading fins removed all failures of TM52 criterion.
Height, proximity and orientation of surrounding buildings, however, can be a dominant determinant of daylighting factor and associated solar gains that impact overheating. The modelling results have shown that the high-rise nature of the buildings in Location 1 dramatically reduce the overheating risks (from 322 down to 5 failures in one or more of the TM52 criterion). However, the surface properties of surrounding buildings and their impact on radiosity in the built environment have not been considered in this study. Further to this, vertical temperature gradients and turbulent wind profiles in the urban boundary layer, and excess temperatures associated with urban heat island have not been imposed.
Conclusion
By comparative analysis it has been possible to demonstrate the influence of high-rise homogeneous building design on overheating risk. Empirical study has deliberately been omitted as the focus has been to demonstrate the impact of design alone. The adaptive capacity from occupant behaviour, particularly by internal passive and active controls on indoor environment, is not evidenced in this study.
Under the assumption of uniform infiltration and external meteorological conditions surrounding a building, indoor spaces at different heights of high-rise buildings do not demonstrate a clear trend in temperature difference over the course of a cooling season. Whilst distributions of temperature difference showed a bias towards warmer spaces at lower levels, the overheating criteria and temperature differences at higher temperatures pointed towards elevated risk on higher floors. Though failure in overheating criteria were noted under current typical conditions, the consideration of heatwave conditions showed more clearly a differentiation in overheating risk between building floors at different heights within the building. The sensitivity to surrounding buildings and orientation highlighted how mitigation measures for overheating need to be case specific; not only considering floors separately, but also room orientation and associated shading from external structures at all heights of the building. The temporality of urban topography would suggest that design measures for mitigating overheating should be adaptive. This not only requires a knowledge of current urban morphology, but also a long-term view of development plans. As an increasing global concern to many major cities, heat stress resilience requires a more considered (less homogeneous) approach to high-rise building design.
Footnotes
Acknowledgements
We thank Buro Happold for the supply of the building design details.
Authors’ contribution
All authors contributed equally in the preparation of this manuscript.
Declaration of conflicting interests
The author(s) declared no potential conflicts of interest with respect to the research, authorship, and/or publication of this article.
Funding
The author(s) received no financial support for the research, authorship, and/or publication of this article.