
Abstract
This paper’s objective and novelty is to understand the impact of different natural ventilation strategies as well as the effect of a proposed smart controlled ventilation strategy on cooling energy saving and thermal comfort in a residential building. Afterwards, an investigation of the Climatic Potential of Natural Ventilation (CPNV) in hot and dry climates, and particularly the potential of the night ventilation strategy under present and future climates, was made. Two prediction climate change scenarios, RCPs 2.6 and 8.5, were considered for two periods. The results, obtained by a validated simulation, have shown the beneficial effect of night ventilation, since it could reduce cooling load by 9% and would keep the operative temperature below 30°C. Nevertheless, the potential of this natural ventilation strategy would be reduced in the future due to climate change. Indoor overheating has been projected to increase drastically. The summer thermal behaviour will be greatly aggravated in the future. Indeed, the CPNV in the summer nights will be decreased by 25%. However, the climate change will affect the winter natural ventilation potential in the future. The results also highlighted that the annual Total Climatic Potential of Natural Ventilation could be increased by 1% for RCP 2.6 and decreased by 4.9% for RCP 8.5.
Keywords
Introduction
The last century has seen several energy crises, the last one started in the autumn of 2021. Indeed, during this year, the International Energy Agency (IEA) 1 noted the most significant increase ever recorded in global demand for electricity: +1,500 TWh, that is, +6%, following the global economic rebound after the recession linked to the COVID-19 pandemic. 1 The global economic recovery after the pandemic has pushed up the price of raw materials (gas, coal and oil). Fossil gas has become a geopolitical issue between several countries. According to the IEA (January 2022), 1 market volatility could lead to another 3 years of rising prices, as well as record greenhouse gas emissions.
One of the major users of this energy is the building sector, which is responsible for 30% of the total final energy consumption and has a huge carbon footprint: it causes 27% of total greenhouse gas emissions. 1 This trend is confirmed in the Moroccan context, with the building sector alone accounting for 33% of total energy consumption. 2 This consumption is set to grow due to the expansion of the housing stock, and the increasing use of heating and cooling mechanical systems in buildings, especially in recent years when the effect of climate change is more accentuated. Indeed, during the COVID-19 pandemic period, these systems showed their limits. To this end, the World Health Organization (WHO) 3 has warned against using HVAC systems that have not been regularly inspected, maintained and cleaned, to limit the spread of the virus. 3 On the other hand, it is advised to promote natural ventilation to ensure good ventilation of the buildings. 4 This circumstance, pushing us to think of reducing the use of mechanical systems in our buildings, is not only to minimize the energy bill but above all for health reasons. Nevertheless, the question that arises is, what is the alternative?
We can answer this question when efficient public policy is combined with technological innovation, individual/collective awareness and architectural innovation. Indeed, many studies have been carried out to show that passive systems can provide buildings with comfortable conditions through natural means.5,6 Natural ventilation is amongst these passive systems. This system is the subject of this work. It can be defined by the flow of outdoor air caused by wind and thermal pressures through intentional openings in the building’s shell, which can achieve significant energy savings.
7
However, understanding a climate’s potential for natural ventilation should be the first step. A comprehensive review of natural ventilation metrics was presented by Yoon et al.
8
The three leading performance indices identified by the authors are the Climatic Potential for Natural Ventilation (CPNV), the Natural Ventilation Cooling Effectiveness (NVCE) and the Climate Potential Utilization Ratio (CPUR). This study also demonstrated the applicability of these measures in a design procedure: - During the site assessment phase, the CPNV gives general ideas about the cooling potential that the site can provide. - During the design development phase, the NVCE provides the key information about the cooling efficiency of a given design solution. As an additional measure, the CPUR explains how the building behaves in relation to the expected CPNV.
Natural ventilation evaluation indices have also been analyzed by Bamdad et al.
9
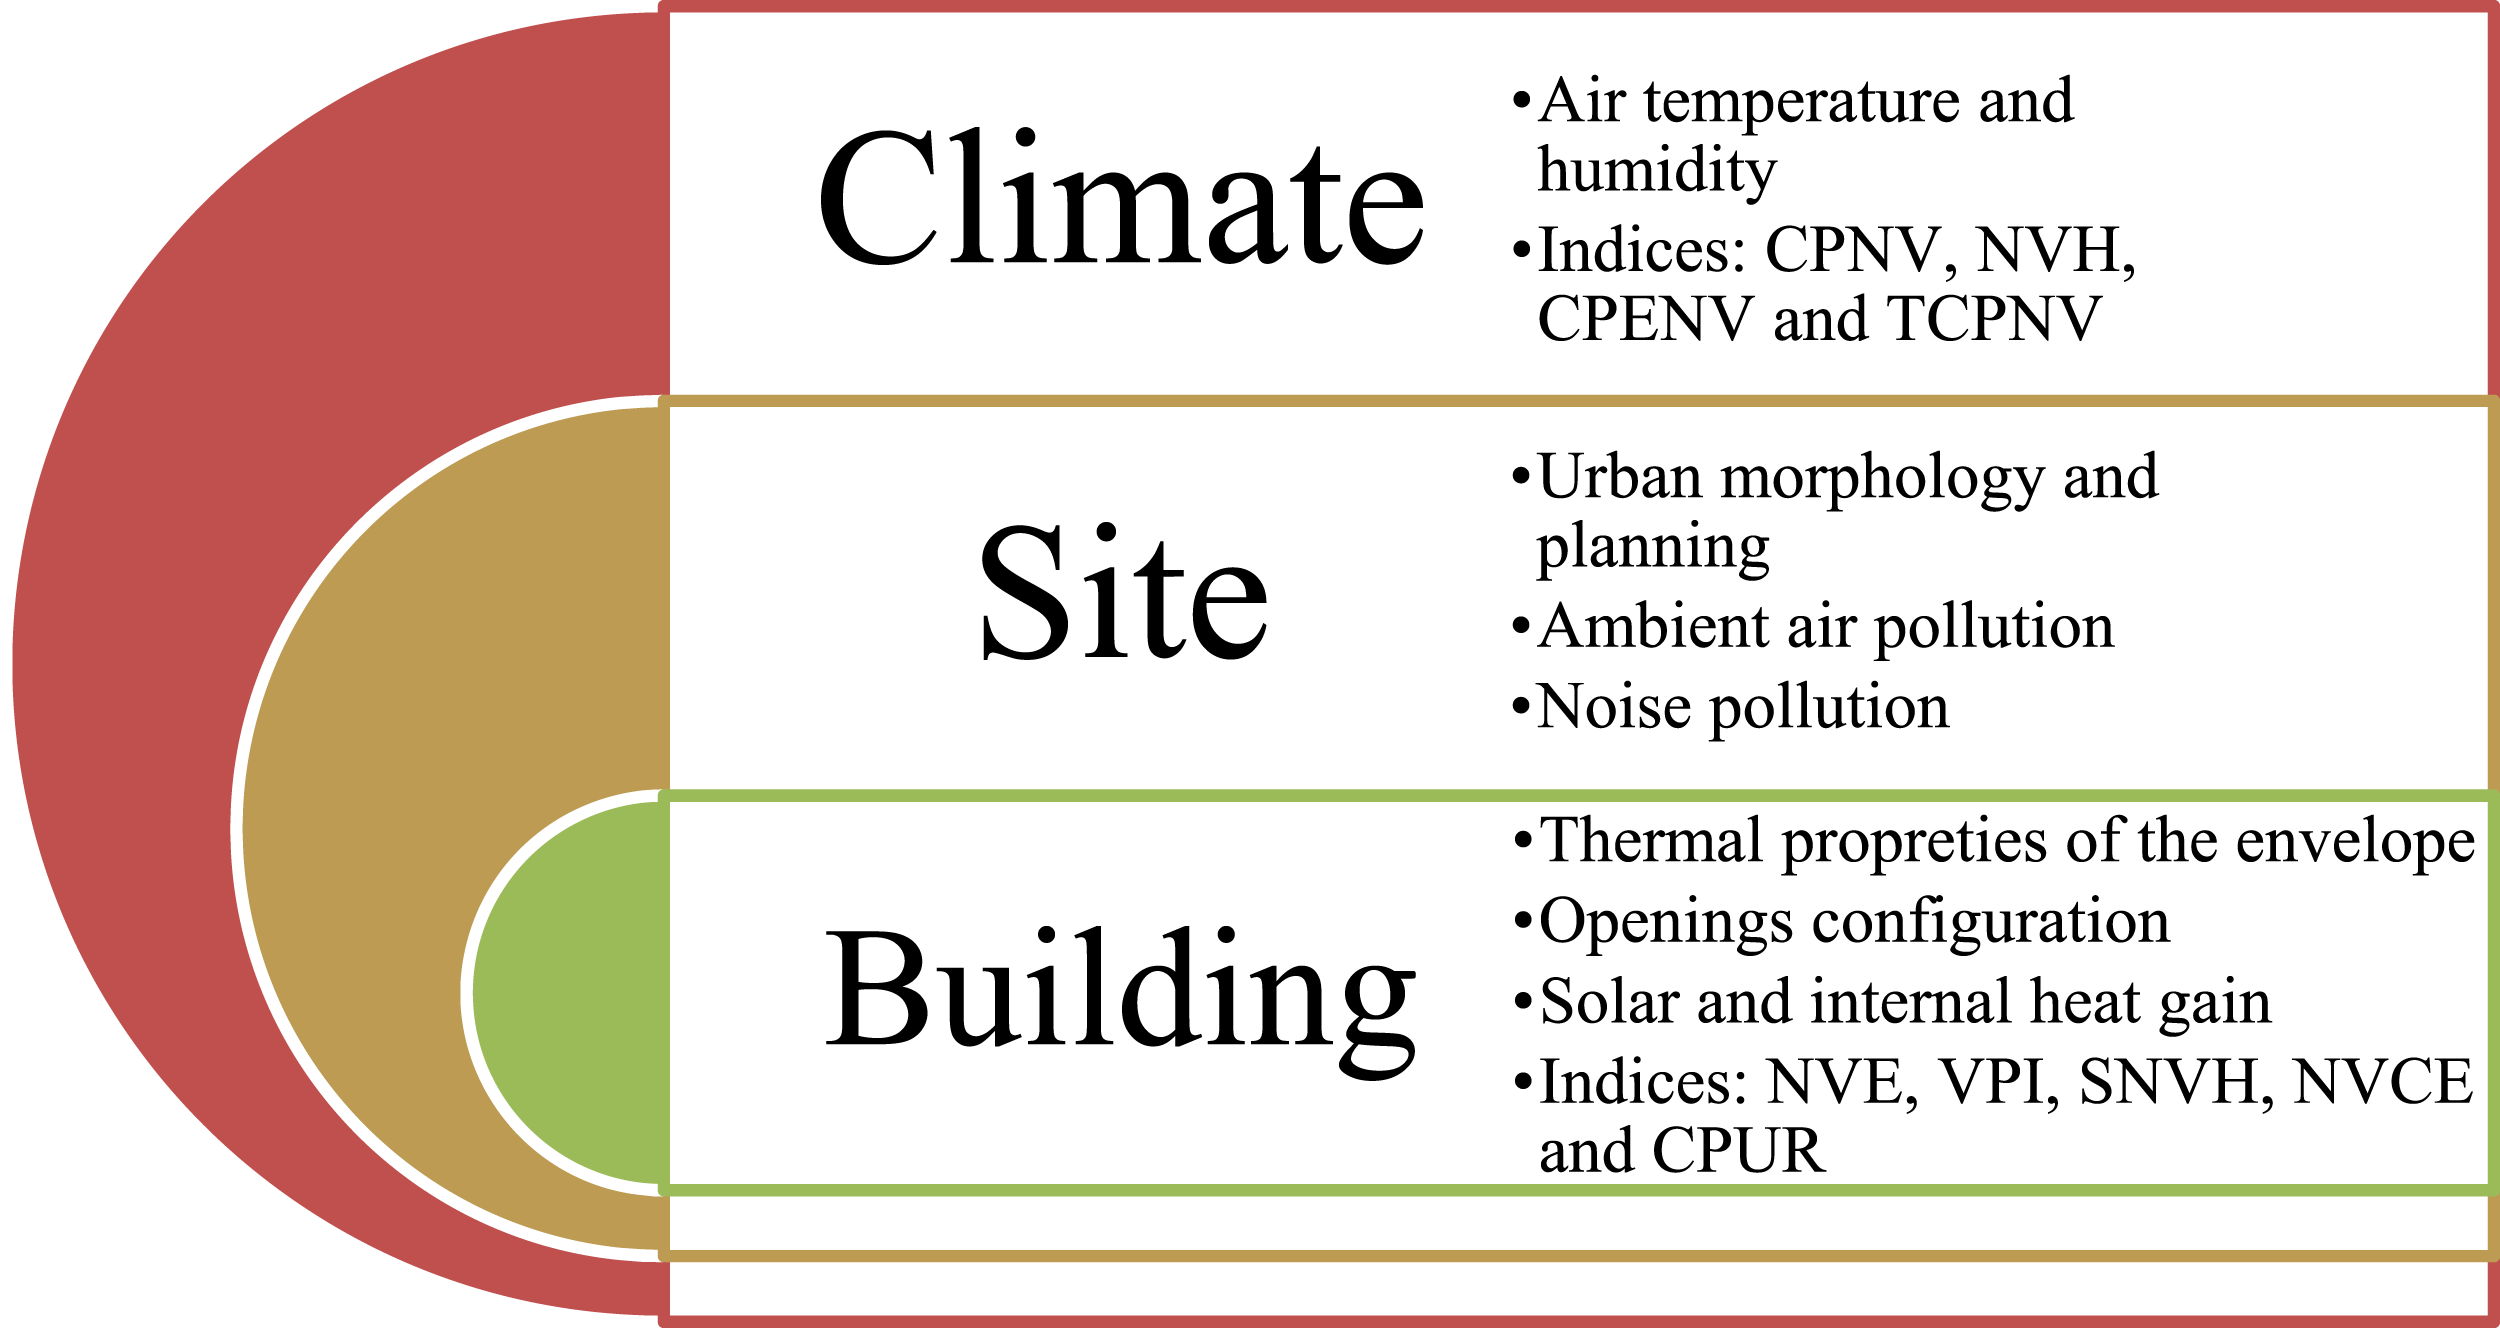
They pointed out that the outdoor environment is one of the most influential factors in assessing buildings' Natural Ventilation Potential (NVP). They assessed the potential for natural ventilation on three main scales: climate, site and building (see Figure 1). Identified scopes for evaluation of natural ventilation potential (NVP) in the literature and corresponding indices.
9
Moreover, several studies have analyzed the potential of natural ventilation for energy reduction and occupant comfort in different climates. Kyritsi and Michael 10 compared different window opening patterns in an office building in the Mediterranean climate. Four strategies were compared: No ventilation, Day-time Ventilation, Full-time Ventilation and Night-time ventilation. They found that using night ventilation could increase hours of comfort in the building by about 40% compared to full-time ventilation. However, the night ventilation strategy was found to be more effective in terms of mean maximum operative temperature as this was 2.1°C lower than when using full-day ventilation. Thus, the thermal comfort assessment concluded that night ventilation was the most effective cooling strategy. In addition, Michael et al. 11 showed that night ventilation is the most effective technique for passive cooling in the vernacular architecture of Cyprus during the hot summer period. Besides, Zheng et al. 12 stated that natural ventilation could ensure a clean air renewal, especially in hospital buildings. Therefore, the authors confirmed that natural ventilation could be reliable if properly designed, especially when combined with a mechanical system using hybrid ventilation. The latter system was studied, in a hot and dry climate, by Taleb. 13 She analyzed the potential for cooling and improving thermal comfort by combining mechanical and natural ventilation systems in a residential building located in Dubai. The author compared the monthly energy consumption simulated by the IES software and the real energy consumption according to natural ventilation scenarios. Indeed, five configurations combining an active cooling system and passive natural ventilation were taken into account in order to obtain the best combination for the internal air temperature and the best rate of cooling load reduction. This study revealed the best cooling scenario: the HVAC system in summer (April to October) and the free cooling by opening windows 24 h in winter (November to March). In addition, the CFD analysis which examined the air circulation in the areas of this building determined the effect of the orientation change (45° rotation to the East) on the average indoor air temperature reduction and the cooling needs.
Moreover, several studies have highlighted the influence of occupants’ behaviour on natural ventilation, which could affect thermal comfort and buildings’ energy performance. Sorgato et al. 14 studied in Brazil three different scenarios of occupants’ behaviour that were modelled according to the building ventilation openings: morning-to-night ventilation, automated ventilation control and night ventilation. According to the obtained results by EnergyPlus software, it was possible to observe that the first scenario resulted in the lowest number of comfort hours for naturally ventilated rooms with an average of 2333 h, and the automated ventilation control scenario had the most significant number of comfort hours with an average of 3416 h. Moreover, the morning-to-night ventilation scenario showed the highest required energy consumption, while the automated ventilation control and night ventilation scenarios presented similar performance except for the heating energy consumption. Another study on occupants' thermal comfort in naturally ventilated buildings in a hot and humid tropical climate was carried out by Feriadi and Wong. 15 They surveyed typical house dwellers in Indonesia to study the perception of thermal comfort and the preference of occupants’ living in unventilated houses and to understand better behavioural actions that could influence the perception of thermal comfort in a tropical climate. In fact, they evaluated the different comfort conditions, such as clothing, metabolic rate, air temperature, operative temperature, relative humidity and wind speed. They calculated the Predicted Mean Vote (PMV) based on these parameters. Statistical analysis revealed discrepancies between the neutral air temperature (comfort) and the set air temperature. Indeed, in a hot and humid tropical climate, occupants prefer an operative temperature of 26°C, considerably lower than the neutral temperature of 29.2°C.
On the other hand, the building orientation and the speed/direction of the wind are intrinsically related to the overall process of natural ventilation, favoured by a bioclimatic design that considers the facades of the building, their shapes and opening surfaces.16,17 Al-Tamimi et al. 18 studied the impact of the building window’s orientation in a hot and humid climate. This experimental study was based on the measurement of air temperature and air velocity inside an east–west-oriented building. Based on a 26-day measurement campaign, this thermal comfort assessment study concluded that the east–west orientation is the least favourite because the windows of these facades would receive more radiated heat and less ventilation, unlike the two other orientations, South and North. The study also showed that the glazed opening should not exceed 25% of the total surface of the facades for greater thermal comfort due to natural ventilation. Thus, integrating mechanical ventilation is necessary to improve the thermal comfort of occupants in a tropical climate.
Jamaludin et al. 19 investigated several natural ventilation approaches for a south–north-oriented residential building located at Malaya University (Malaysia). Ten scenarios of natural ventilation were studied in eight unoccupied rooms on the ground floor and the three other floors of the building. They installed data-loggers in these rooms for 4 weeks to measure air temperature and humidity. They compared four window opening strategies for each room: opening the windows from 7 p.m. to 8 a.m. (night ventilation), opening the windows from 8 a.m. to 7 p.m. (day ventilation), opening the windows all day and the last scenario closing windows (without ventilation). These strategies are compared regarding air temperature and humidity for each room. The effectiveness of these different ventilation approaches was influenced by the height of the openings relative to the ground and the selected rooms' orientation. The authors asserted that night ventilation is the most effective approach because the measured air temperatures in the room were below 30°C. Whereas for other scenarios, the air temperatures were above 32°C. Finally, they rated the effectiveness of ventilation approaches in the following order: night ventilation, day-time ventilation, full-day ventilation and no ventilation.
The state-of-the-art analysis shows that natural ventilation is an efficient and indispensable means to make buildings more thermally comfortable and to promote the well-being of occupants. However, we have noticed that year after year the potential of this thermal dissipation system has been deteriorating. Indeed, climate changes have been very visible during the last decade, especially in the Mediterranean basin. This phenomenon has caused severe consequences for nature and, consequently, for human beings. The Marrakesh region (latitude 31°38′N, longitude 8°03′W and altitude 426 m), the subject of this study, has been seriously affected by this phenomenon. Indeed, the hot period has been spread out to more than 8 months per year, with a very high frequency of heat waves and a very important air temperature increase. This is most noticeable in the buildings, which have become more and more energy intensive due to the use of active cooling and ventilation systems.
However, according to the International Energy Agency, air conditioners and electric fans today account for nearly one-fifth of total electricity consumption in buildings. This trend is expected to increase in warmer countries like Morocco. 1 Hence, the first aim of the current work is to examine the potential for reducing energy consumption and improving thermal comfort through different natural ventilation strategies in a new retrofitted building. This study is a complement to several other studies on the same building, renovated by the introduction of bioclimatic design systems. The second objective of this paper is to determine the overall potential of natural ventilation in the Marrakesh region (Köppen: BSh) and, more particularly, the potential of the best natural ventilation strategy found in the first part, under current and future climatic conditions. Many studies conducted so far have been focused only on the impact of natural ventilation under current climatic conditions. On the other hand, few studies have analyzed future changes in the potential of this system; nonetheless, no study has evaluated and explored, in a semi-arid climate, how the potential of night ventilation could evolve under future climatic conditions based on emission scenarios introduced in the Fifth Assessment Report of the Intergovernmental Panel on Climate Change (IPCC AR5). 20 To this end, three indices (CPNV, CPENV and TCPNV) for verifying the natural ventilation potential were calculated and compared in this study under two-time schedules: when the natural ventilation is desired only on nights of the summer season (8 p.m. to 8 a.m.) and for all the time (24 h/whole year).
Research design and approaches
Case study microclimate
The studied building is located in Marrakesh city, which is characterized by a Mid-Latitude Steppe and Desert Climate (BSh), according to the Köppen Climate Classification. 21 The main characteristics of this climate are the very high temperatures in summer (∼45°C) with very low humidity (∼0%) and relatively cold winters (∼0°C). Moreover, this climate is also characterized by the large amplitude between the day and the night air temperature, which can record a value of 20°C.
To analyze in detail, the specific climatic conditions of Marrakesh city, graphs of air temperature, air humidity, solar irradiation and wind rose were derived from Typical Meteorological Year (TMY) weather file.
22
Figure 2 shows that only 4 months of the year where the average monthly air temperature is within the comfort zone: May, June, September and October. This comfort zone (20°C to 26°C), presented in Figure 2, was set according to the NM ISO 7730 standard.
23
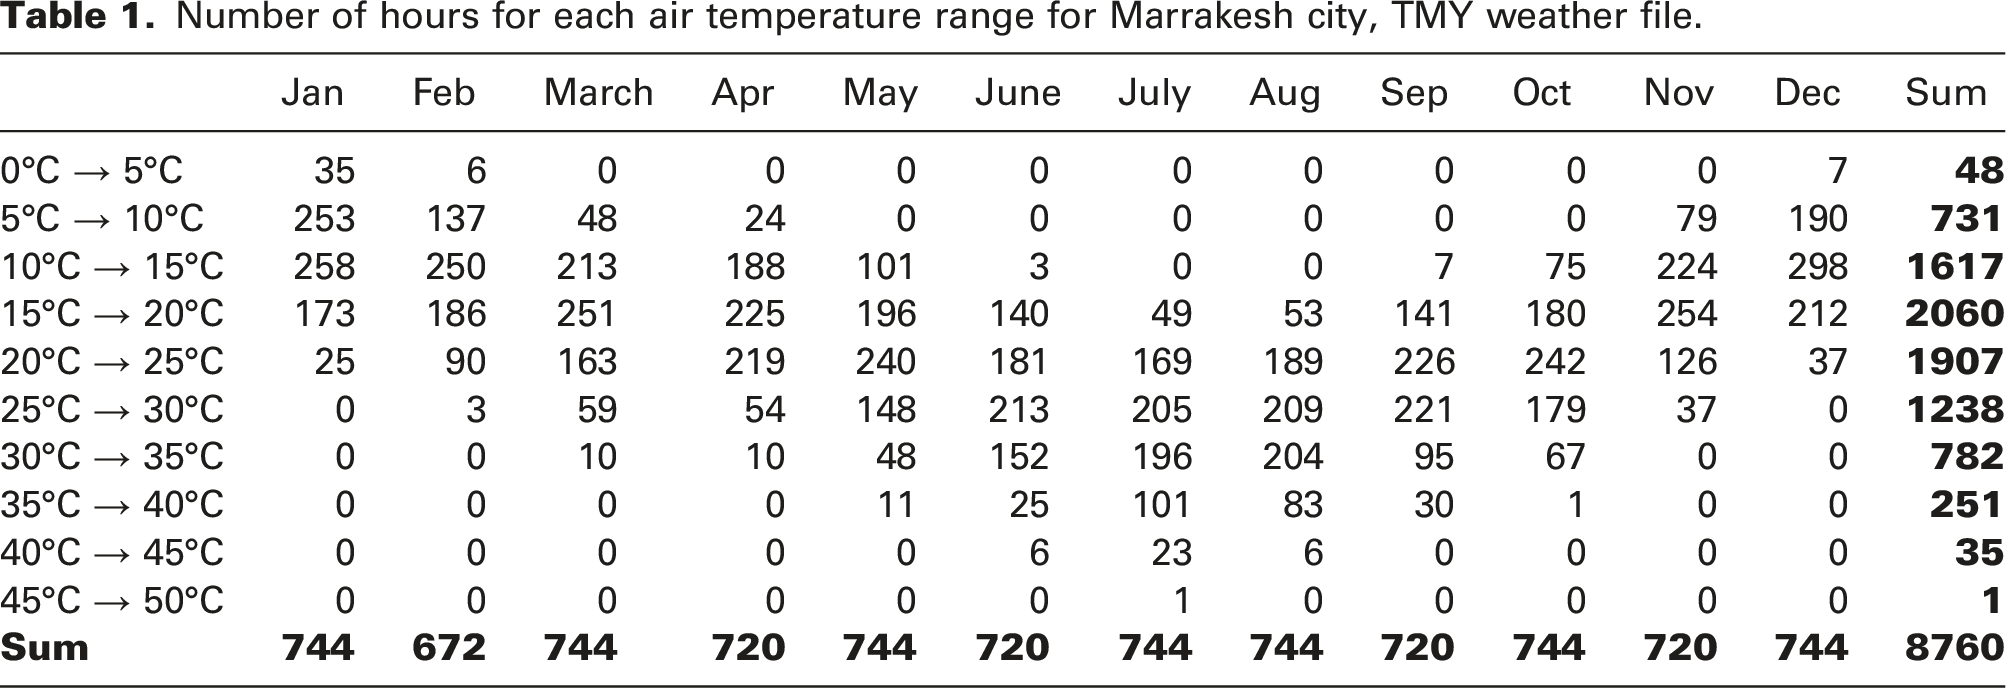
To complete Figure 2, Table 1 shows the number of hours for each air temperature range. As shown in Figure 2 and Table 1, the maximum air temperature occurs in late June, July and August, over 40°C for 36 h. However, the outside air temperature ranges from 15°C to 25°C, almost 4000 h per year. Furthermore, the outside air temperature oscillates between 5°C and 15°C for 2348 h per year. These last hours are recorded mainly in November, December, January and February. In addition, 48 h per year, the air temperature does not exceed 5°C, with a minimum of 2.5°C recorded in January (see Figure 2). Air temperature range in Marrakesh city, by current TMY weather file. Number of hours for each air temperature range for Marrakesh city, TMY weather file.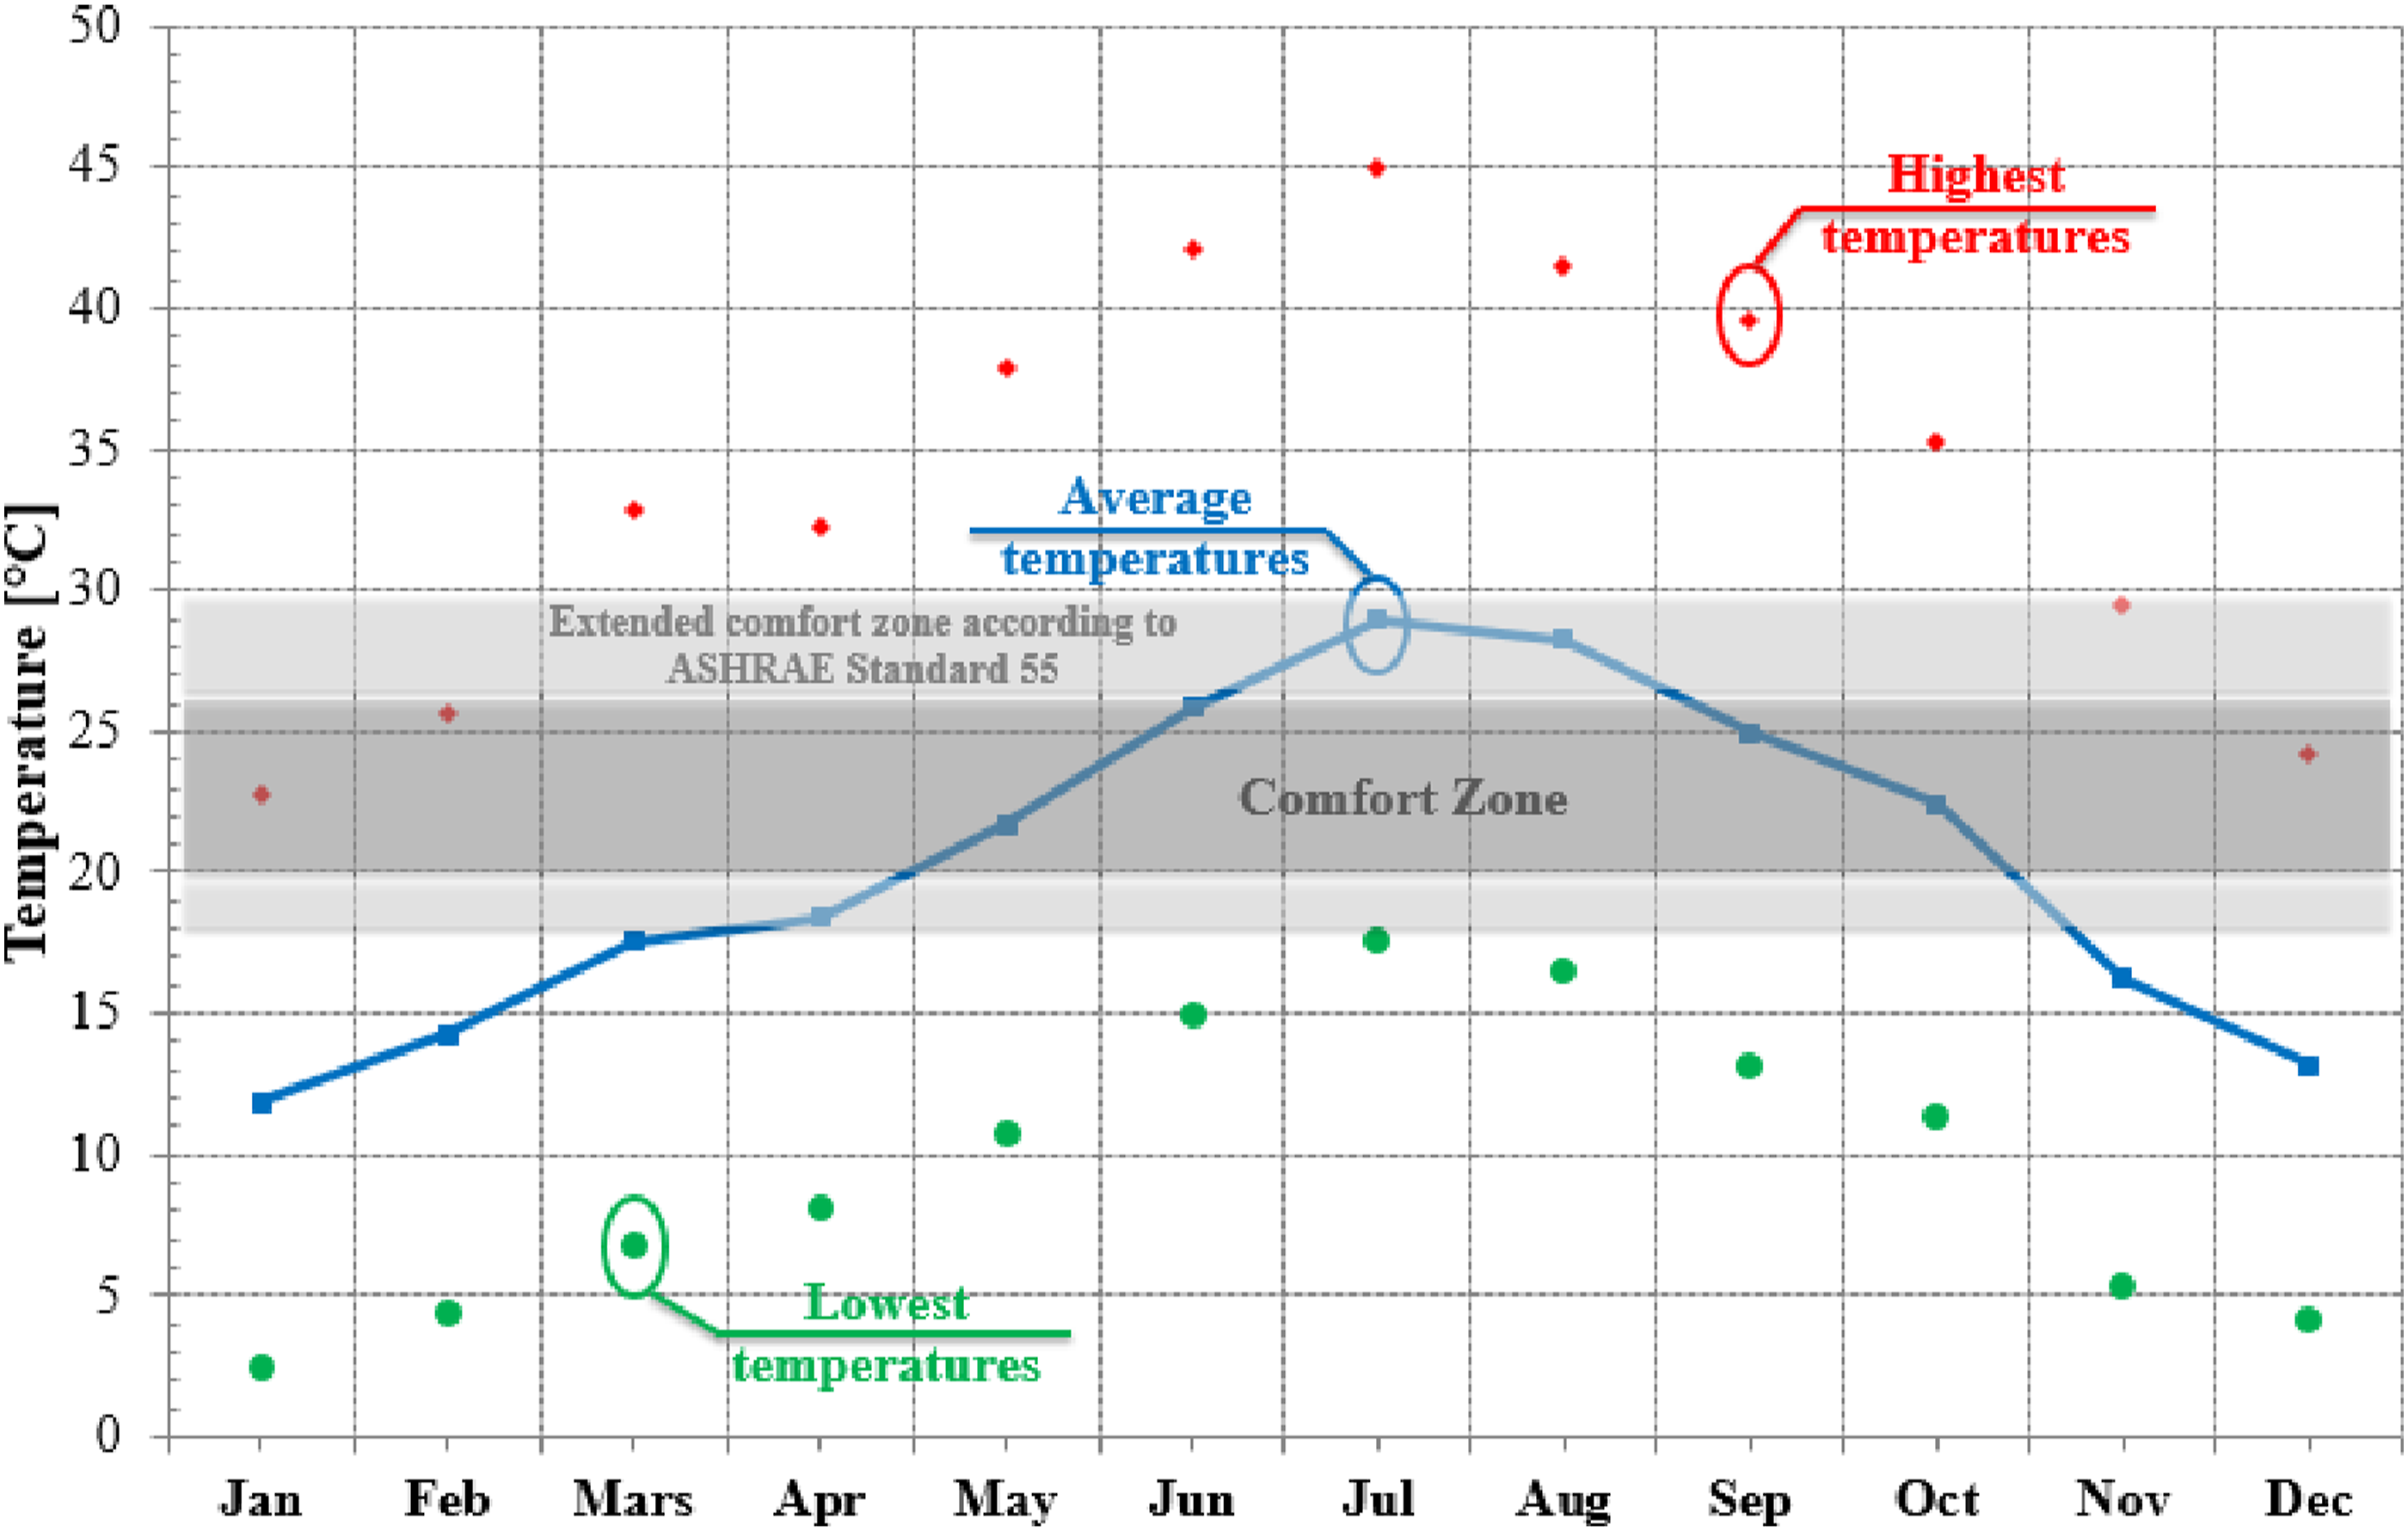
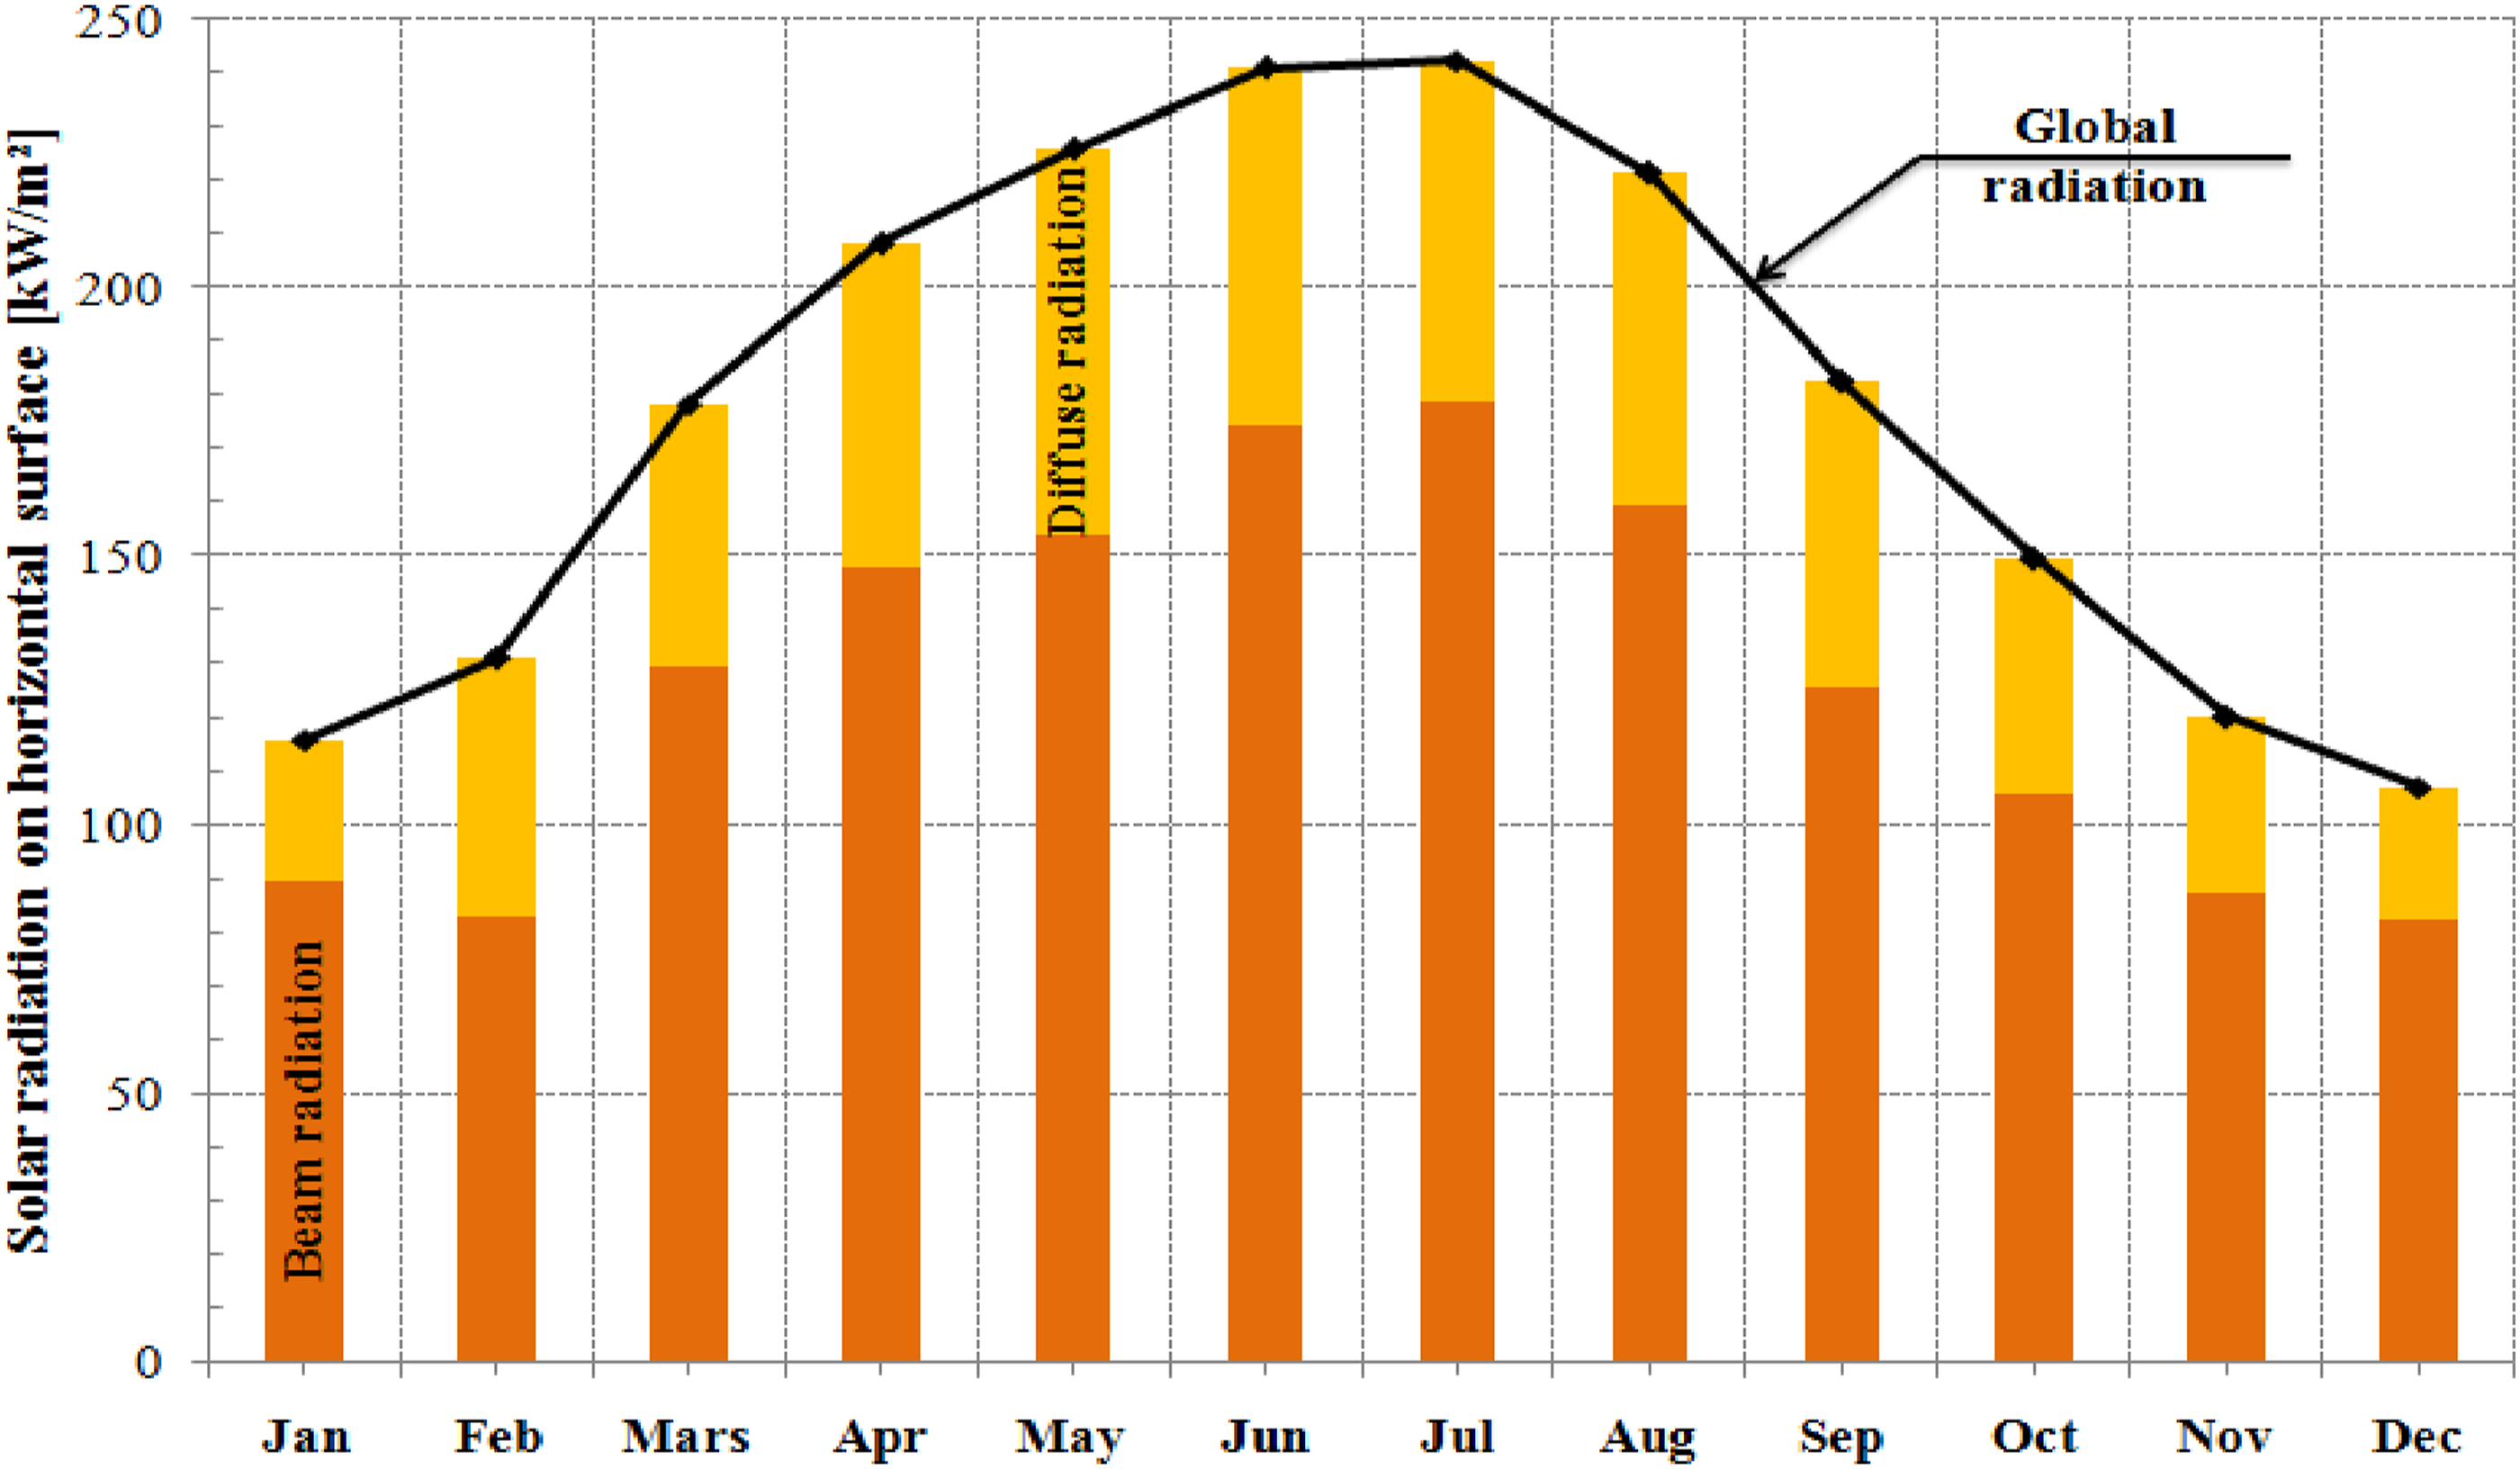
In contrast, the average monthly relative humidity is generally in the comfort zone (30% to 70%) for the whole year, as shown in Figure 3. The maximum humidity in Marrakesh can reach 100% during the winter and registers its minimum value in July, below 18%. On the other hand, Figure 4 shows that Marrakesh city has excellent solar potential. Solar radiation is at its maximum level in June and July, with a peak of hourly global solar irradiation on a horizontal plane of nearly 1400 Wh.m−2. Contrariwise, December is the least sunny month in Marrakesh, with a monthly sum of solar irradiation lower than 110 kW.m−2. Humidity range in Marrakesh city, by current TMY weather file. Solar radiation for Marrakesh city, by current TMY weather file.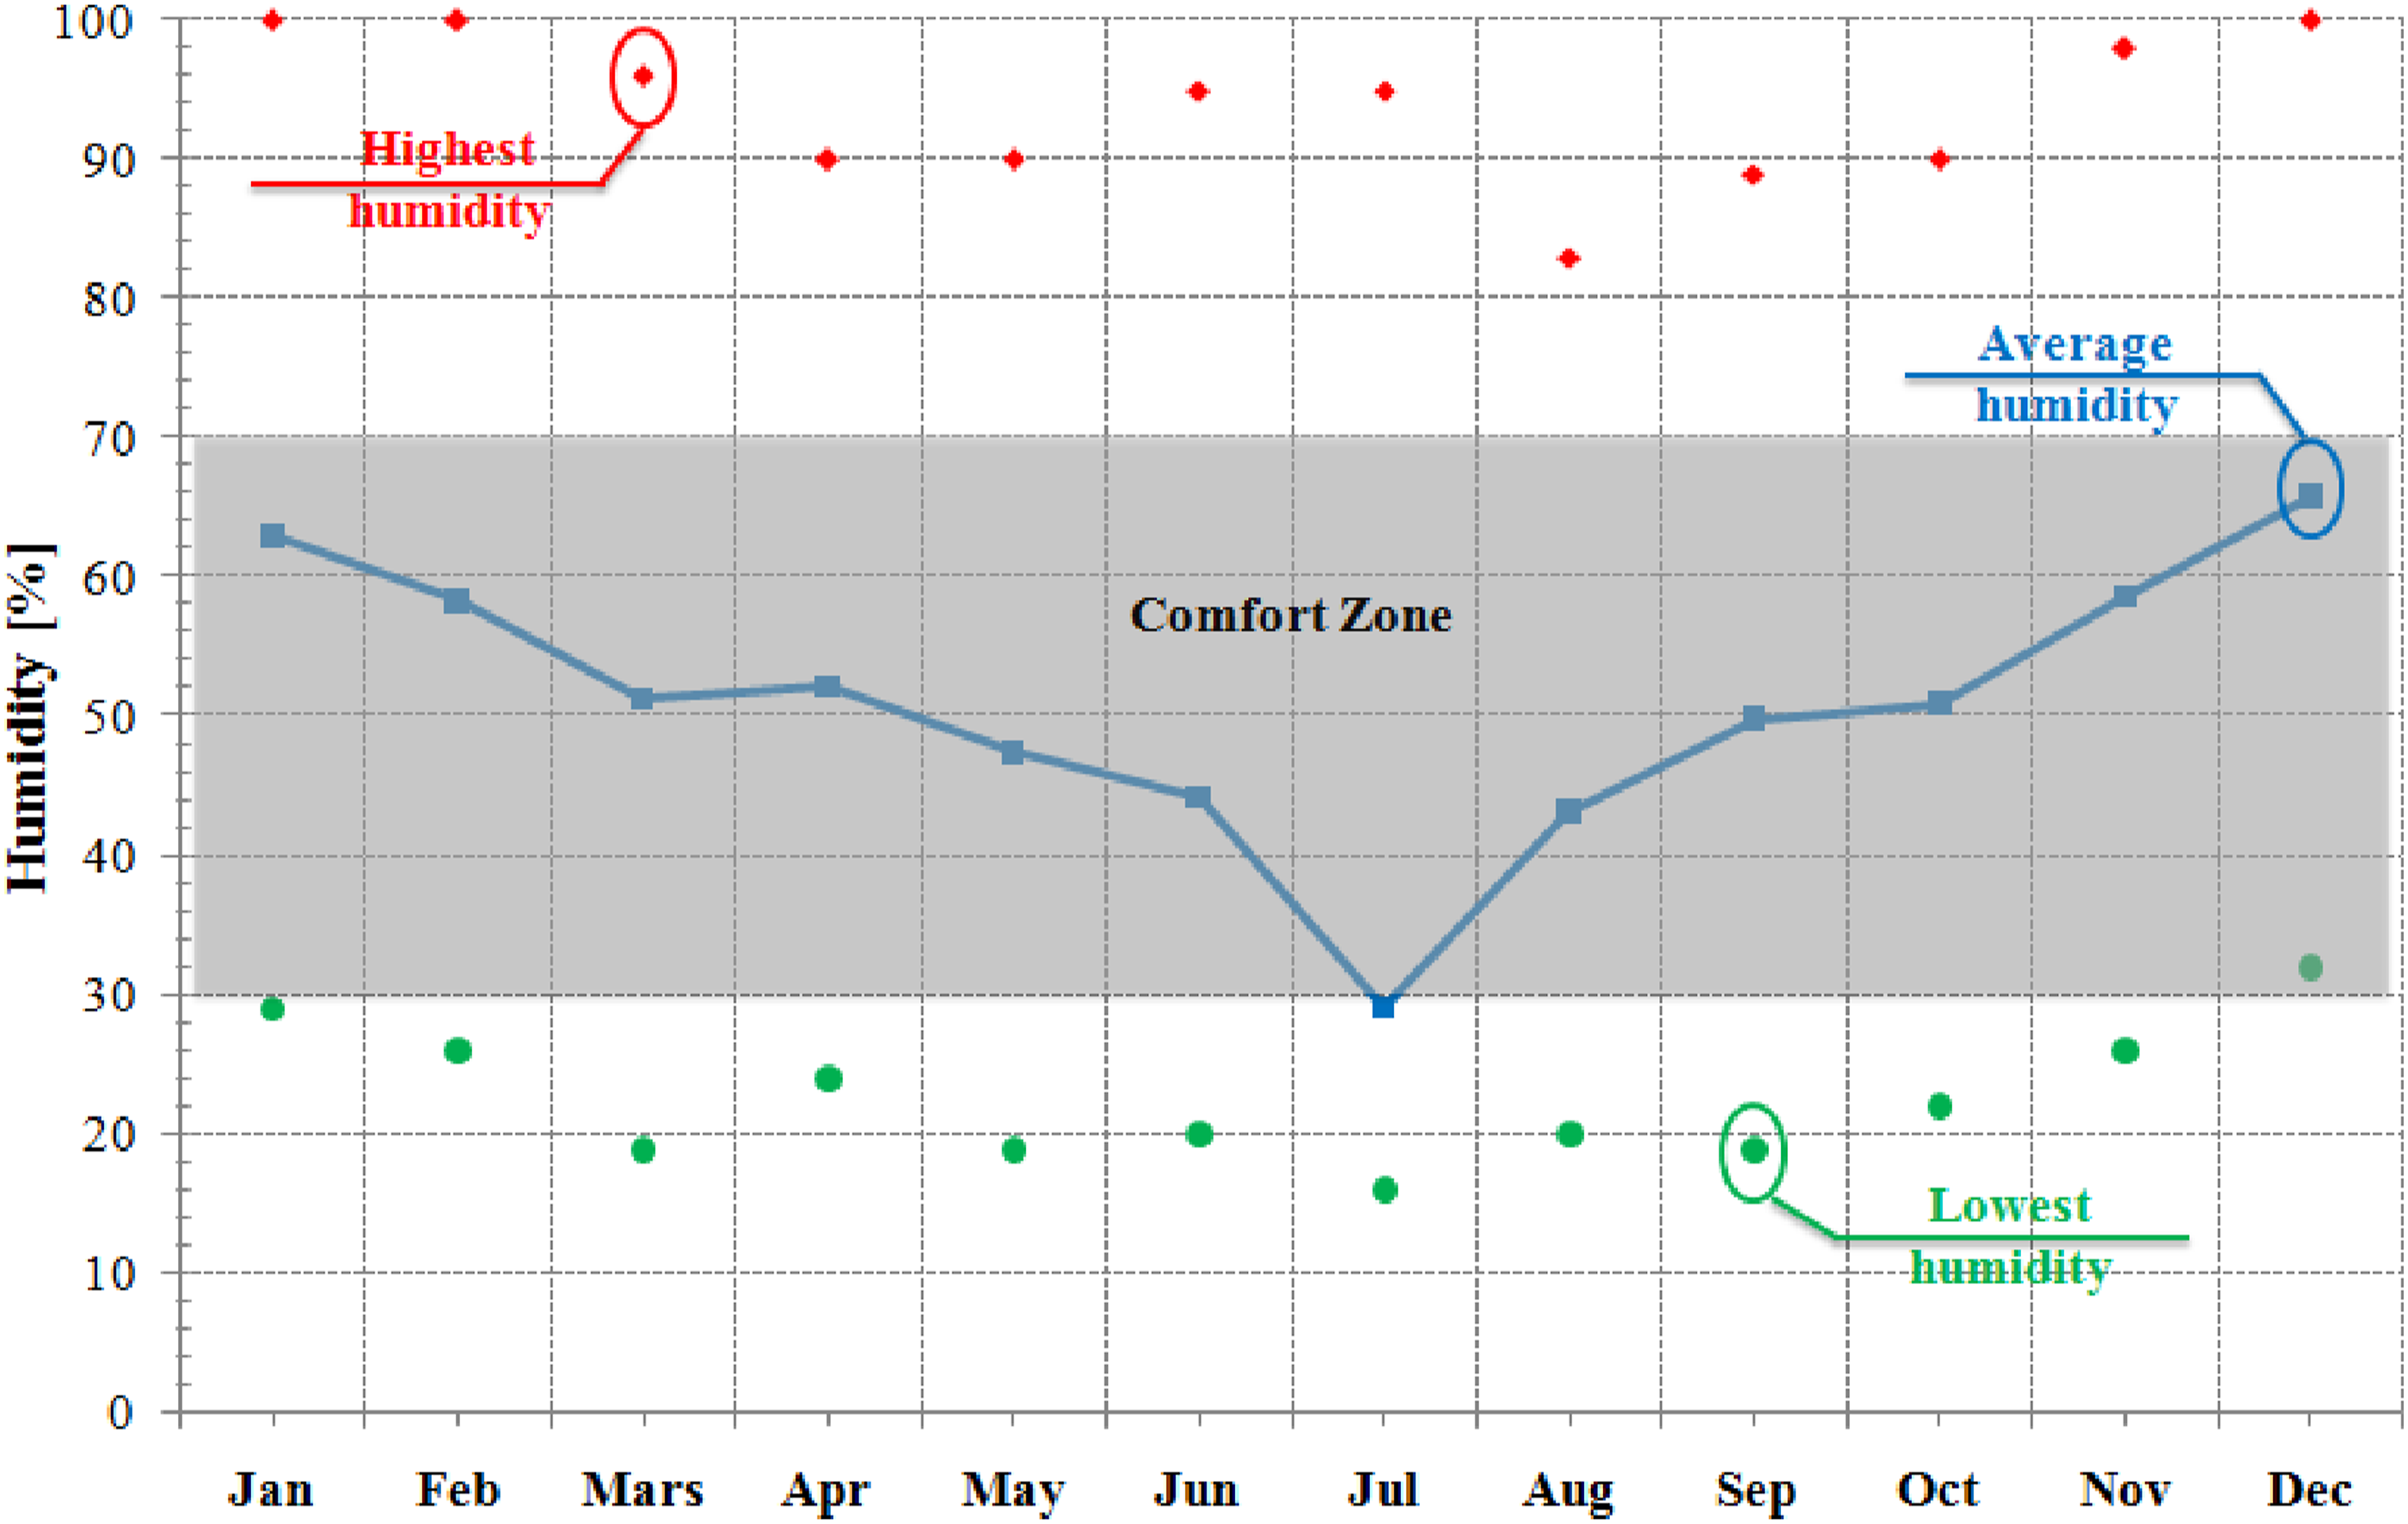
Furthermore, the Climate Consultant software 6.0 was used to draw the wind rose corresponding to the microclimate of the studied house.
24
The external wind speed and direction recorded during the day-time (8 a.m.–8 p.m.) and the night-time (8 p.m.–8 a.m.) of the hottest day of the year are shown in the wind rose diagrams (see Figure 5). The prevailing wind direction during the day-time was northeast and southeast with a maximum wind speed of 5.7 m.s−1. Indeed, during the day-time, the wind reaches a high temperature (red colour, T >24°C) and a very limited humidity rate (yellow colour, RH <30%). Contrariwise, the prevailing wind direction at night is west and southwest, with a maximum wind speed of 2.6 m.s−1. Indeed, during the night-time, the wind is at a low temperature (sky blue colour, 20°C < T <24°C) and a proper humidity (green colour, 30% ≤ RH ≤70%). This shows that the present climatic conditions in Marrakesh city have a significant night cooling potential. Wind roses diagrams illustrating the wind speed and direction during (a) day-time and (b) night-time.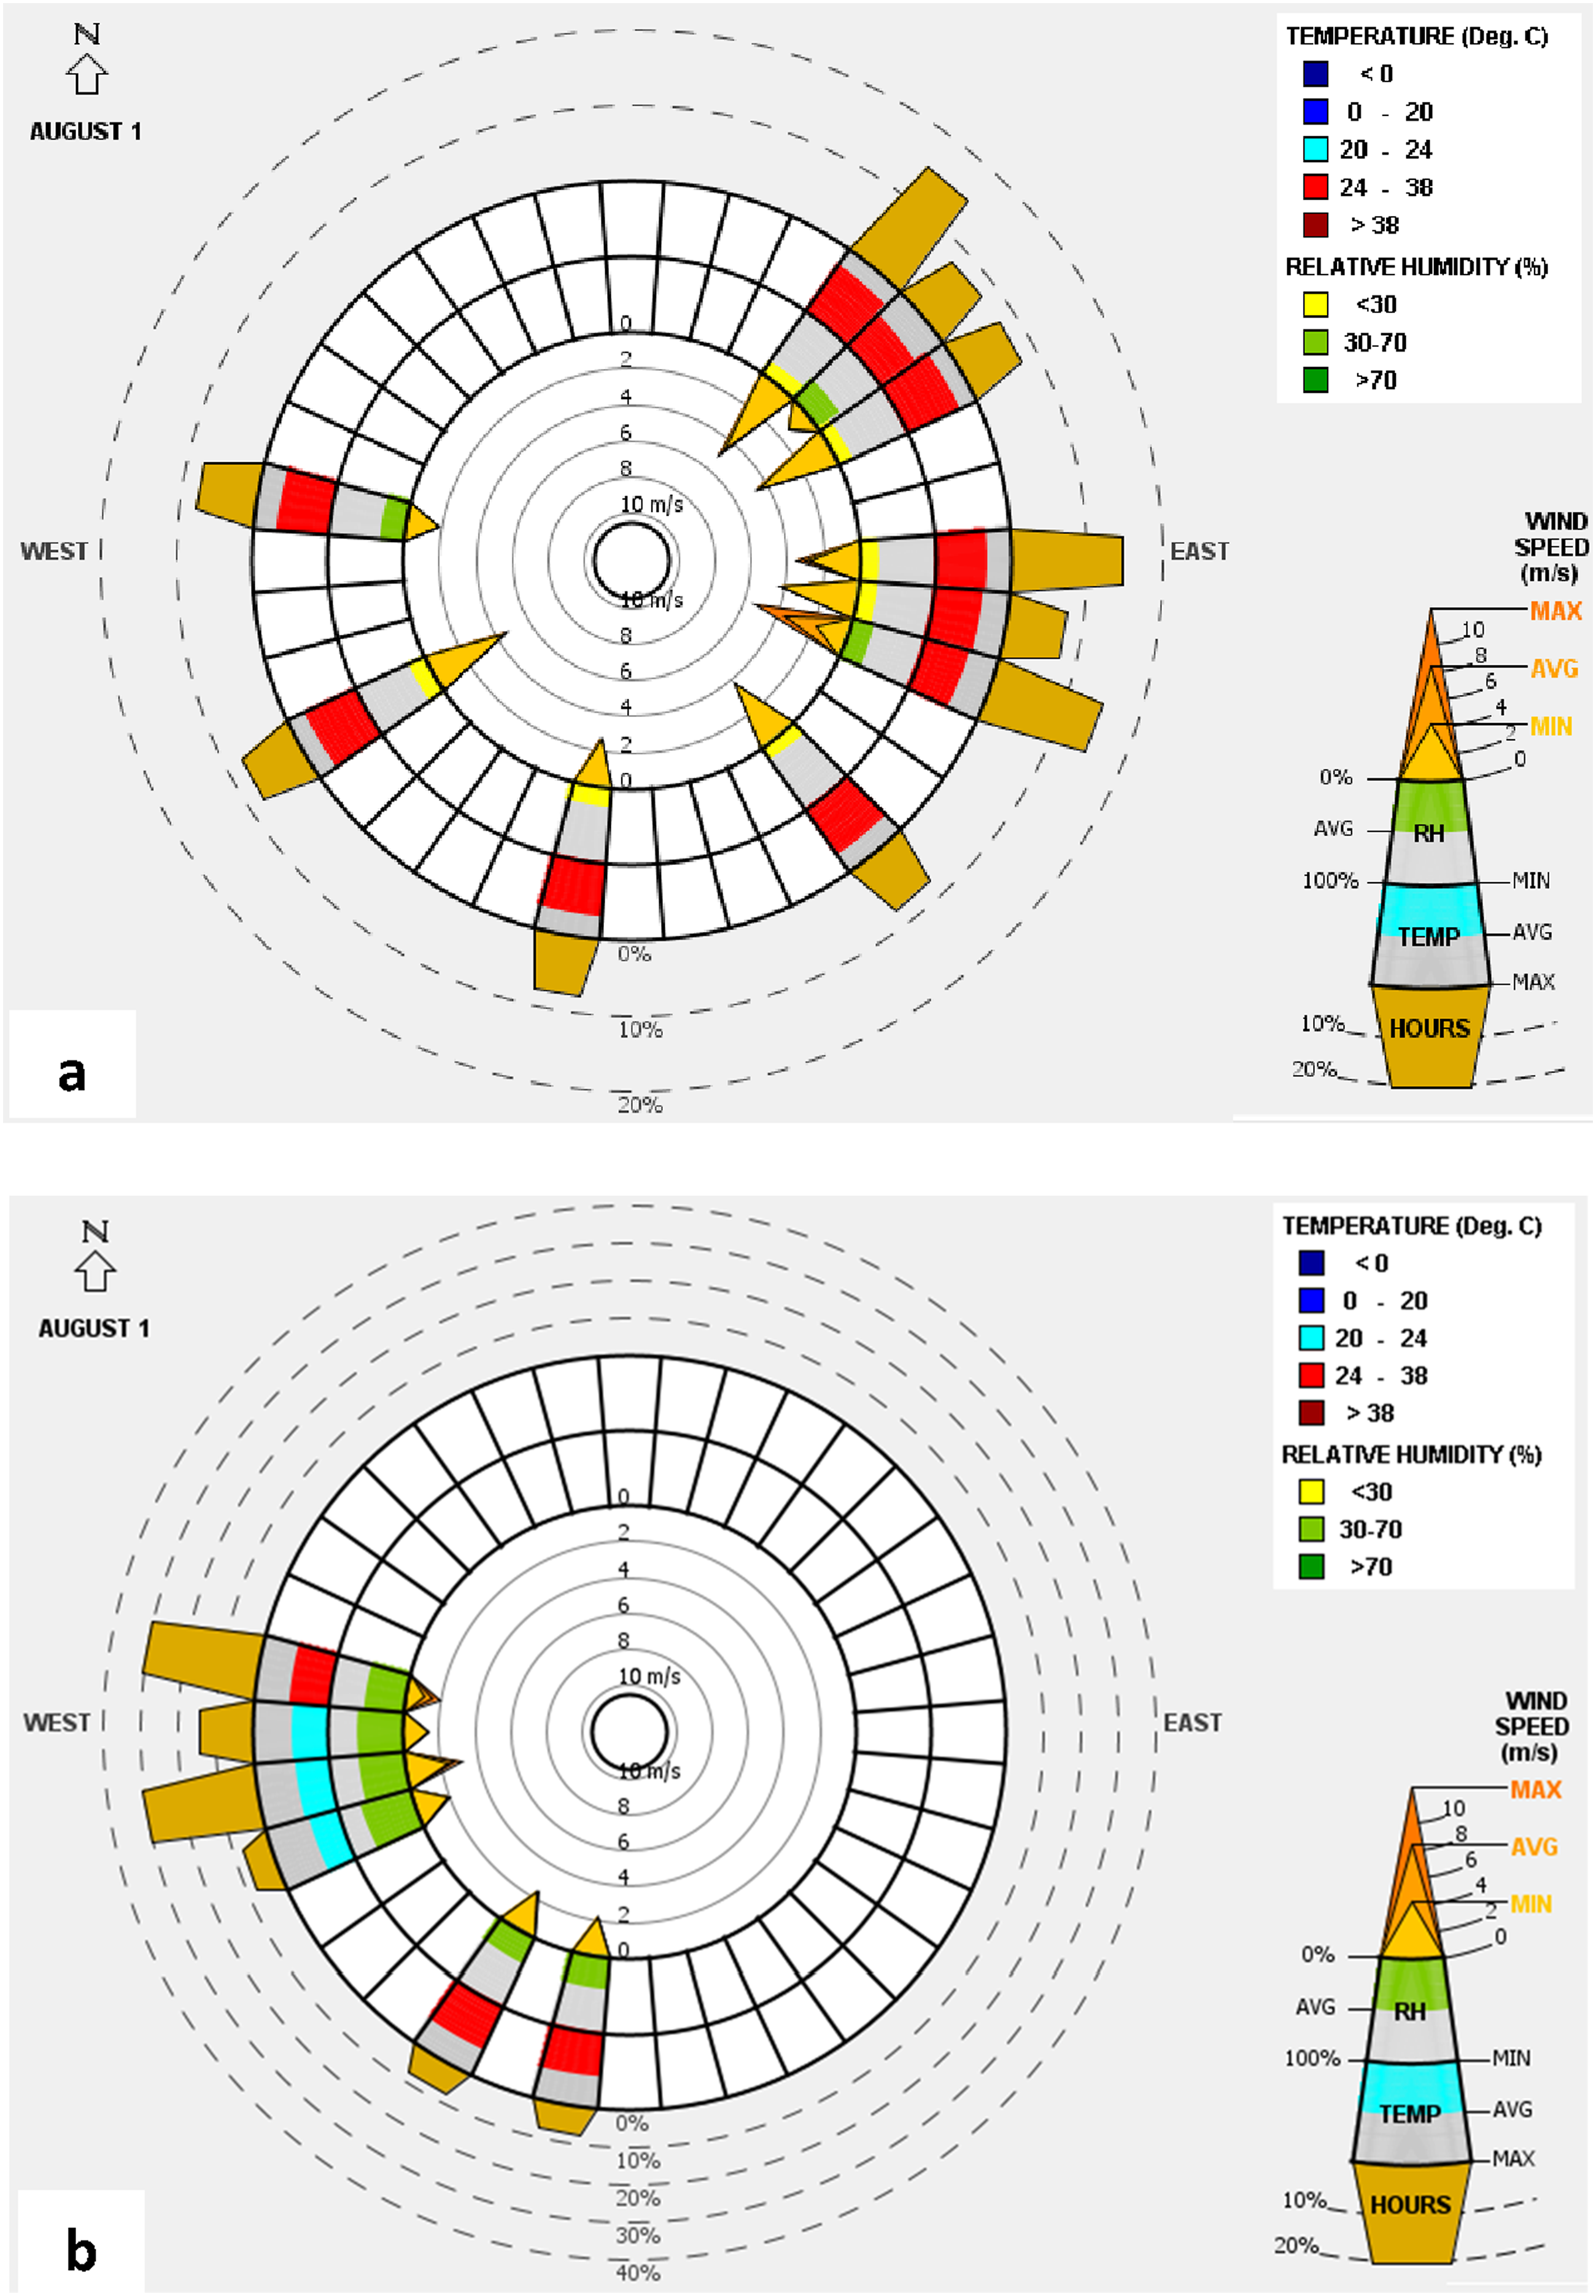
Potential of natural ventilation
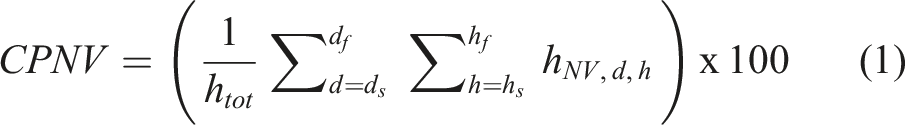
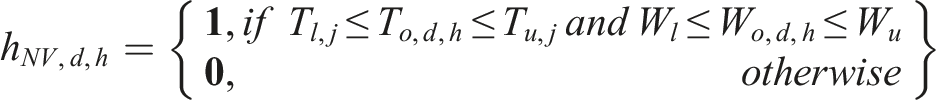
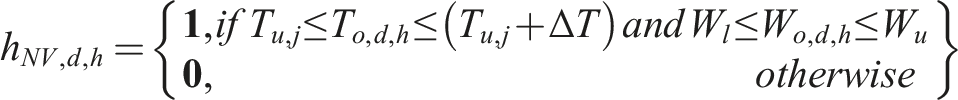
As shown in Figure 1, the potential of natural ventilation is primarily determined by the site’s climatic conditions. Climate parameters such as air temperature, humidity, atmospheric pressure and air quality are the bases for determining the potential of this heat dissipation system. This can be determined by calculating the CPNV index (Climatic Potential of Natural Ventilation), which quantifies the suitability of a climate for natural ventilation by taking into account the air temperature and humidity. Equation (1) gives the formula for calculating the CPNV index.
9
The set point temperatures (

According to equations (2) and (3), we noted that the set point temperatures calculated from the current climatic data vary between 18°C and 30°C. This is a vast comfort zone compared to the NM ISO7730 standard (20°C to 26°C) taken by the Moroccan thermal regulations.
Alternatively, if the average air velocity in buildings exceeds 1.2 m.s−1 and the air temperature set point is above 25°C, ASHRAE 55 allows for an increase in the acceptable upper limit of adaptive thermal comfort of 2.2°C.
25
This is presented by the CPENV index (Climatic Potential of Extended Natural Ventilation). This index can be calculated through equation (4).
25
The Total Climate Potential of Natural Ventilation (TCPNV) is defined by equation (5).

Building description
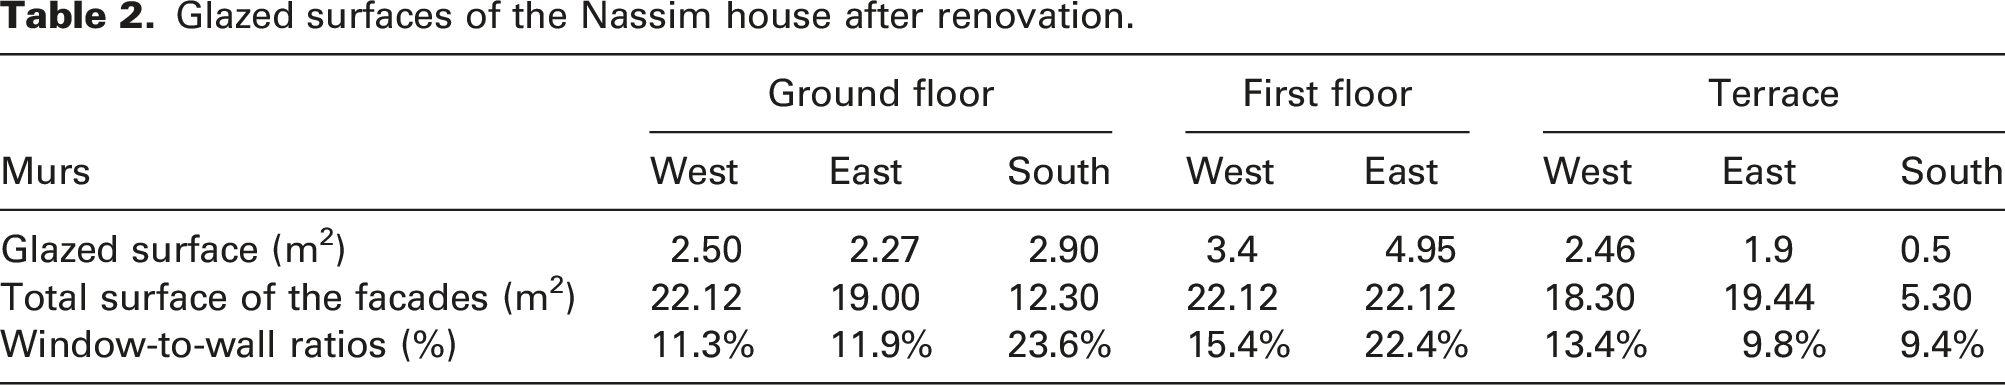
Glazed surfaces of the Nassim house after renovation.
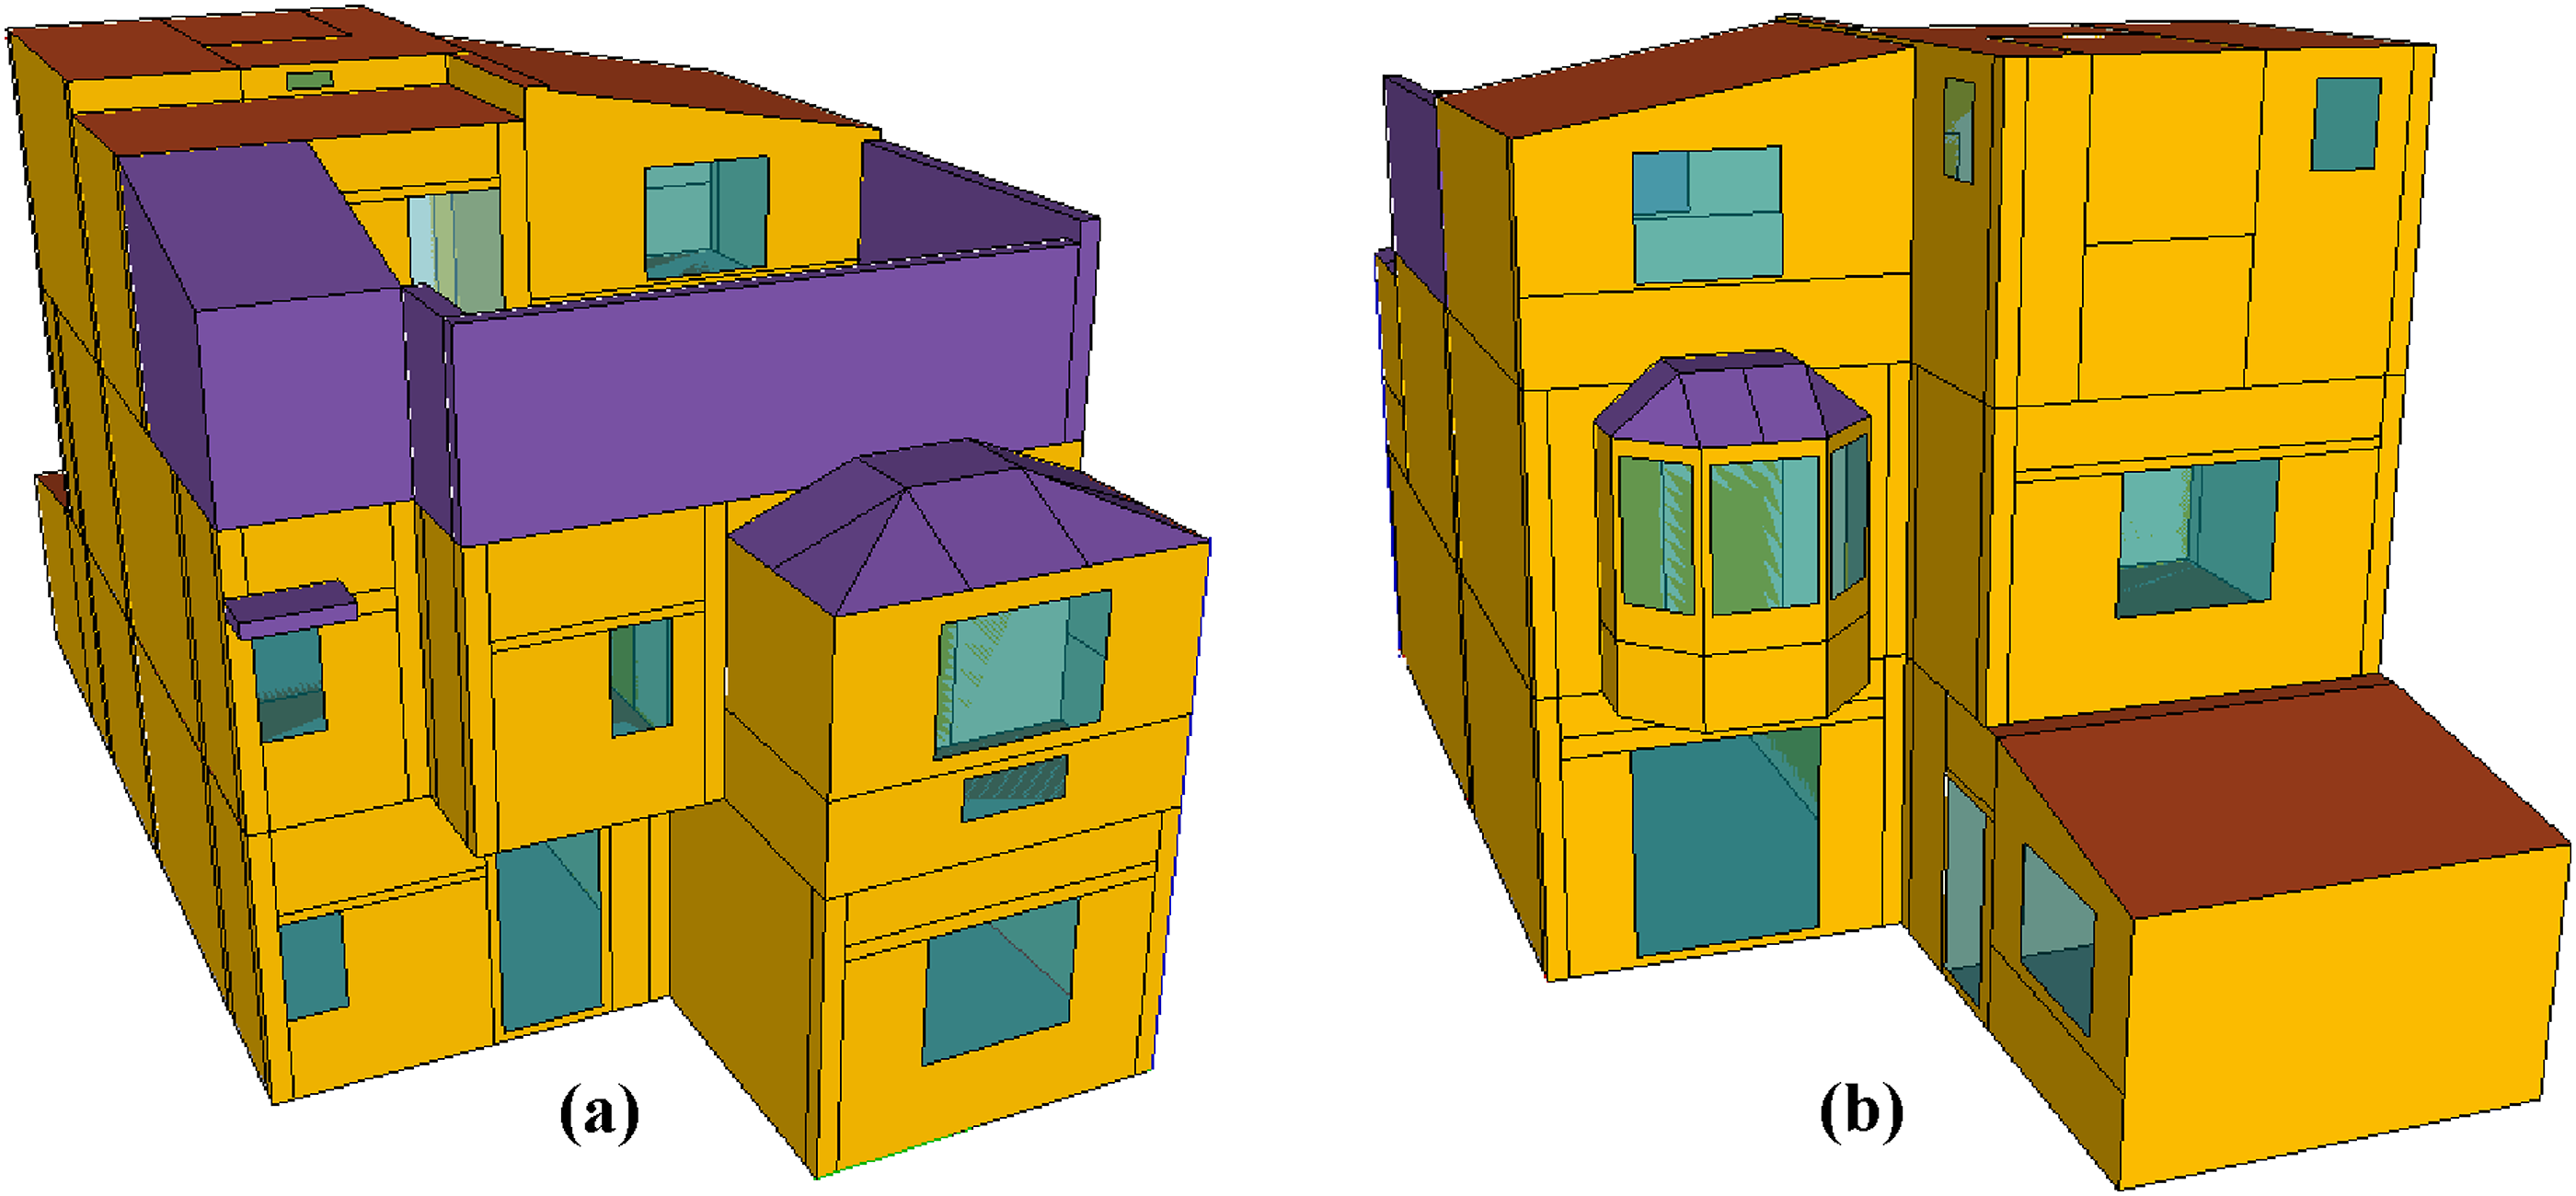
After renovation 3D model of the Nassim house implemented in Google SketchUp for TRNSYS: (a) west view and (b) east view.
Studies to improve the energy performance of this house have been the subject of several scientific publications.27–30 Many other technical details about this building are published on the ABC21 (Africa-Europe Bioclimatic Buildings for XXI century) project website.
31
The architectural plans of each floor of the house are given in Figure 7(a)–(c). (a) Ground floor architectural plan. (b) First-floor architectural plan. (c) Terrace architectural plan.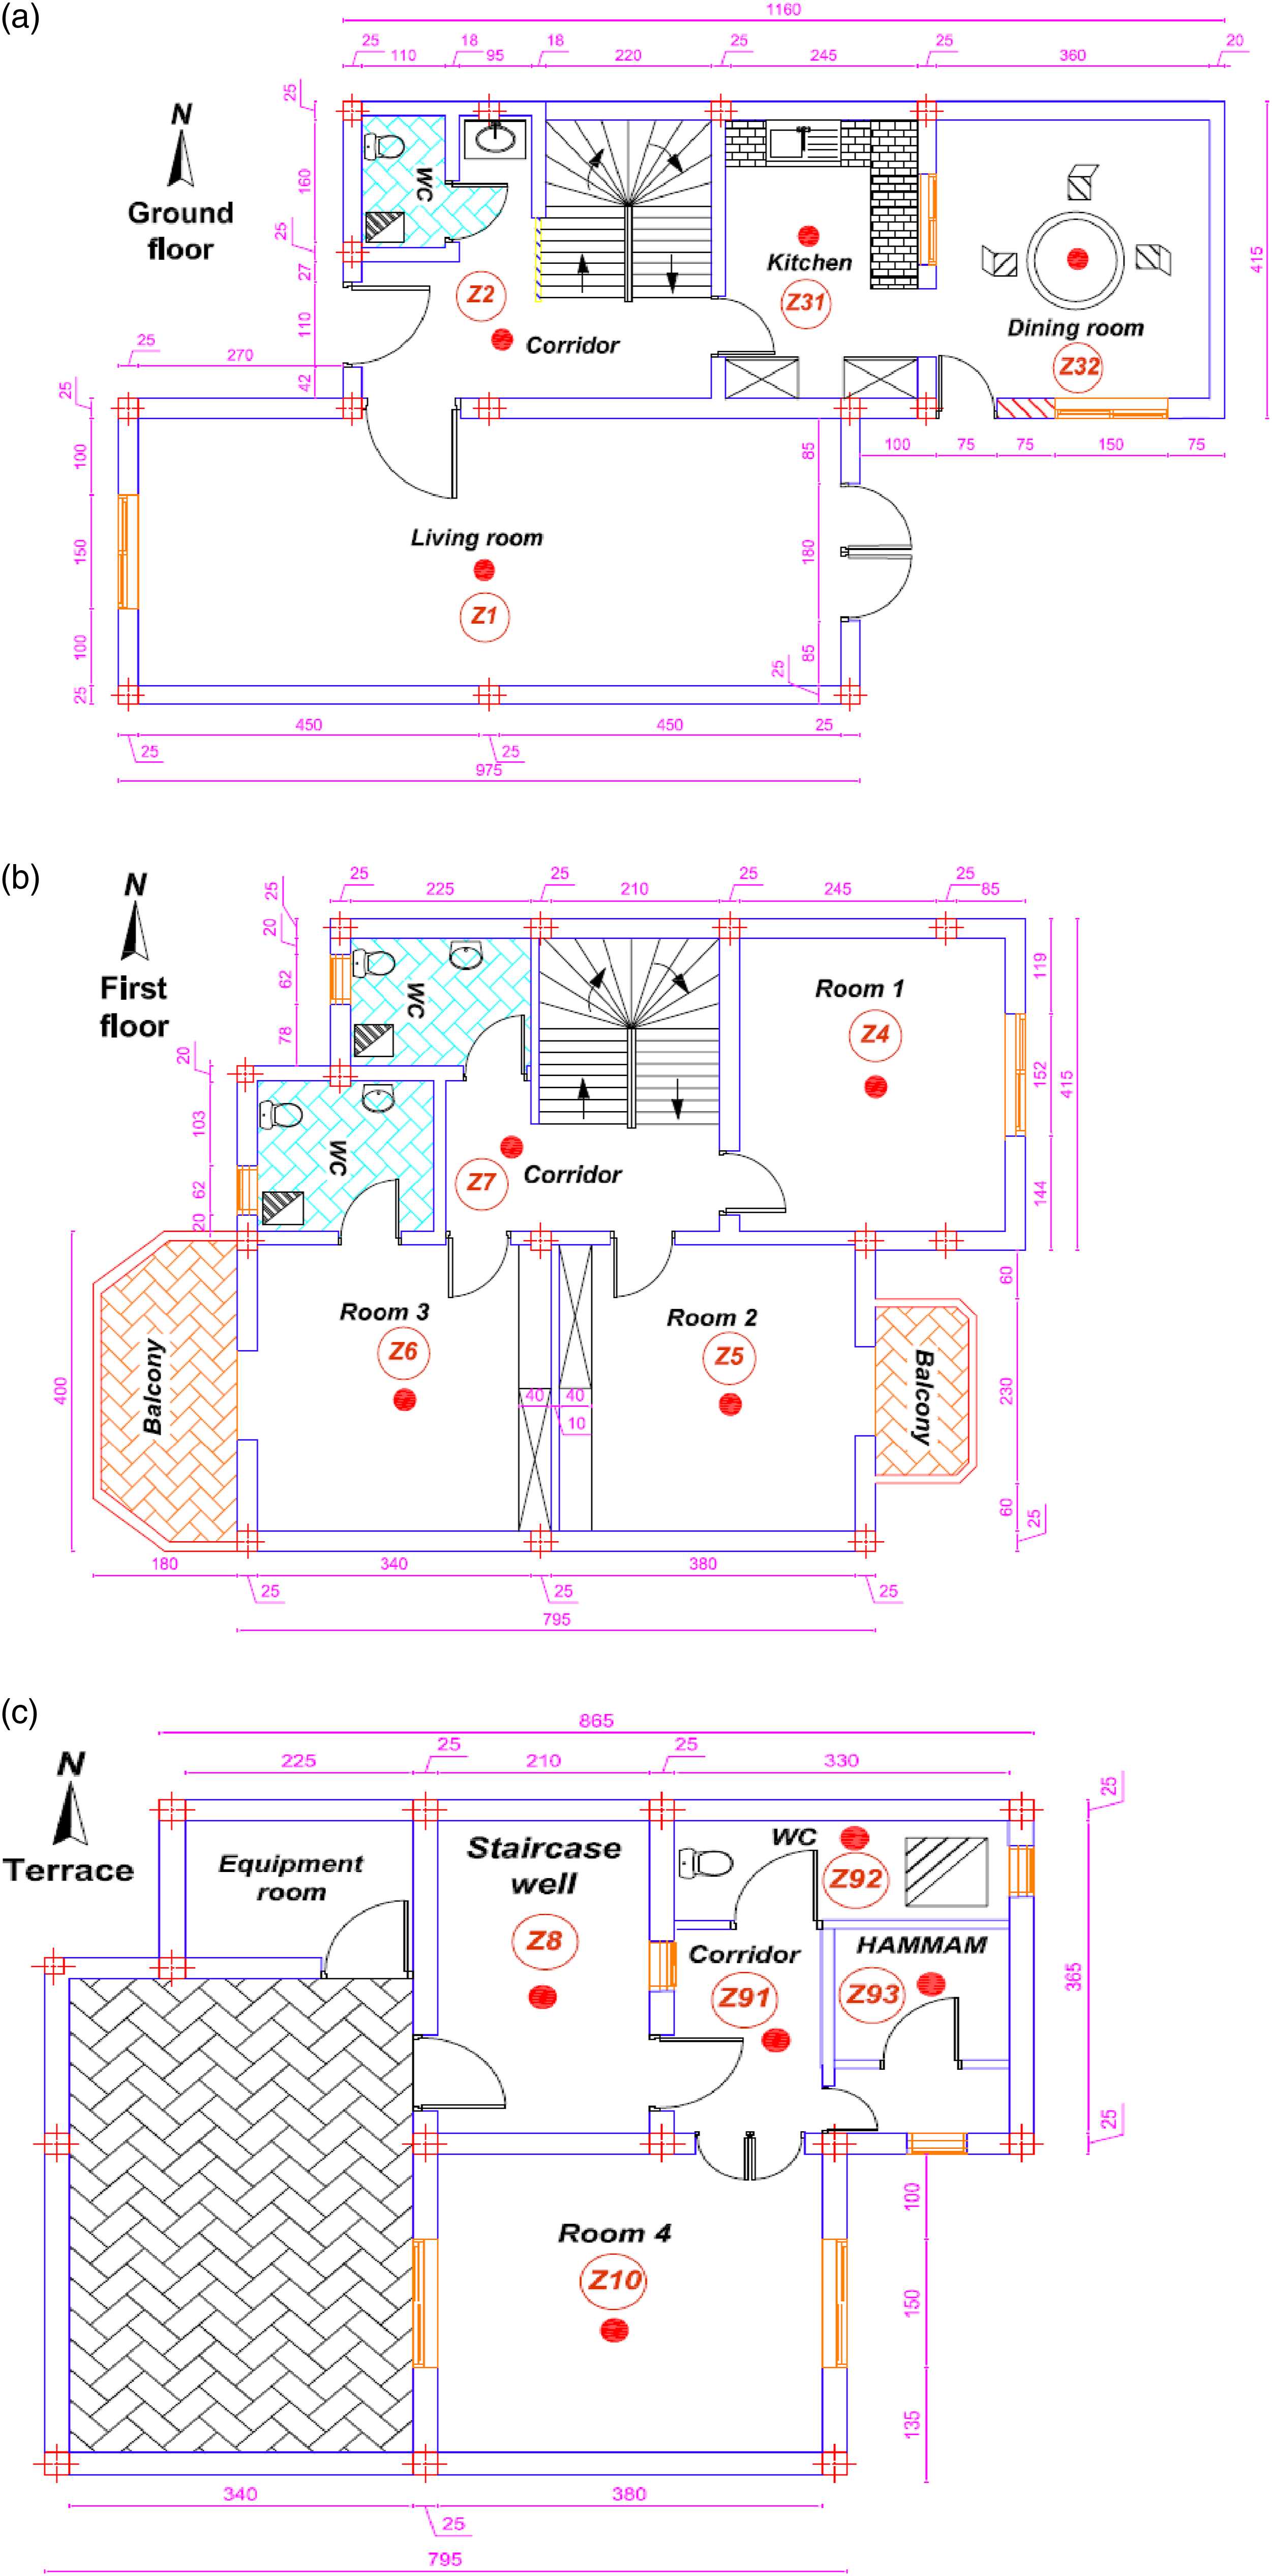
Simulation codes
The thermo-aeraulic simulations were made by coupling the TRNSYS thermal model 32 and TRNFLOW aerodynamic model. 33 The latter, having as COMIS (Conjunction of Multizone Infiltration Specialists) model of calculation, considers the building as a network of nodes communicating by links with the outside (cracks, openings, conduits and mechanical ventilation system) and with the interior (coupling between the zones). The internal nodes represent the thermal zones or a group of zones, and the external nodes represent the environment of the building at the level of the openings. The aeraulic transfer between the nodes is generally based on the power laws that give the airflow as a function of the pressure difference. Indeed, the different rates are calculated by expressing the mass conservation equation in each network node. The conservation of the mass is checked for each thermal zone of the building. The temperature and the density of the air are known, thanks to the coupling with the Type 56 (Multizone Building), which receives as input the flows calculated by TRNFLOW. The latter uses a file that describes the zones and air-conditioning connections that make up the building. Both models iteratively exchange data at each time step until convergence (ping pong). The airflows in the simulation take place between the different thermal zones of the house as well as between the exterior and the interior via the doors and windows.
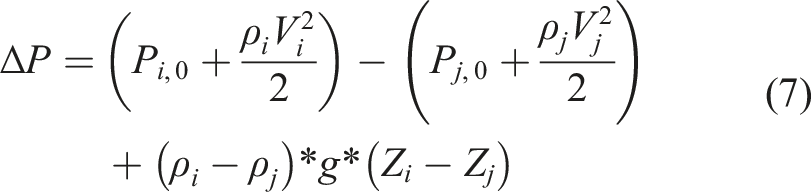
In order to simulate the hourly air temperature in each zone and to obtain more realistic modelling, we have subdivided the house into several thermal zones (see Figure 7(a)–(c)). The hypotheses adopted for the thermo-aeraulic simulation are as follows: • The air mass of each zone is conserved; this principle implies that the airflow entering a zone is equal to the outgoing one. • The aeraulic connections between the different thermal zones are represented by empirical or semi-empirical laws connecting the airflow between the zones at the pressure difference between them. The differential pressure is calculated by Bernoulli’s relationship. • The air temperature is fixed for the entire time step. These temperatures make it possible to calculate the pressure due to the thermal draft between two zones (constant pressure on the time step). The Bernoulli relationship as shown in equation (7) allows for determining the pressure difference between two thermal zones. • The air temperature and the average radiant temperature are the two parameters used for evaluating the thermal conditions. The combination of these two temperatures gives the operative temperature, which is calculated from equation (8).

In order to evaluate the thermal load and thermal comfort inside the building, it is essential to consider the internal thermal gains due to occupants, the machines and the artificial lighting. Indeed, the human body can be likened to a thermal generator whose power depends on the activity exerted. Two scenarios of realistic occupations of the Nassim house distinguished between the days of the week and the weekend. The power dissipated by people according to the activity nature was estimated by TRNSYS according to EN ISO 7730.
23
Figure 8(a) and (b) show the occupancy profiles in the different thermal zones of the house during the days of the week and the weekend. Occupation scenario of the different thermal zones of the house, (a) during the weekdays; (b) during the weekend.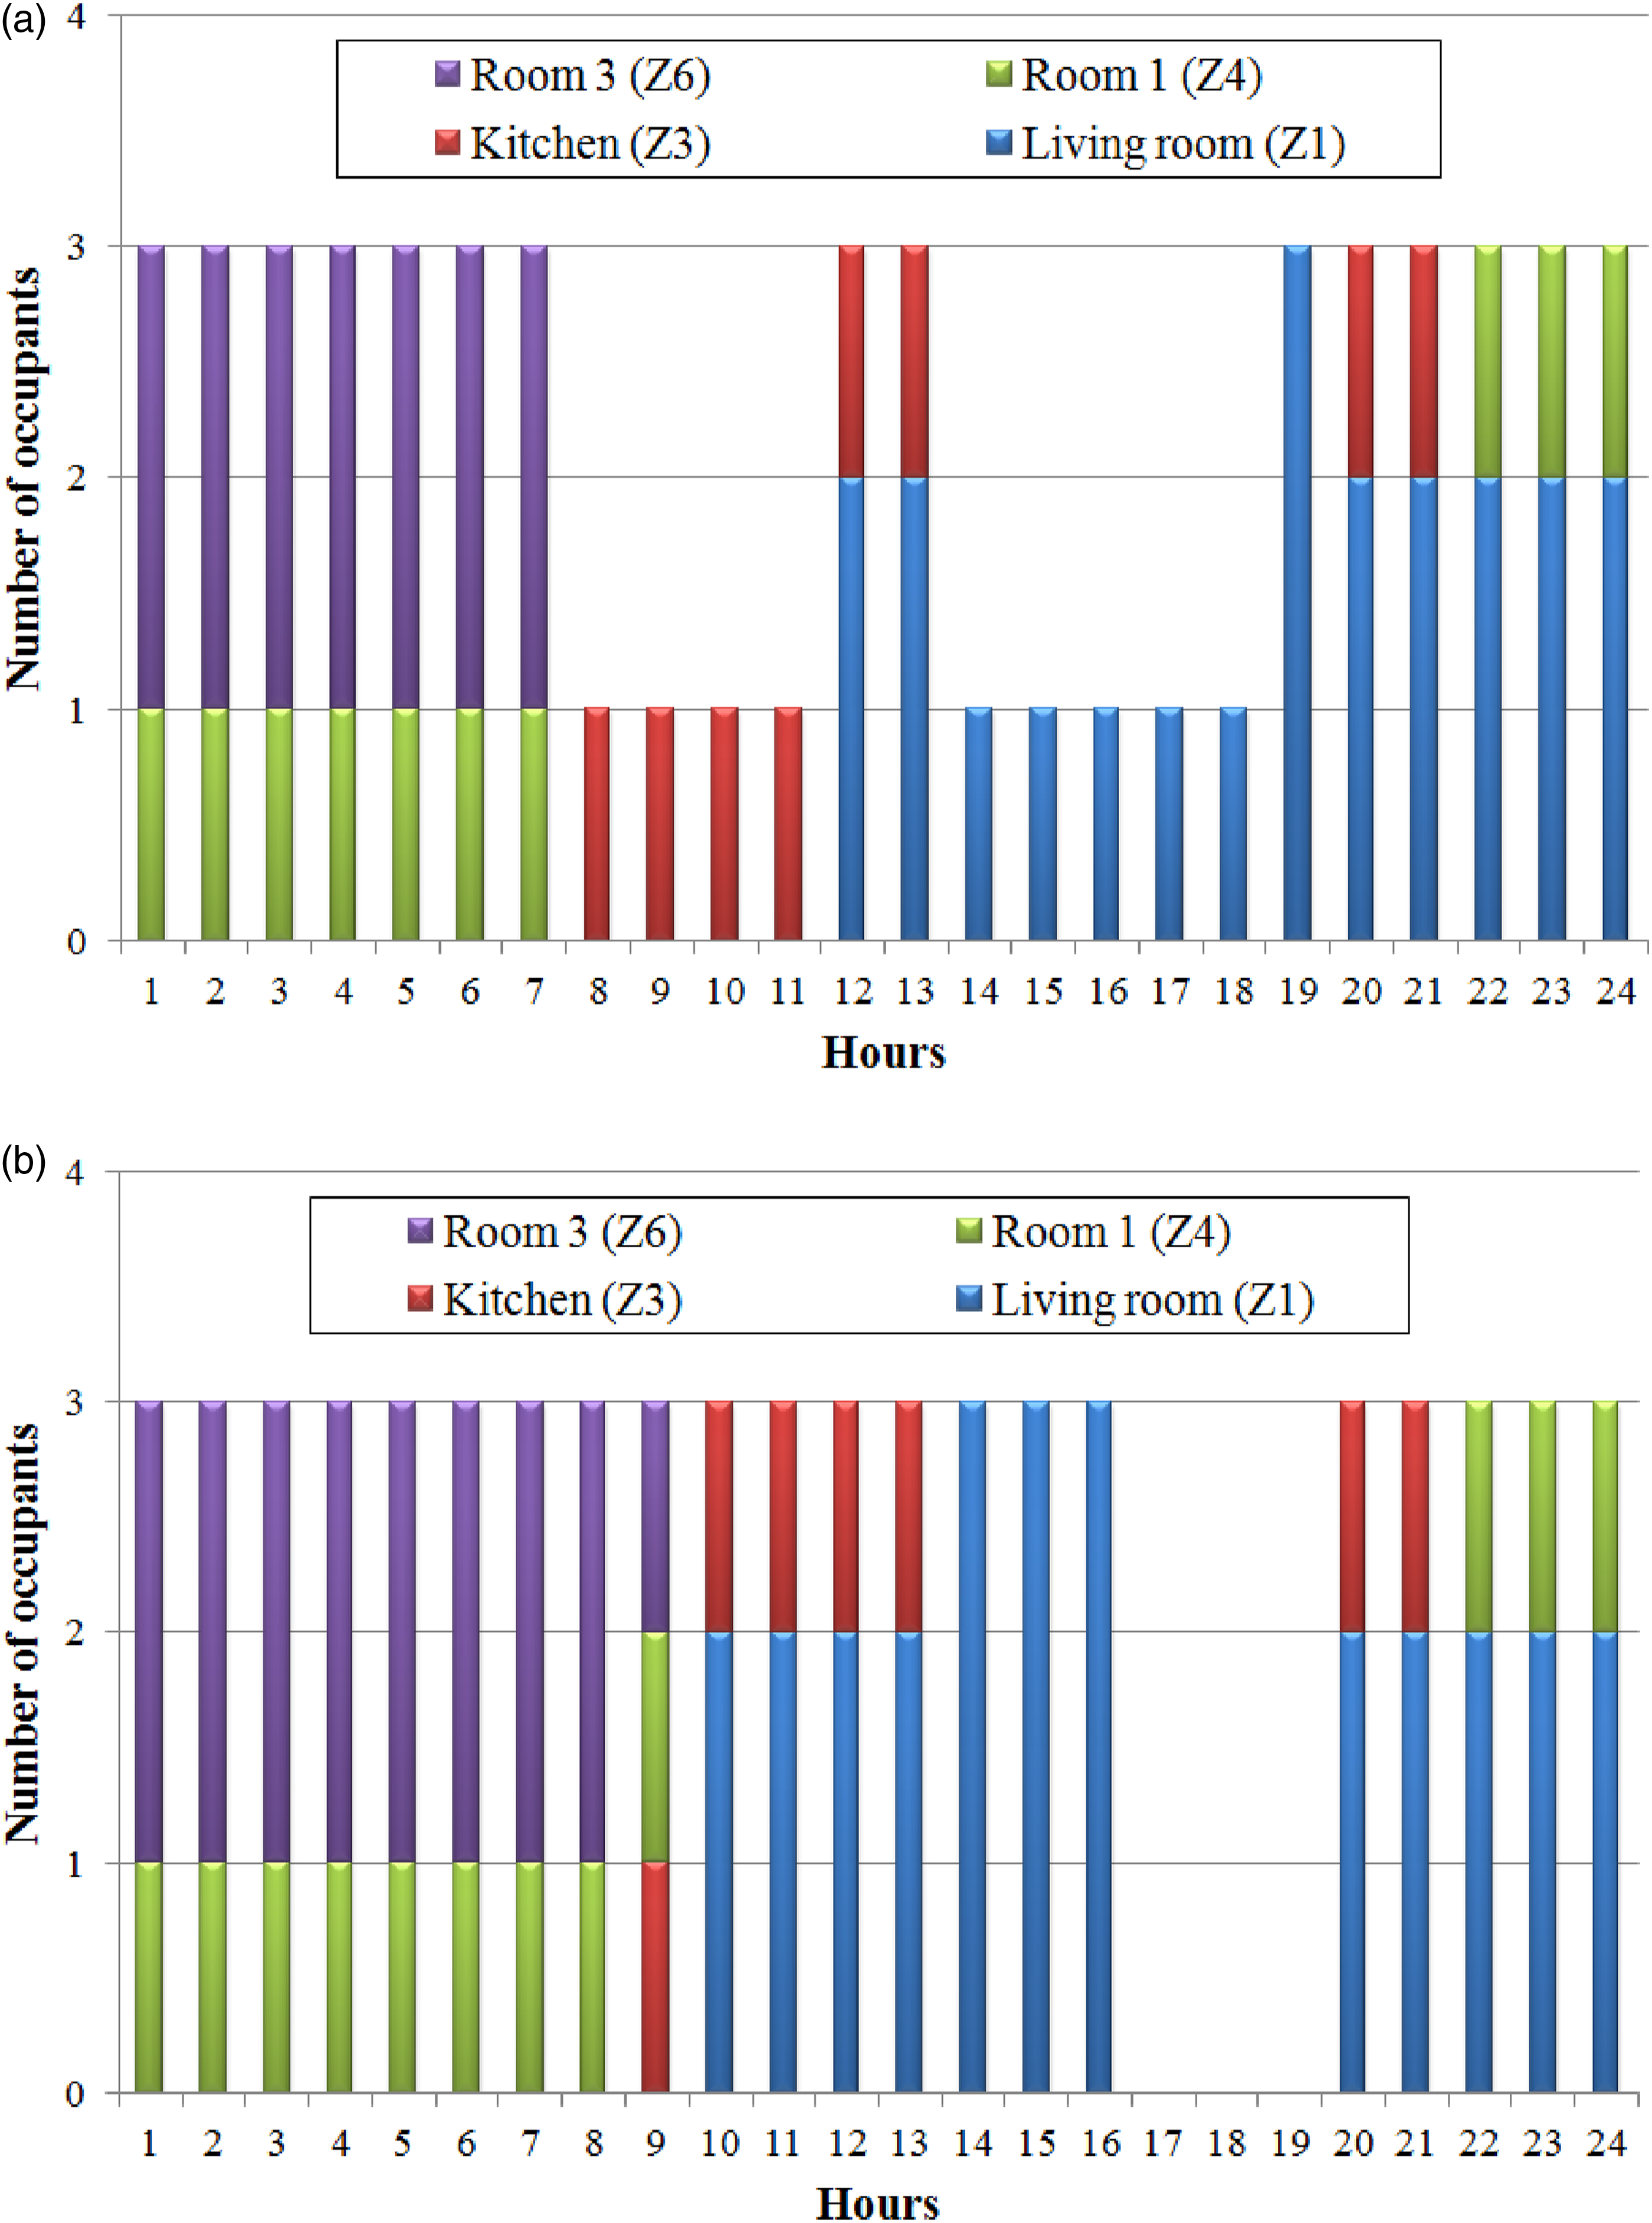
Meteorological data
The dynamic thermal simulations of the studied building were made by two meteorological files; the first one used for this work was TMY (Typical Meteorological Year) provided by Meteonorm.
22
It was used for parametric studies since it is more representative than the measured data over a year. In contrast, the second file presents the meteorological predictions of Marrakesh city. Indeed, the Fifth Assessment Report of the Intergovernmental Panel on Climate Change (IPCC) defined four climate change scenarios, named Representative Concentration Pathways (RCPs): 2.6, 4.5, 6.0 and 8.5. These prediction scenarios change according to the concentration of greenhouse gases by 2100.
20
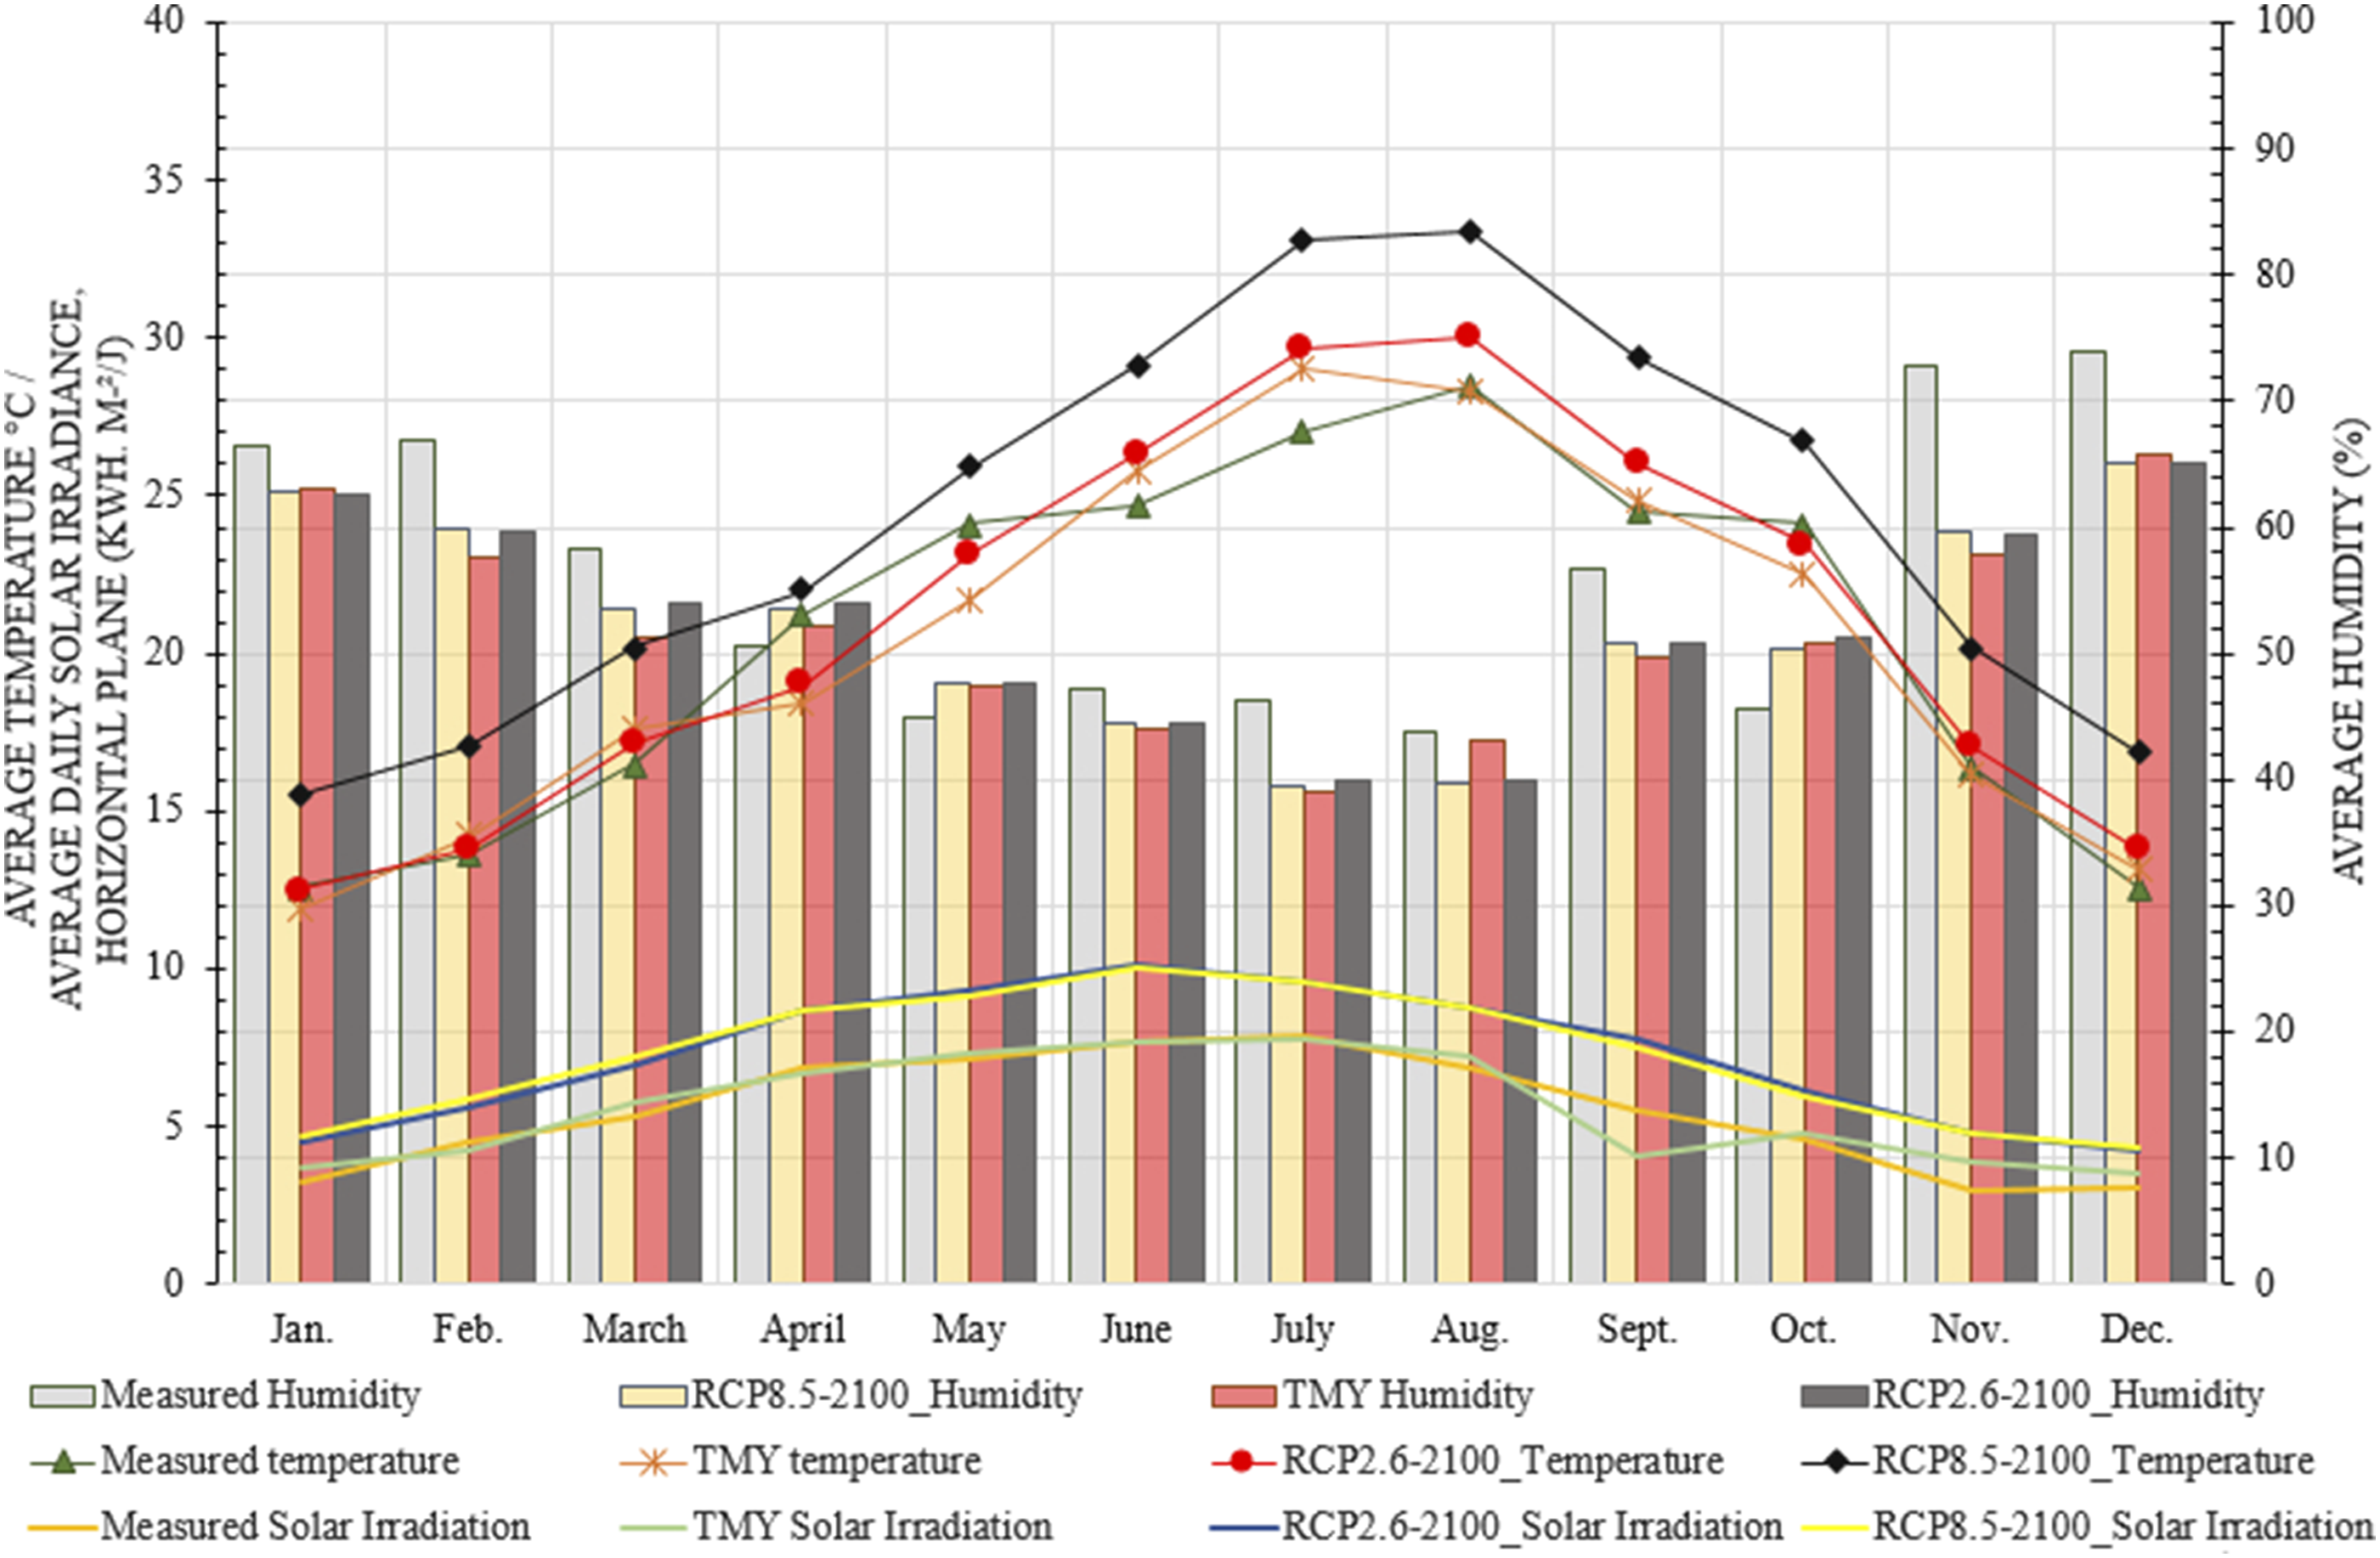
Two extreme scenarios of RCP were used in this study (2.6 and 8.5). The first scenario estimated stable greenhouse gas emissions, while the second scenario reflected an exponential increase in global warming by 2100 (see Figure 9). Figure 10 summarizes all the meteorological data used in this study. Variation of the global mean temperature change according to the predictions of two scenarios: RCP 2.6 and RCP 8.5.
20
Some meteorological data from the different used weather files.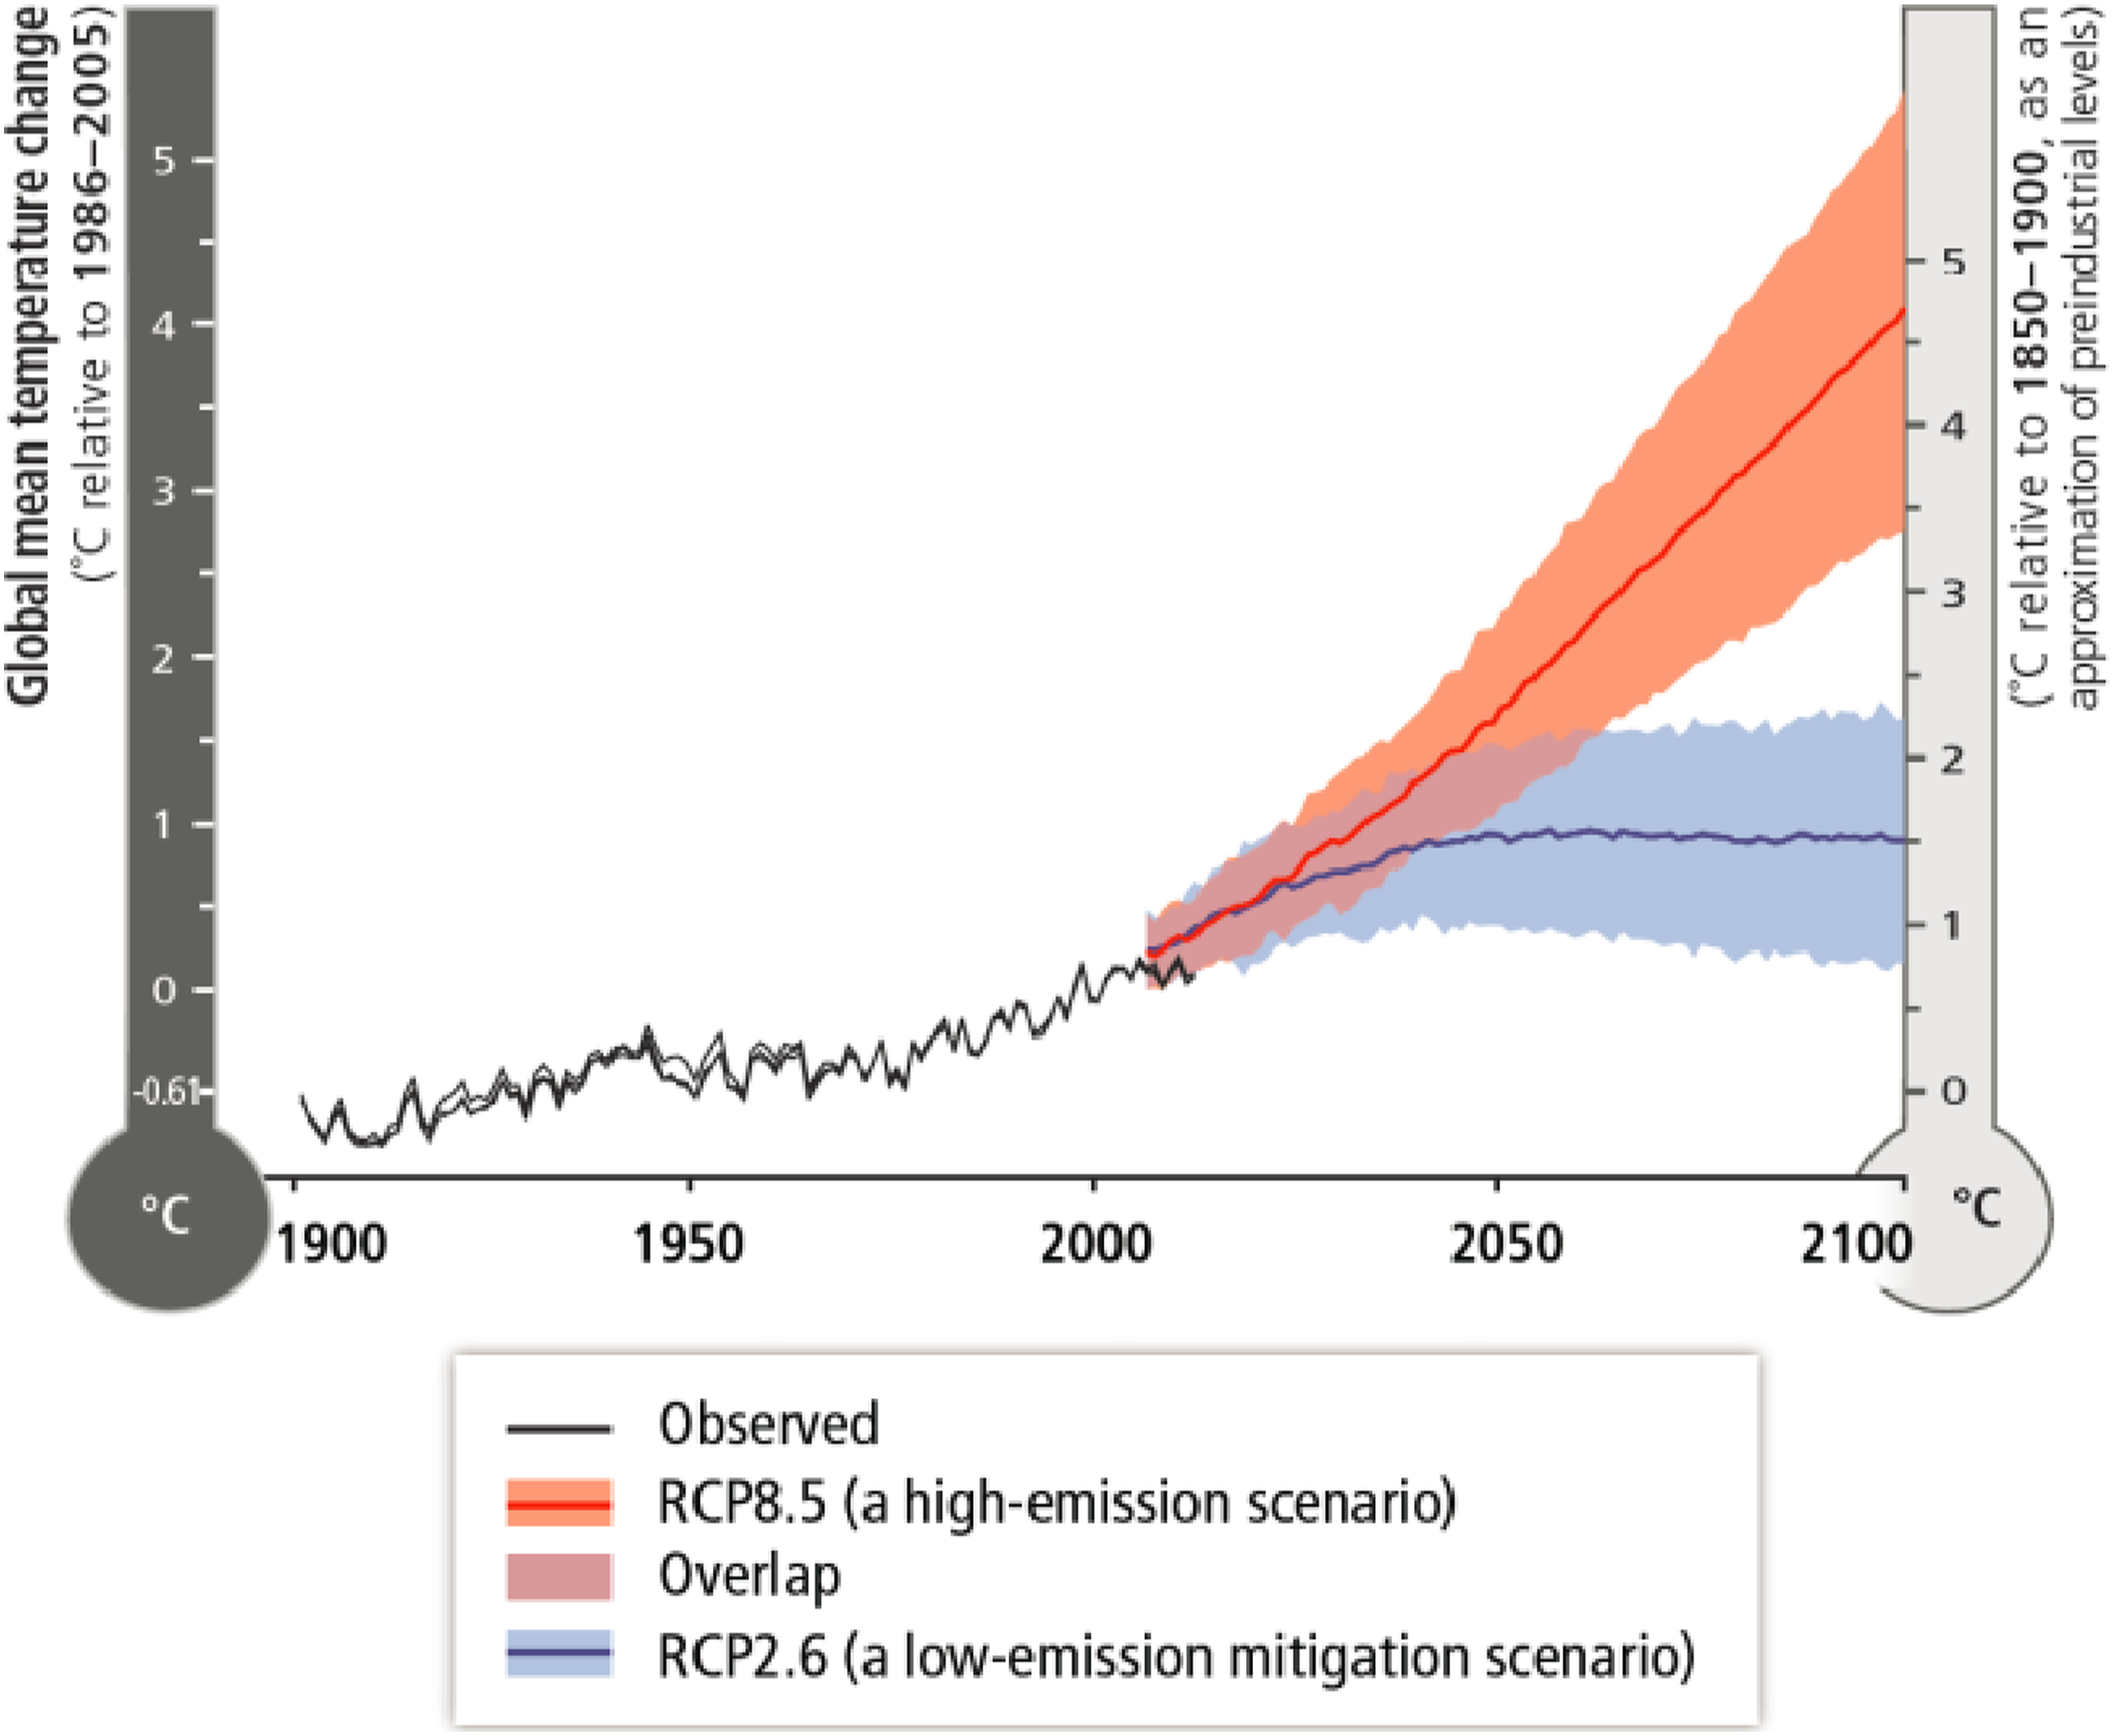
Field measurement
Building monitoring
In addition to monitoring the unoccupied house before and after renovation, as presented in previous studies, we conducted another monitoring with an occupied house during a hot and dry period. Figure 11 shows the external climatic conditions (outdoor ambient temperature and global solar radiation) during this measurement companion. The measurements were made over 5 days from 8 to 12 July, according to the objective of the study to determine the building’s thermal behaviour during the occupation conditions with the presence of natural ventilation. The main objective of these measurements was to validate the thermo-aeraulic simulation model. This validation was made by comparing the simulation results with the measurements. Outdoor ambient temperature and global solar irradiance on a horizontal surface during the summer measurement campaign.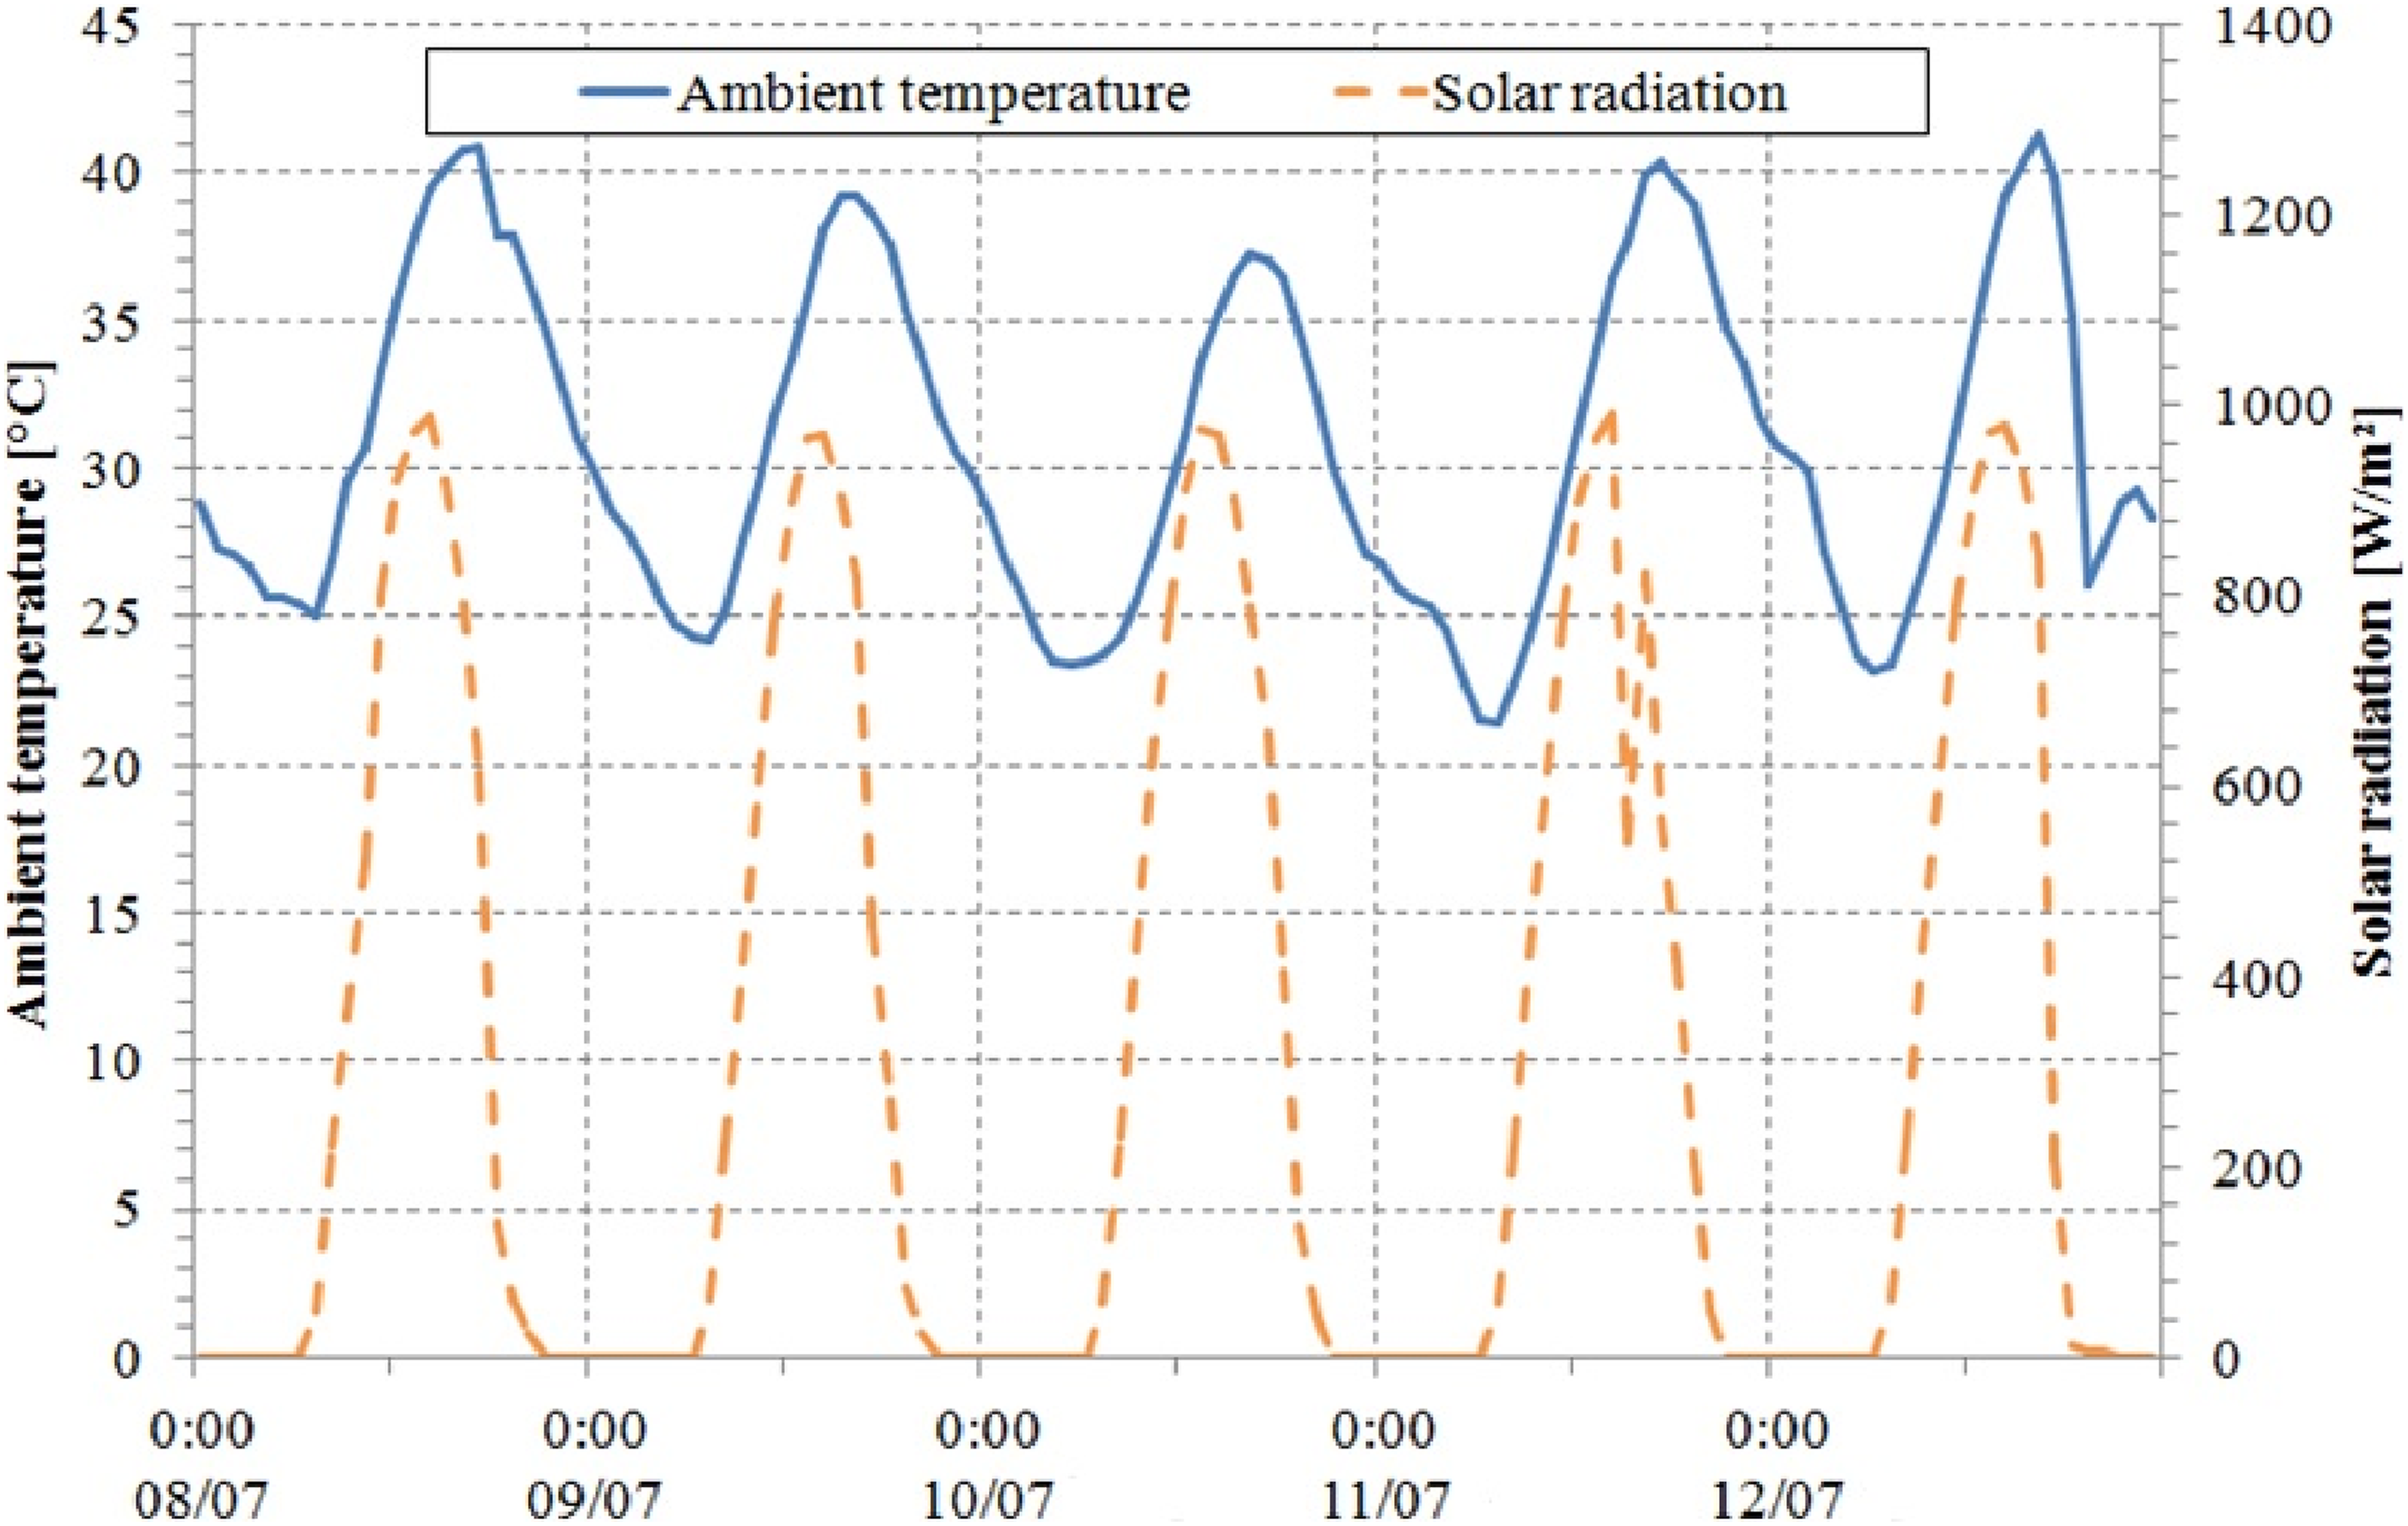
Measurements of the air temperature and the relative humidity were carried out using Testo174H installed in each thermal zone of the Nassim house. These data-loggers measure air temperature and humidity with an accuracy of ±0.5°C and ±3%, respectively.
Weather data measurement
In situ measurements of meteorological data were made through a weather station installed on the terrace of the Nassim house (see Figure 12). The main objective of these measurements is to validate the results of the thermo-aeraulic simulation model. Indeed, to compare the simulated air temperature with the measured one, we used the weather data measured in situ to simulate the thermal behaviour of the house. BWS200 weather station installed on the terrace of the Nassim house.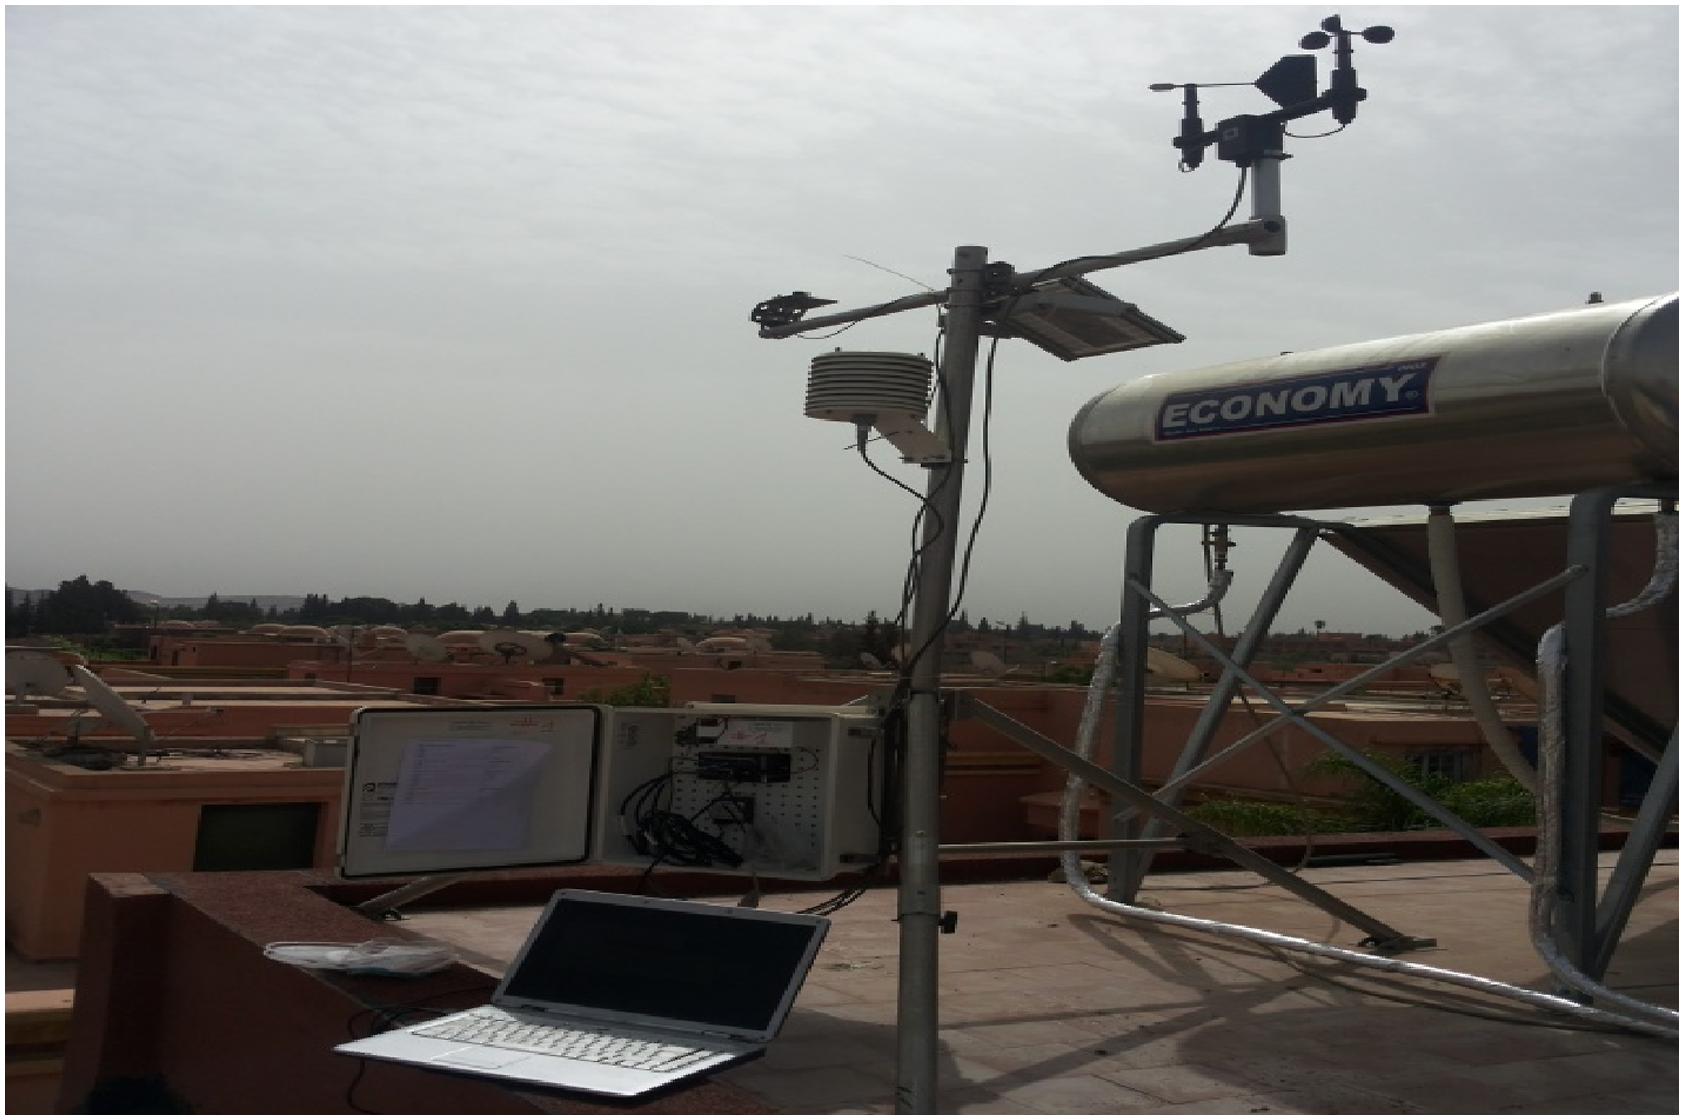
Results and discussion
Simulation model validation
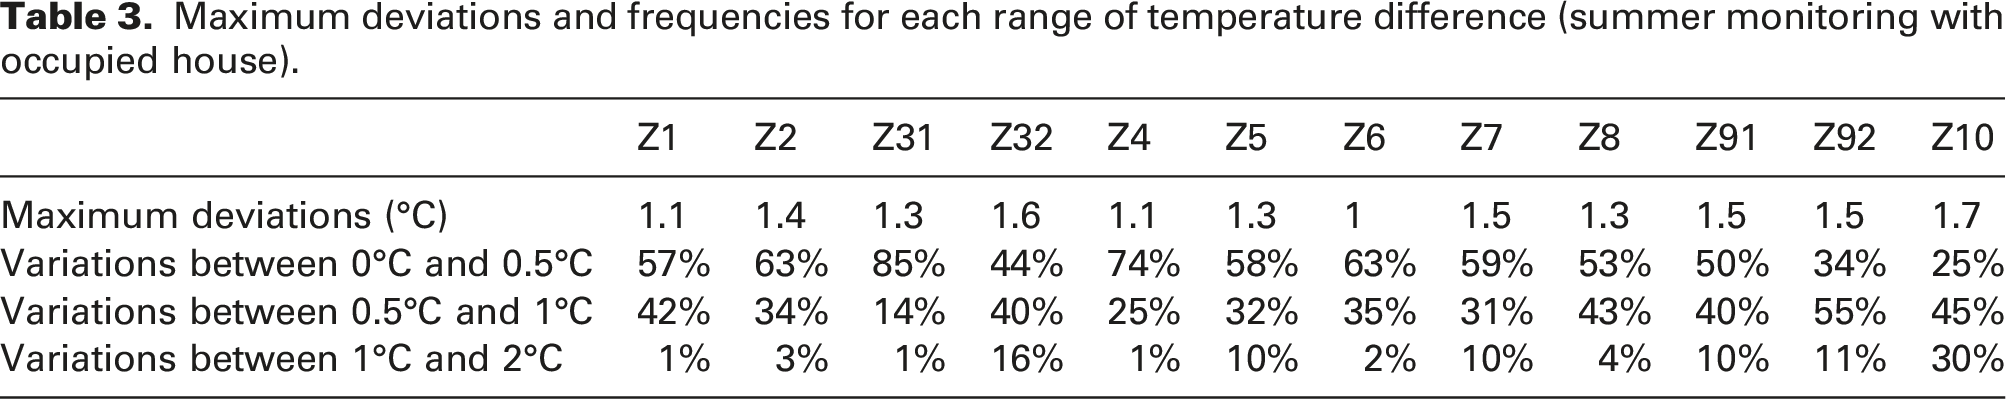
After analyzing the occupation circumstances, we simulated the ‘Nassim house’ with the same monitoring conditions. The indoor air temperature in each thermal zone of the house obtained from the thermo-aeraulic simulation was compared with the measured one. This comparison allowed us to visualize the reliability of the thermo-aeraulic model. Figure 13(a)–(c) present comparisons between measured and simulated air temperatures for some thermal zones of the renovated house. These figures show a good concordance between these temperatures. Table 3 presents the maximum deviations and these frequencies for each temperature range. According to this table, the absolute differences between the simulated air temperatures and those measured do not exceed 1.7°C. Indeed, the maximum deviation was produced in thermal zones Z32 and Z10, which have low thermal inertia because the walls/roof of these thermal zones are heterogeneous (concrete block and wood), which created physical interactions that are difficult to model. The analysis in Table 3 shows that 90% of absolute deviations were less than or equal to 1°C, while only 10% were between 1°C and 1.7°C. These statistics indicate that the thermo-aeraulic model is valid for use in the parametric study. Measured (hourly averaged) and calculated air temperatures, (a) in the thermal zone Z1 (GND floor); (b) in the thermal zone Z6 (First floor); (c) in the thermal zone Z91 (Terrace). Maximum deviations and frequencies for each range of temperature difference (summer monitoring with occupied house).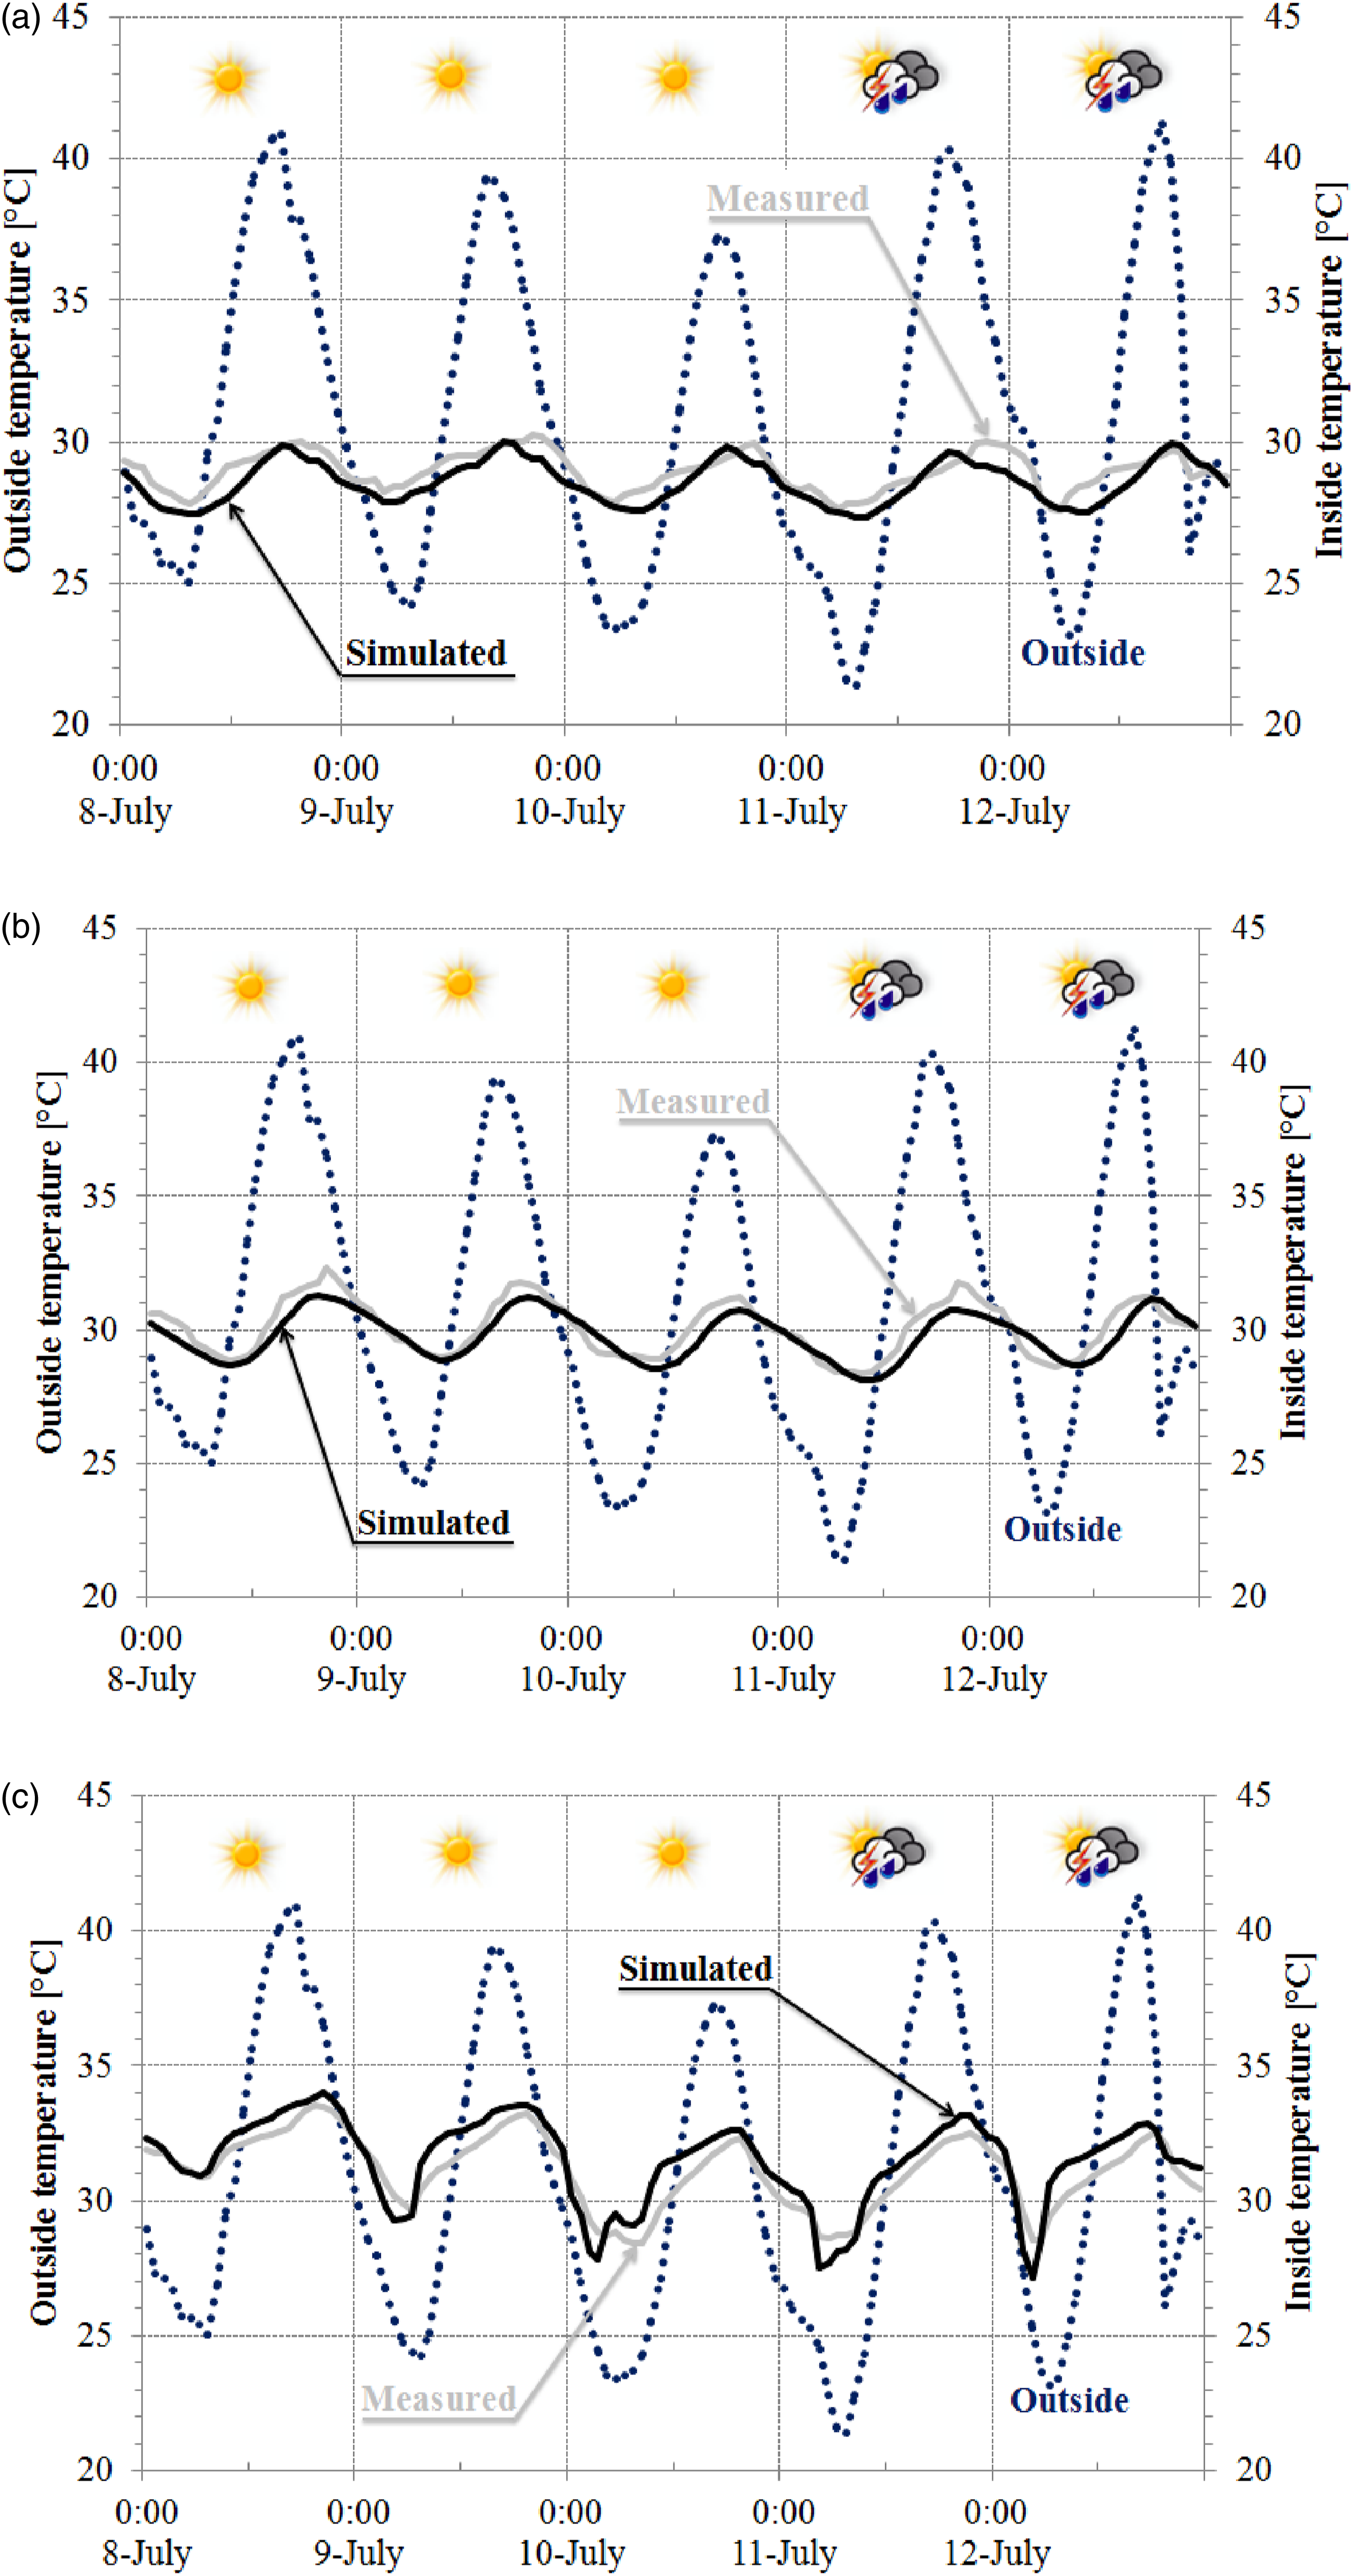
Assessment of natural ventilation strategies
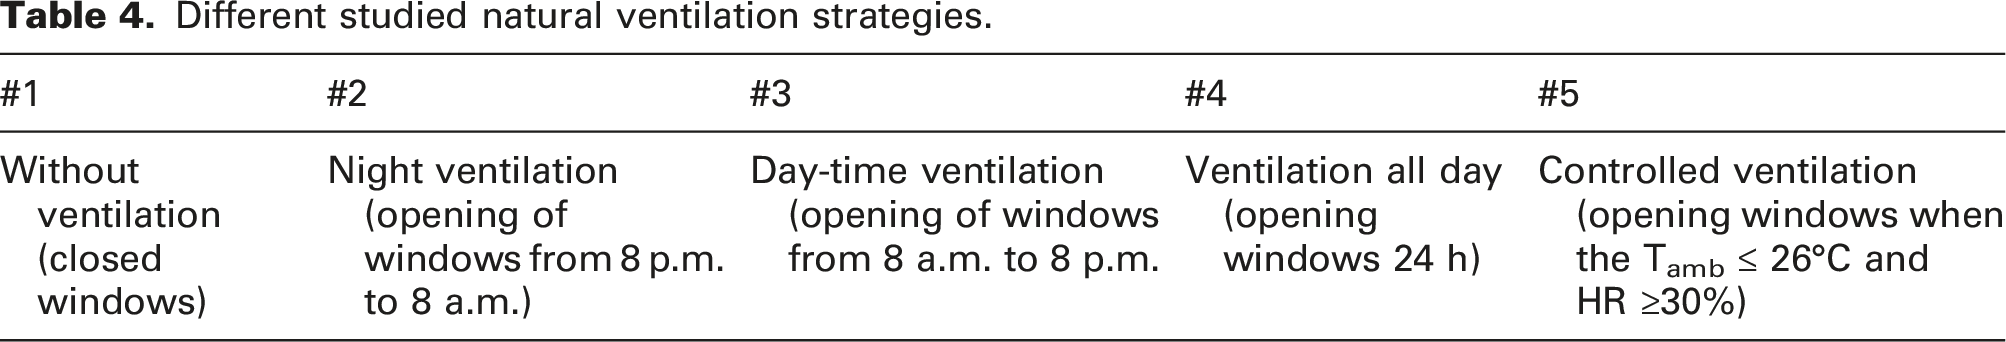
Different studied natural ventilation strategies.
Cooling load analysis
Following our previous study and investigations on thermal comfort, we found that using active cooling systems in Marrakesh was indispensable from May to October. To this end, we evaluated the potential of each natural ventilation strategy by comparing the cooling loads during this period.
Annual cooling load for each natural ventilation strategy.
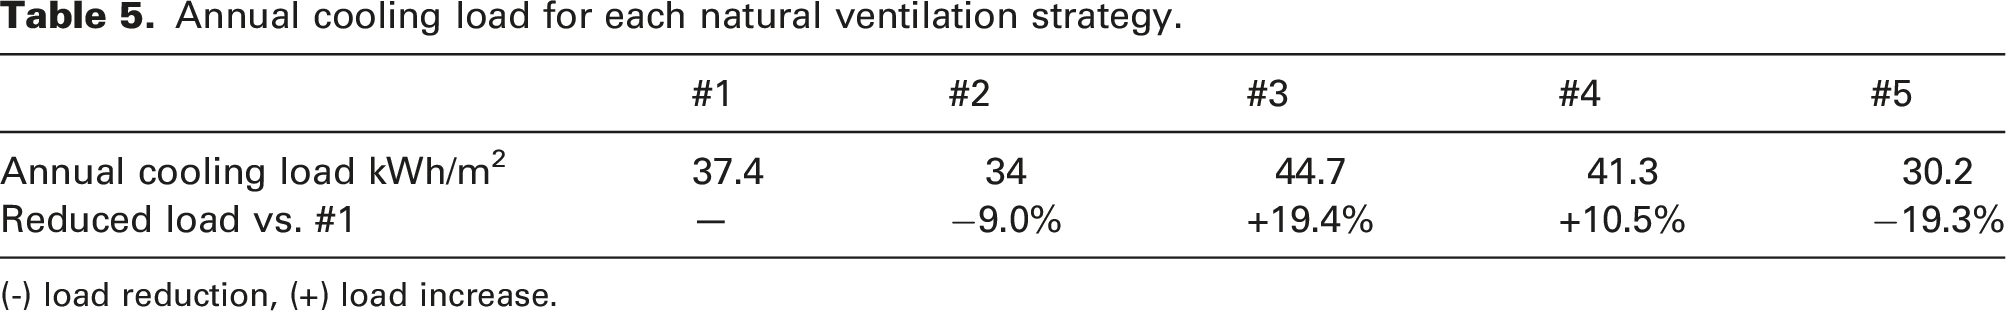
(-) load reduction, (+) load increase.
Moreover, the night ventilation effectiveness in summer is much accentuated during the end of the night (between midnight and 6 a.m.) because the outdoor ambient temperature is around 20°C with an average humidity rate between 50% and 60%. In variant #2 (Night-time ventilation), we considered that the windows open from 8 p.m., but generally, in July/August and for several days, we could have an outdoor ambient temperature that exceeds 30°C with a humidity level of less than 30% after sunset, which decreases the night-time ventilation potential. This prompted us to look for a new opening strategy to deal with this problem. Variant #5 is the new strategy; it is based on an intelligent window-opening system depending on the external climatic conditions. This strategy consists of windows opening when the outdoor ambient temperature is less than or equal to 26°C and the relative humidity is greater than or equal to 30%. The comparison of this new window opening strategy showed us a reduction in cooling load of about 19.3% compared to reference variant #1 and 11.2% compared to night-time ventilation #2.
For this smart controlled strategy, sensors and small electric motors must ensure the windows opening and closing control. The electrical consumption of these devices is negligible compared to the energy reduction of the cooling and ventilation load. In the case of the Nassim house, this energy can be provided by the excess production of the photovoltaic panels installed on the terrace.
Indoor operative temperatures analysis
In order to approve the effect of night #2 and controlled #5 ventilation on thermal comfort inside the building, we analyzed and compared the operative temperatures (Top) of each ventilation strategy. The monthly average operative temperatures for each strategy presented in Table 4 are given in Figure 14(a)–(c). These temperatures were calculated over the period of overheating. From these figures, we found that as for the cooling load, night-time ventilation #2 and controlled ventilation #5 significantly reduced the house’s operative temperature. This reduction varied according to the floor level. Monthly average operative temperature during the overheating period and for each natural ventilation strategy of the (a) ground floor zones, (b) first floor zones, (c) terrace zones.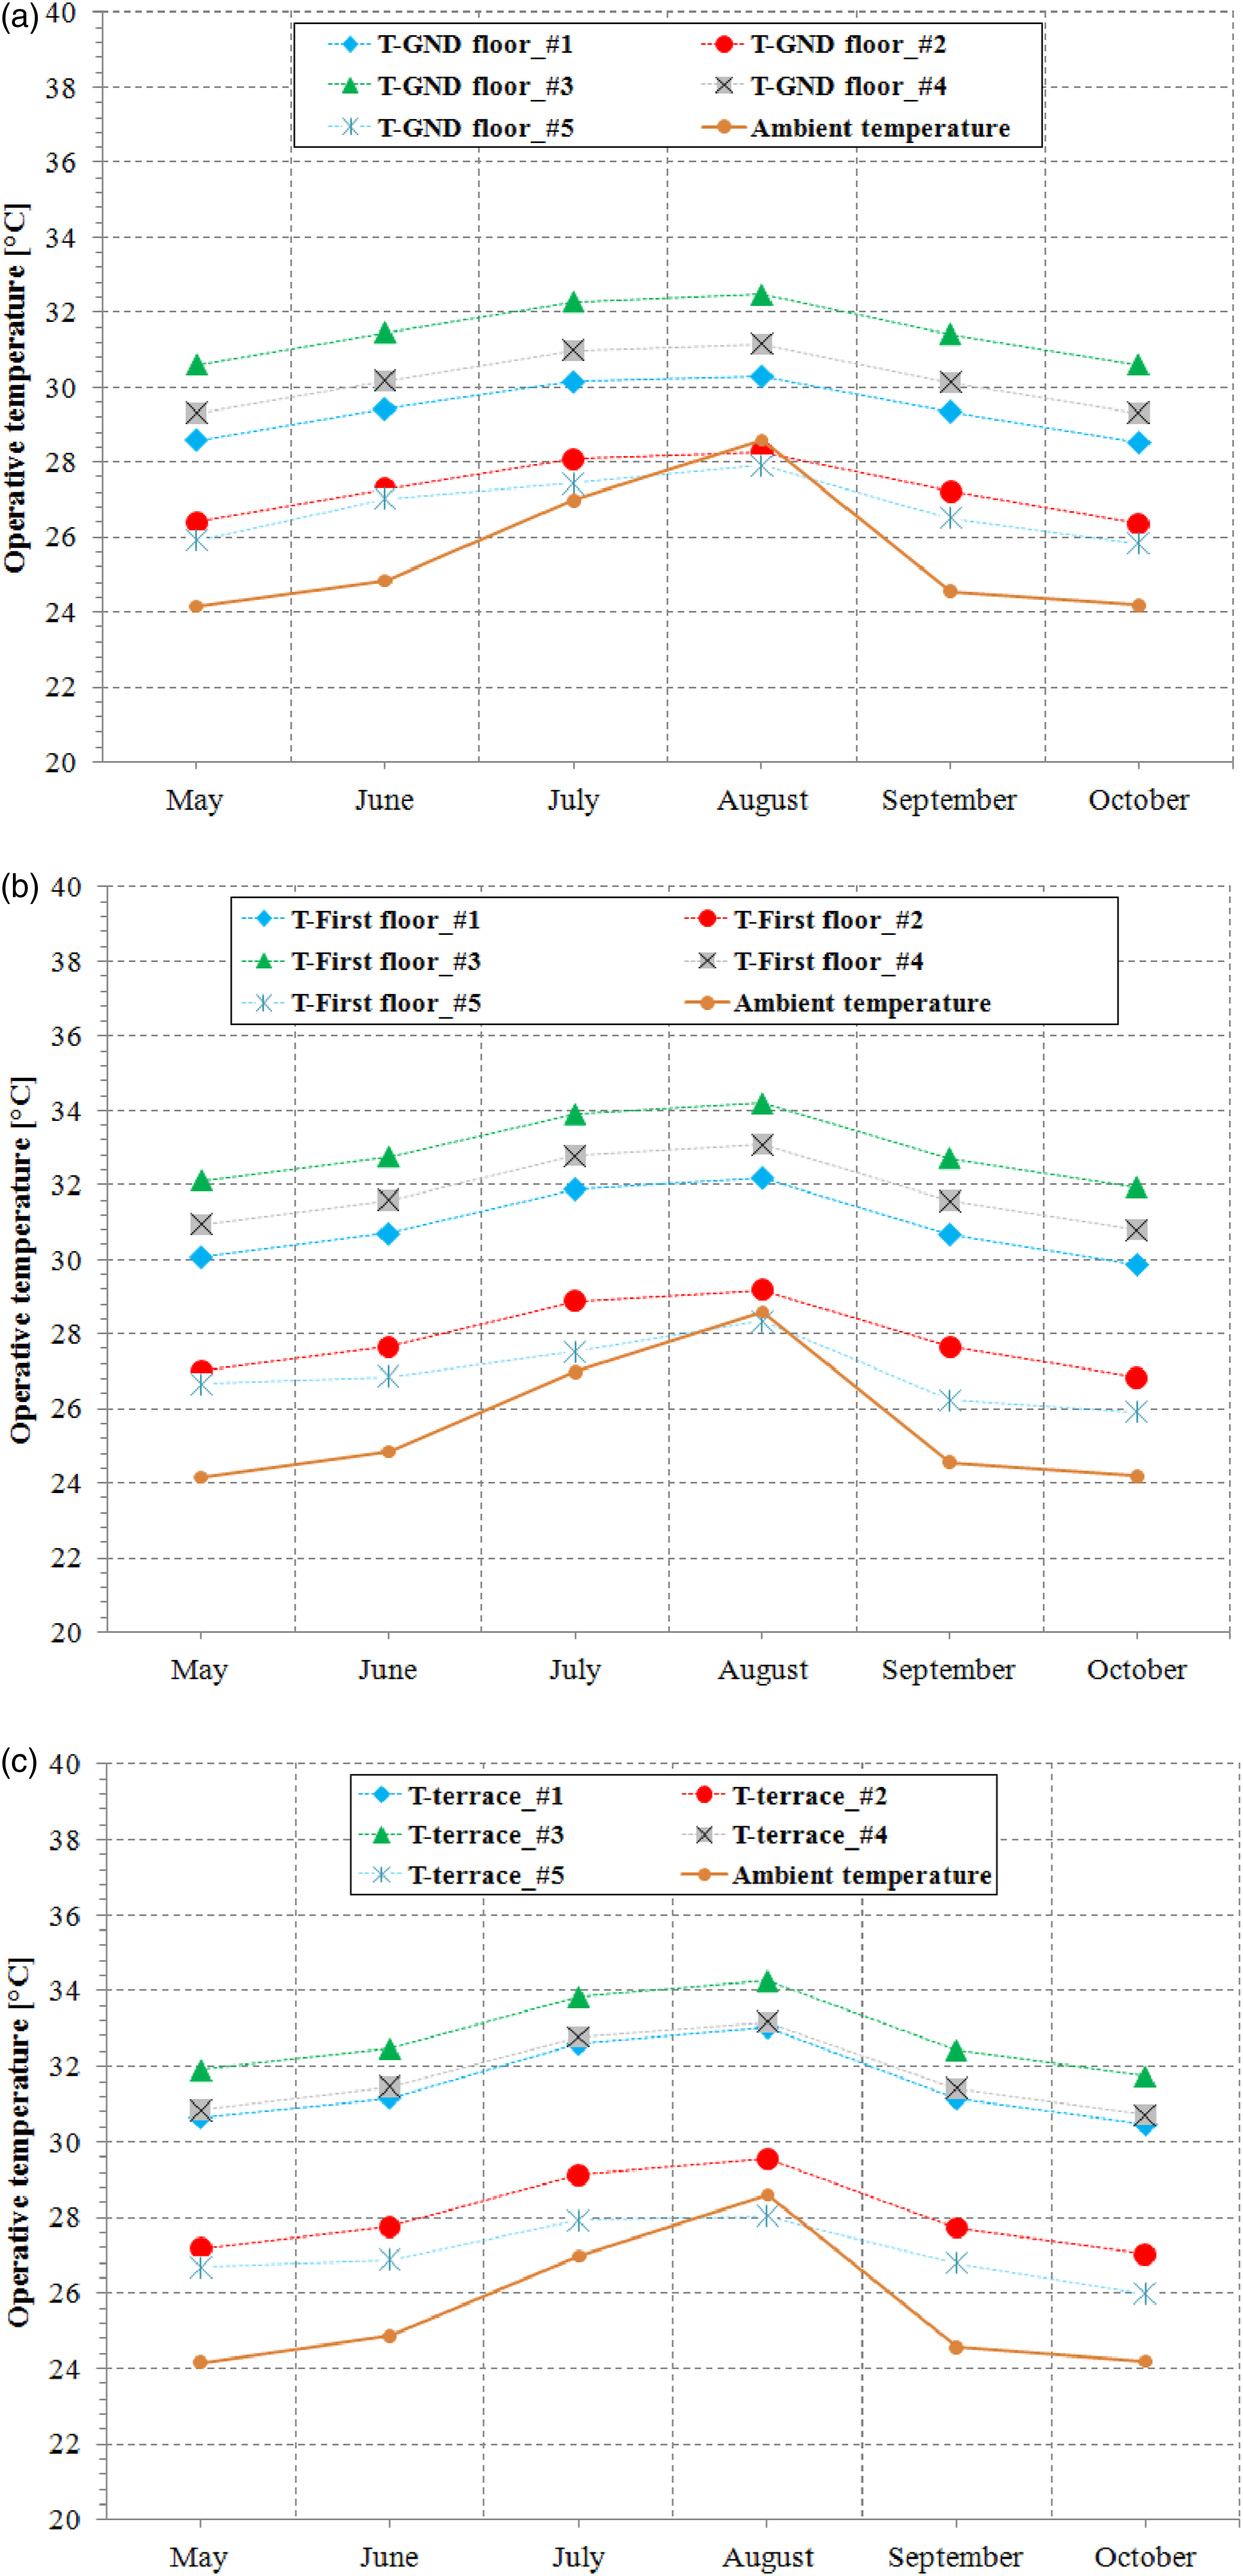
Ground floor
Figure 14(a) shows that variant #2 and variant #5 record the lowest operative temperatures. Indeed, for typical night-time ventilation scenario #2, the operative temperature was between 26.5°C and 28.2°C, which means a decrease of 2.5°C compared to the reference variant #1. For variant #5, the operative temperature was between 26°C and 27.5°C, with the largest reduction of 0.7°C compared to variant #2.
First floor
The same downtrend was confirmed on the first floor, with an operative temperature that did not exceed 29°C for variant #2 and 28.3°C for variant #5 (see Figure 14(b)). At the same time, scenario #3 (Day-time ventilation) was shown to consistently record the highest temperature reaching 34°C (+1.5°C compared to the ground floor).
Terrace
According to Figure 14(c), the highest operative temperature was recorded at the terrace. However, the best performance with a maximum temperature of 28°C was recorded in variant #5, which was lower by 5°C than reference case #1. In addition, the maximum operative temperature of variant #2 recorded on the terrace was lower than that was measured on the first floor by 0.3°C. This was due to the height of the openings as well as the terrace zone has two large windows, one facing west and the other facing east.
These results support the conclusions reached on cooling energy savings and are consistent with the results of house-based monitoring of occupants’ behaviour. Indeed, Figure 14(a)–(c) showed that the proposed natural ventilation strategy #5 is the most suitable for all house floors. Moreover, this strategy becomes more advantageous when going up from one level to another since the maximum difference between variants #2 and #5 was from 0.5°C on the ground floor to 1.5°C on the terrace. This is explained by the absence of obstacles that would reduce the wind speed in the lower parts of the building.
Furthermore, the analysis of Figure 14(a)–(c) showed that the operative temperature for variants #2 and #5 throughout the overheating period was always below 29.5°C on all floors. Indeed, this temperature remained lower than the summer comfort temperature in the Marrakesh climate calculated through the adaptive comfort model (equation (2)) proposed by ASHRAE-55-2020 Standard. 25 For the period under study, we found a maximal comfort temperature value of 30°C.
Impact of climate change on natural ventilation
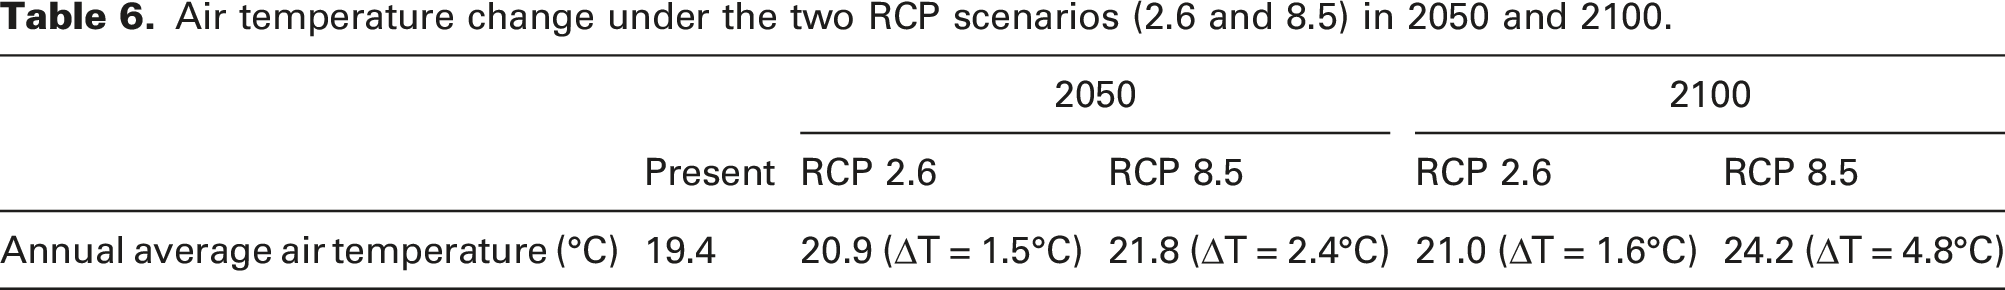
After analyzing the effect of different natural ventilation strategies on the energy performance and the thermal comfort of the Nassim house, we analyzed the impact of climate change on natural ventilation. Two emission scenarios, RCP 2.6 and RCP 8.5, were selected and used to project future weather conditions for the years 2050 and 2100. It is essential to mention that RCP 2.6 is the most optimistic climate change scenario. It gives a probability greater than 50% of limiting the temperature increase to 2°C by the horizon of 2100. In contrast, the RCP 8.5 trend scenario (the most pessimistic) has more than a 50% probability of reaching a temperature increase above 4°C.
The impact of climate change on the CPNV and CPENV indices was quantified and discussed by analyzing predictable meteorological data. It should be noted that the CPNV and CPENV values were extracted based on the typical year meteorological data compiled by Meteonorm. 22
Air temperature change under the two RCP scenarios (2.6 and 8.5) in 2050 and 2100.
In order to investigate the potential of natural ventilation, the CPNV and CPENV indices were analyzed for all scenarios. Figure 15 presents the percentages of both indices under current and future climate conditions for two-time intervals: all day (24 h) and night (8 p.m. to 8 a.m.). The second time interval presents the case of night-time ventilation during the warm season. According to the previous section, this ventilation strategy is effective for the Marrakesh climate. CPNV and CPENV under two-time intervals: 24 h in whole year and nights of the hot season (8 p.m. to 8 a.m.).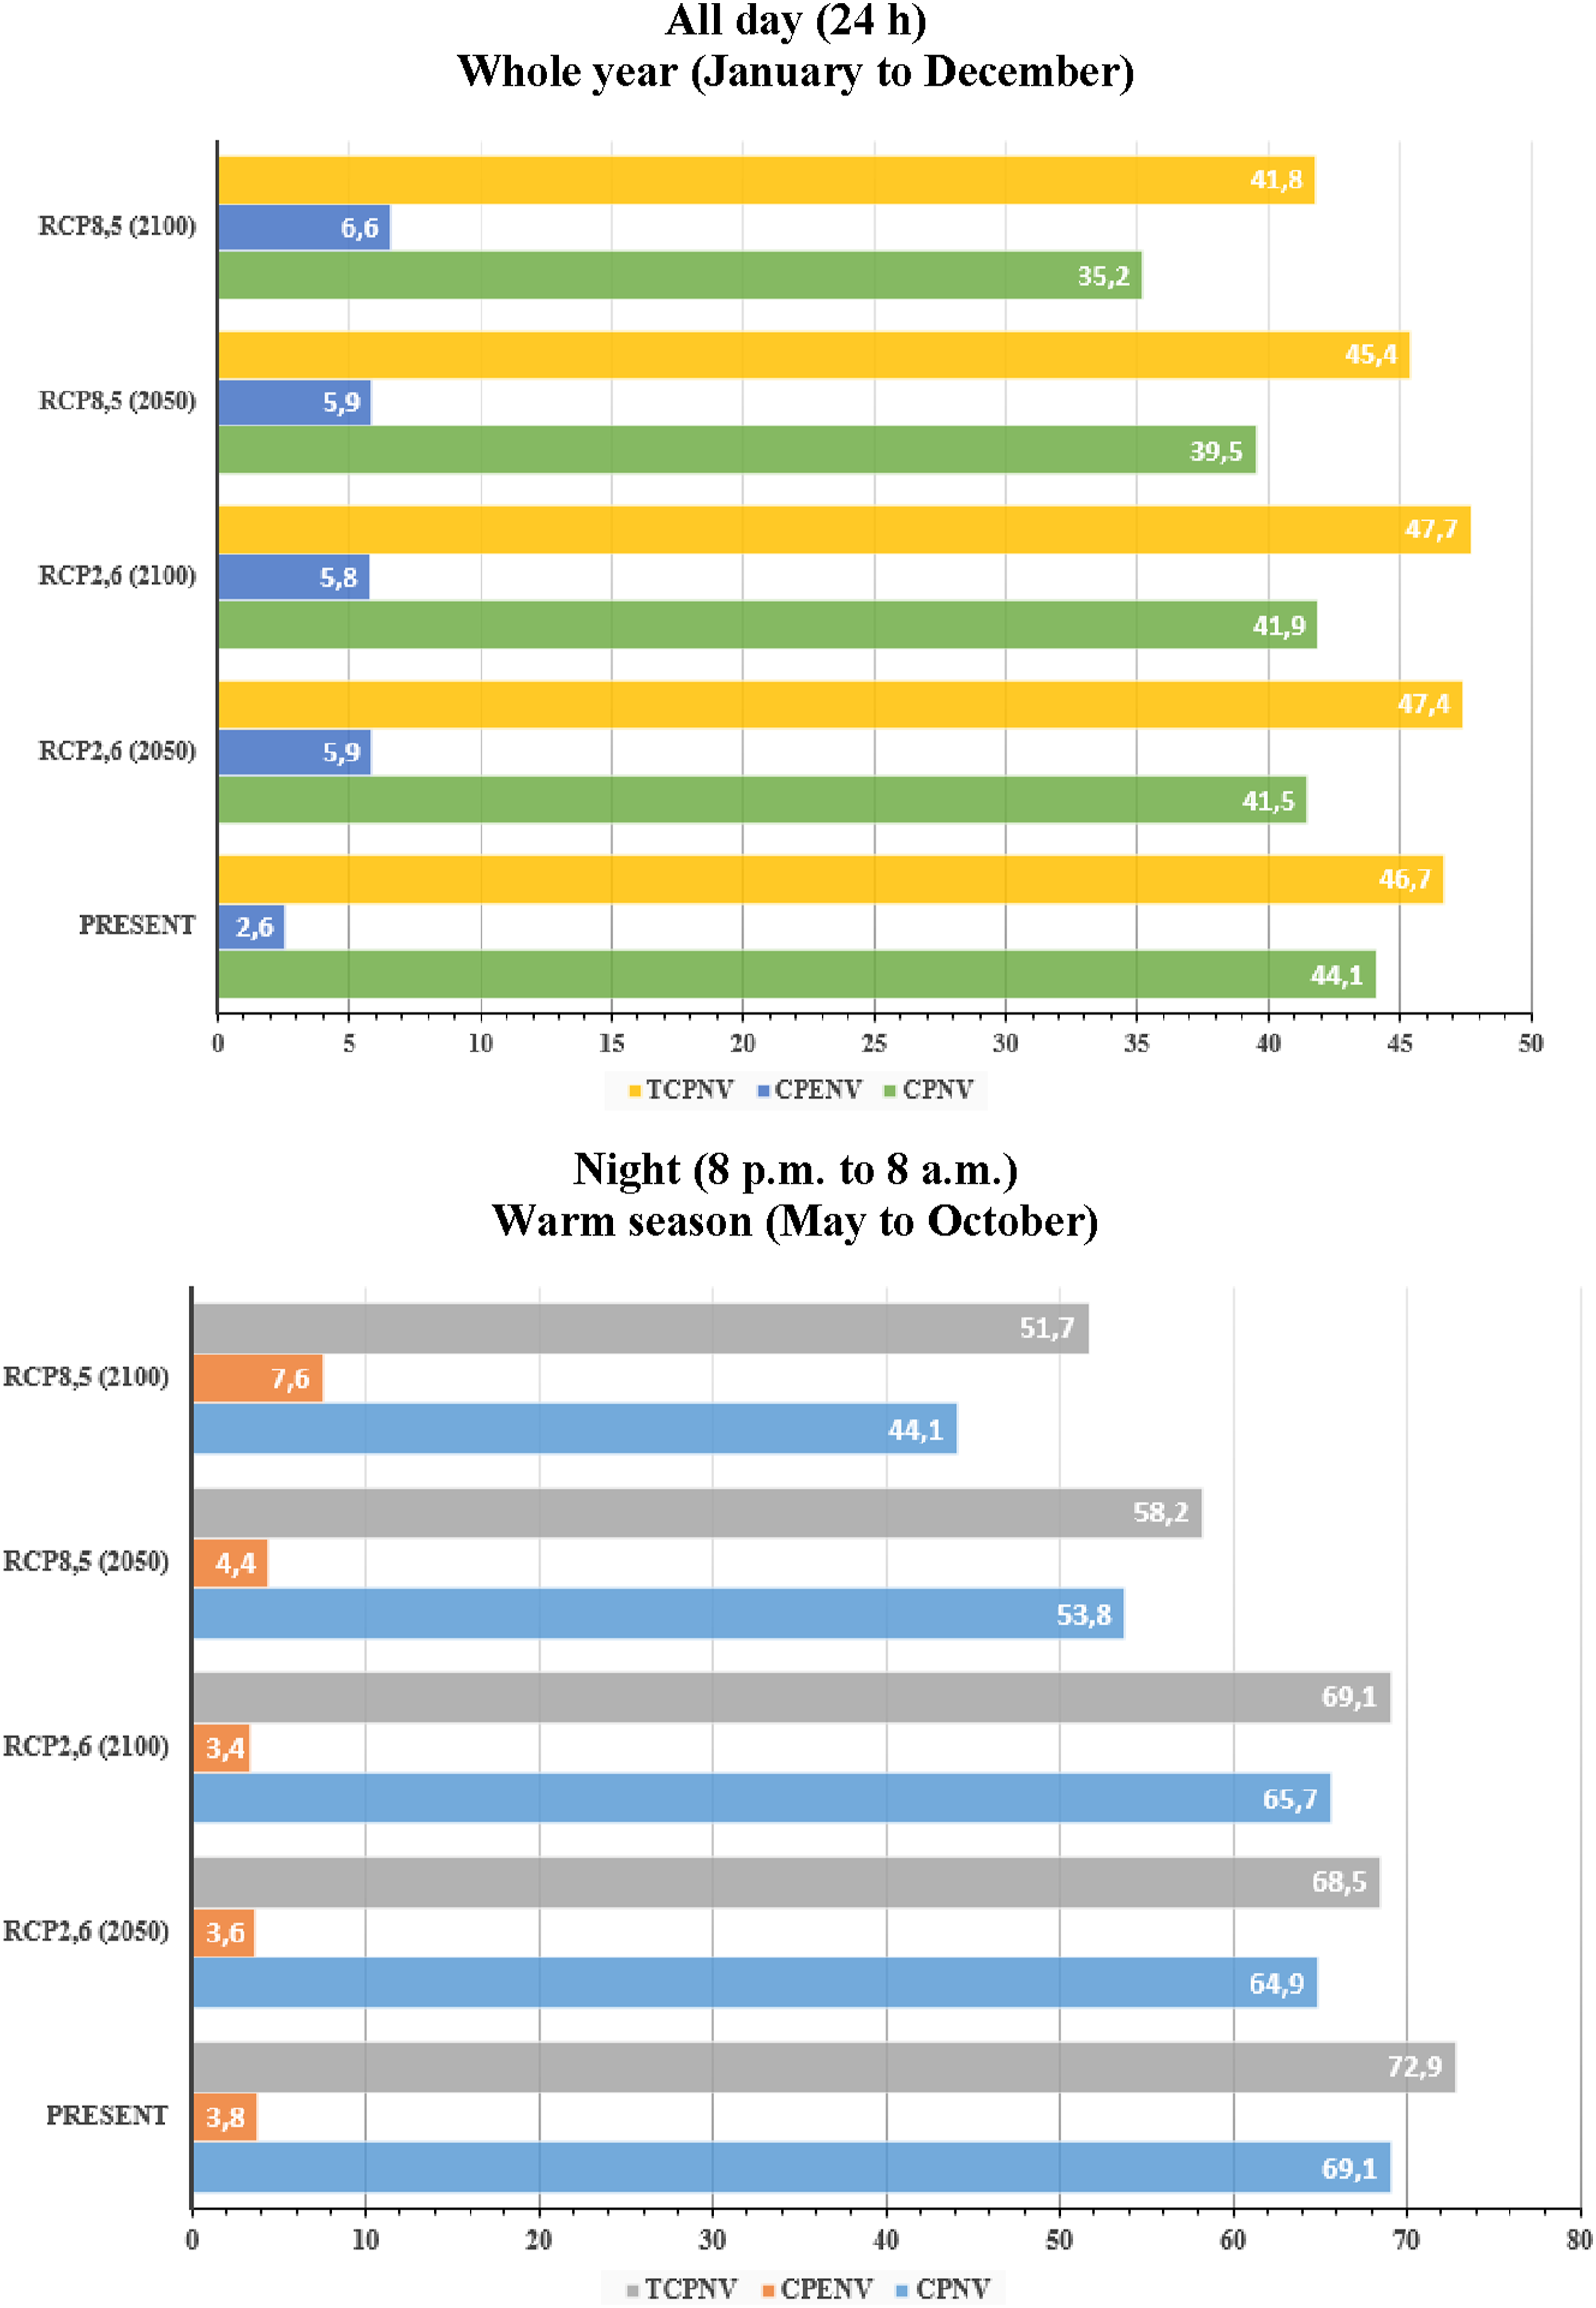
Figure 15 shows that Marrakesh city has a medium annual potential for using natural ventilation in the present climate (CPNV = 44%). However, this potential was increased considerably during the nights of the hot season. The CPNV in this period was approximately equal to 69%. The CPNV would decrease under different scenarios in the future for two-time periods, underlining the degradation of the role of this heat dissipation strategy in low-energy building design. When compared the RCP 8.5 (2100) scenario to the current climate conditions for the two studied time intervals, all day-time and during the night-time of the summer season, we noticed a decrease in the natural ventilation potential in the future of about 8.9% and 25%, respectively. Although climate change would reduce the CPNV in Marrakesh. The climate of this city has a limited potential to benefit from ENV (extended natural ventilation potential) under future climate conditions. The value of CPENV was shown to increase slightly from the current climate conditions to the RCP 8.5 scenario (2100). The value of CPENV would vary from 2.6% for the present conditions to 6.6% for the RCP 8.5 (2100) scenario. This was accentuated in the second case (nights of the summer season) since the CPENV reached a value of 7.6% in the worst climate change scenario.
Regarding the TCPNV, we noticed that climate change would reduce this index slightly compared to the current climatic conditions. Indeed, the lowest value (41.8%) was recorded for the TCPNV in the RCP 8.5 (2100) scenario. In this scenario, the TCPNV was decreased by 4.9% compared to the present climatic conditions. On the other hand, the TCPNV in the second case (nights of the summer season) was decreased abruptly in the future. Indeed, the global natural ventilation potential during the nights of the warm season will be reduced by 3.8% in 2100 using RCP 2.6 and 21.2% reduction with RCP 8.5. This decrease in the potential for heat dissipation can be compensated by a more suitable architectural design, which integrates other passive and semi-passive systems, such as geothermal energy.
CPNV and TCPNV variations under climate change for the two-time intervals: whole year (24 h) and nights of hot season (8 p.m. to 8 a.m.).
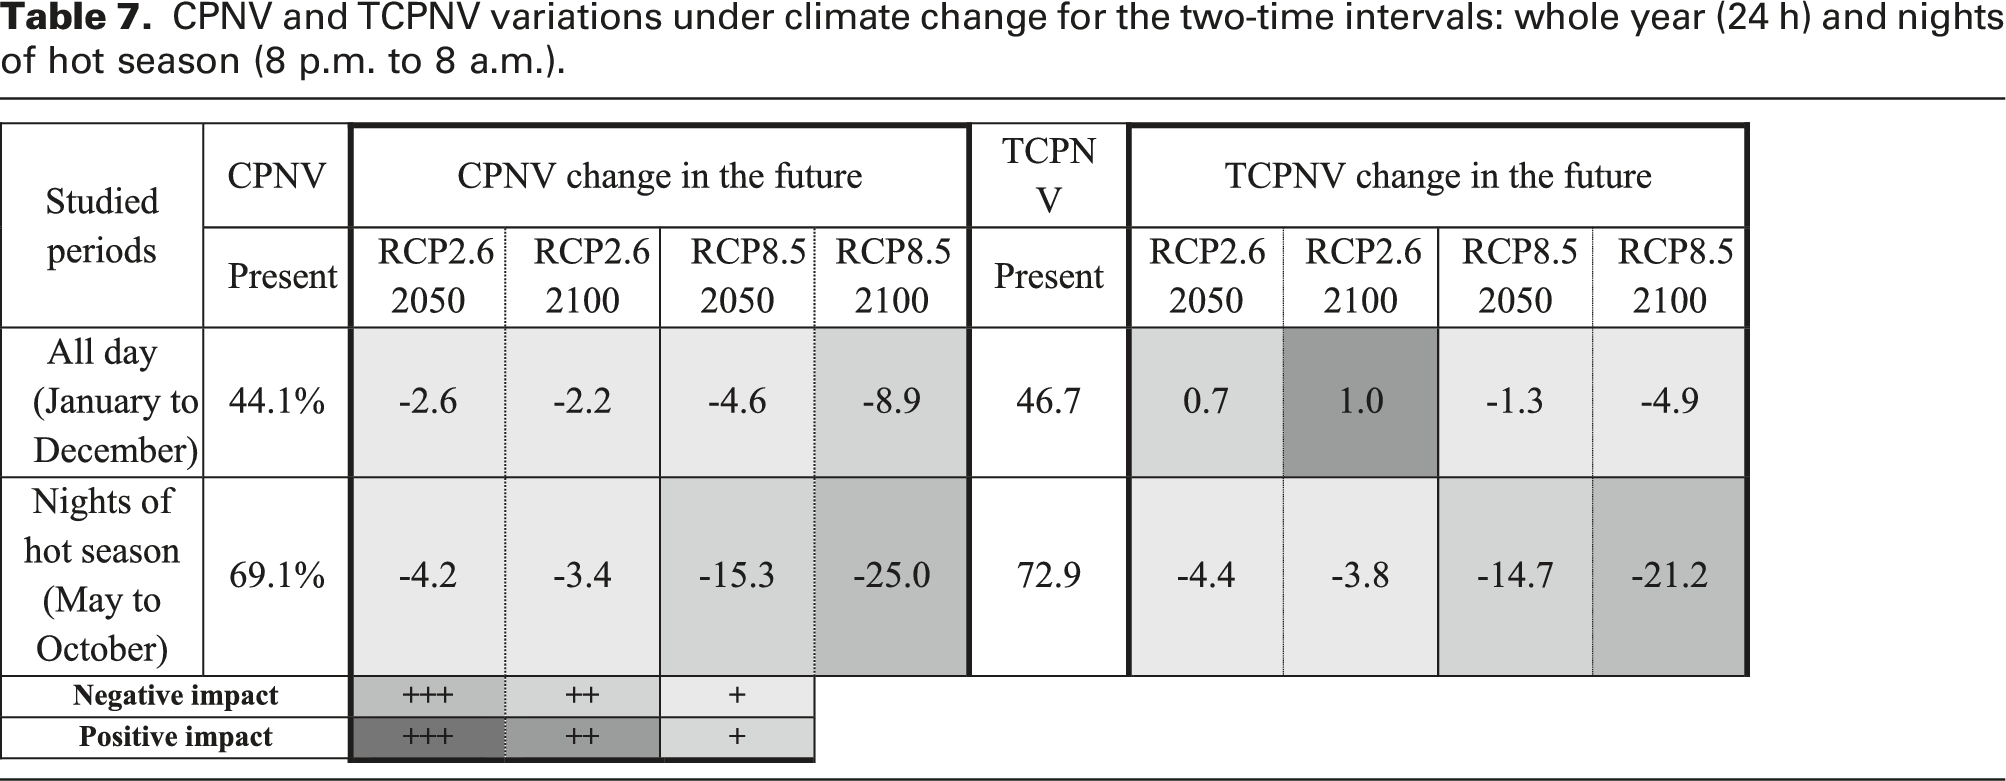
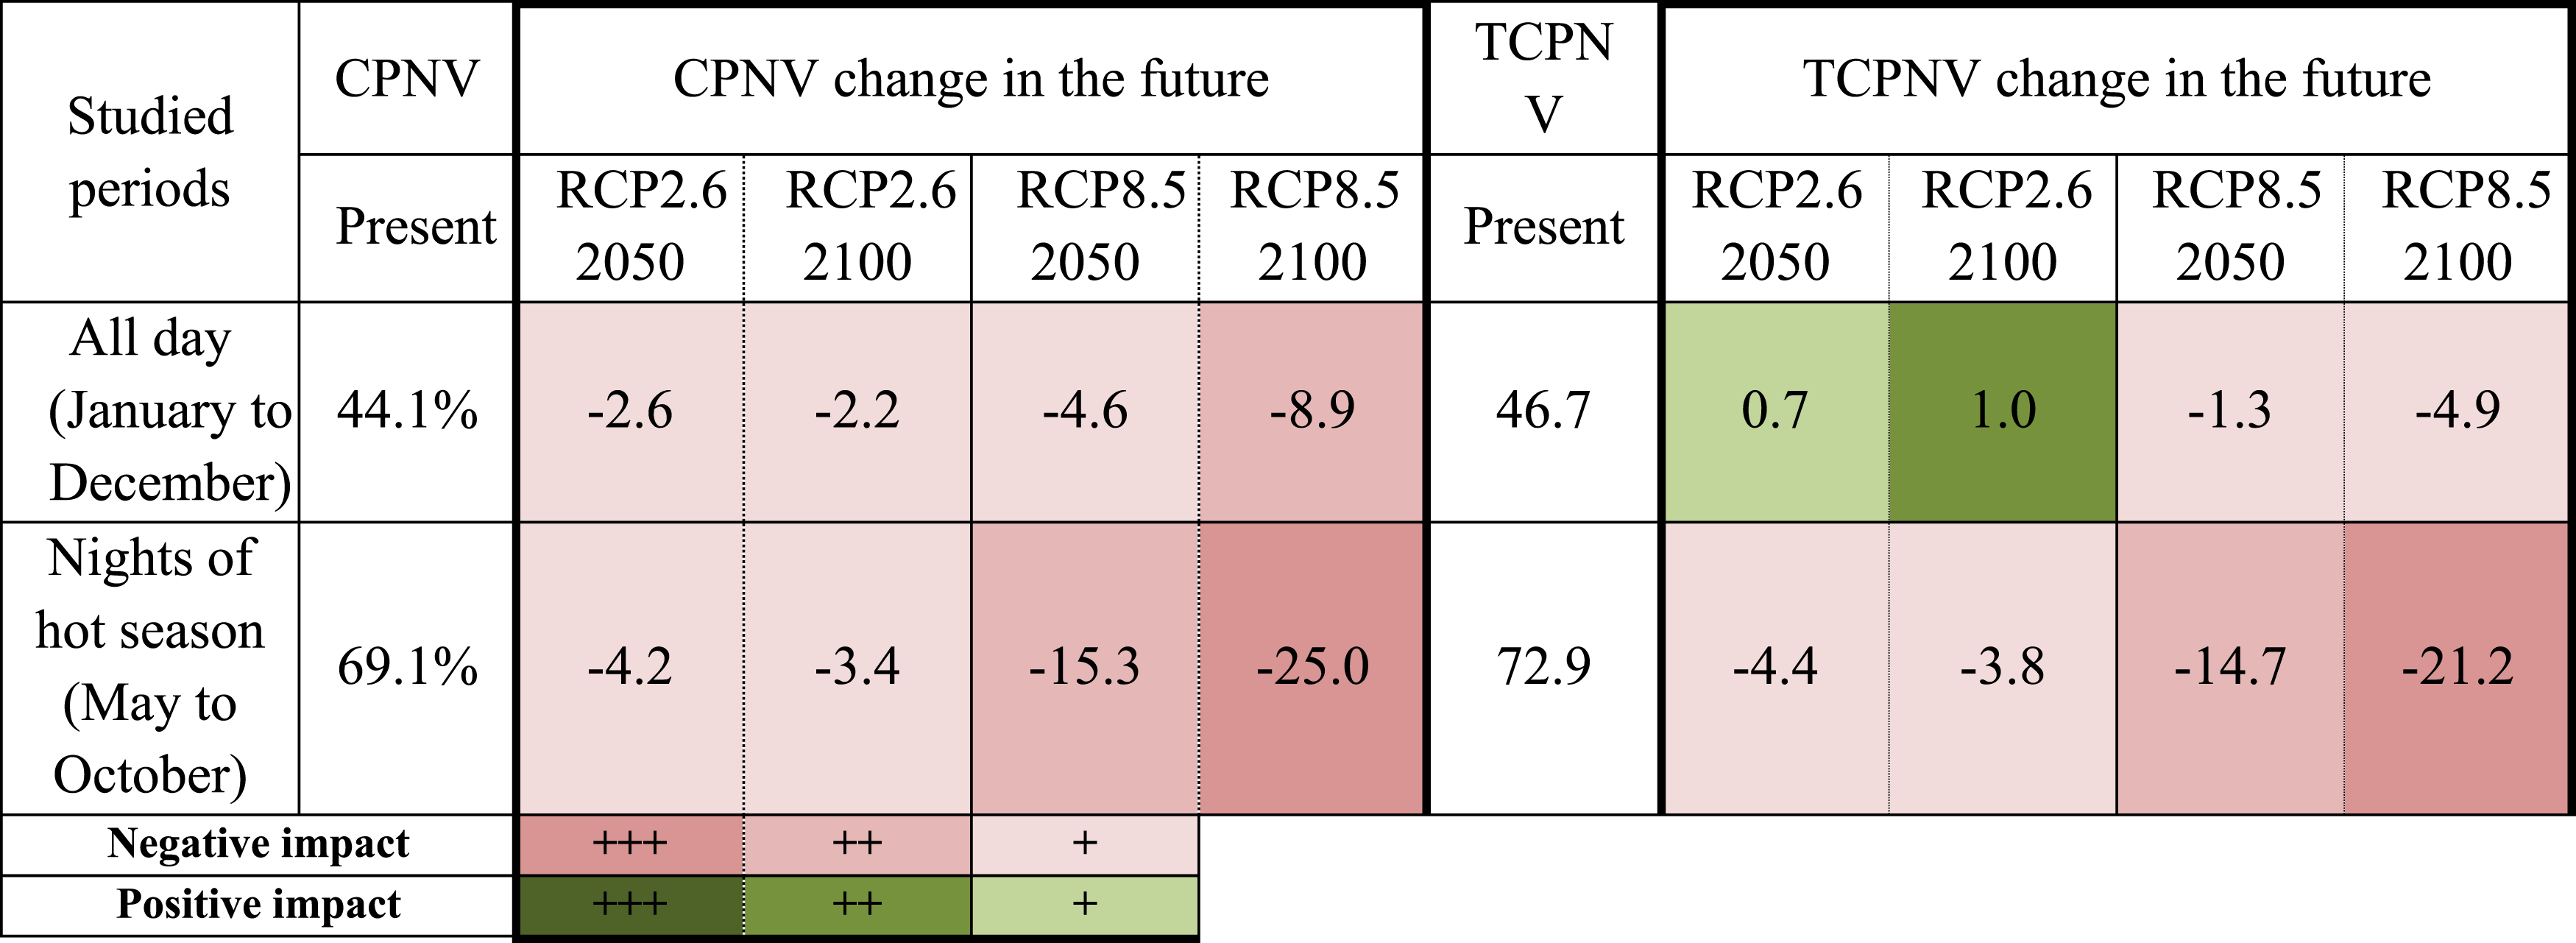
Under present climatic conditions, implementing ENV strategies can increase the natural ventilation potential in a semi-arid climate. However, this increase’s magnitude depends on the climate change scenario and the ventilation period. Table 7 shows that climate change under the RCP 2.6 scenario would increase slightly the total potential of natural ventilation (TCPNV) by about 1%. Indeed, for the first time interval (24 h/Whole year), the TCPNV varied positively except under the RCP 8.5 scenario. This opportunity was resulted from the increase in winter air temperature, which increased the number of hours in the thermal comfort range throughout the year. Therefore, there is more possibility of applying natural ventilation strategies. On the other hand, for the second time interval (nights of the hot season), the TCPNV index progressed negatively according to the degree of climate change. This is due to the increase in hot days (risk of overheating) and, therefore, the increase in the number of hours during which the air temperature exceeded the acceptable upper limit.
According to Table 7, we found that the night ventilation potential will be worsen in the future, whatever the climate change scenario. It is important to mention that most residential and tertiary buildings in Morocco are naturally ventilated at night. Therefore, the limitation of the heat dissipation system in the summer by nocturnal ventilation will certainly cause overheating, energy overconsumption and thermal discomfort. However, the natural winter ventilation potential will progress in the future. This is mainly due to the air temperature increase during December and January, which will allow the windows to be opened. Indeed, during these 2 months, the air temperature, according to present climatic data, would not exceed 15°C for 2396 h (see Table 1). By contrast, the number of hours during which the air temperature is less than or equal to 15°C, for the RCP 8.5 scenario, does not exceed 646 h.
Finally, the results found in this study are in agreement with several studies and shown the negative impact of climate change on comfort inside buildings located in other climate types (Humid subtropical climate [Köppen: Cfa], Monsoon-influenced humid continental climate [Dwa], Subarctic continental [Dfc] and Tropical monsoon climate zone [Am]).17,36,37
Future work
The determination of indices quantifying the potential of natural ventilation in the climate of Marrakesh (Köppen: BSh) was essential to understand the effect of climate change on the night ventilation strategy, which is often used in our buildings. Therefore, the generalization of this study on the other climatic zones of Morocco proves to be essential to understanding the effect of greenhouse gas emissions increase on the natural ventilation potential. Indeed, Morocco is characterized by a much-diversified climate, which can be duplicated in other countries with similar social and economic contexts. The climates that will be analyzed are the following:
Csa (Hot-summer Mediterranean);
Csb (Warm-summer Mediterranean);
Dsc (Dry-summer subarctic);
BWh (Hot desert).
Additionally, quantifying the natural ventilation potential in different climates under current and future climate conditions is important for developing a set of guidelines for defining climates where natural ventilation is most appropriate and for designing sustainable natural ventilation strategies. In the present research, two schedules were considered to assess the natural ventilation potential; however, the start and end time of natural ventilation in buildings may vary depending on occupancy schedules, the type of building (residential or tertiary) and the ventilation strategy. In addition, the highest and lowest greenhouse gas emission scenarios were considered to assess the impact of climate change on the proposed indices. Further studies are suggested to investigate the impact of other climate change scenarios on natural ventilation and for different climates.
Finally, it seems interesting to work on developing the controlled ventilation strategy #5 proposed in the previous section. This strategy is interesting for dealing with overheating due to climate change. Therefore, an application and an experimental follow-up on site are necessary to evaluate in detail the performance of this ventilation strategy, and we should also consider the combination of the proposed system with other systems like the earth-to-air heat exchanger (EAHX).
Conclusion
This study emphasizes the correlation between natural ventilation and improving thermal comfort. To reach the said goal, we preceded the analysis of the cooling energy saving and the thermal comfort for a non-mechanically ventilated residential building in a hot and dry climate by modelling the occupants’ behaviour and the different natural ventilation strategies. Three typical natural ventilation strategies (night-time, day-time and full-day ventilation) and a proposed controlled ventilation scenario were compared. The simulation results have shown the beneficial effect of night ventilation on energy saving and summer thermal comfort since it reduces the cooling load by about 9% and it keeps the operative temperature below 30°C. In fact, the proposed scenario, which is based on smart window openings according to the external climatic conditions, has also shown its performance. This strategy decreased the cooling load by approximately 19.3% compared to the reference variant (without ventilation) and 11.2% compared to the night ventilation, but it requires electricity to operate and has some technical installation limitations. For this purpose, this strategy can be applied in new buildings, while the night ventilation strategy is recommended in existing buildings. On the other hand, when the day-time ventilation strategy was applied, the operative temperature was increased significantly during the night since the windows remained closed. This was associated with the heat absorbed during the day by the thermal mass of the building envelope. In addition, since no ventilation would occur at night, the building envelope would retain this heat during the night.
After determining the most suitable ventilation strategy for the condition of the studied house, we analyzed the future natural ventilation potential. This is through calculating the CPNV, CPENV and TCPNV indices under two-time schedules: when natural ventilation is desired only on nights of the summer (8 p.m. to 8 a.m.) and for all the time (24 h/Whole year). Two emission scenarios, Representative Concentration Pathways, RCP 2.6 and RCP 8.5, were selected and used to project future weather conditions for two periods, 2050 and 2100. The simulation results showed that Marrakesh city has a relatively low annual ventilation potential in the present climate (CPNV = 44%). Nevertheless, this potential increases considerably during the summer nights, when the CPNV reaches 69%. In the future, the reduction in CPNV for the different scenarios and the two-time periods shows the degradation of the natural ventilation strategy as a heat dissipation system in the buildings. Indeed, when comparing the most pessimistic scenario RCP 8.5 (2100) to the present climatic conditions for the two-time studied intervals (all day and night of the hot season), we see a decrease in the total natural ventilation potential (TCPNV) in the future by 4.9% and 21.2%, respectively. This low decrease in the potential of natural ventilation throughout the year (all-day period) is due to the rise in air temperature during the winter, which increases the possibility of opening windows to take advantage of natural ventilation.
Finally, the analysis of the thermal and energy performances of this retrofitted building has demonstrated its ability to effectively address climate changes and fulfil its purpose of providing a comfortable environment for its occupants. Nevertheless, it is crucial to consider additional cooling wells, explore alternative passive techniques and enhance the performance of construction materials in order to ensure the resilience of buildings to climate change. This is particularly important as occupants' expectations regarding thermal comfort have become increasingly demanding.
Footnotes
Authors’ contribution
All authors contributed equally in the preparation of this manuscript.
Declaration of conflicting interests
The author(s) declared no potential conflicts of interest with respect to the research, authorship, and/or publication of this article.
Funding
The author(s) disclosed receipt of the following financial support for the research, authorship, and/or publication of this article: This research has received funding from RafriBat project financially supported by the PARS grant from the Hassan II Academy of Sciences and Techniques, Morocco.