
Abstract
People spend about 90% of their time indoors and indoor volatile organic compounds (VOCs) are critical to human health. Liquid crystal displays (LCDs) widely used in offices are a new source of indoor VOCs, with an emission rate of 8.25 × 10⁹ molecules s−1 cm−2 reported by Liu and Abbatt (2021). Therefore, this work studied the exposure to LCD VOCs in a four-person office environment through numerical simulation. Air change rate per hour (ACH), geometric setting and partition were also investigated. The results revealed that at an ACH of 4, human users inhaled 0.07%–0.25% of the released VOCs. The deviations for different users were 4–9 times due to various locations. Different geometric settings resulted in 2–3 times exposure deviations. Increasing the ACH to 20 led to an 88% reduction. The estimated lifetime exposure via inhalation was 8.2 × 10¹⁸ VOC molecules or 1 mg per LCD. This study contributed to the understanding of exposure to VOCs from LCDs.
Introduction
People spend 90% of their time indoors, and indoor air quality is of great importance for human health because of exposure to indoor air contaminants.1–3 Volatile organic compounds (VOCs) are one of the major indoor contaminants and have attracted extensive research interest due to their adverse health effects.4–8 Long-time exposure to VOCs can cause discomfort, inflammation of respiratory tract, heart disease and even cancer.9–11 Therefore, studying human exposure to indoor VOCs is crucial to evaluate health effects and develop control measures to improve indoor air quality.
Indoor substances and human activities are major sources of indoor VOCs.12,13 Many studies have characterized different types of indoor VOC sources, such as building materials,
14
decorations,
15
personal care products,
16
fragrance products
17
and human activities (cleaning, cooking and display).18,19 Apart from these traditional sources, electronic products may also release chemicals and become a source of indoor VOCs. Recently, Liu and Abbatt
20
pinpointed that liquid crystal displays (LCDs) are an important source of indoor VOCs and described the emission strength of VOCs from LCDs. They found that the emission strength was as high as 8.25 × 10⁹ molecules/(s
A handful of studies have been conducted on the dispersion and exposure of VOCs in industry or outdoor environments. Chang et al. 23 and Chang et al. 24 studied the exposure of thin film transistor LCD workers to VOCs in the workplace and evaluated the health effects, including hypertension and kidney dysfunction. VOC samples were collected using canisters and analyzed by gas chromatography – mass spectrometry. Results showed that LCD workers exposed to high levels of VOCs were associated with elevated blood pressure. Wang et al. 25 evaluated the long-term exposure of workers in the thin film transistor LCD industry to multiple chemicals. During different work shifts, the concentrations of surrogates of ethanol, acetone and propylene glycol monomethyl ether acetate were as high as 2480 ppb, 624 ppb and 2241 ppb, respectively. Fu et al. 26 numerically studied the NOx-O3 photochemical cycle and the air pollutants reactive dispersion around an isolated building from point sources of roof and ground. The distribution of air pollutant indicated a self-similar and stratified pattern, contributing to the natural deposition.
Regarding the indoor VOCs, Yang et al. 27 studied the removal effect of different ventilation types on VOCs released from a surface source. They found that the VOC concentrations generated by a grille diffuser were lower than those of displacement and square diffusers. Deng and Kim 28 carried out numerical simulations to study the concentrations of VOCs released from a new carpet in a residential building, and pointed out the importance of ventilation in removing VOCs. Zhang et al. 29 simulated total volatile organic compounds (TVOC) pollutants from a new floor at different supply rates of fresh air under re-circulated ventilation and found uneven distribution in various zones. Tong and Liu 30 simulated the distribution of VOCs released from cabin decorations under solar radiation and found that solar radiation affected temperature distribution and VOC distribution. Zhao et al. 31 studied the TVOC concentration and dilution in an enclosed train compartment by numerical methods and discovered that airflow was vital to the pollution level and TVOC distribution and that TVOC distribution was non-uniform. These studies mainly focused on traditional VOC sources in indoor environments, including floors, carpets and decorations. They also indicated that the distribution of VOCs in indoor environments was reliably captured by numerical simulations of computational fluid dynamics (CFD). However, as a new source in indoor environments, the exposure of VOCs emitted from LCDs are still lacking.
Human exposure to VOCs depends on the emission strength and airflow pattern in indoor environments. The latter determines the distribution of VOC molecules and the removal efficiency of ventilation. Many indoor parameters affect the airflow pattern and the exposure of VOC molecules. For example, human users have different preferences for the geometric setup of their offices, including the orientation and direction of their desks. As a result, the relative positions of the users to the ventilation diffusers could vary, which could affect the exposure of VOC molecules. Partition is a common part of desks and affects the airflow patterns,32–34 thereby affecting the exposure of VOCs. In addition, air change rate per hour (ACH) is important in characterizing ventilation rate, and ASHRAE standard 62.1-2022 specifies that the ACH for offices should be between 2 and 4. 35 Many studies suggest increasing ACH to reduce airborne particle concentrations and indoor contaminants.36,37 The ACHs for different building environments are much higher, especially after the COVID-19 pandemic. The impact of these indoor parameters on indoor VOC exposure has not yet been resolved, which can help in designing appropriate interventions.
In this study, we evaluated the inhalation exposure of human users to VOCs released from LCDs in an office. This study aimed to investigate the inhaled fraction of VOCs to the emission from the LCDs, i.e. intake fraction. Then, the impacts of the work-station setups, physical desk-based partitions, occupants at different positions of the office, and ACH on the exposure were systematically investigated. Finally, the lifetime exposure to VOCs via inhalation was evaluated based on the intake fraction, emission strength and exposure duration.
Methodology
Geometric setting of an office
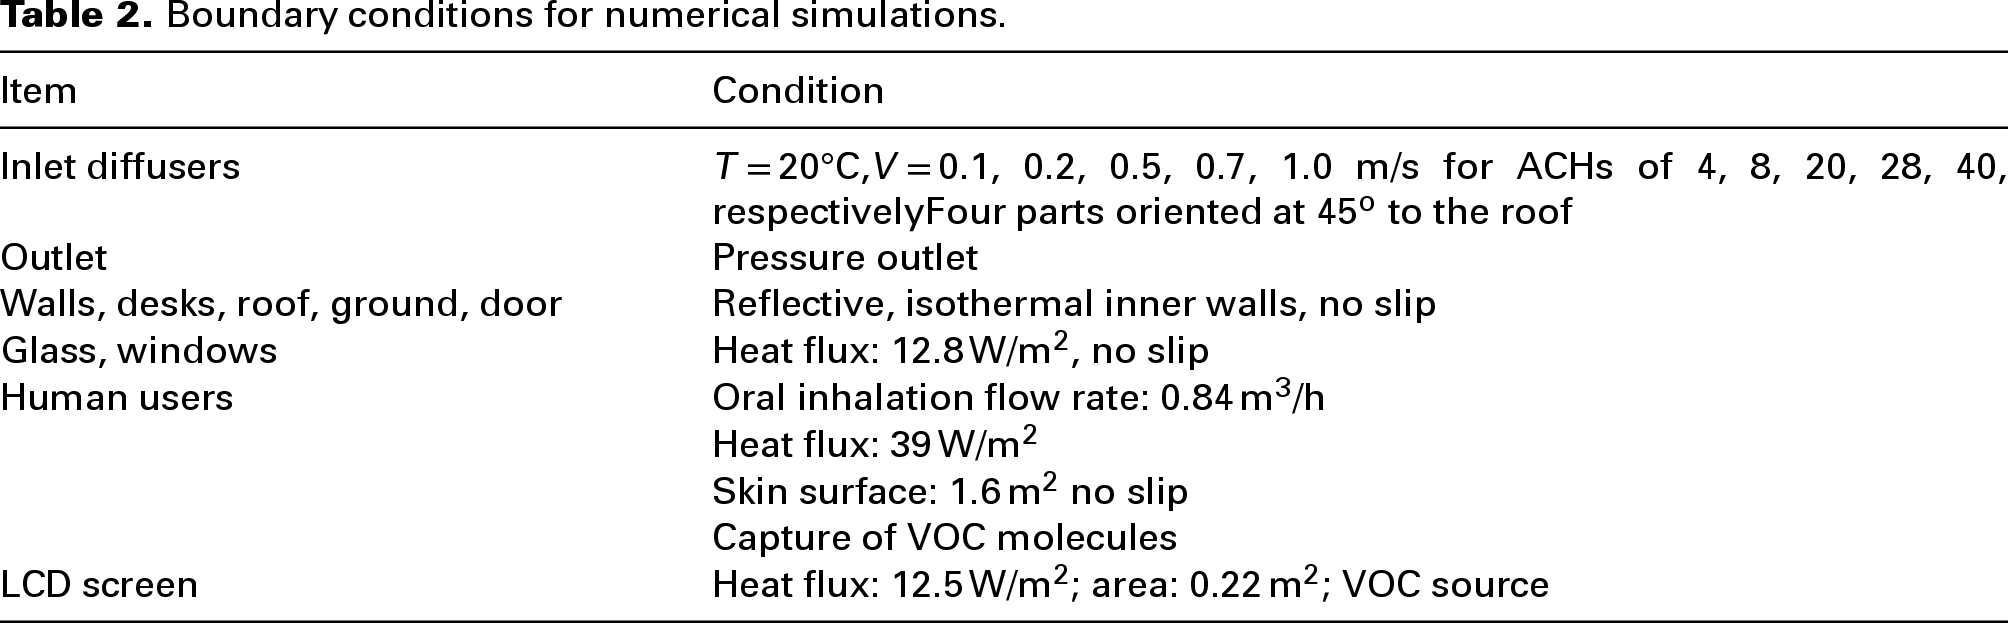
A four-person office on campus was examined to study the inhalation exposure of occupants to VOC molecules from LCDs in indoor environments. The length, width and height of the office were 3.8 × 4.2 × 2.8 m, as shown in Figure 1. The office included a load-bearing column, a cabinet, four tables, monitors and human users. It also had two inlet diffusers and two outlets. The inlet diffuser had four separate inlets that supplied fresh conditioned air at an angle of 45° to the roof. The length and width of the inlet diffuser and outlet were both 0.94 × 0.44 m, as shown in Figure 1(b). The length, width and height of the desk were 1.25 × 0.7 × 0.7 m. The height of the partition was 0.78 m, and the thickness was 0.03 m. Actual airflow velocity from the typical air conditioning diffuser was measured in an office on the university campus. The air conditioner controller had three positions and could adjust the airflow to a maximum velocity of 1 m/s with a temperature of 20°C (Air Velocity Meters VELOCICALC TSI 9535). Therefore, in this study, the different inlet velocities of 0.1, 0.2, 0.5, 0.7 and 1.0 m/s were investigated, which corresponded to the air change rate per hour (ACH) of 4, 8, 20, 28 and 40, respectively. Typically, ASHRAE standard 62.1-2022 specifies an ACH of 2–4 for offices. 35 In many buildings, ACH can be adjusted to have a higher value. This study investigated the exposure of occupants to VOCs in an office with a much higher ACH of up to 40.
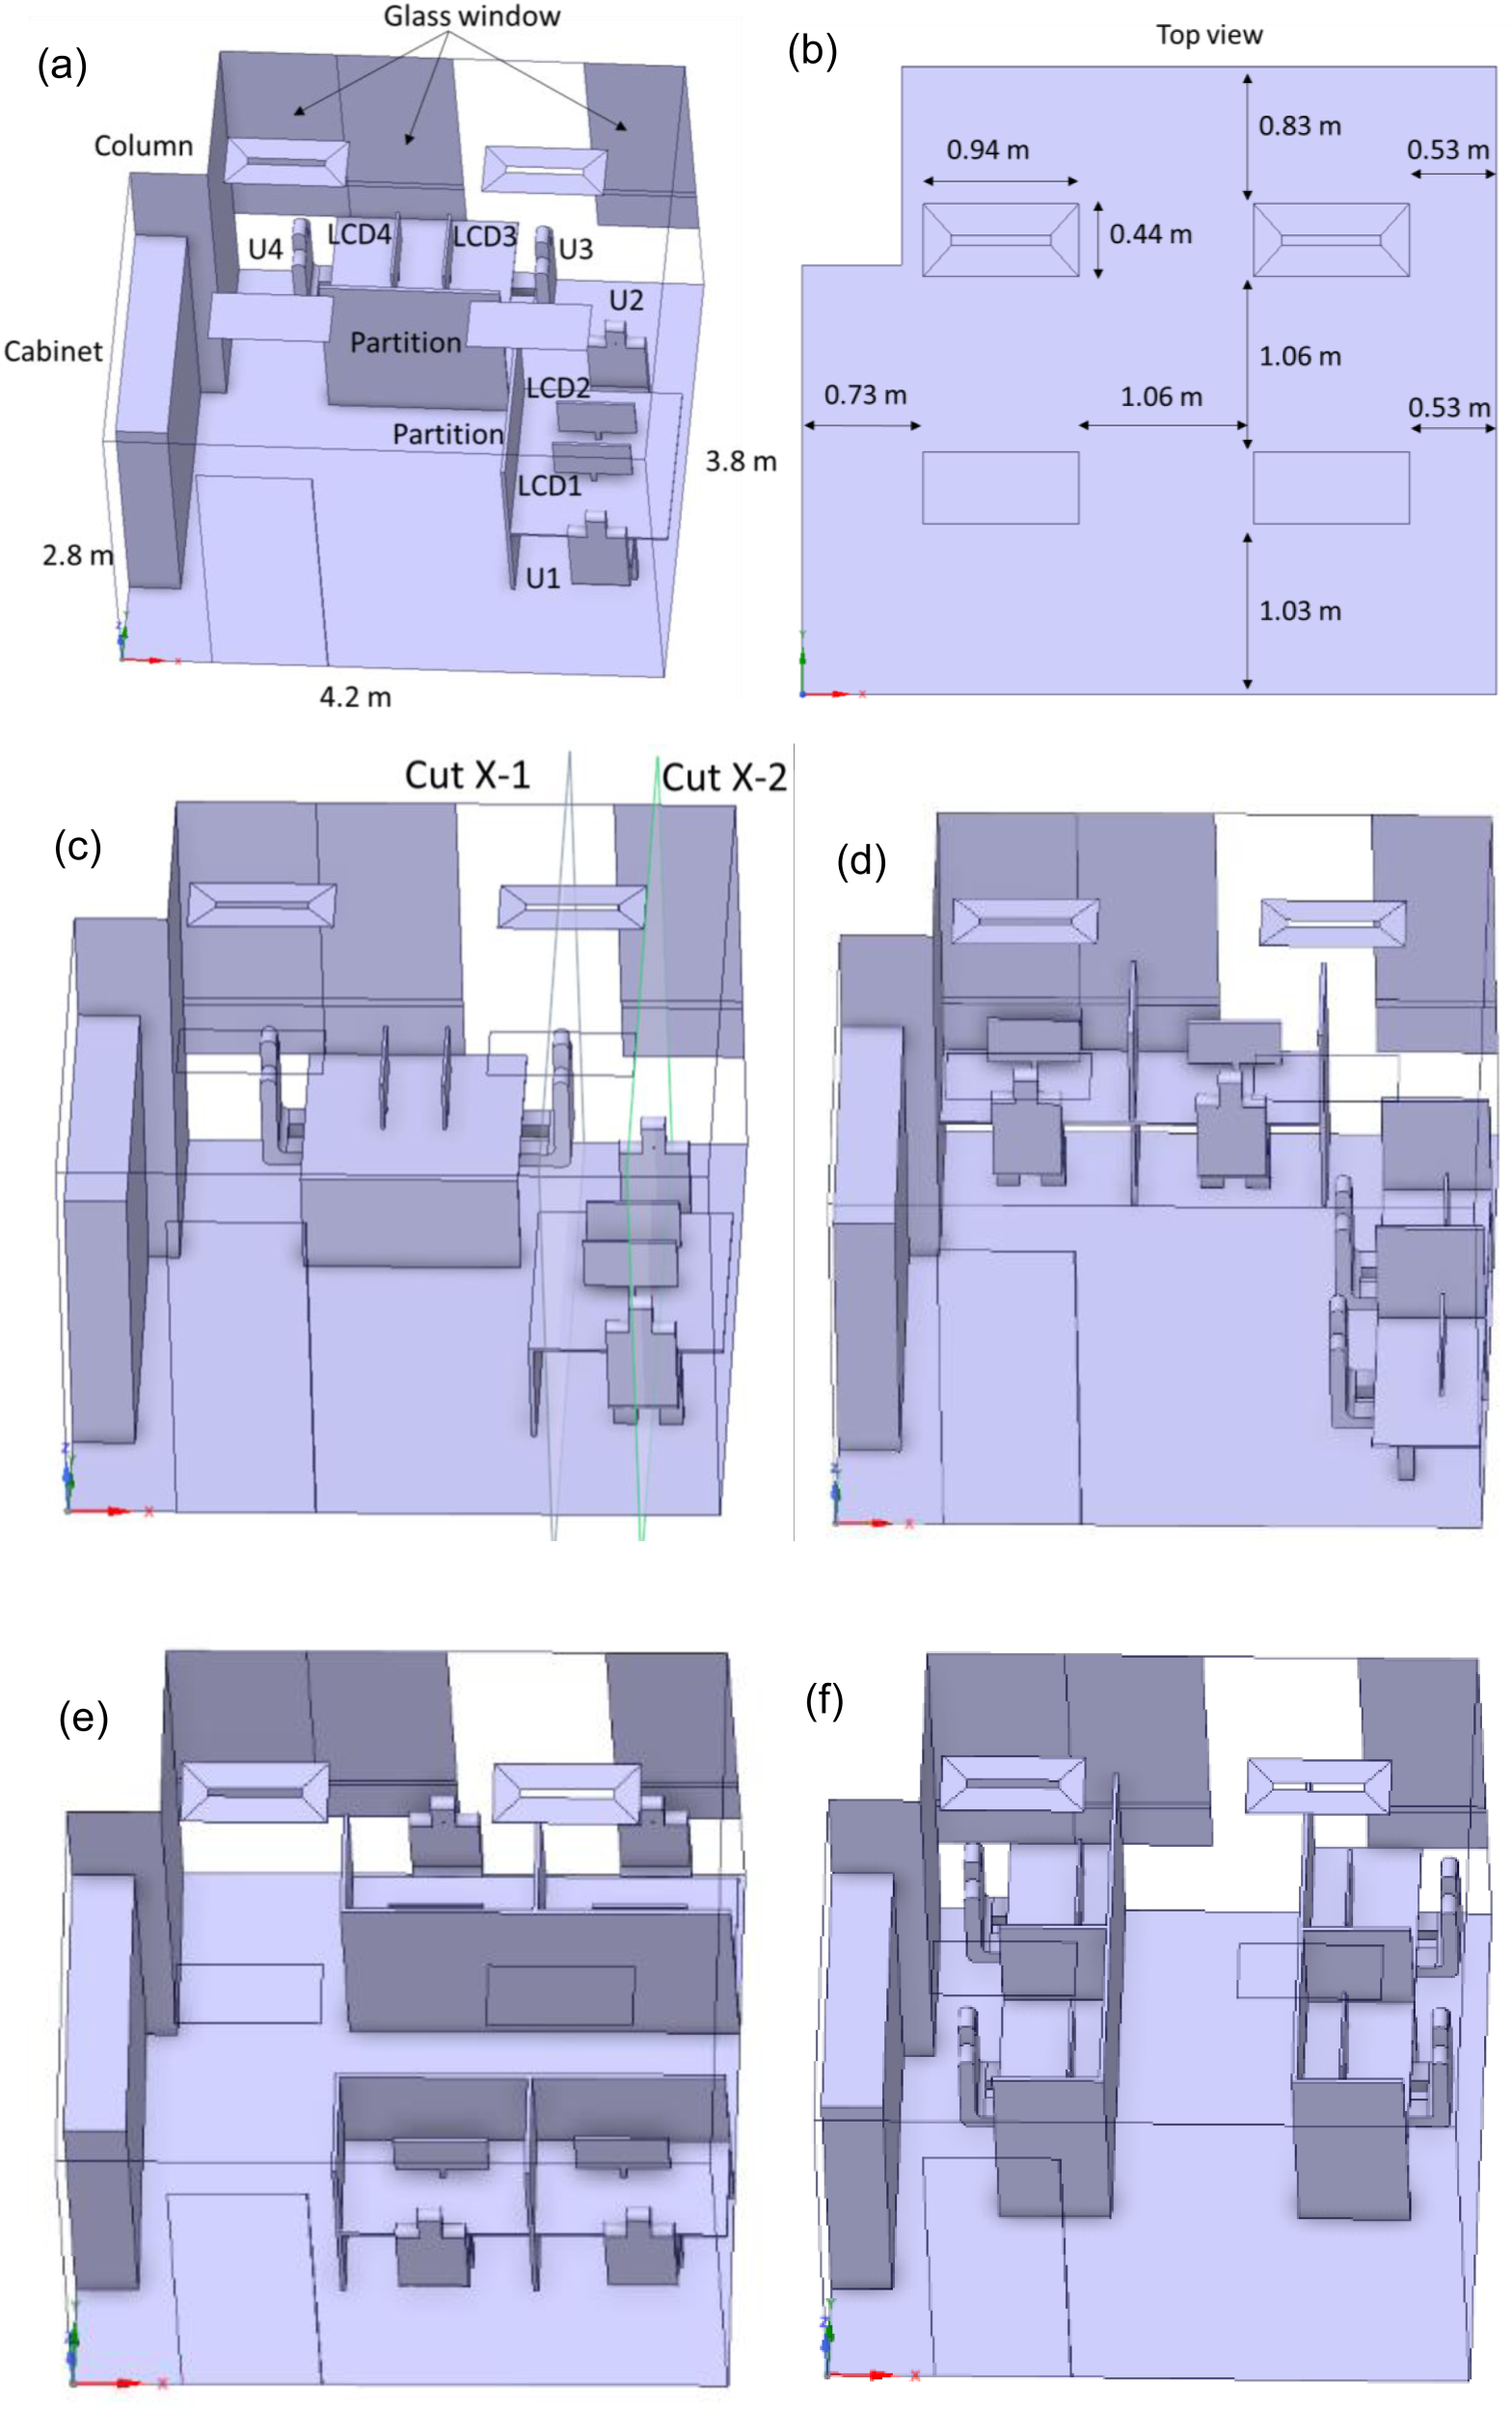
Geometric settings of the office in this study. (a) Setting 1 with partition, (b) Setting 1 with top view, (c) Setting 1 without partition, (d) Setting 2 with partition, (e) Setting 3 with partition, (f) Setting 4 with partition. The cuts X-1 and X-2 were used to show the airflow fields.
The skin area of human occupants in this study was 1.6 m2, in the range of 1.6–2.0 m2 for adults, as indicated by a study. 38 For moderate office work, the heat flux was set as 39 W/m2 and the heat dissipation as 62.4 W, in the range given by the ASHRAE standard 62.1-2022 for heating, ventilating and air-conditioning (HVAC) applications. 35 The mouth of a human occupant was set to be a circle with a diameter of 1.4 cm, matching the area of 0.7–1.7 cm2 of the human mouth. 39 The suction flow rate was set to 0.84 m3/h, the mean airflow rate of inhaled air. 39 The moderate heat transfer through glass windows was set to be 12.8 W/m2, as suggested by a previous study. 40 The glass window was set to be closed in the simulation.
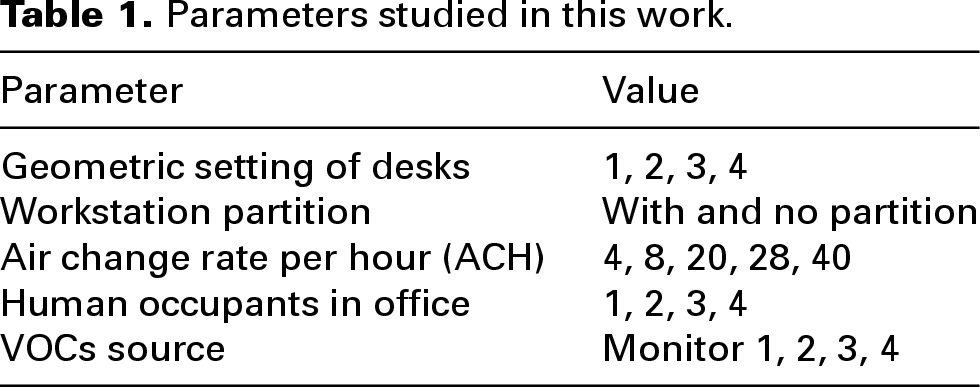
Depending on the preferences of human users, offices may have different settings. Therefore, in this study, four different office geometric settings were created for the investigation. For setting 1, desks were set up facing each other along the glass and side walls (Figure 1(a) and 1(c)). For setting 2, desks were placed side by side along the glass and side walls (Figure 1(d)). For setting 3, desks were placed side by side along the glass and back wall (Figure 1(e)). For setting 4, desks were set side by side along the two side walls (Figure 1(f)). In total, five ACHs, four geometric settings, and two partition settings were studied for 40 cases. Detailed research cases and boundary conditions are shown in Tables 1 and 2.
Parameters studied in this work.
Boundary conditions for numerical simulations.
Numerical modelling, meshing and validation
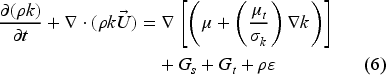
Ansys Fluent was employed to simulate VOC dispersion and exposure of occupants in the office.27,31 The airflow field in the office was obtained using Eulerian and Lagrangian methods. The RNG k-
The random walk model was employed to consider the effect of turbulence on particle transport.
41
To consider the airflow caused by the heated bodies, the air density was set using the Boussinesq setting, which integrated the density change caused by the temperature difference and was applicable for the small indoor temperature difference.40,49 The thermal expansion coefficient was set to 0.003344 K−1, which is the reciprocal of indoor operating temperature.
49
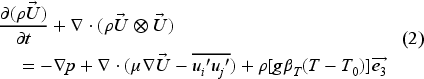
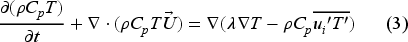
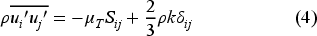
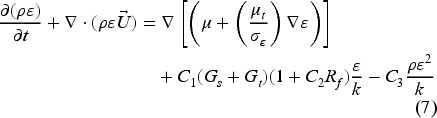
Pressure-velocity coupling with the SIMPLE scheme was used for solution calculation. The second-order method was used to discretize pressure, momentum, turbulent kinetic energy, turbulent dissipation rate and energy. The residuals of 10−3 were used for velocities, continuity, k and epsilon convergence, and the 10−6 residuals were used for energy convergence. Equations (1) to (3) are Reynolds-averaged Navier–Stokes (RANS) equations for the RNG k-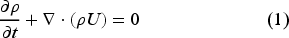

Fluent meshing was employed to create a poly-hexcore mesh as shown in Figure 2. A uniform body mesh of size 16 mm was created. The surface mesh for walls, tables, roof and ground was set to 16 mm. The surface mesh for humans was set to 8 mm. The office wall had six inflation layers to capture the flow field near the wall. The last ratio function was employed to transition between the surface mesh and the body mesh. For the enhanced wall function, the y+ of the computational domain surface was approximately 1.40–42 The number of mesh cells for the study case was approximately 14 million.
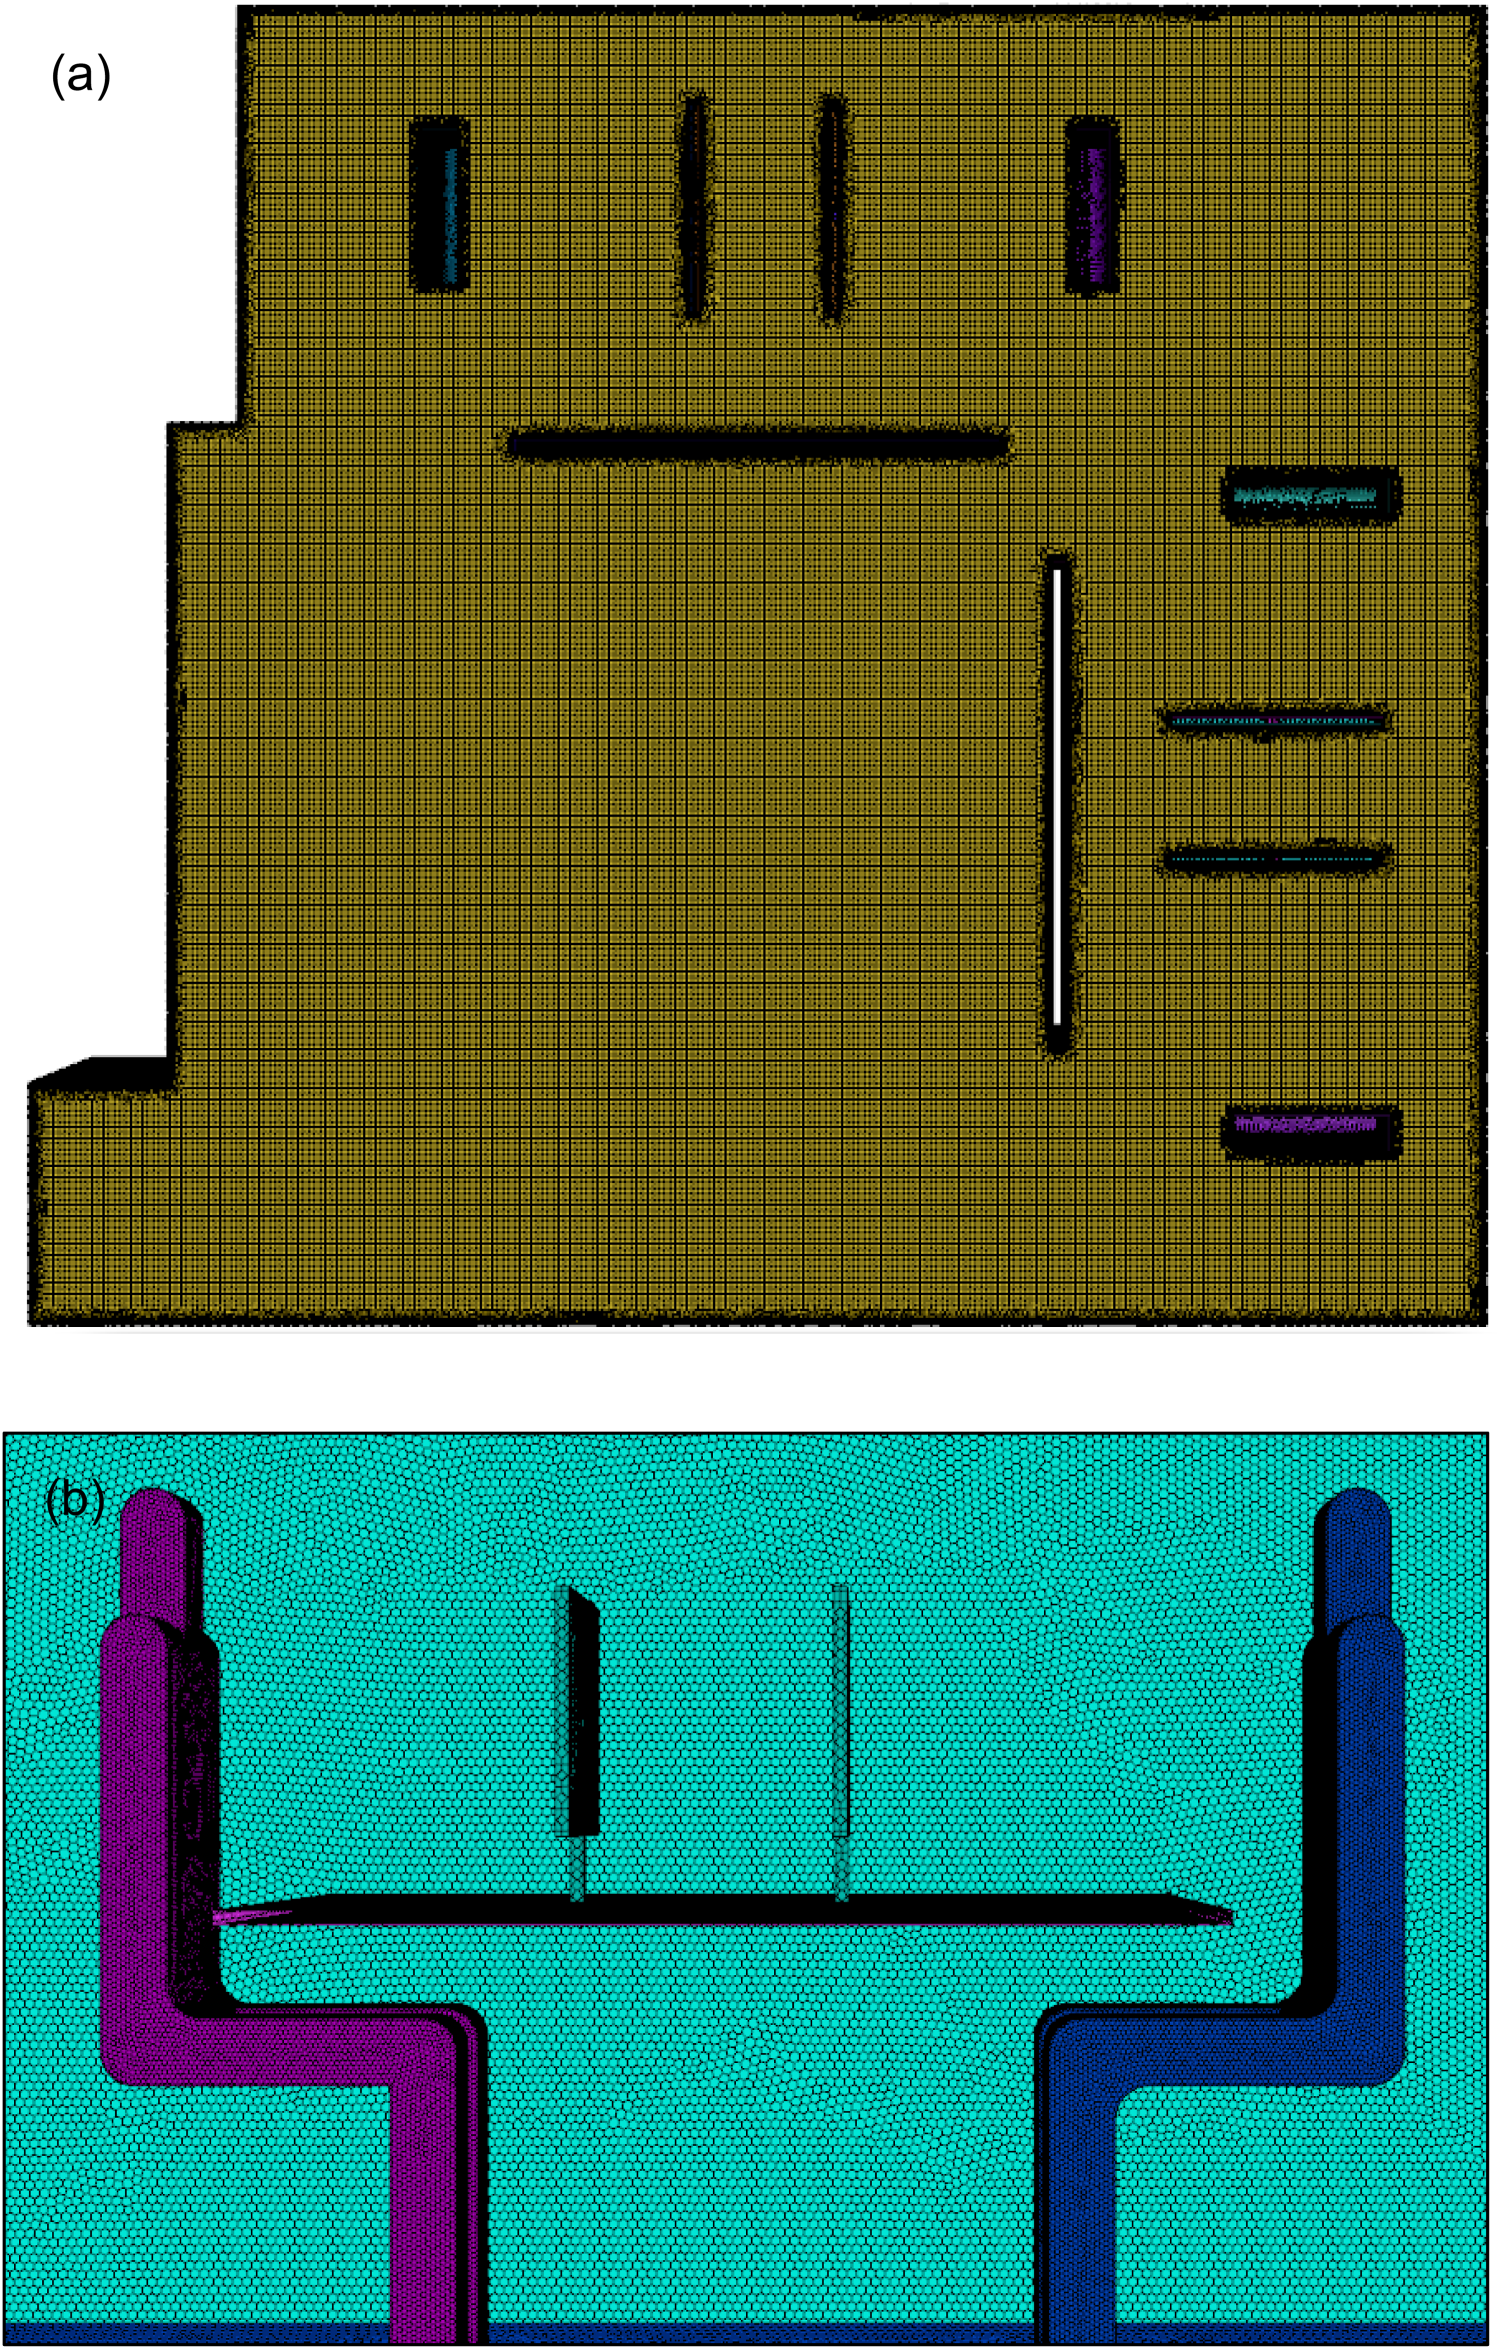
Poly-hexcore mesh for the case of partitioned geometric setup 1. (a) Uniform body mesh and (b) surface mesh of human user 2 and the desk.
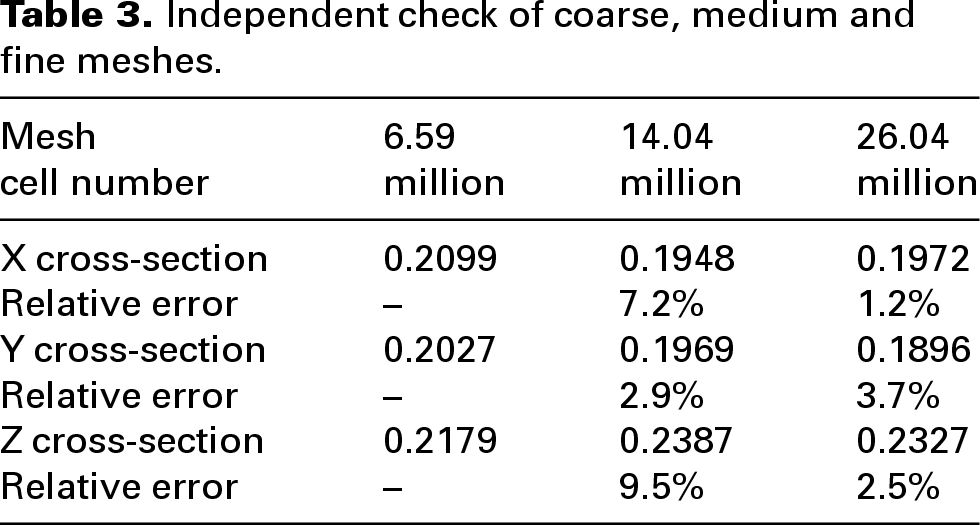
The mesh independence check was performed by comparing three types of meshes: a coarse mesh of 6.6 million cells, a medium mesh of 14 million cells and a fine mesh of 26 million cells. The coarse mesh had larger body cells, while the fine mesh had finer surface meshes. The area-averaged velocities of the three x, y and z cross sections were compared, as shown in Table 3. The differences between the medium and fine meshes of the three cross sections were 1.2%, 3.7% and 2.5%, respectively, which were less than 5%. In order to balance cost and efficiency, a medium mesh of 14 million was used in this study, as shown in Figure 2.
Independent check of coarse, medium and fine meshes.
The numerical model was validated by comparing it with the experimental results in reference. 48 The numerical domain for validation was the same as the experiment's geometric setup in reference, as shown in Figure 3. The experimental setup was 6.0 × 3.9 × 2.25 m in length, width and height, comparable to the studied office in this work. The gaseous contaminant was released behind the human occupant and 0.1 m above the floor. The same numerical setup was employed for the validation, including the meshing and solving scheme. In the simulation, the particles were released at the exact location of the experimental source of the gaseous contaminant. The velocity, temperature and particle concentration profiles along four poles in the vertical direction were extracted from the numerical simulation, as shown in Figure 3. The comparison of the simulation and experimental results is shown in Figure 4. The numerical results of the velocity, temperature and concentration profiles agreed reasonably well with the experimental results, indicating the reliability of the numerical model in this study.
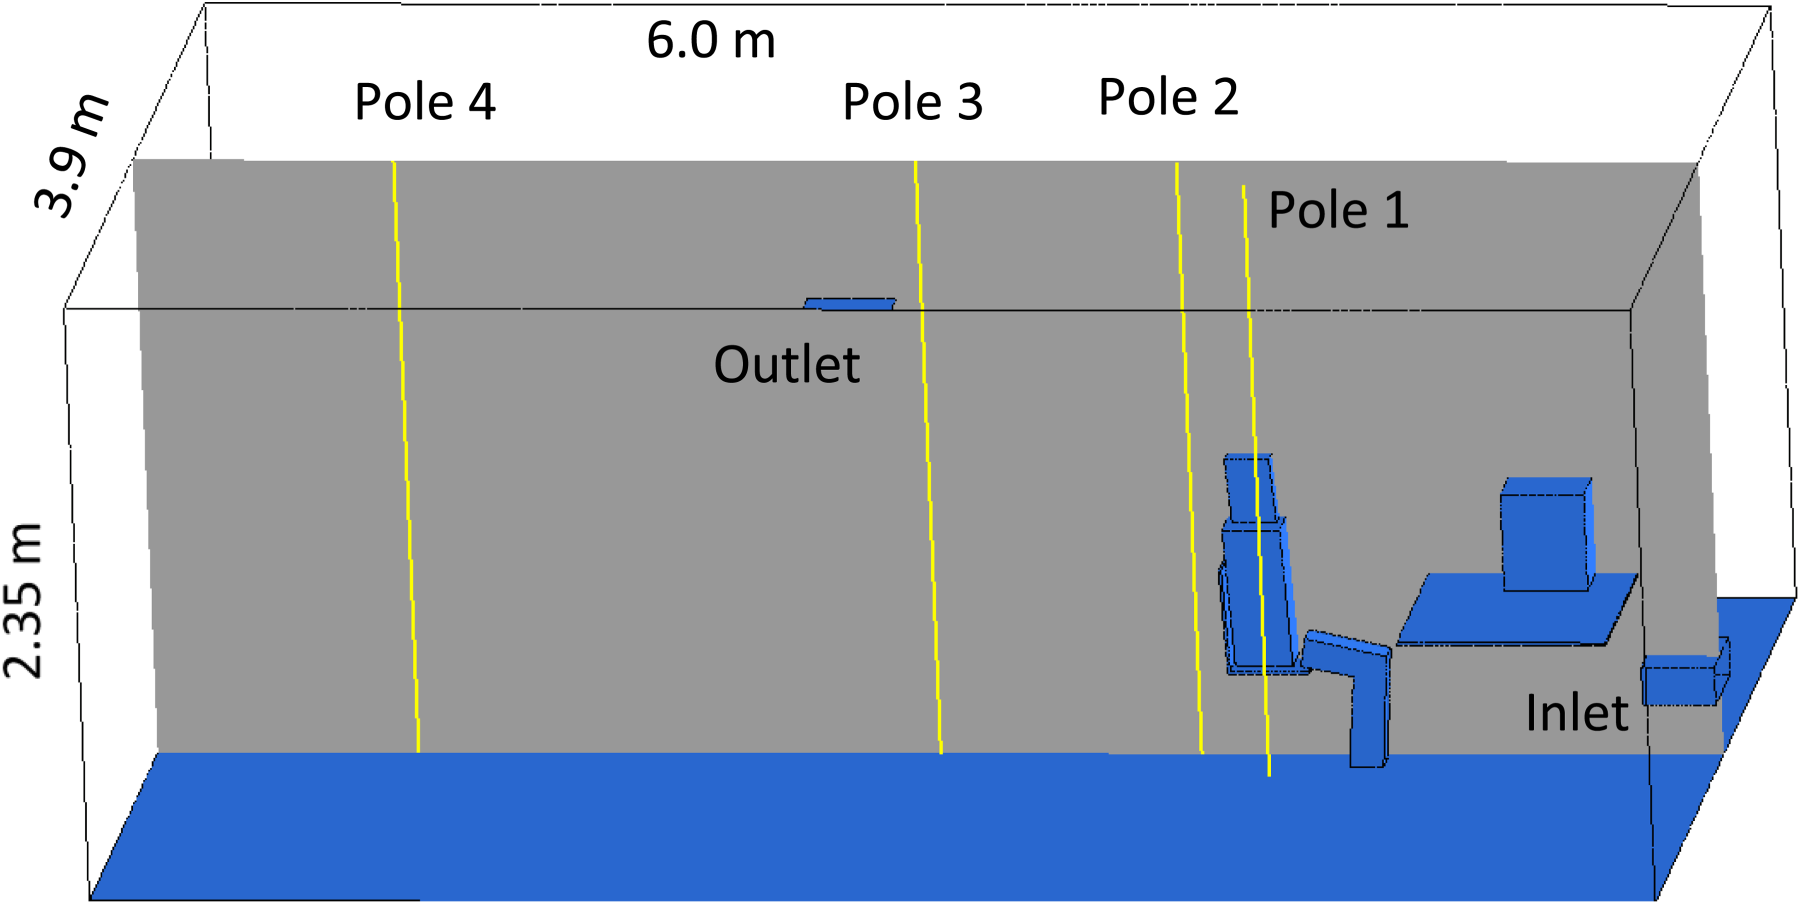
Geometric setup of the experimental setup used to validate the numerical simulations of this work.
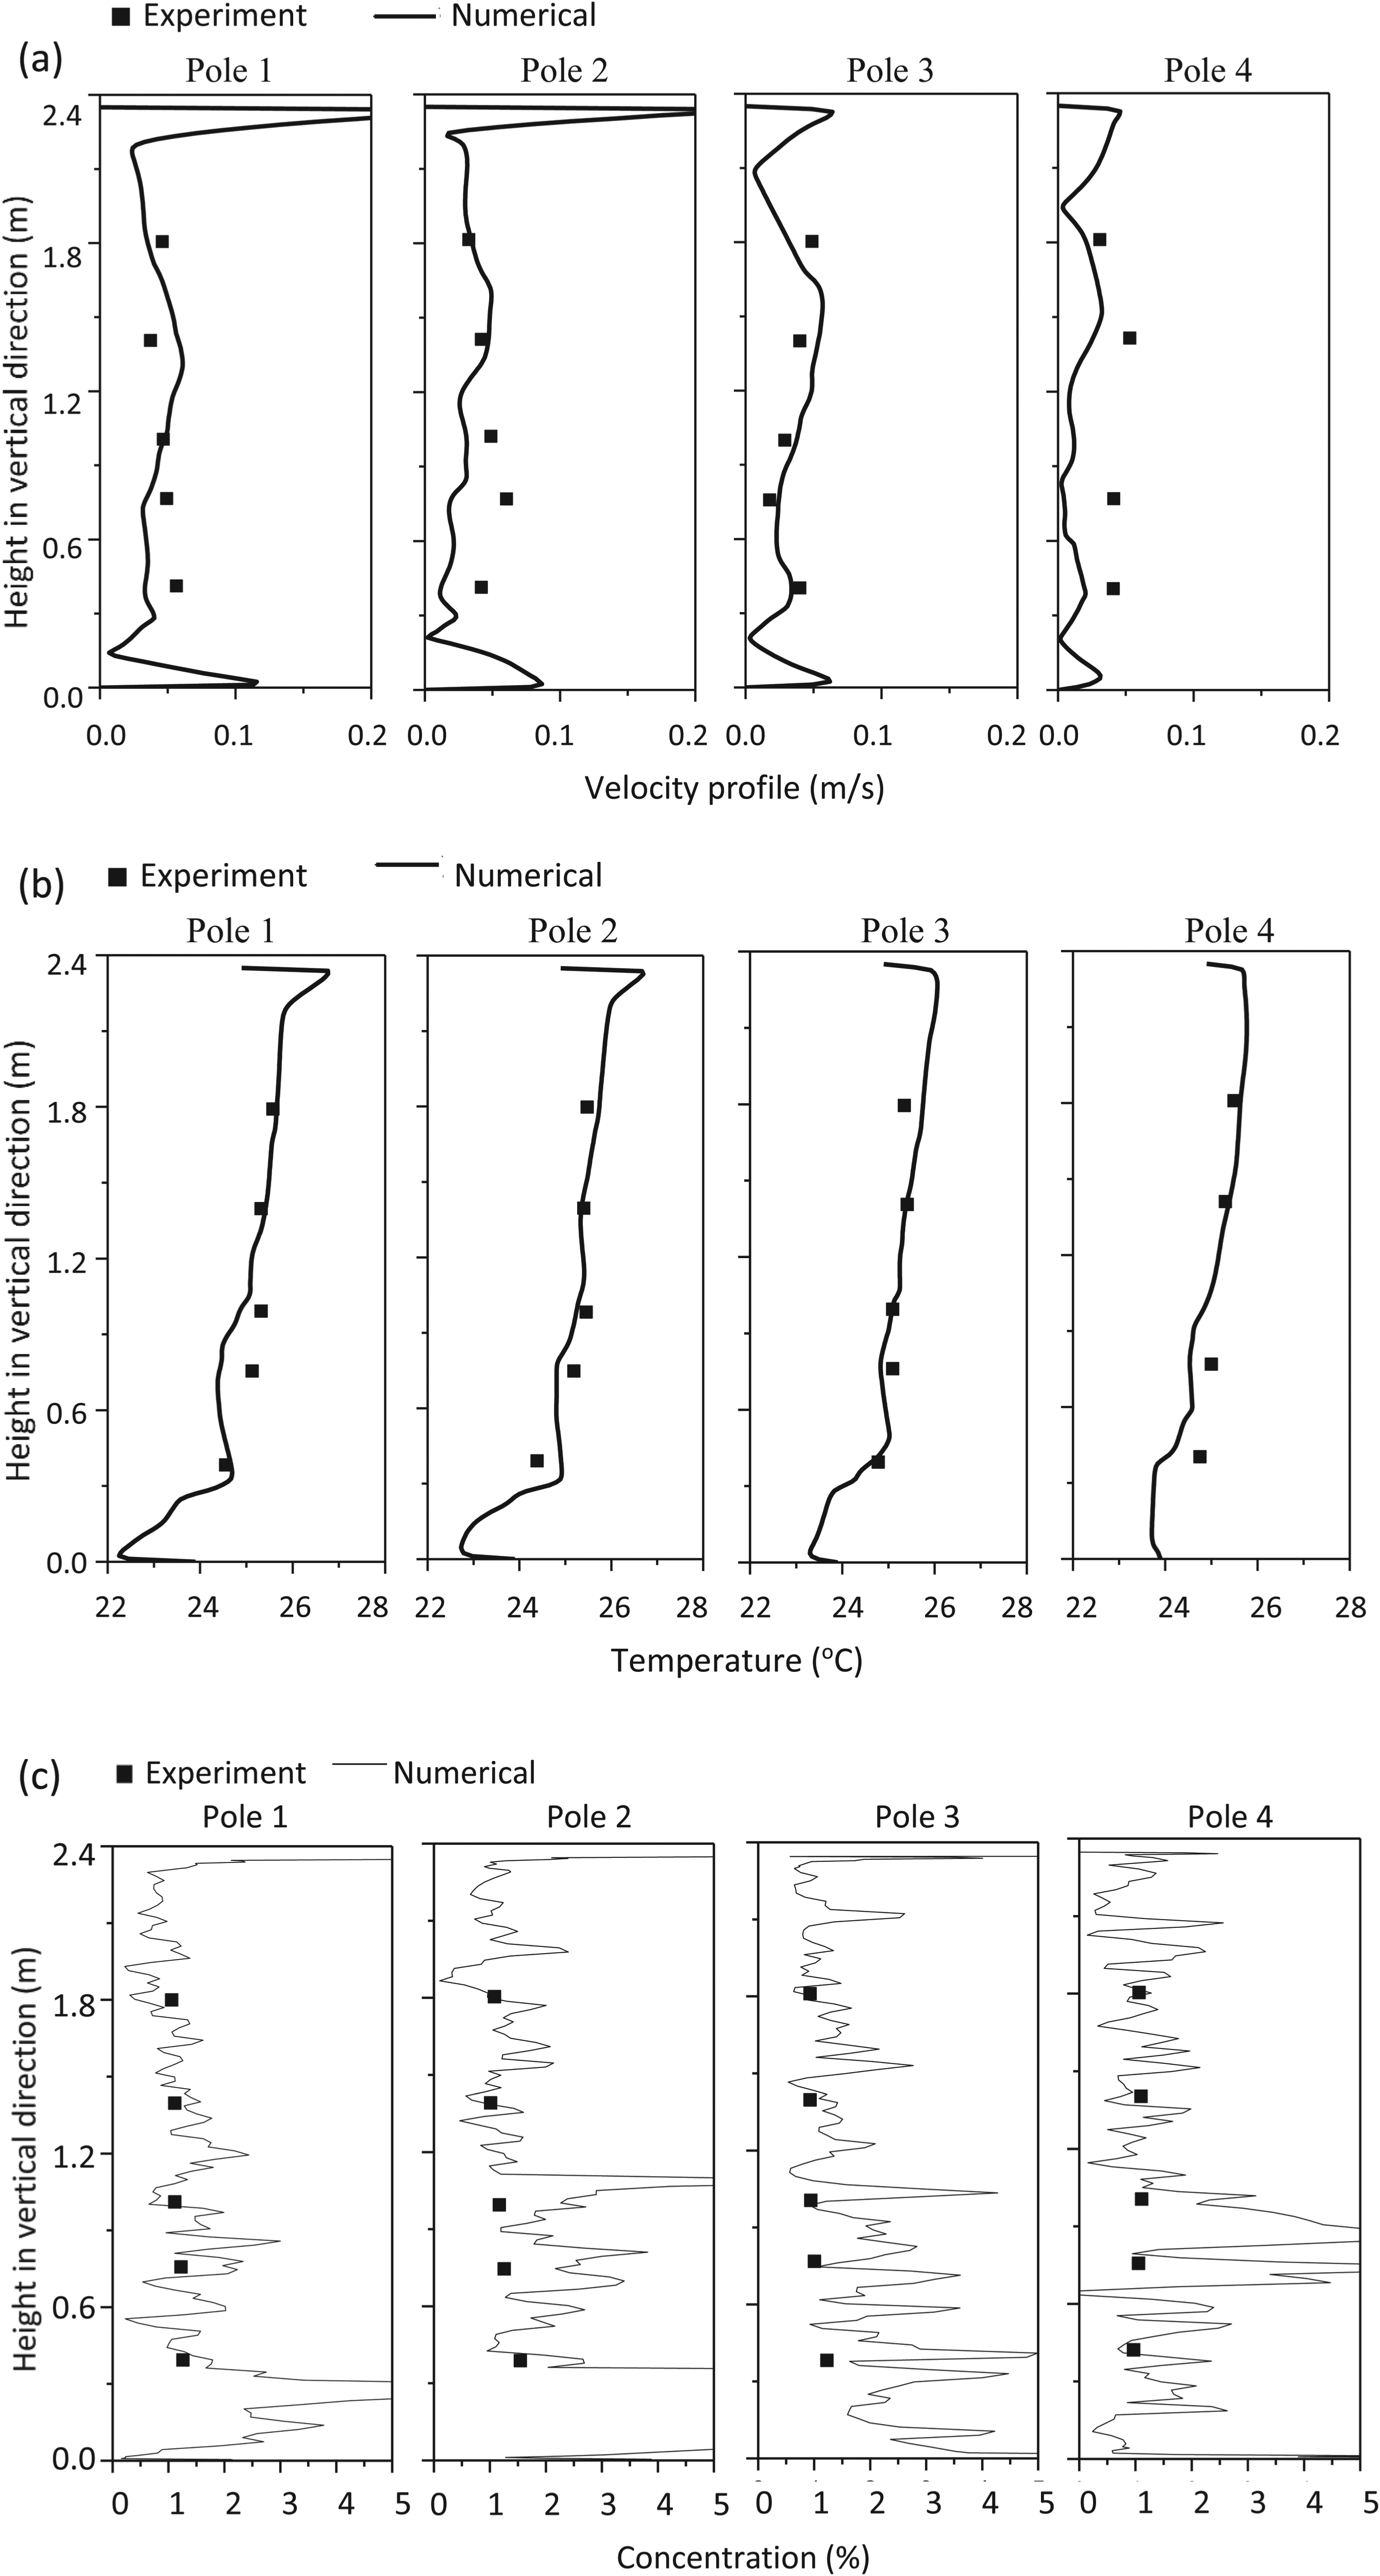
Comparison of experimental and numerical results at four different Poles. (a) Velocity profiles, (b) temperature profiles, and (c) concentration profiles.
Evaluation indices of exposure to VOCs
This study evaluated the lifetime exposure dose to LCD VOCs through inhalation, which was based on an average human inhalation flow rate of 0.84 m3/h.
39
The inhaled fraction (IF) of the human users was calculated by equation (8).

Results
Airflow field and temperature contour in the office
Airflow is important for the dispersion of indoor contaminants. Figure 5 shows the cross sections of airflow fields in the x-axis for the case of geometric setup 1 with an ACH of 4. For the cross-section passing through the inlet diffuser (Figure 5(a)), the fresh air streams from the diffuser was initially released at an angle of about 45°C to the roof, but then quickly turned downward, and the two air streams from the opposite inlets of the diffuser merged and rushed into the lower part of the office as the mainstream. There were several large vortices in this cross-section. For the cross-section passing through the human occupants (Figure 5(b)), strong upward thermal plumes were observed arising from two human occupants with a velocity of about 0.5 m/s. The plumes then induced several large vortices in the upper part of the office. The large-scale up-and-down flipping of the air in the office implied well-mixed situation in the office.
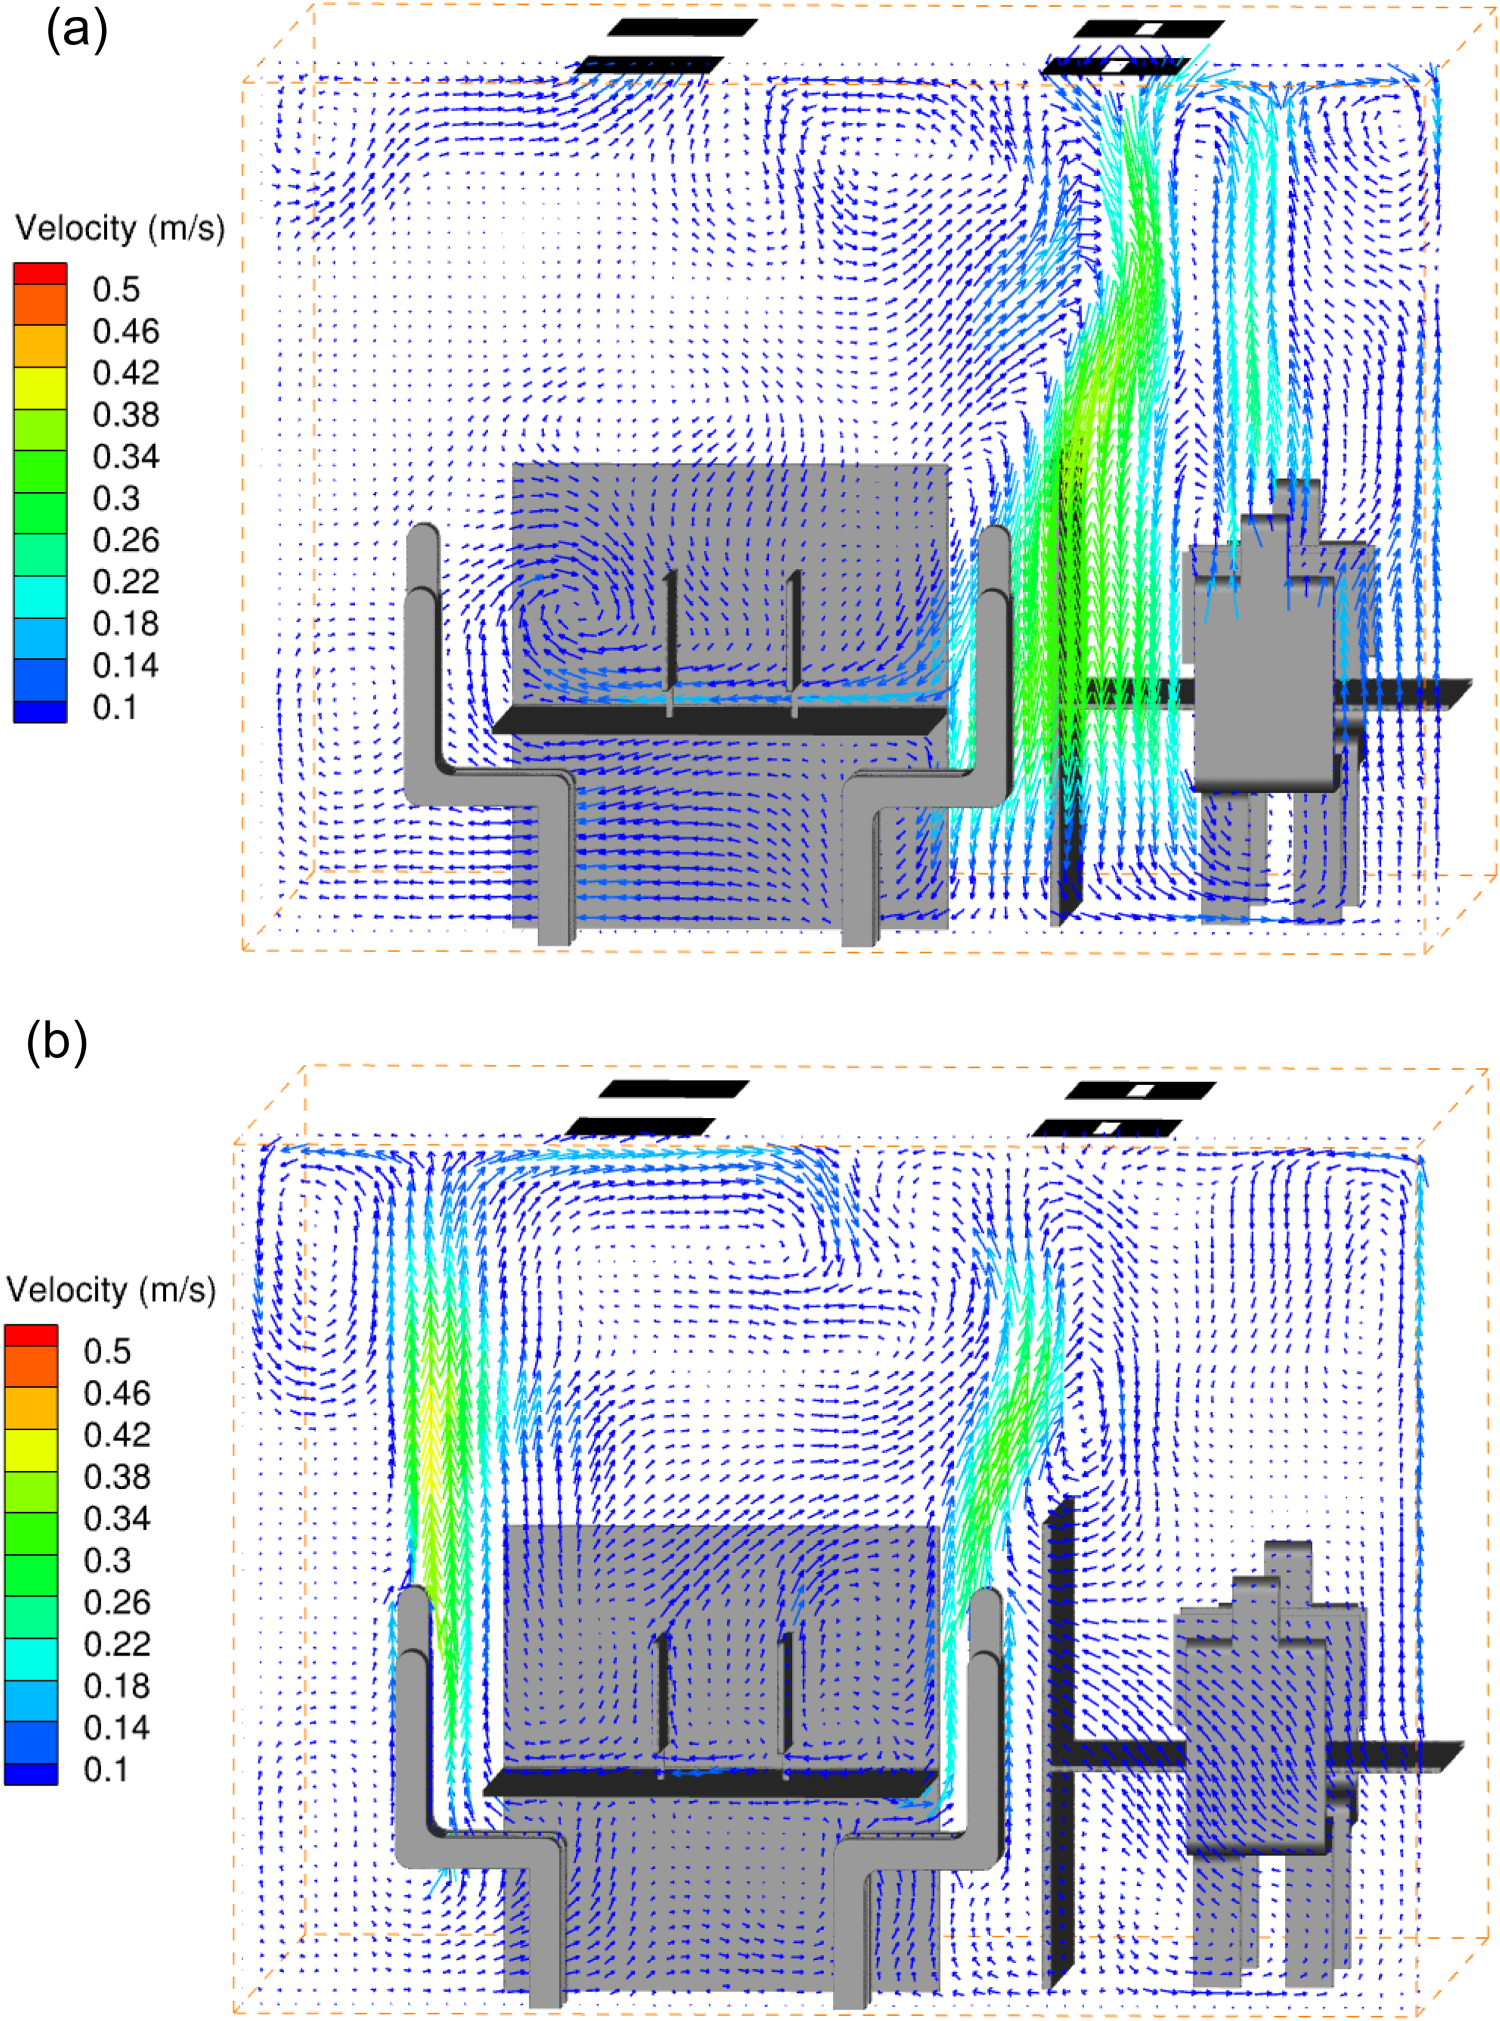
Airflow field in the x-axis cross sections (a) passing through the inlet diffuser X-1 cut and (b) passing through the human users X-2 cut, for geometric setup 1 and an ACH of 4 with an inlet velocity of 0.1 m/s.
Figure 6 shows the airflow fields in the x-axis cross sections for the case of geometric setup 1 with an ACH of 40. For the cross-section passing through the inlet diffuser (Figure 6(a)), the fresh air streams from the diffuser had enough momentum to move forward, with an initial angle of 45°C to the roof. One air stream moved forward, impacted the wall, and then turned mostly downward to attach to the wall. The other air stream moved forward and impacted the opposite wall but the stream was at a higher position in the office. Therefore, the two opposing streams formed a large loop with an airflow flowing down the wall and a weaker upward flow in the middle area. For the cross-section passing through the human occupants (Figure 6(b)), the upward thermal plumes and the downward airflow close to the walls with a velocity of about 0.5 m/s. There were some vortices in this cross-section. Comparing Figures 3 and 4, the inlet velocity (or ACH) dramatically affected the airflow pattern in this diffuser setup.
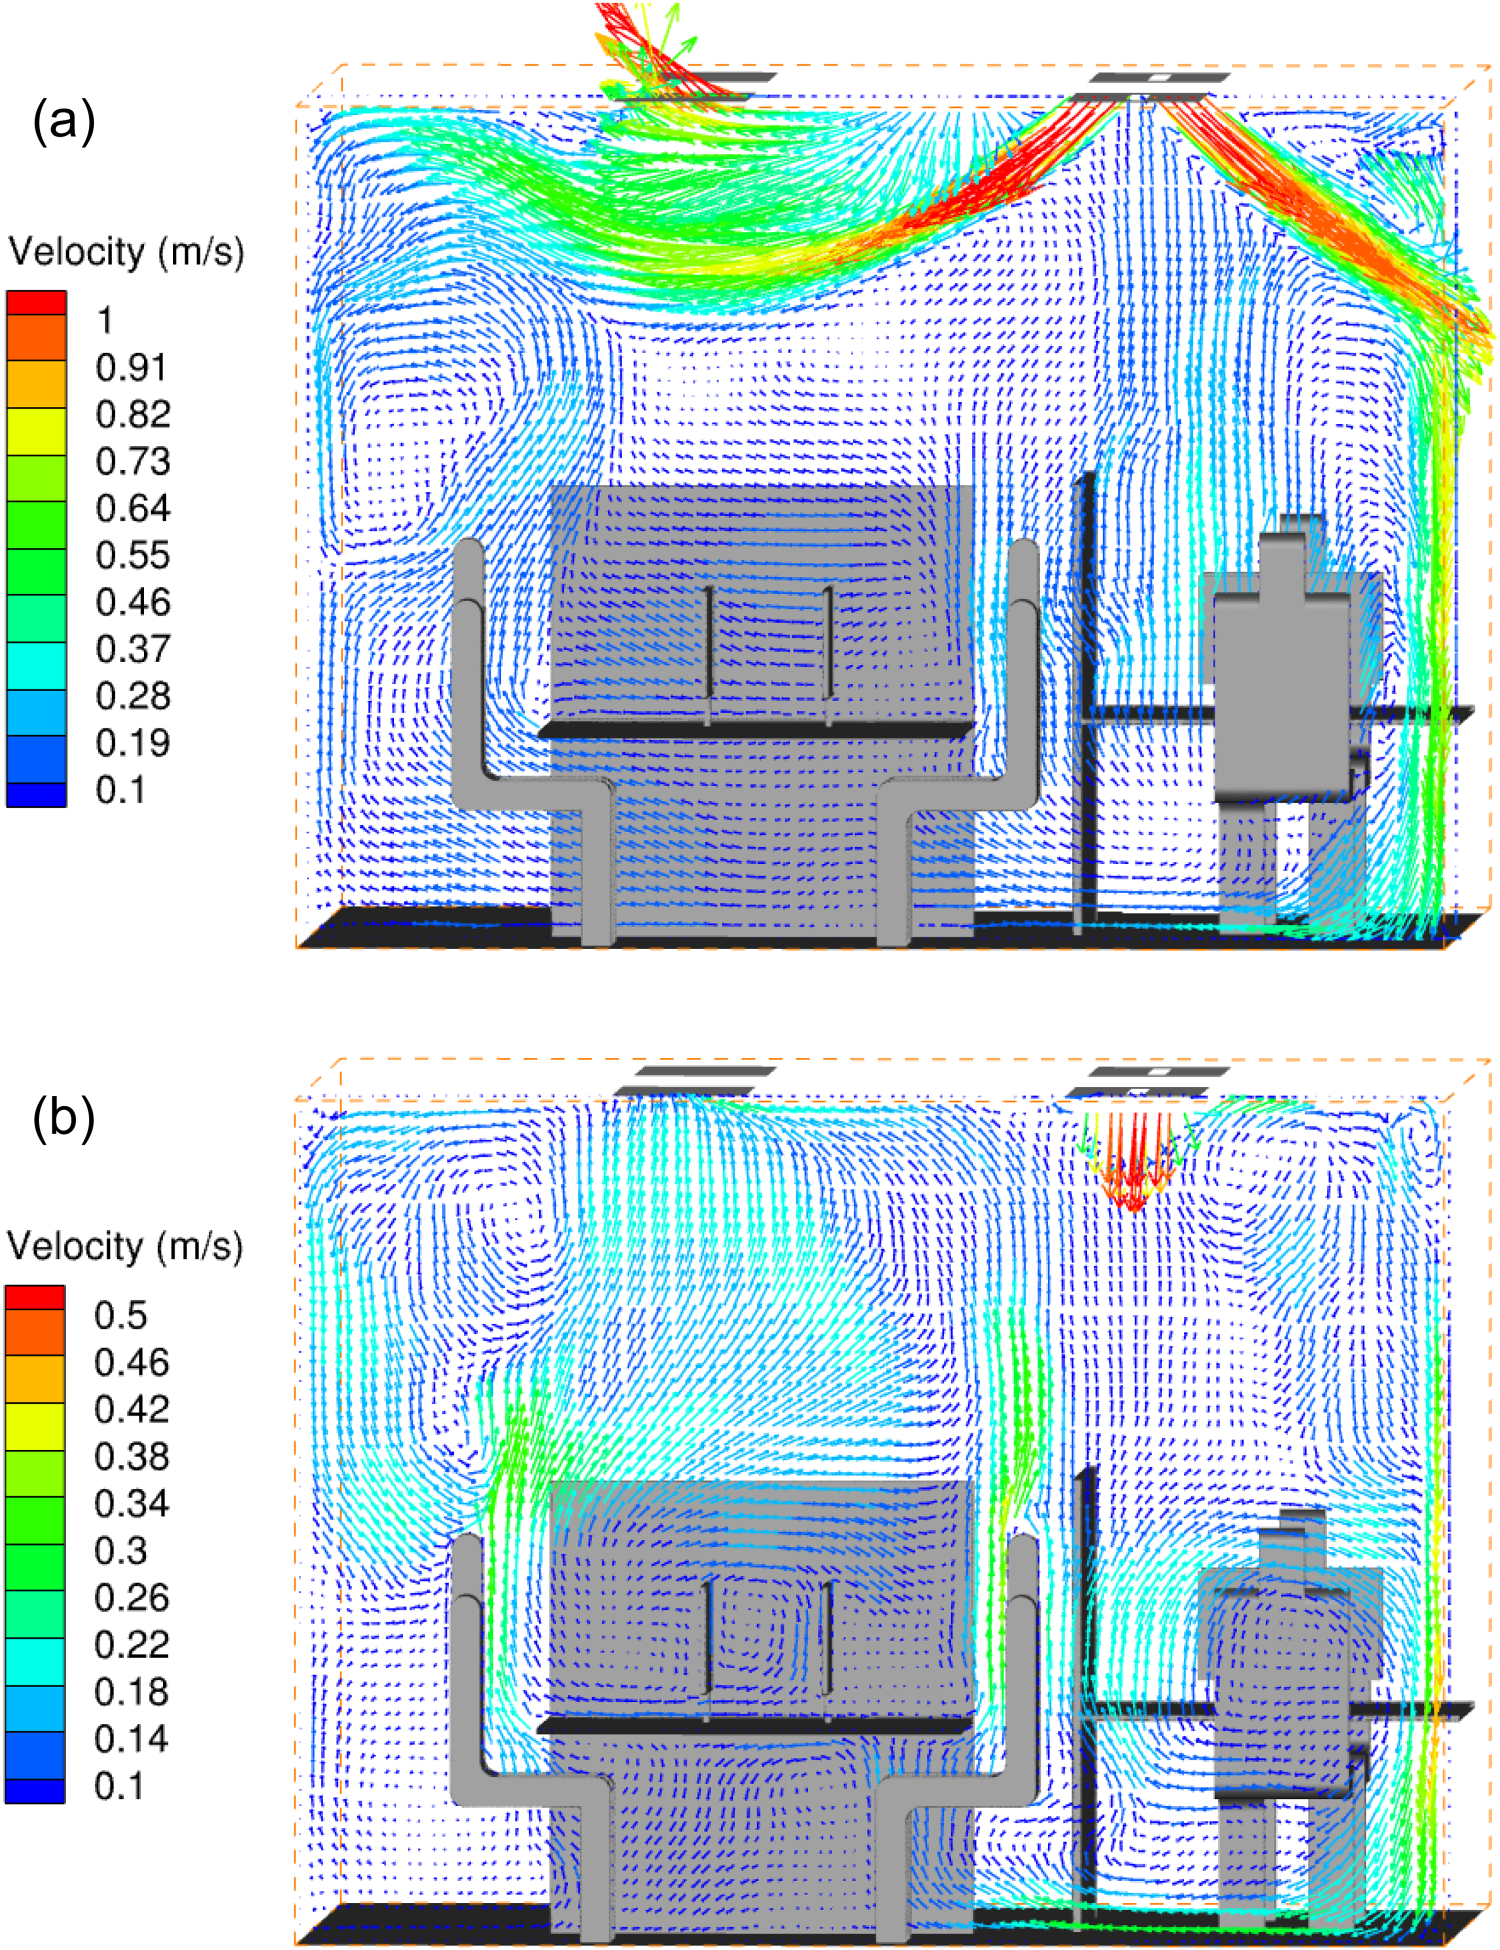
Airflow field in the x-axis cross sections (a) passing through the inlet diffuser X-1 cut and (b) passing through the human users X-2 cut, for geometric setup 1 and an ACH of 40 with an inlet velocity of 1 m/s.
Figure 7 shows the temperature contours in two x-axis cross sections for geometric setup 1 and an ACH of 4 with an inlet velocity of 0.1 m/s. For the cross-section passing the inlet (Figure 7(a)), the cool air impinged on the ground, which had a lower temperature than the surroundings. The temperature at the lower part of the office was 24°C–25°C, and the upper part was approximately 26°C. For the cross-section passing the human occupant (Figure 7(b)), the vertical direction temperature distribution was similar to Figure 7(a). The lower and upper parts had a temperature of approximately 24°C–25°C and 26°C, respectively. The human occupants generated upward thermal plumes with a temperature of around 26°C–27°C. Combined with the thermal plumes from the monitors on the desk, a relatively warmer area between the two human occupants was formed in comparison to the surroundings.
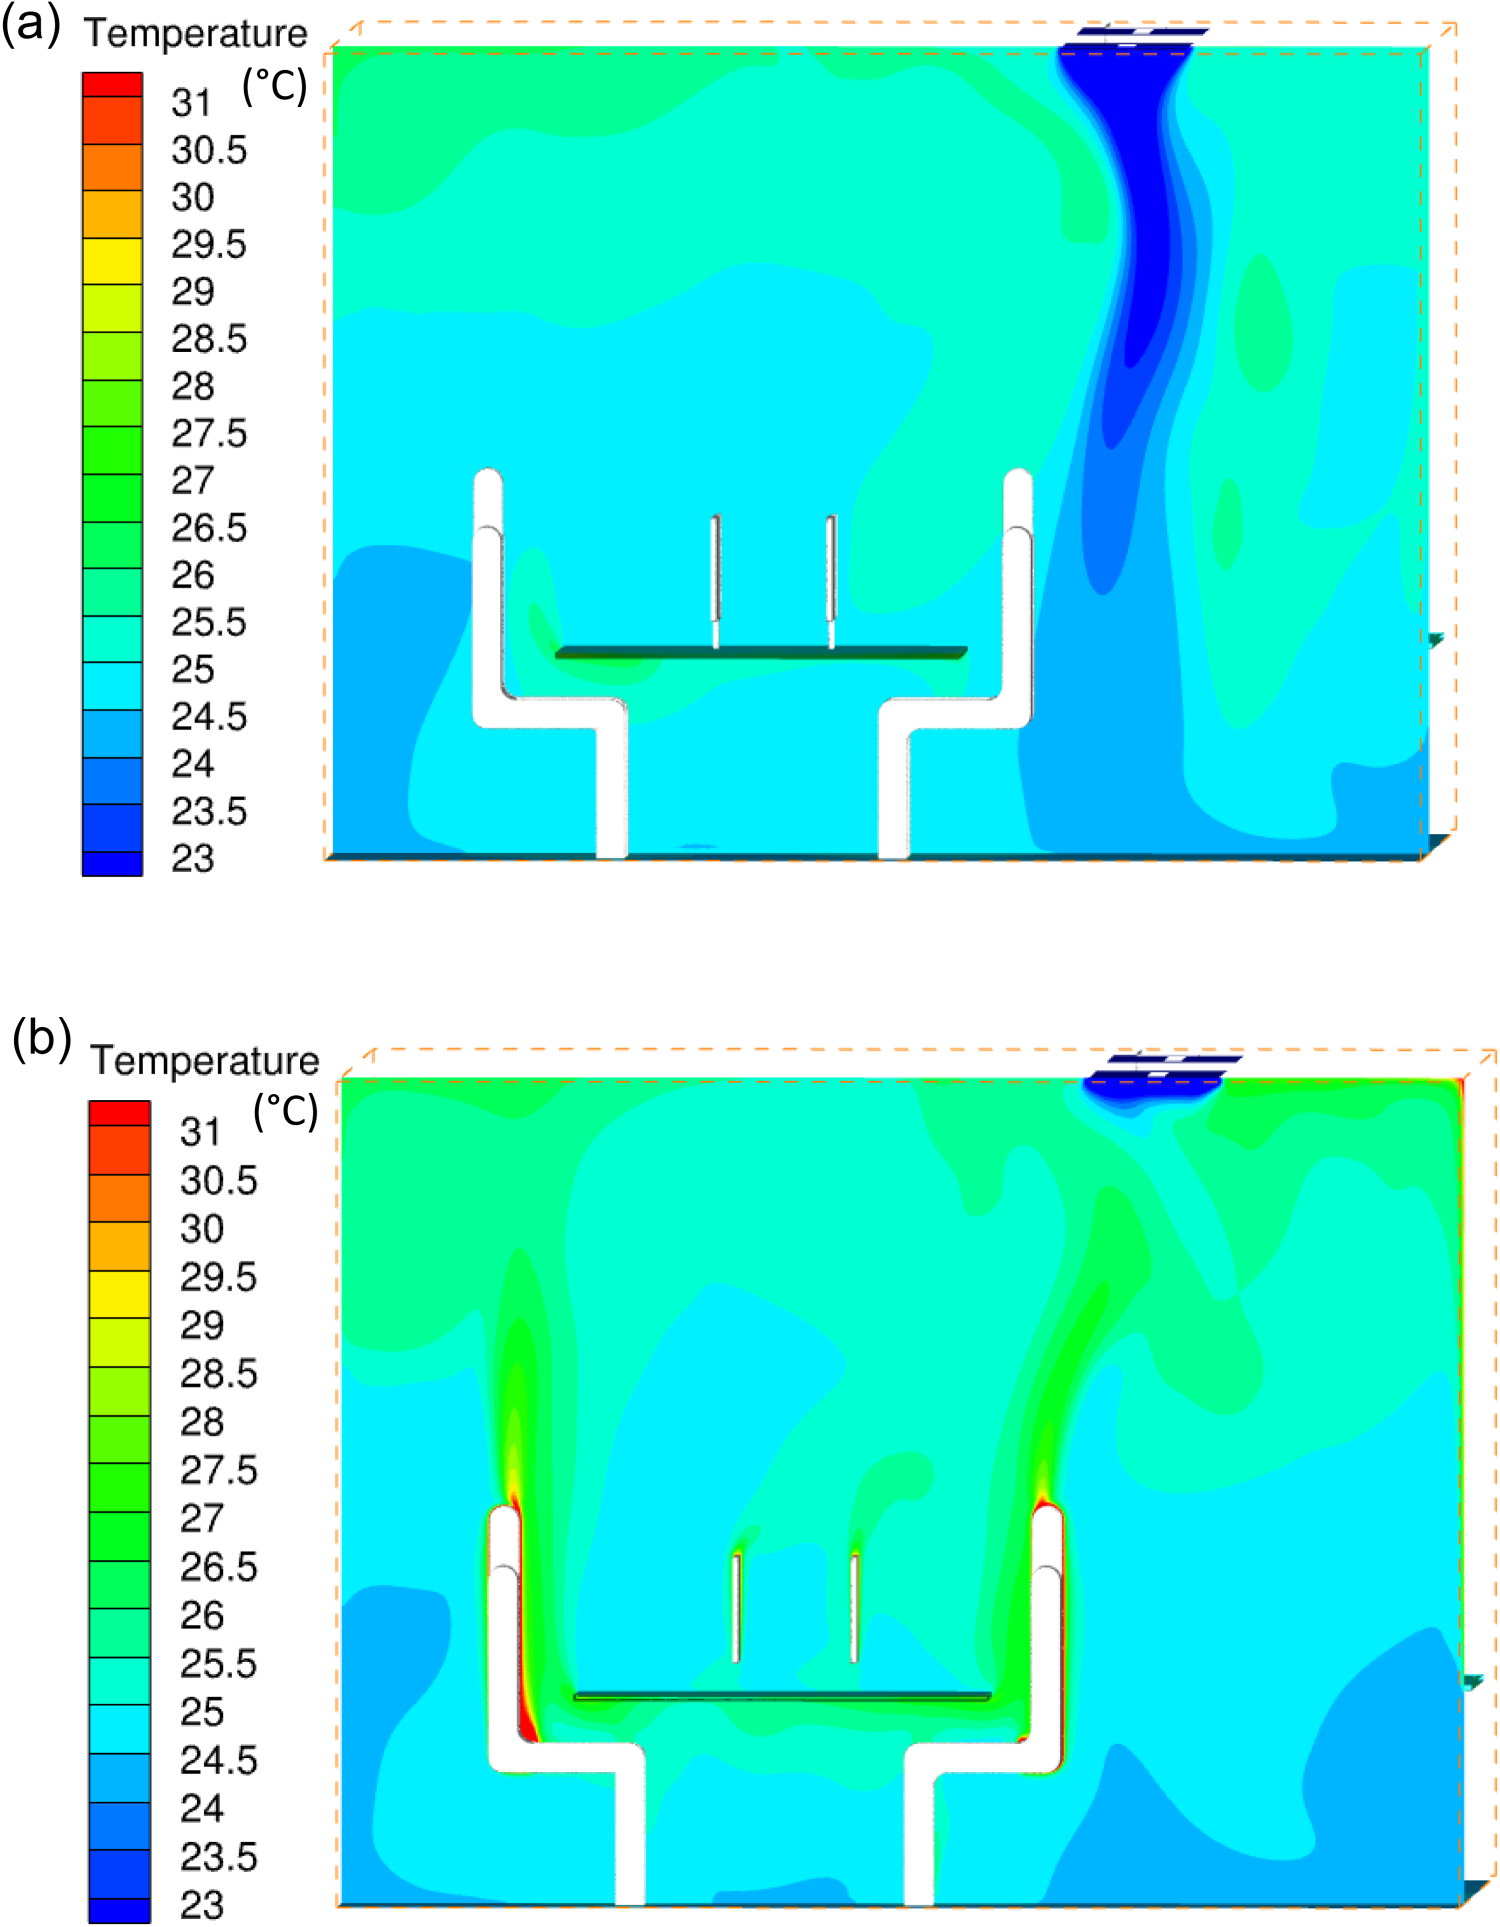
Temperature contour in the x-axis cross sections (a) passing through the inlet diffuser X-1 cut and (b) passing through the human users X-2 cut, for geometric setup 1 and an ACH of 4 with an inlet velocity of 0.1 m/s.
Figure 8 shows the temperature contours in two x-axis cross sections for geometric setup 1 and an ACH of 40 with an inlet velocity of 1 m/s. For the cross-section passing through the inlet (Figure 8(a)), the cool air was delivered into the office with an angle of 45° due to the higher inlet velocity than in the case of ACH 4. The cool air was then sent to the near-wall regions with a temperature of 20°C–21°C. The inner region of the office had a higher temperature of 21°C–22°C. For the cross-section passing through the office occupants (Figure 8(b)), the inner region was warmer than the surrounding near-wall region. The upward thermal plumes had a temperature of around 22°C. The indoor temperature of the office under ACH 40 was around 3°C lower than that of ACH 4, as shown in Figure 8(a).
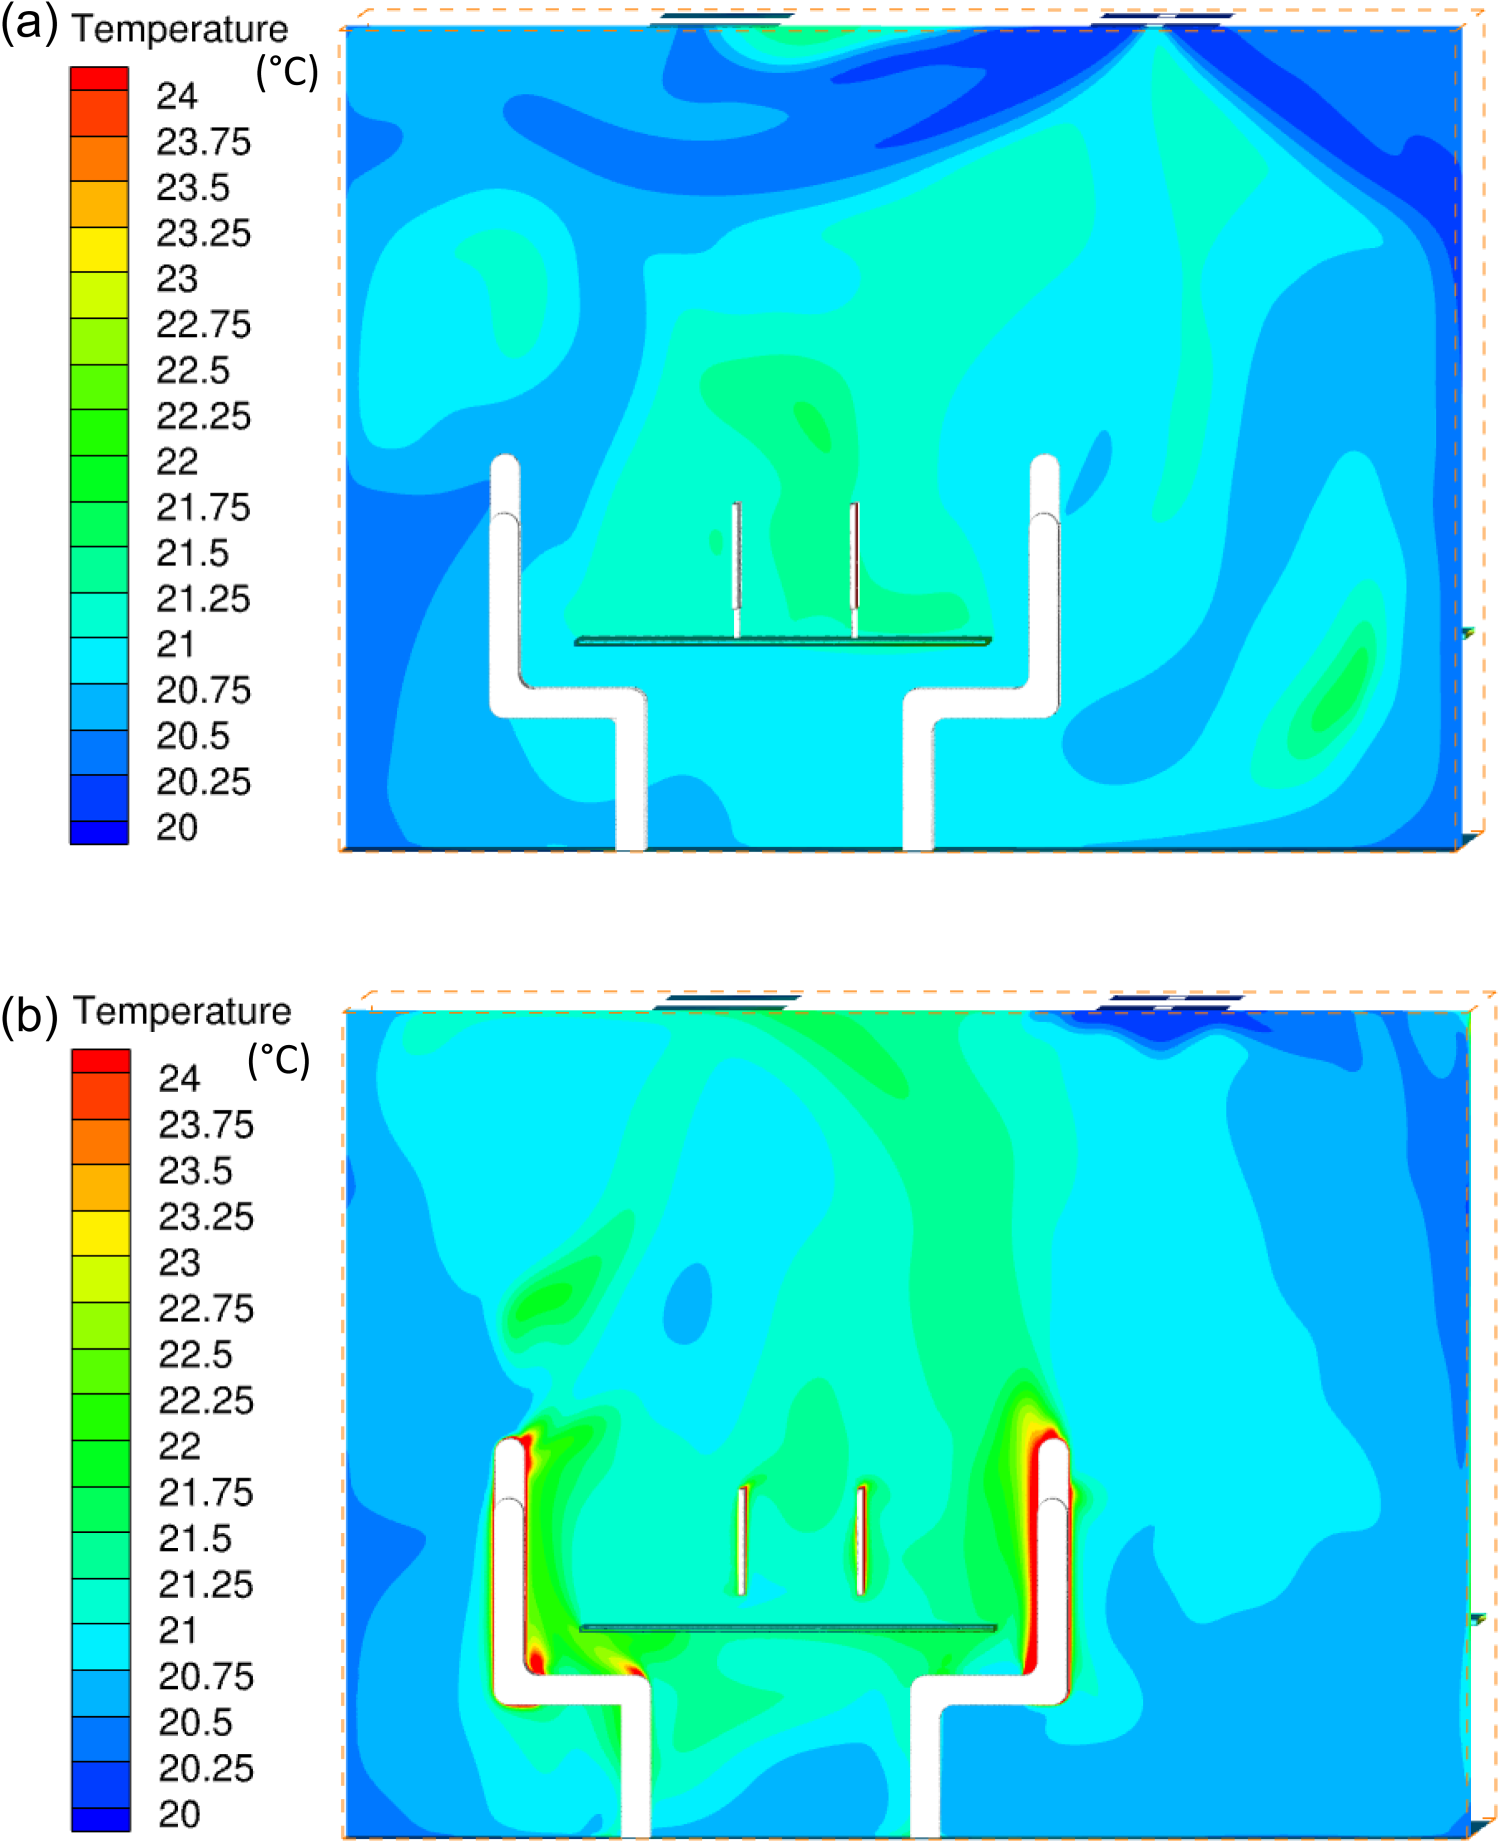
Temperature contour in the x-axis cross sections (a) passing through the inlet diffuser X-1 cut and (b) passing through the human users X-2 cut, for geometric setup 1 and an ACH of 40 with an inlet velocity of 1 m/s.
Intake fractions of different users to individual LCD
The exposure intake fractions of occupants to different LCD monitors with geometric setup 1 are shown in Figure 9. For ACH of 4, the human occupants were exposed to all four LCD monitor sources with a similar magnitude of the intake fraction (i.e. (1–2) × 10−3 per LCD) from each LCD. This is due to the mixing situation created by the large-scale flipping. With increasing ACH, the deviation of the intake fraction of each user from a single LCD source became more prominent due to the larger central circulation in the office. In addition, the increase in ACH significantly reduced the exposure intake fractions of the human occupants to the scale of 10−4, because the VOC molecules were more effectively exhausted from the office under larger ACHs.
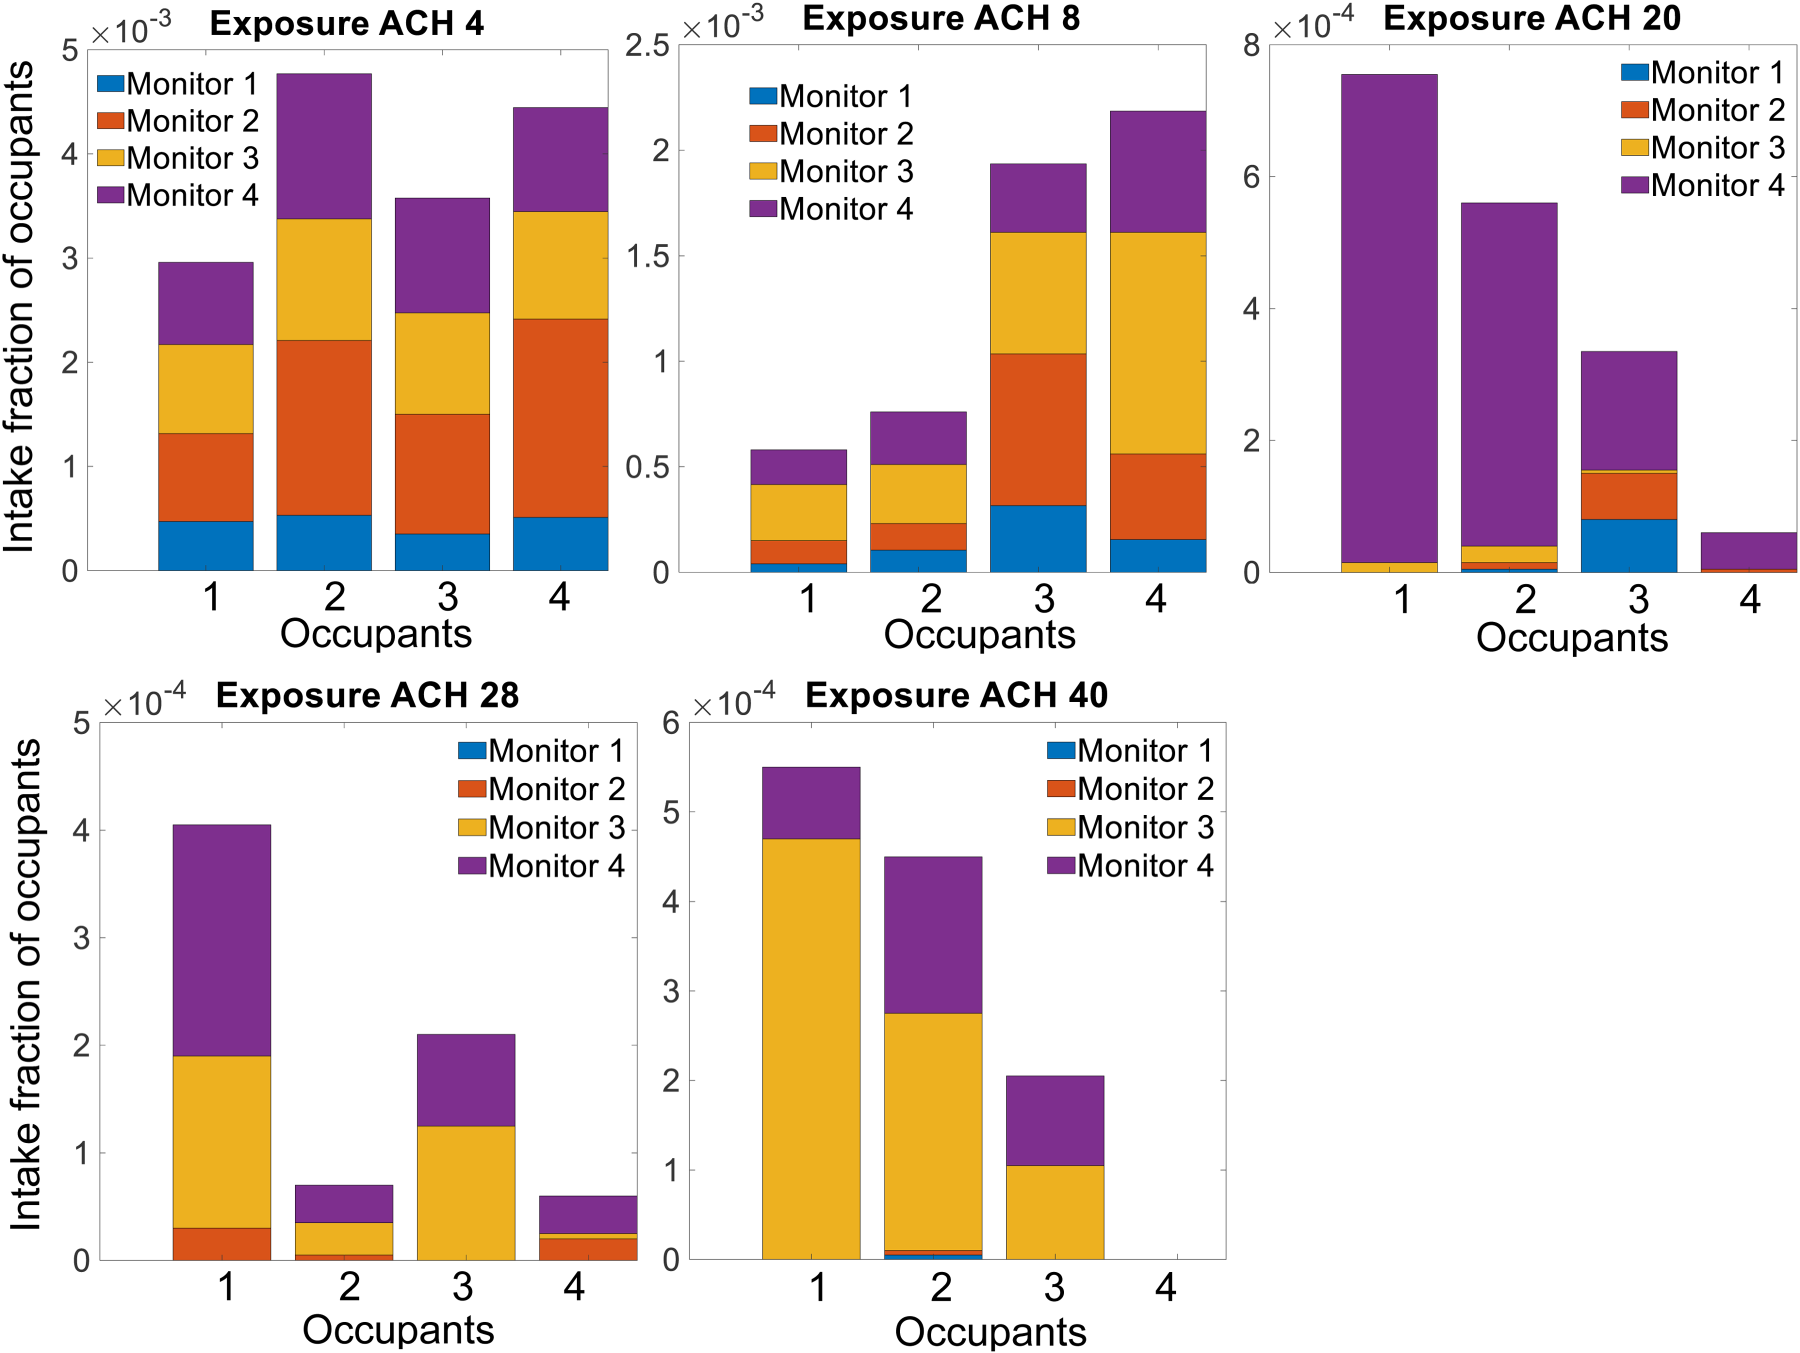
Exposure intake fractions of human occupants to individual LCD monitor sources under different ACHs in geometric setup 1 with partitioning.
The exposure intake fractions of occupants to each LCD source in geometric setup 1 without partitions were shown in Figure 10. As the ACH was increased to 40, the intake fractions was gradually reduced from 10−3 to 10−4. Under the ACH of 4 and 8, the intake fractions from the four monitors were similar. For the ACH of 20, 28 and 40, the intake fractions from monitor 3 were much higher than the other monitors. Under each ACH, the intake fractions without partitions were at the same magnitude as those with partitions.
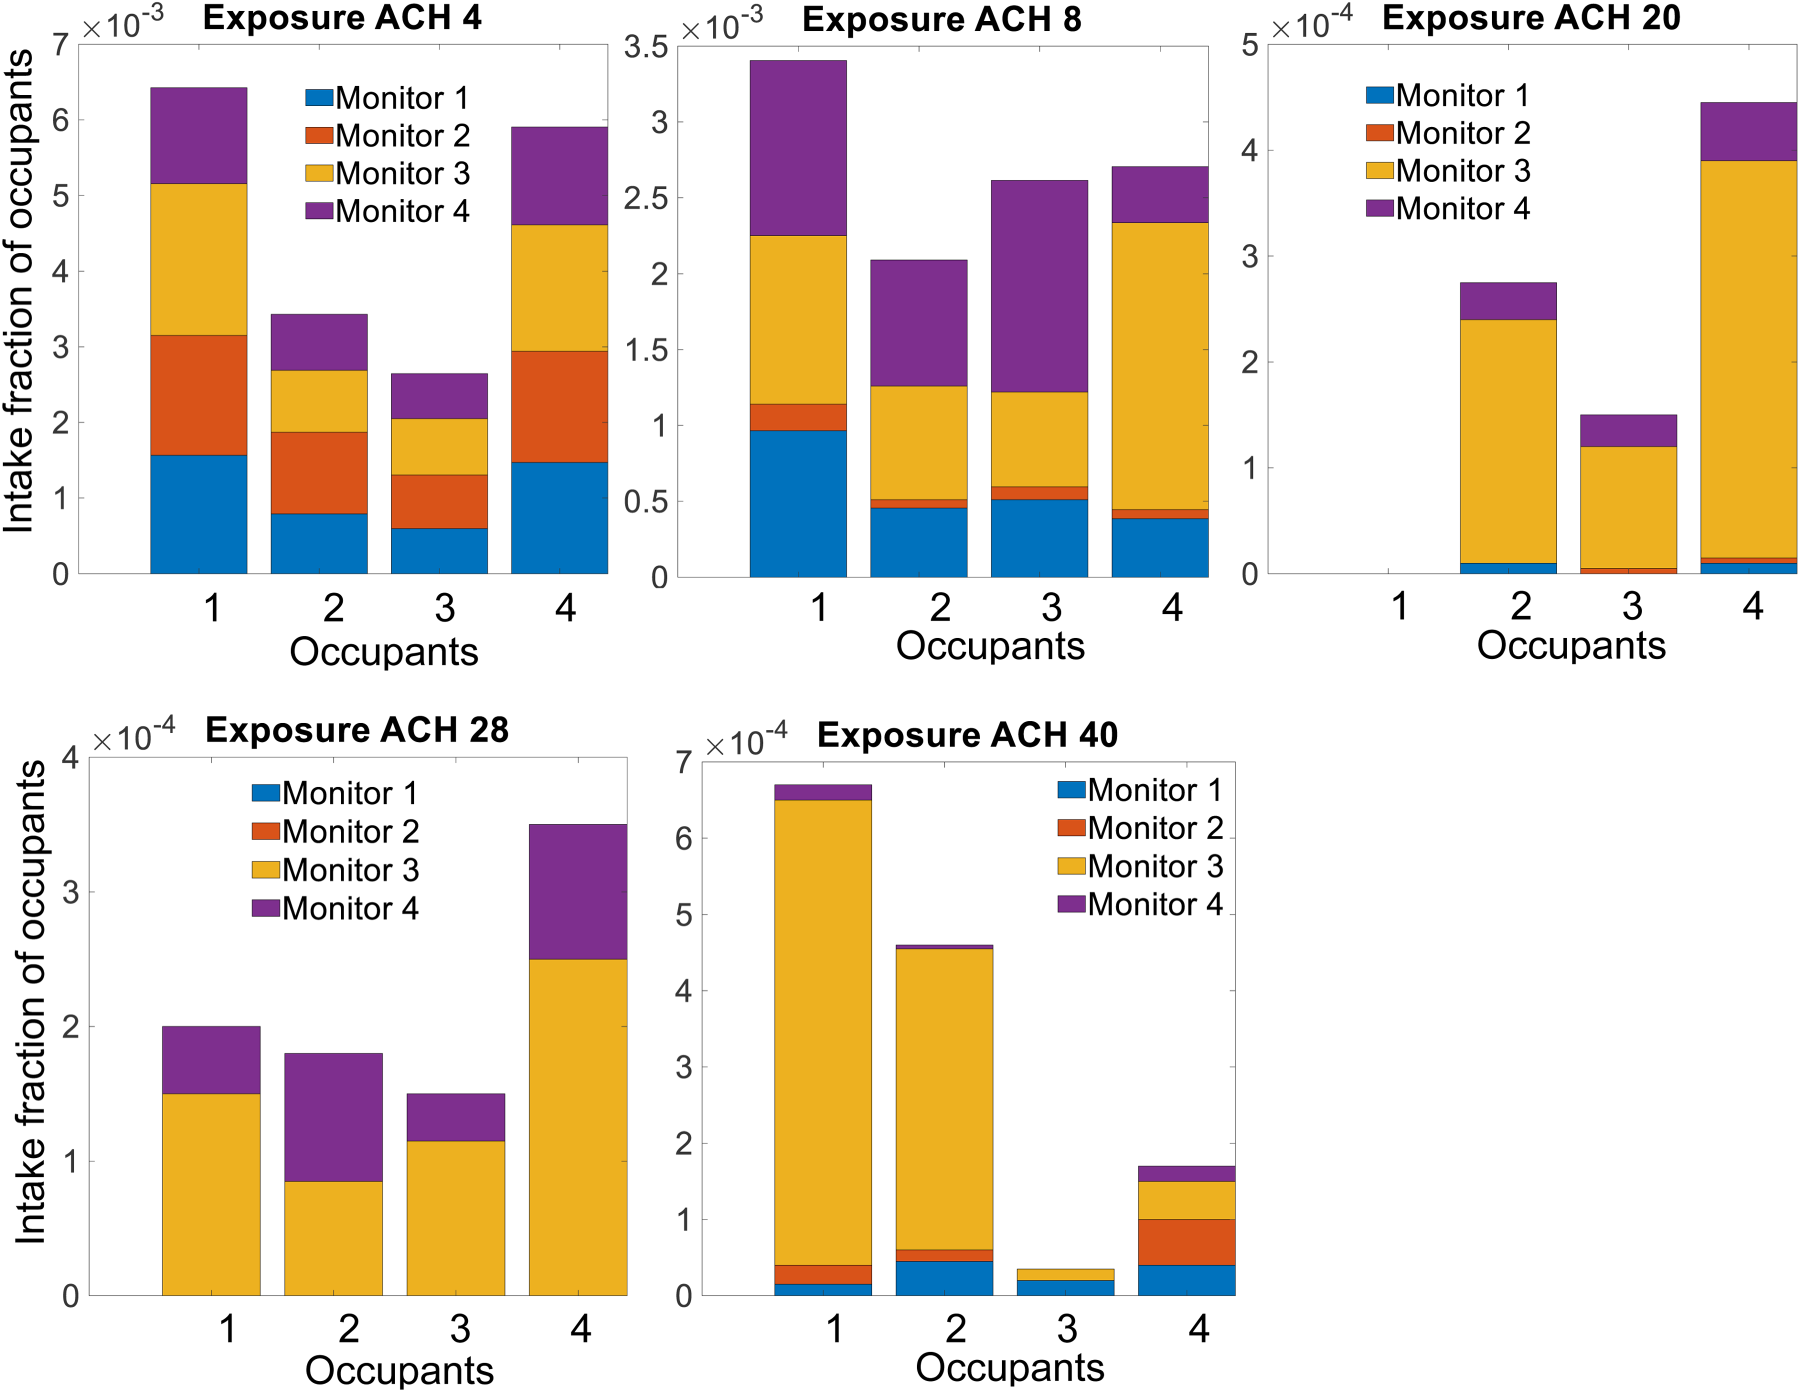
Exposure intake fractions of human occupants to individual LCD monitor sources under different ACHs in geometric setup 1 without partitioning.
Effect of ACH on intake fraction of VOC molecules
Box plot was drawn to evaluate the overall intake fractions relative to ACH for each case, as shown in Figure 11(a). For ACH of 4, the intake fractions in the office were in the range of (0.7–2.5) × 10−3, with a median of approximately 1.5 × 10⁻³. As ACH was increased to 8 and 20, the intake fractions were decreased almost linearly to approximately 0.7 × 10⁻³ and 0.2 × 10⁻³, respectively (Figure 9(a)), and the reduction ratio of intake fractions compared to ACH of 4 was about 51% and 88%, respectively (Figure 11(b)). When ACH was further increased to 40, the intake fractions were slightly reduced to 0.1 × 10⁻³, and the reduction ratios were further increased to 92% and 93%, respectively. For individual geometric setups and partitions, the detailed intake fractions had the same variation trend as ACH. An ACH of 8–20 is recommended to achieve a cost-effective balance in the office environment.
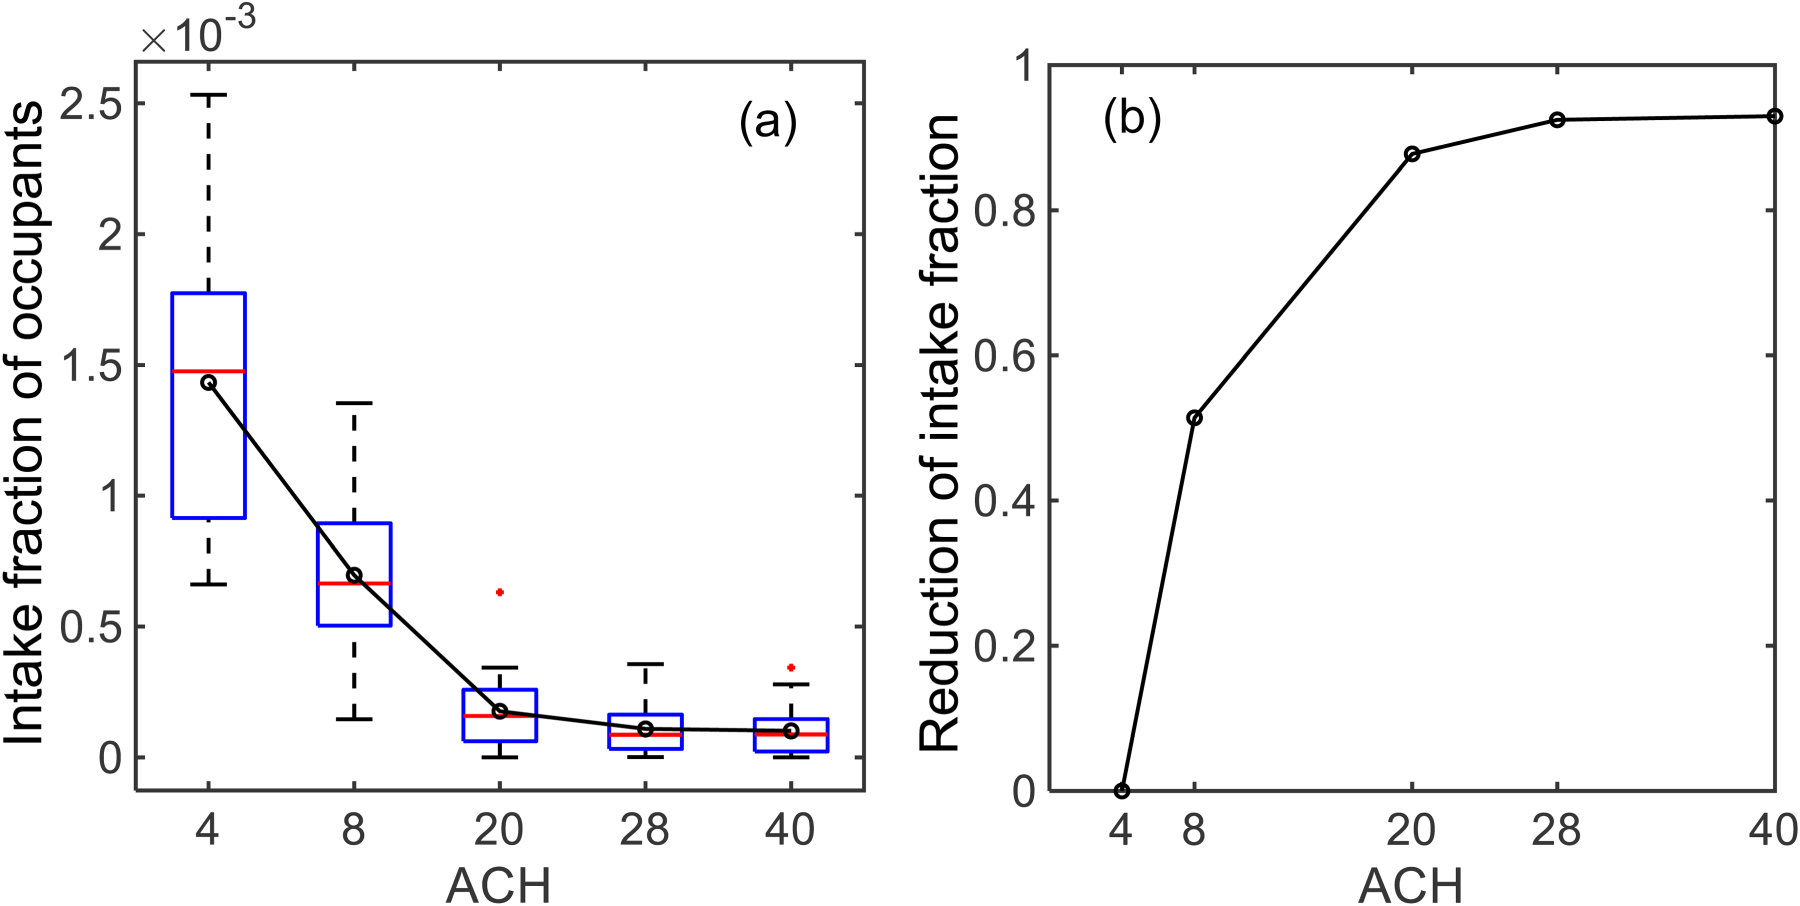
Effect of ACH on the exposure intake fraction of occupants in the office. (a) Intake fractions with increasing ACHs. The data for each ACH contain four geometric setups with and without partitioning. The black circles are the mean values of each ACH. (b) The reduction ratio of intake fraction with increasing ACHs was compared to ACH of 4.
Furthermore, for ACH of 4, the maximum intake fraction in the office was about four times the minimum value. For ACH of 8, the maximum-to-minimum ratio was as high as 9. For higher ACHs, the ratio was even higher. This suggested the significant spatial deviation of human exposure in different areas and geometric setups.
Effect of geometric setup on intake fraction of VOC molecules
The intake fractions under various geometric setups are shown in Figure 12. For the cases with partitions, for all the study ACHs, setup 1 produced the most minor intake fractions, while setup 4 produced the highest intake fraction. For ACHs of 8–40, setups 1 and 3 produced relatively more minor intake fractions, while setups 2 and 4 produced higher intake fractions. For different ACHs, the median value for setup 4 was about 2–3 times that of setup 1, indicating the importance of geometric setups for human exposure.
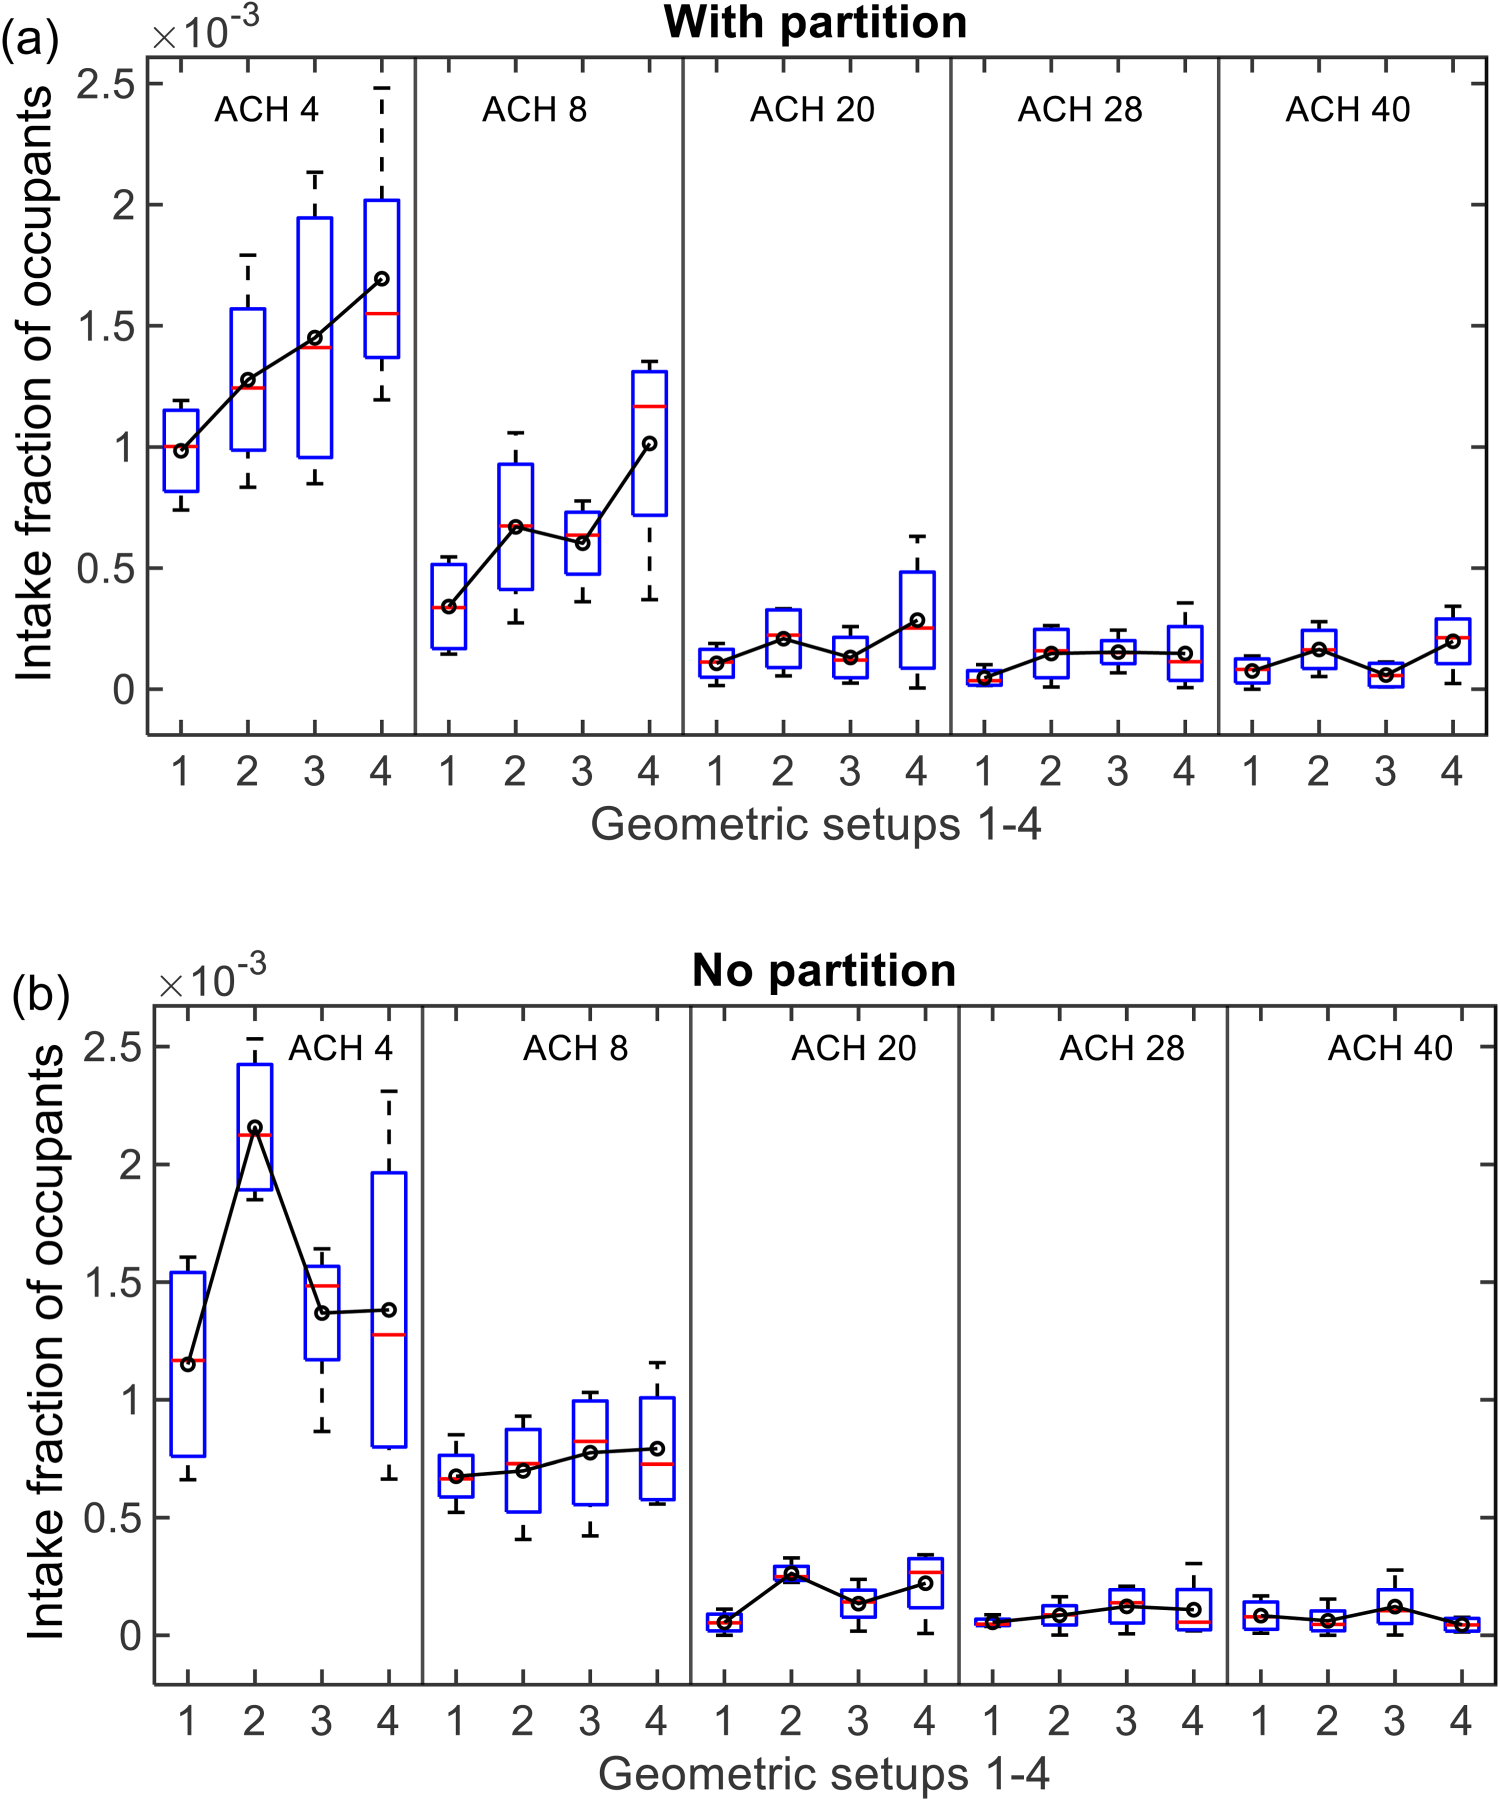
Exposure intake fractions for the four geometric setups 1–4 (a) with partitioning and (b) without partitioning. The black circles are the mean values for each setup.
For the cases without partitions, the geometric setup 1 produced relatively more minor intake fractions than other setups. The differences between the different setups were not significant. The ratio of the medians of the different setups was about 1–2 times. The higher the ACH, the smaller the intake fractions of the different geometric setups.
The effect of the physical partitioning on the exposure intake fractions of VOC molecules
Figure 13 shows the effect of partitioning on the exposure intake fractions in various cases. For setups 1, 2 and 3, for smaller ACHs, the intake fraction for the case without partition was higher than that for the case with partition. For setup 4, the intake fraction for the case without partition was smaller for smaller ACHs. While for higher ACH of 20, 28 and 40, the intake fraction for most cases without partitions was smaller. This was because partitioning can create semi-enclosed areas. For higher ACHs, ventilation can remove VOC molecules more effectively without partitions.
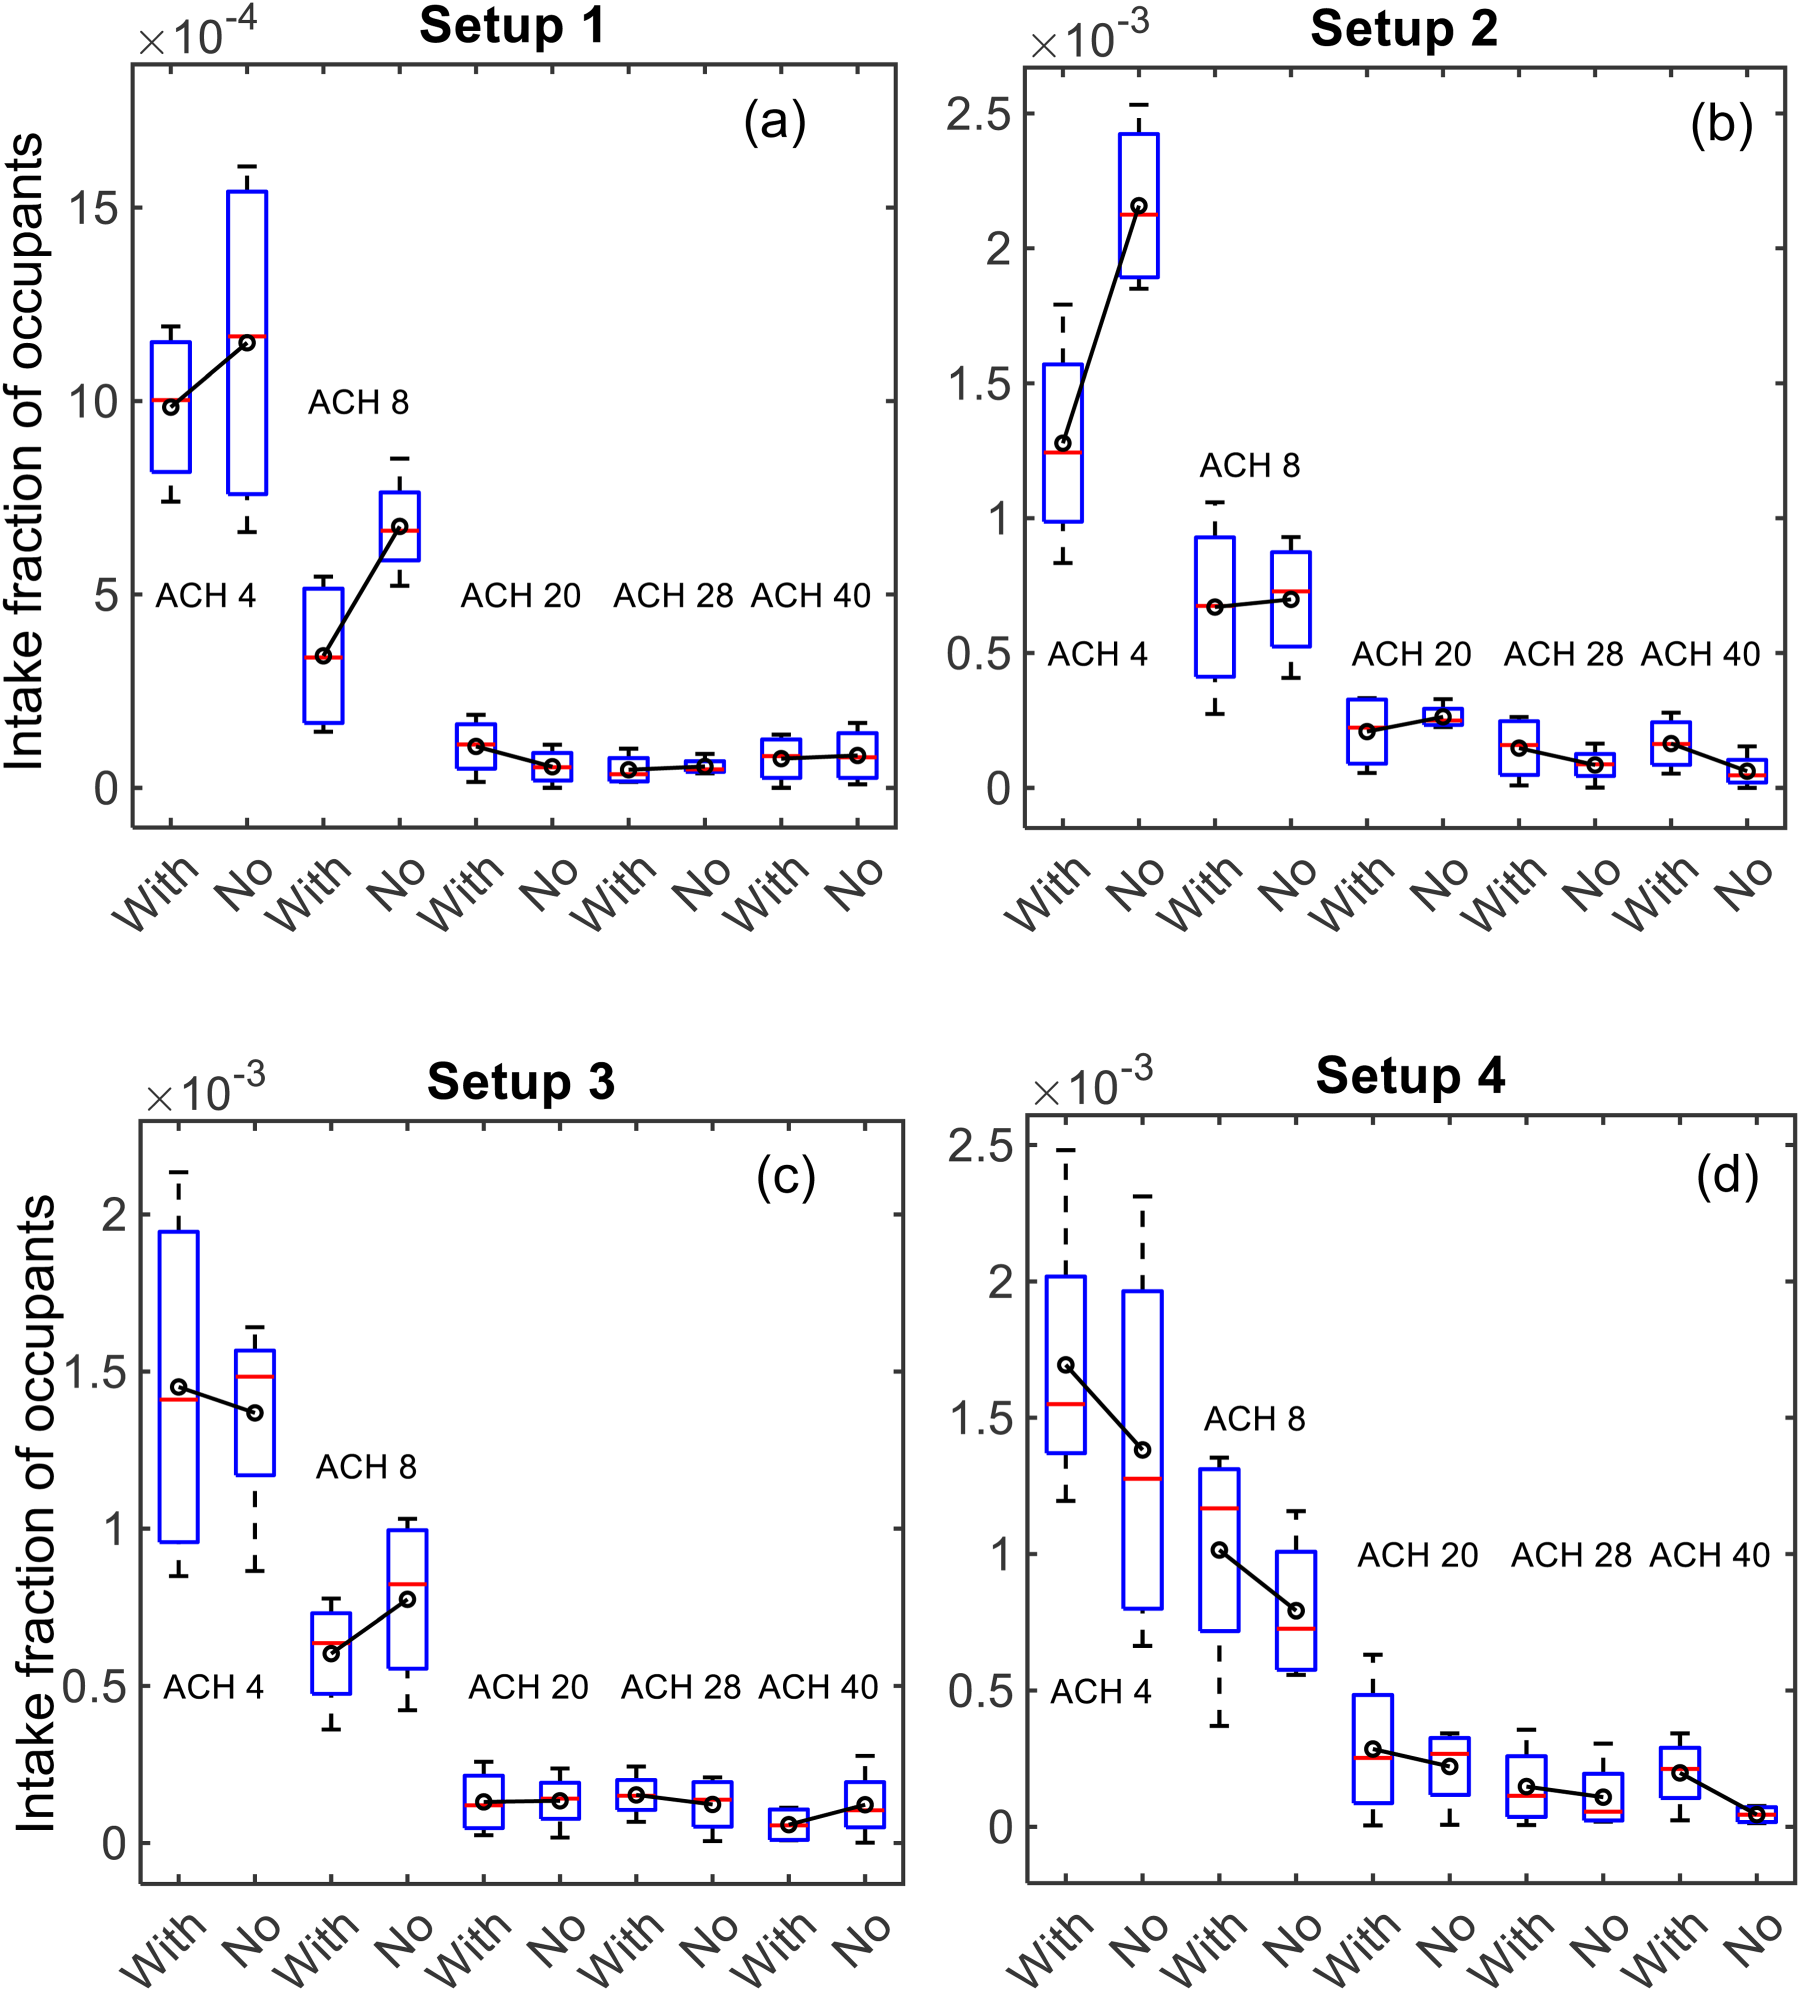
The effect of partitioning on the intake fraction. (a–d) Geometric setups 1–4. The black circles are the mean values of intake fractions. ‘With’ indicated the cases with partitioning. ‘No’ indicated the cases in which no partitioning on the desk.
Lifetime exposure to VOC molecules from each LCD source in the office
The inhaled number and mass doses over a lifetime (30 years) are shown in Figure 14. For ACH of 4, the inhaled number dose over the lifetime was about 8.2 × 10¹⁸. When ACH was increased to 20, the number dose was decreased to about 1.0 × 10¹⁸, and there was no further reduction in dose with further increase in ACH. The corresponding mass exposure during 30 years of office work was in the range of 0.1–1 mg.
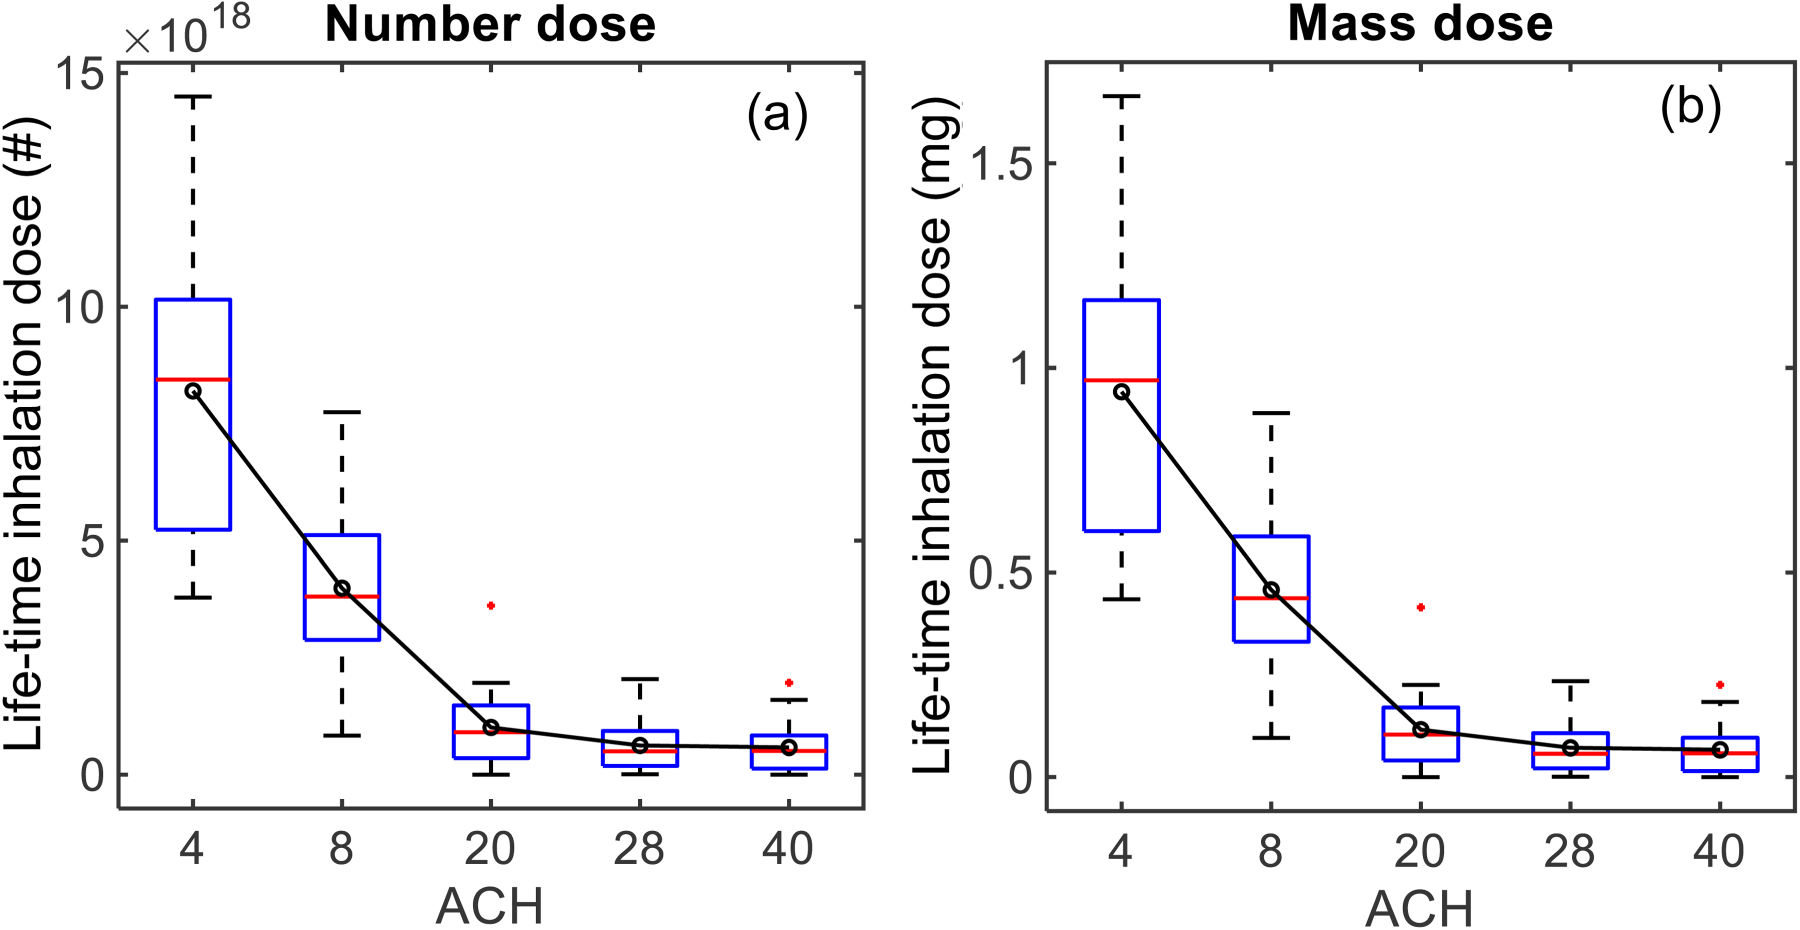
Lifetime exposure dose of human occupants in the office. (a) Number exposure dose and (b) mass exposure dose via inhalation. The black circles are the average values for each ACH.
Discussion
The LCD screens can emit more than 30 types of VOCs with a total emission rate of 8.25 × 10⁹ molecules·s−1·cm−2 at 23°C and 58% relative humidity, i.e. 3.3 µg·h−1·unit screen−1. 20 The dominant VOCs are acetic acid, isoprene, cyclohexene, nonanal and 1,9-nonanediol with emission rates of 0.5 – 3 × 10⁹ molecules·s−1·cm−2. The VOC emission from LCDs is significantly lower than the traditional indoor sources, such as hardboard and wood furniture, with emission of >10 mg·h–1·unit–1 as indicated in previous studies.50,51 However, people spend most of their time indoors and are increasingly exposed to modern LCD screens with a shorter distance than traditional carpet or wood products. The emission of LCD VOCs indoors raises a new concern about the adverse health effects in indoor environments, although the emission rate is lower than that of traditional building sources. The intake fraction and lifetime exposure to the LCD VOCs were investigated in this work.
The results of this work revealed exposure of office occupants to LCD VOC molecules and indicated that exposure was affected by user location, ventilation rate and geometric setup. Lifetime exposure via inhalation was approximately 8.2 × 10¹⁸ molecules. Higher ACH could reduce exposure by approximately 88%, which is about one order of magnitude reduction. Increasing ACH could effectively reduce the exposure, and the optimal ACH was recommended to be 20 to achieve a cost-effective balance. A proper geometric setting design could achieve a 2–3 times reduction compared to a poor setting, including desk location, orientation and partitions. Different locations of office occupants could lead to a 4–9 times deviation in exposure to VOC molecules. The ratio might vary to some extent, considering the instability of ventilation flow rate, which was not considered in this study. The results indicated that enhancing ventilation rate could significantly reduce human exposure to indoor VOCs, but it could also increase energy consumption. A proper geometric setting would achieve a moderate exposure reduction without increasing energy consumption, which requires specific design and consideration of ventilation type.
To evaluate VOC concentrations, the lifetime inhalation exposure of 8.2 × 10¹⁸ molecules or 1 mg per LCD was converted to VOC concentration using a pulmonary rate of 0.84 m3/h, 39 lifetime duration and approximately 2.62 µg/m3 per ppb. 52 After conversion to concentration, the VOC concentration of the inhaled air was equivalent to 5.2 × 10⁻³ ppb, which is much lower than the approximately 5.6 × 10² ppb exposure of LCD industry workers.23–25 However, the above analysis was based on the emission rate of 8.25 × 10⁹ molecules s−1 cm−2 and four desk-based LCD screens at the temperature 23°C and 58% relative humidity in a well-ventilated staff office. Higher temperatures or moisture can enhance the VOC emission rate a few times from different indoor materials.53–55 In addition, the large offices for students or staff may have up to tens of LCD screens and personal electronic devices, which would release much more VOCs than the studied office and could lead to higher lifetime exposure. The exposure would be even higher when the indoor environments are less ventilated than the ASHRAE standard of 2–4 ACH.35,56 Exposure to LCD VOCs should be a new concern in indoor environments.
There are many indoor VOC sources, including furniture, decoration and cleaning products. Exposure to VOCs in indoor environments is of particular concern for health reasons. Considering mixed ventilation in commercial buildings, the intake fractions in this work (i.e. 0.7–2.5 × 10⁻³) can be extended to other indoor VOC sources, such as desks, cabinets and carpets in new offices, together with the corresponding emission rates.57–59 This work only evaluated exposure to a recently discovered source of VOCs from LCD monitors in office environments through computational fluid dynamics simulations. Further studies could simultaneously consider other indoor VOC sources, such as desks, carpets, decorations and cleaning products. Indoor VOC concentrations and exposure could be estimated through numerical simulations and compared with field measurements.
There are some limitations in this study. First, human exposure to VOC molecules can be divided into three categories: ingestion, dermal contact and inhalation.38,60–64 This study mainly focused on the exposure to VOCs via the inhalation. In the future, exposure via ingestion and dermal contact can be added to the numerical modelling. Second, this study did not consider the chemical reaction of VOCs in the office. For offices facing outside, the intense sun radiation may induce photochemical reactions and release new contaminants such as secondary aerosols.65,66 Third, we take a small four-person office as an example for exposure analysis in this work. The exposure may show different features in a much larger office with more LCD monitors, such as student offices and commercial buildings. Finally, this work studied the LCD VOC exposure under mixing ventilation with typical office diffusers. There are different types of ventilation, such as mixing, impingement and displacement. Different ventilation types have various contaminant removal abilities, as indicated by previous studies for airborne particles.67,68 More studies are necessary to fully evaluate VOC exposure in indoor environments.
Conclusion
This is the first study to evaluate the dispersion of LCD VOCs and the lifetime exposure in offices. An experimentally validated numerical simulation was employed to evaluate the ratio of inhaled VOC molecules to LCD emissions. The lifetime exposure to LCD VOCs under various ACHs, geometric settings and partitions was also evaluated. The following conclusions were drawn from this study:
Under various office scenarios with an ACH of 4, the range of intake fractions in the office was 0.7–2.5 × 10⁻³, with a median of 1.5 × 10⁻³, which is within the ASHRAE recommended ACH range of 2–4 for offices. As ACH was increased to 20, the median intake fraction can be linearly reduced to about 0.17 × 10⁻³, with a reduction rate of about 88%. However, the intake fraction can only be slightly reduced when ACH was further increased to 40. When ACH was 4–8, the exposure deviation of occupants in different locations can reach 4–9 times. The higher the ACH, the more obvious the deviation. The intake fraction also depends on the geometric setting and partition. The worst geometric setting was about 2–3 times the proper geometry. Geometric settings 1 and 3 with partitions were recommended for offices. For a normal ACH of 4, the lifetime exposure dose per LCD source was about 8.2 × 10¹⁸ molecules, corresponding to a mass exposure dose of 1 mg in 30 years of office work. The results of this work indicated that exposure to VOCs from LCD screens was well below acceptable levels in the well-ventilated office at 23°C and 58% relative humidity. However, the exposure to LCD VOCs would be higher under warmer and humid conditions because of the enhanced emission. The indoor exposure would be more complicated and should be a new concern, considering the potential chemical reactions with the VOCs from other indoor sources.
This work provides a fundamental understanding of the dispersion and exposure to VOC molecules from LCD in office environments.
Footnotes
Acknowledgements
This research was supported by the Collaborative Research Fund (CRF) Scheme (C5024-21G) of the Research Grants Council of the Hong Kong Special Administrative Region and the RAP Start-up Fund under the Strategic Hiring Scheme (A0043523) of The Hong Kong Polytechnic University.
Author contribution
All authors contributed equally in the preparation of this manuscript.
Declaration of conflicting interests
The authors declared no potential conflicts of interest with respect to the research, authorship, and/or publication of this article.
Declaration of competing interest
The authors have no competing interests to declare that are relevant to the content of this article.
Funding
The authors disclosed receipt of the following financial support for the research, authorship, and/or publication of this article: This work was supported by the Hong Kong Polytechnic University, Research Grants Council, University Grants Committee (grant number A0043523, C5024-21G).