
Abstract
As more complex tunnel projects are being constructed in the mountains of southwestern China, understanding the diffusion phenomenon of carbon monoxide (CO) in high-altitude tunnels is essential. This is particularly critical for tunnels with high ground temperatures during blasting. This study employed field monitoring and computer simulations, focusing on a specific plateau tunnel. A real-time monitoring system was established, using CO as the representative gas. A computational fluid dynamics model was developed and was validated against field data. Results show that forced ventilation could create four distinct flow regions. CO concentration in the tunnel declined during outward diffusion under ventilation. Specifically, the CO concentration was increased by a factor of 1.83 with the increase in the altitude from 0 to 5000 m. Furthermore, with ground temperature rising from 300 to 320 K, the propagation speed of the CO concentration peak accelerated, arriving at the tunnel exit section 53 s earlier, and its magnitude was decreased by 224 ppm. Finally, a functional relationship was established between CO concentration, ventilation time, distance, temperature and altitude. This study provides a valuable reference for safety assurance and informs ventilation design for tunnel construction in relation to CO diffusion in such tunnels.
Keywords
Introduction
Due to the rapid economic development, the number of railway tunnel projects in China has grown significantly. Statistical data show that, by 2024, operational tunnels had surpassed 18,997 units, with a total length exceeding 24,246 km, as illustrated in Figure 1. 1 Drilling and blasting remains the most widely used method for mountain tunnel excavation, due to its cost-effectiveness and operational flexibility. 2 Studies have shown that blasting-generated fumes contain harmful gases such as carbon monoxide (CO) and NOx. 3 These hazardous substances bind with haemoglobin in human blood, inducing oxygen deprivation and critically endangering construction workers’ health.4,5
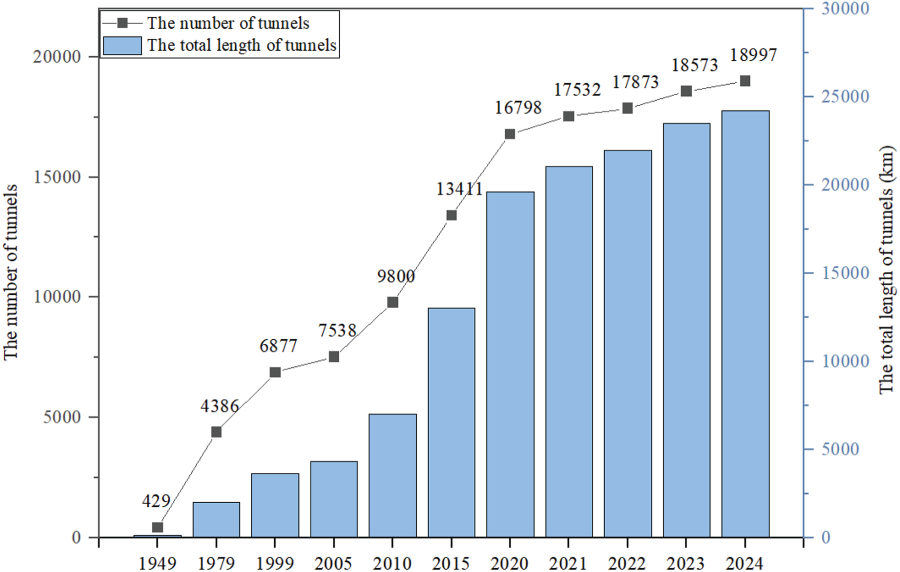
China's tunnel quantities and lengths over the years.
Ventilation is the primary method for removing harmful gases. Currently, there are five types of ventilation systems: natural ventilation, 6 forced ventilation,7,8 gallery ventilation, 9 air cabin ventilation 10 and hybrid ventilation. 11 The design of ventilation methods depends on the migration behaviour of harmful gases; therefore, scholars have conducted extensive research on the diffusion behaviour of harmful gases in tunnels.12,13 Based on on-site measurements, Xie et al. 14 revealed the attenuation of CO in the blasting fumes within the subway tunnel. Bai et al. 15 utilizing fluent-based numerical simulation, simulated the diffusion of harmful gases in spiral tunnels and optimized ventilation methods. Torno et al. 16 developed mathematical models of gas dilution under ventilation conditions, which were validated through experimental programs. Chang et al. 17 used numerical calculations to derive a functional expression for CO distribution and parameters such as air duct position. Song et al. 18 conducted a numerical study on CO diffusion from vehicle emissions in curved tunnels, investigating the influence of tunnel radius and jet fan tilt angle, and results showed an inverse relationship between CO concentration and both tunnel radius and the tilt angle of jet fans.
The number of high-altitude, high-ground-temperature tunnels in the plateau regions of southwestern China has increased rapidly. However, high-altitude tunnels generally face high-ground-temperature challenges. 19 Existing studies have shown that the hypoxic environment in high-altitude areas exacerbates the harm of harmful gases to workers, while high-temperature environments accelerate gas diffusion and alter diffusion patterns.20,21 Researchers have conducted partial investigations into high-altitude and high-ground-temperature tunnels.22–24 Guo et al. 25 corrected the reduction rate of benchmark vehicle pollutant emissions in current specifications using on-site measurements, increasing the annual reduction rate of CO emissions in high-altitude scenarios from 2% to 2.5%. Huang et al. 26 studied a high-altitude mine tunnel and applied a statistical approach to determine the relationships between altitude, duct air supply rate, explosive dosage and peak CO concentration. Chen et al. 27 adopted an integrated approach combining numerical simulations and empirical observations to study dust and CO dispersion in high-altitude tunnel environments. Li et al. 28 investigated the variation pattern of the average oxygen mass fraction at different altitudes via experiments and numerical simulations. Their study revealed a nonlinear relationship between the average oxygen mass fraction and altitude, providing a critical basis for optimizing oxygen supply methods in high-altitude tunnels. Tan et al. 29 employed computational fluid dynamics (CFD) simulations to investigate the oxygen diffusion law in plateau tunnels under forced ventilation, ultimately proposing an optimal oxygen supply method. However, these researchers do not incorporate the thermal buoyancy effect induced by high ground temperatures, limiting their ability to reflect gas diffusion behaviour in actual complex tunnel environments.
High-ground-temperature tunnels have been studied extensively across several aspects. Zhou 30 studied the factors influencing thermal fields. Zhao et al. 31 developed a numerical model, while Wang et al. 32 explored temperature variations in tunnel structures during construction. Song et al. 33 calculated the temperature field distribution, and Han et al. 34 studied the effect of temperature on the tunnel ventilation flow field. However, few researchers have explored the quantitative impact of temperature gradients on the turbulent dispersion of harmful gases.
Current research shows insufficient investigation into the altitude-specific diffusion law of harmful gases in tunnel environments. Moreover, studies on gaseous pollutant dispersion patterns in high-ground-temperature tunnels remain limited, with particularly limited attention to the coupled effects of high altitude and geothermal conditions on contaminant diffusion laws. Establishing these diffusion laws is a critical research priority for optimizing ventilation systems and ensuring occupational safety under such extreme engineering conditions.
This study comprehensively investigated harmful gases and their hazards in highway, railway and subway tunnels in China and other countries. Focusing on a specific high-altitude, high-ground-temperature tunnel in the southwest region, this study investigated the diffusion behaviour of CO after blasting in such tunnels using numerical simulation. Subsequently, a mathematical representation of CO concentration under forced ventilation was formulated. The results of this research provide valuable insights for evaluating environmental safety parameters of high-altitude and high-ground-temperature tunnels.
Field study
Categories of harmful gases in tunnels
During tunnel construction, various harmful gases are emitted, exhibiting different properties and hazardous concentrations in the human body. Therefore, identifying common harmful gases in tunnels and defining their limit standards is essential. This section categorizes the sources of harmful gases into those resulting from construction techniques and geological gestation. Based on this classification, this study statistically analysed harmful gases generated in tunnels and their causes. The proportions of harmful gases are shown in Figure 2, revealing that the primary harmful gases in tunnels are carbon dioxide (CO2), methane (CH4), CO and hydrogen sulphide (H2S). Considering the specific conditions of the tunnel in this study, these gases will be the focus of the subsequent research.
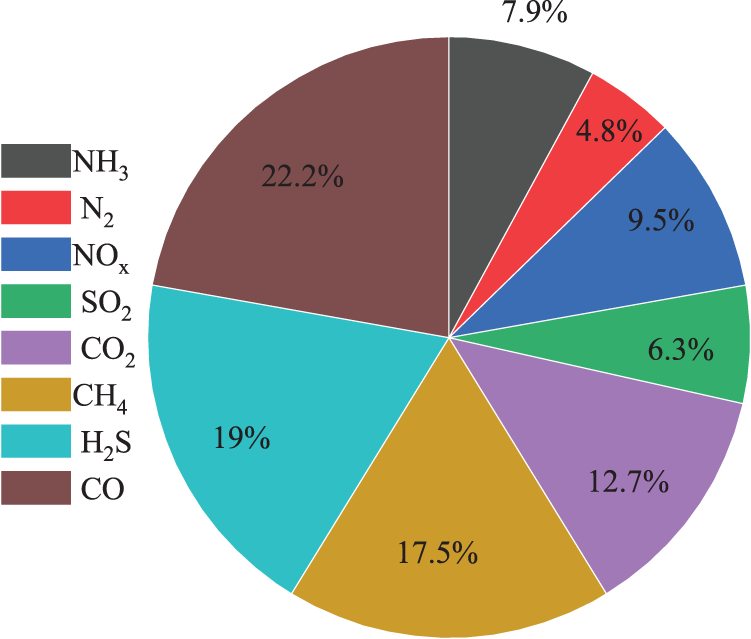
Proportion of harmful gases in tunnels.
The stipulated exposure limits for harmful substances, such as CO and CO2, in the construction operation environments of various industries in China are consistent, as shown in Table 1. Through a cross-comparison of relevant specifications, this study formulated permissible concentrations for the four hazardous gases. These values serve as the key basis for assessing whether in-tunnel gas levels exceed mandated safety thresholds.
The regulations on gas limits are in different Chinese specifications.
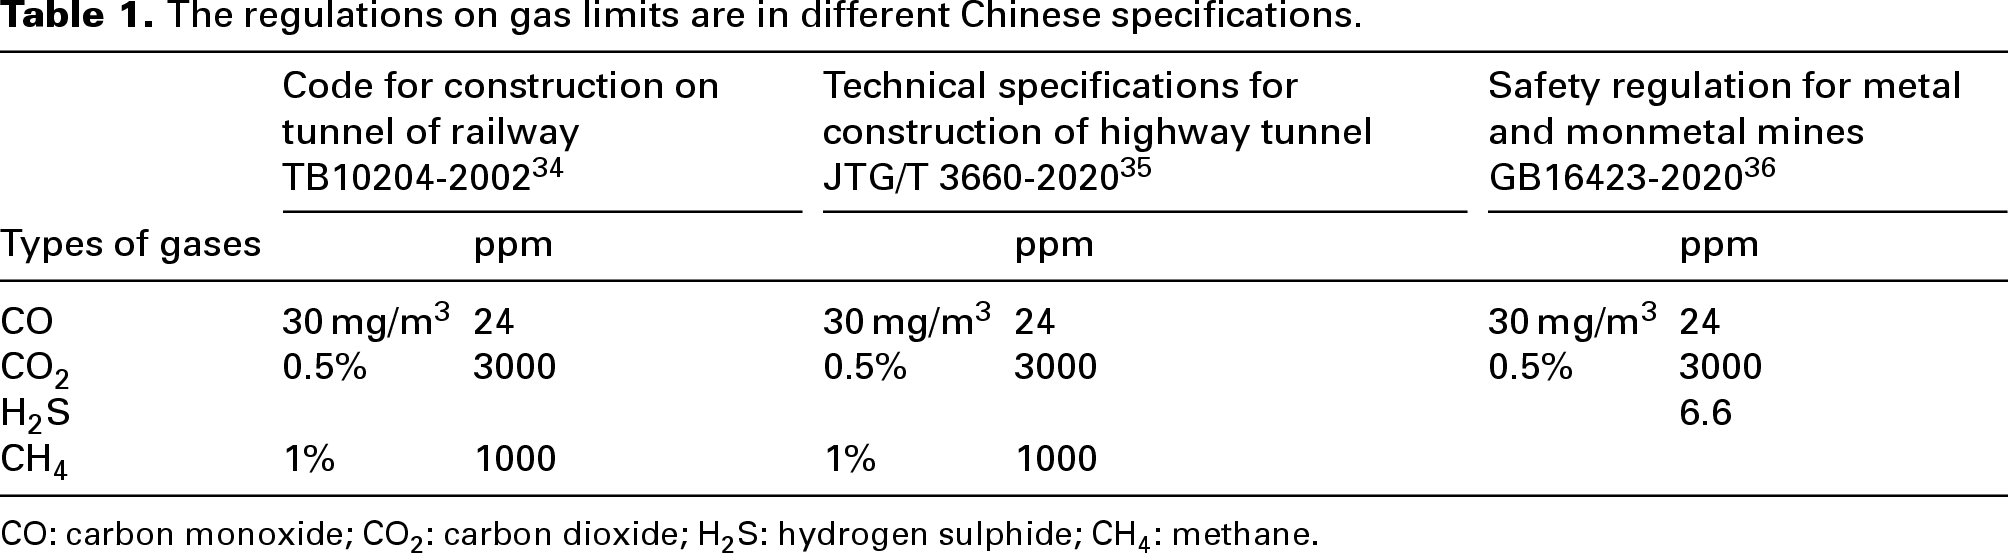
CO: carbon monoxide; CO2: carbon dioxide; H2S: hydrogen sulphide; CH4: methane.
This study focused on a tunnel construction project in the southwestern plateau region of China, with an atmospheric pressure of ∼74 kPa. The tunnel's maximum buried depth and average altitude are 1506 and 2500 m, respectively, and its on-site measured ground temperature is 300 K. The excavation primarily adopted the drilling and blasting method, supplemented by forced ventilation via an air duct (1.2 m in diameter) installed 40 m from the active tunnel face. The tunnel was designed with a horseshoe-shaped cross-section, as shown in Figure 3, featuring an 8 m width and an 8.5 m vertical and a modelled section of 200 m.
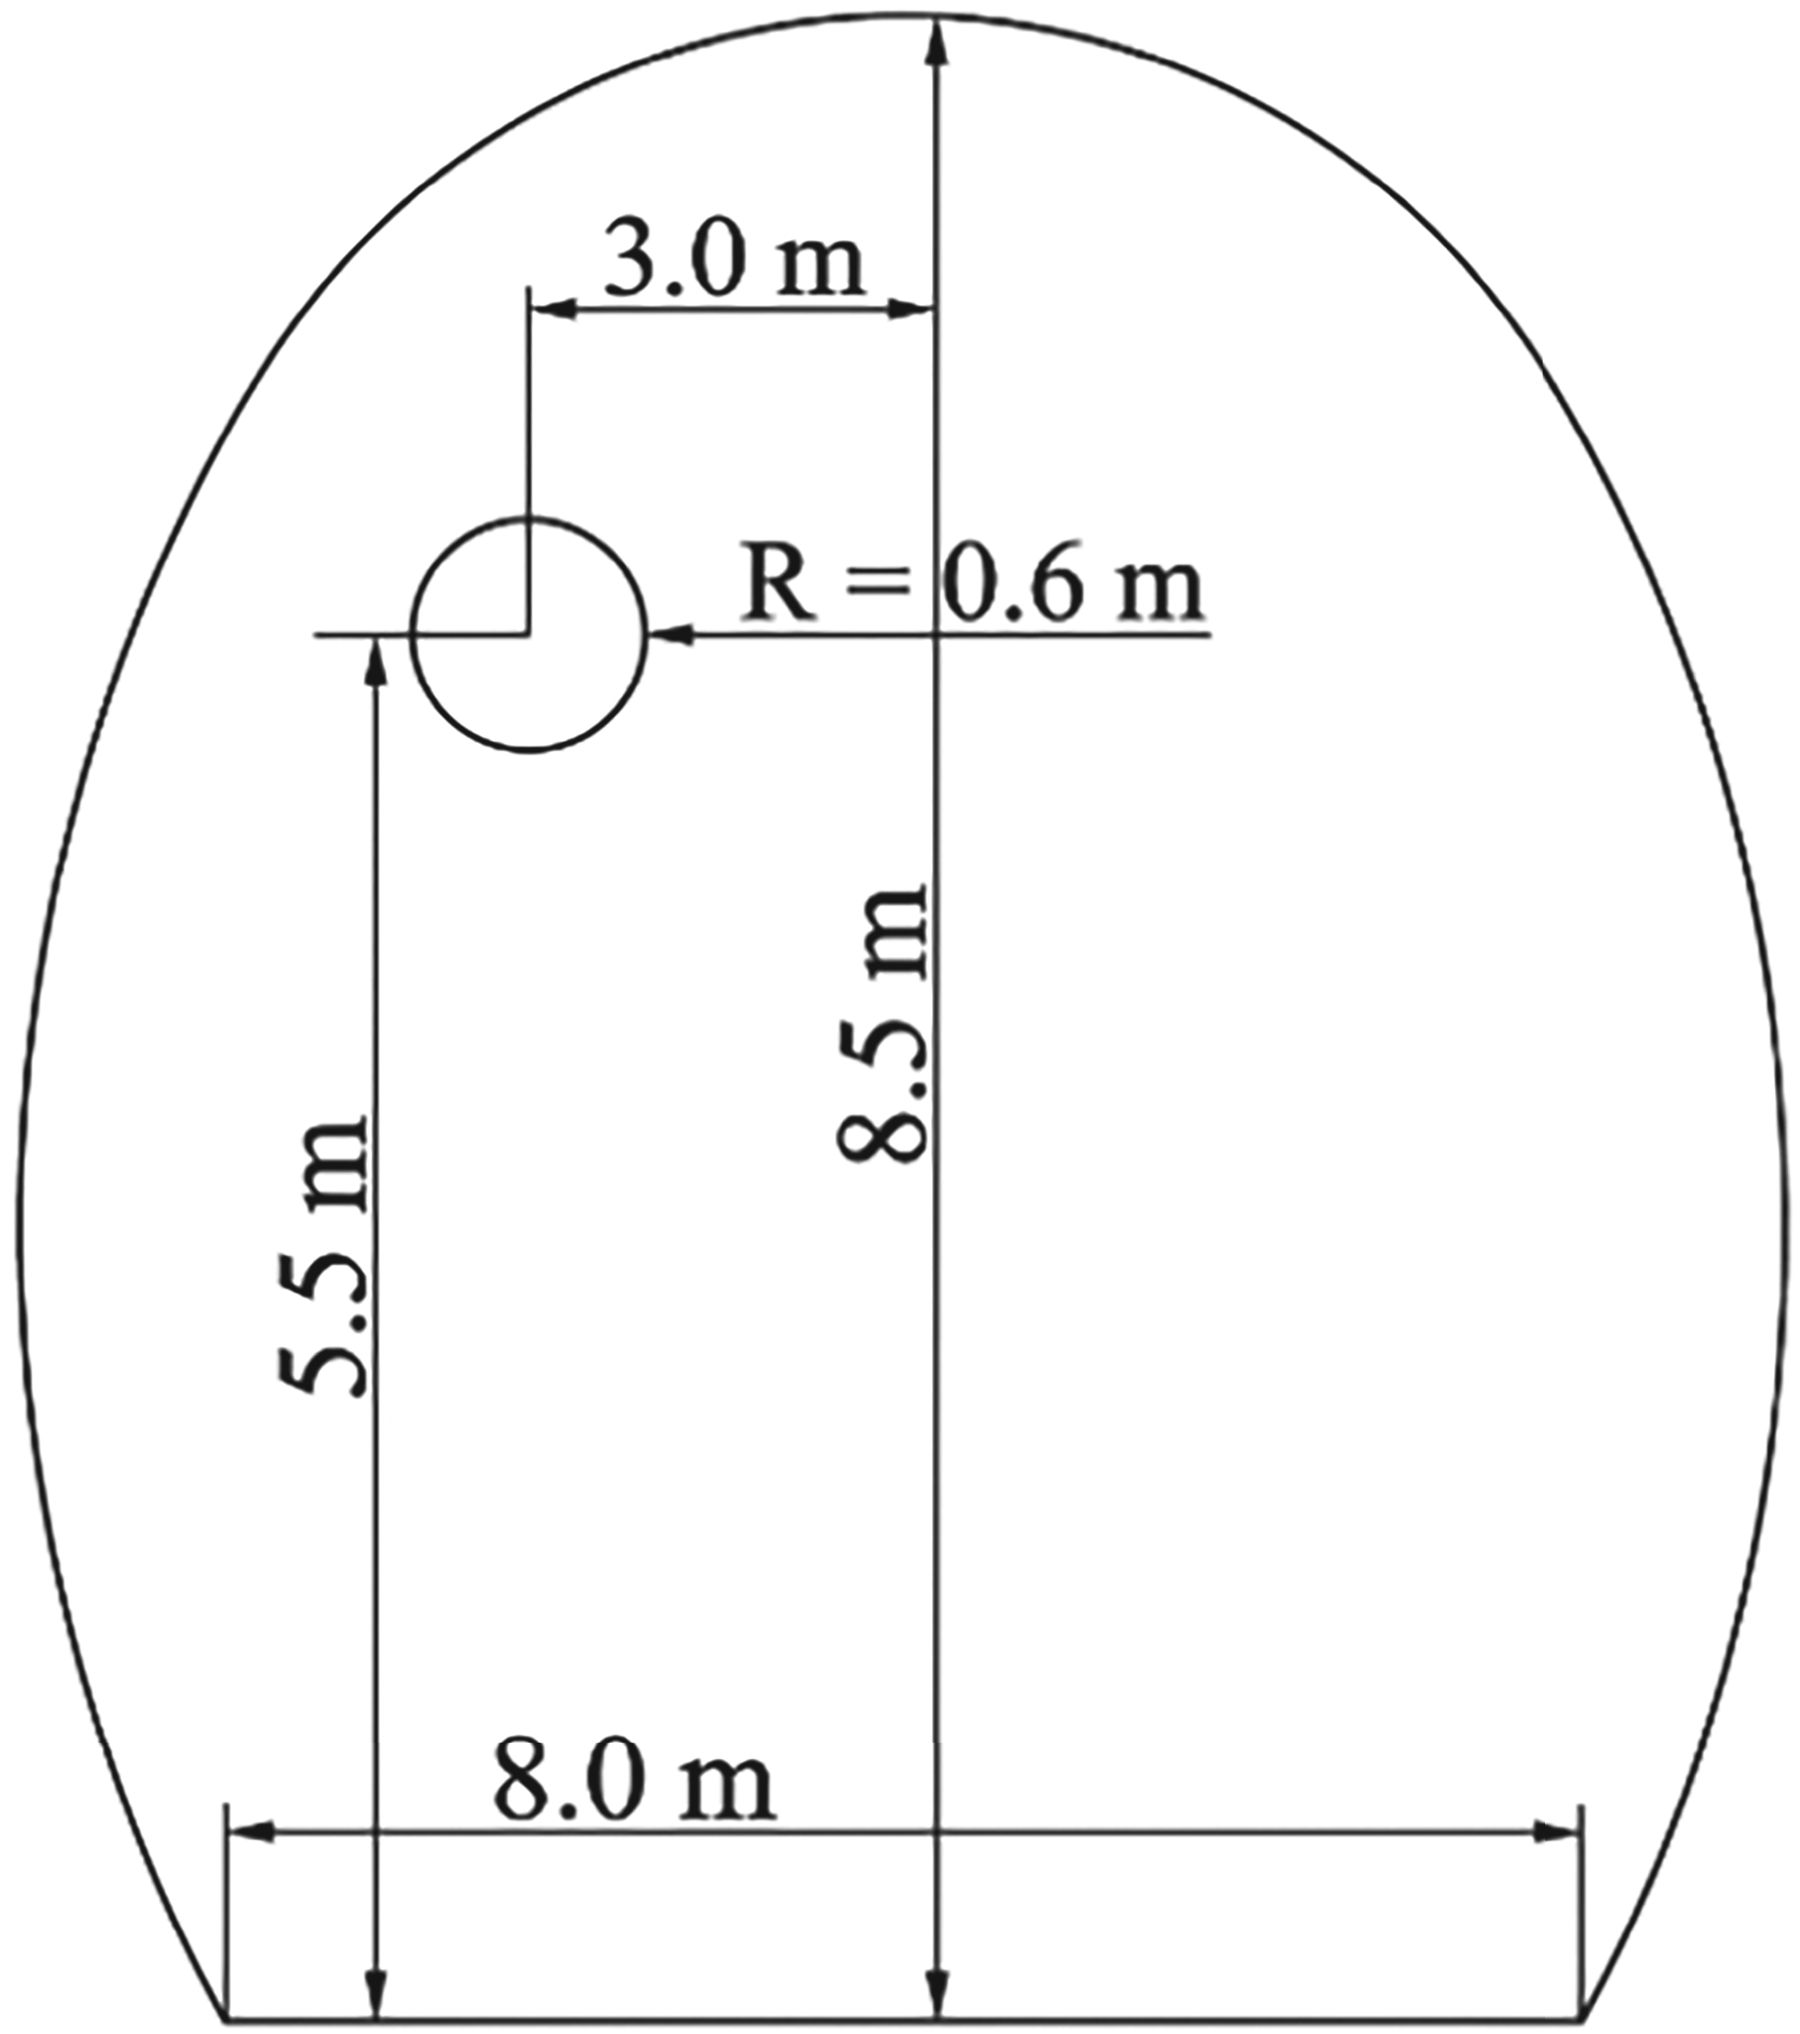
Tunnel profile.
Harmful gas monitoring system.
Monitoring scheme and site
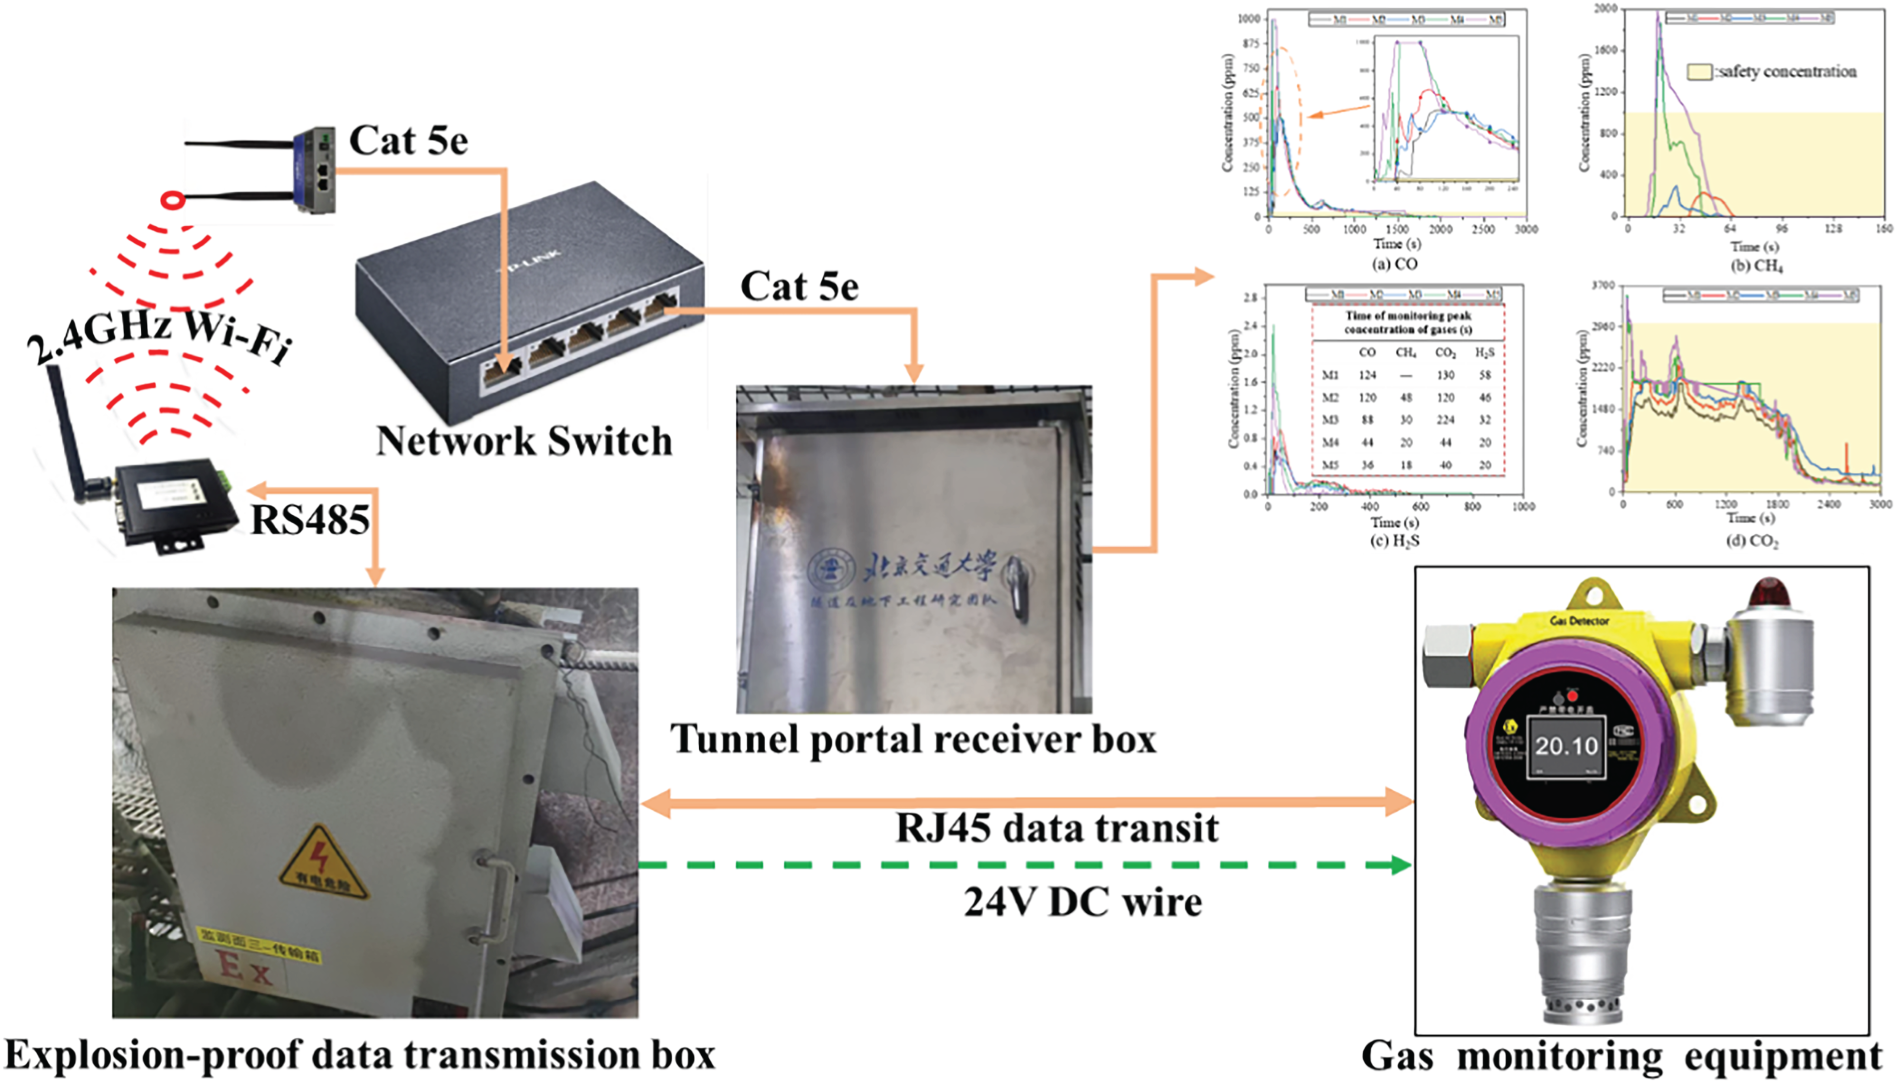
In this study, a monitoring and identification system was designed to conduct real-time monitoring of harmful gases after tunnel blasting, tracking changes in their concentrations over time. The system configuration is illustrated in Figure 4. The harmful gas identification equipment, which serves as the core component of the system, can detect H2S, CH4, CO and CO2. The sensor models and their detection ranges are listed in Table 2.
As illustrated in Figure 5, the monitoring system requires a real-time power supply. In this study, considering the density variations of the monitored gases and their distribution at different heights within the tunnel, monitoring instruments were installed on the upper and lower levels of a tunnel-lined platform car, an inverted arch trestle and critically, on the upper and lower levels of the dredging car to maintain a constant relative distance to the working face.
Field results
The system provides data on the concentrations of harmful gases at each monitoring point following detonation, as shown in Figure 6.
Specification of the harmful gas monitoring equipment.
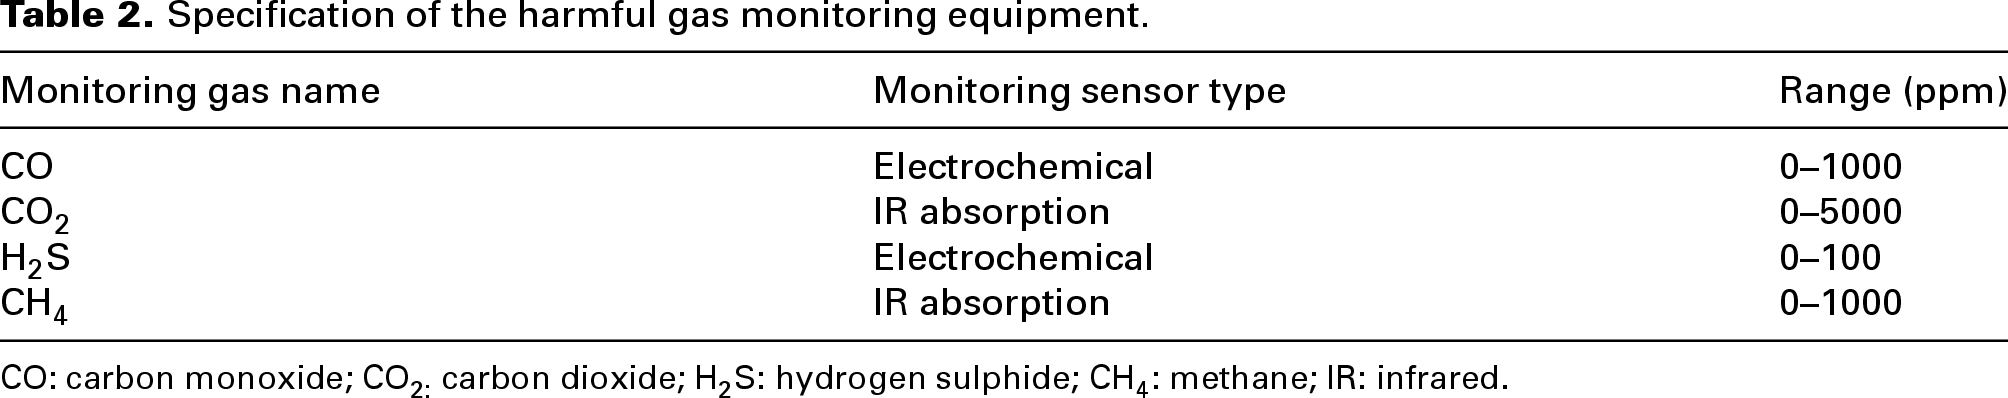
CO: carbon monoxide; CO2: carbon dioxide; H2S: hydrogen sulphide; CH4: methane; IR: infrared.
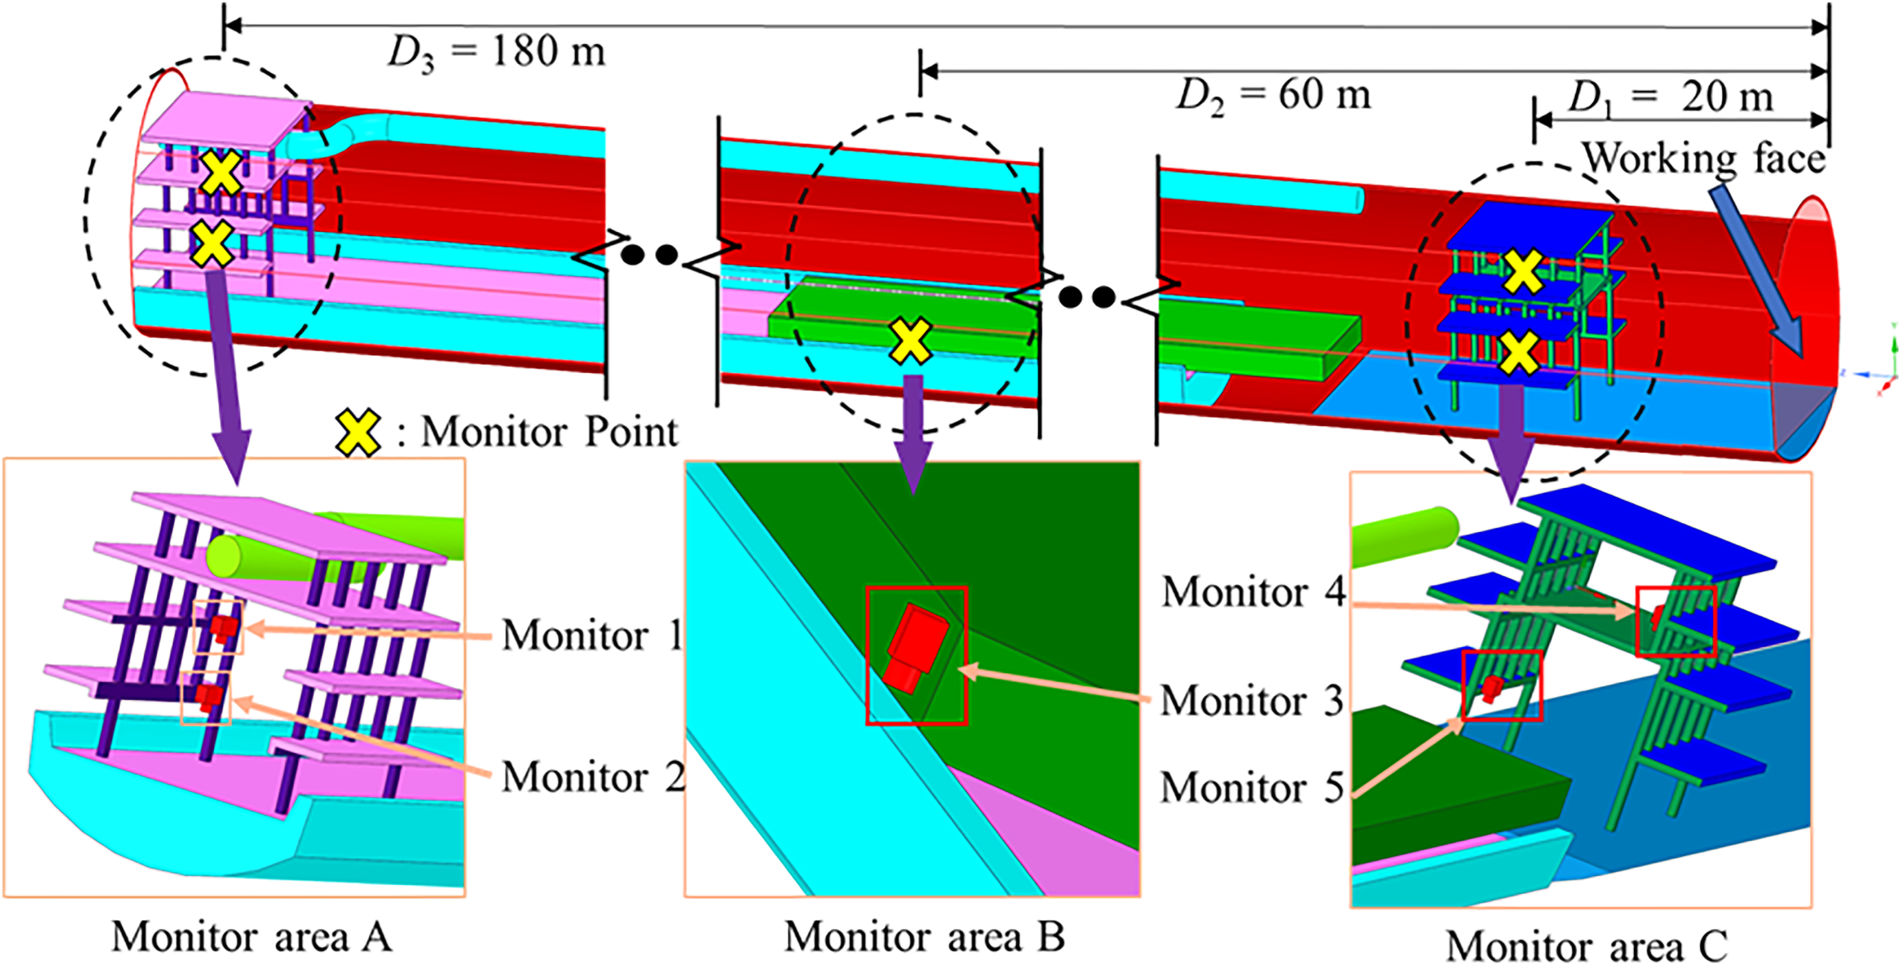
The tunnel harmful gas monitoring system layout.
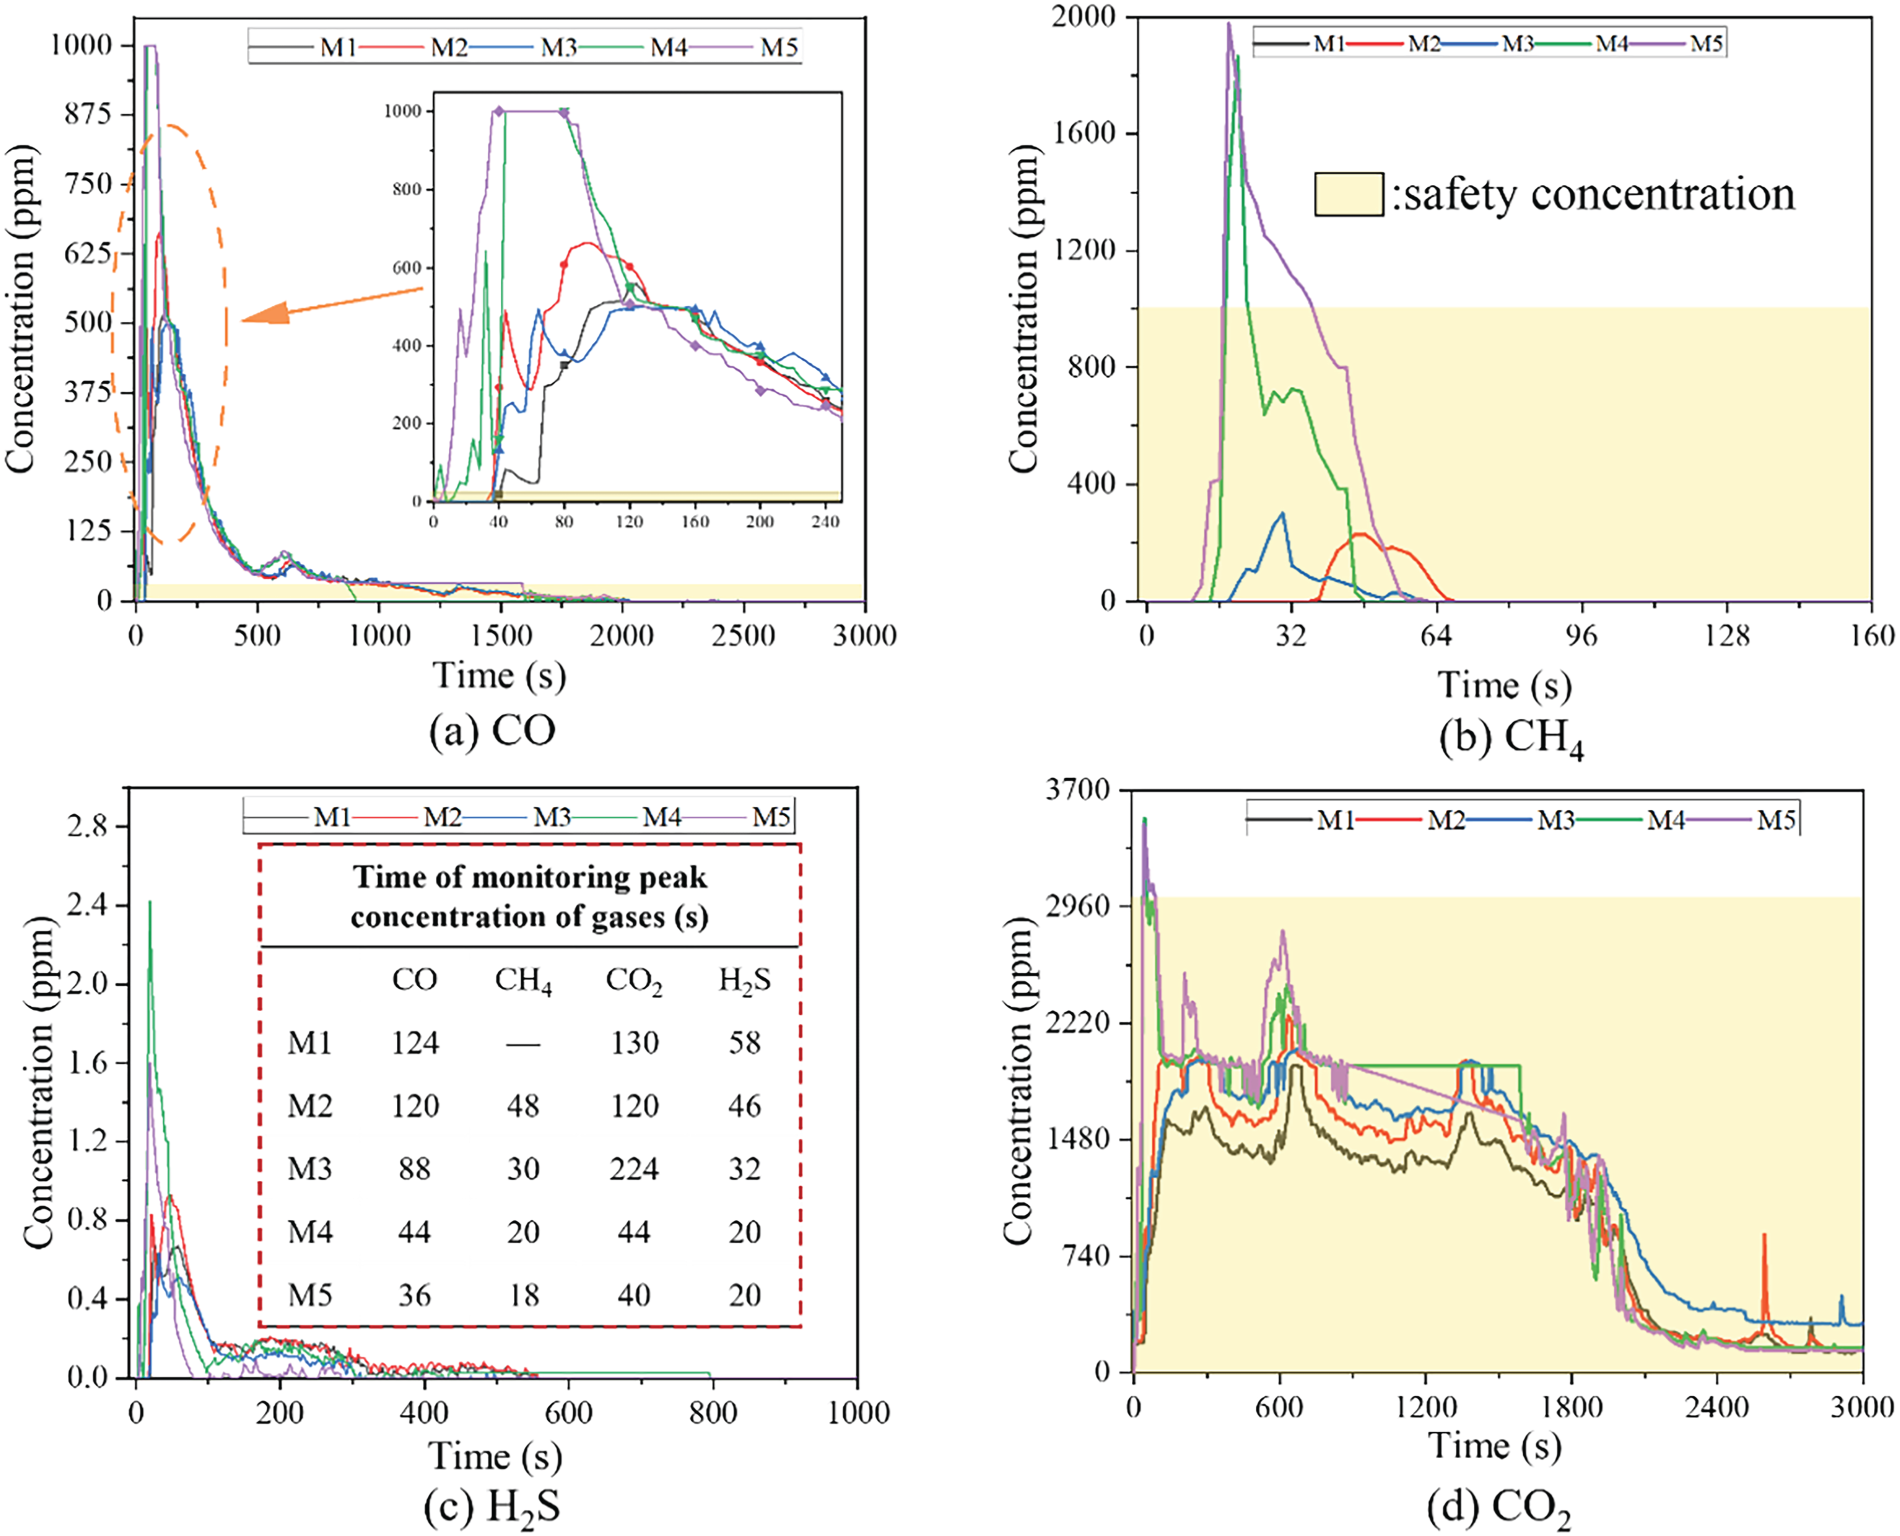
Harmful gas concentrations over time.
For CO, as blasting at the working face resulted in the release of gases, M4 (Monitor 4) and M5 (Monitor 5), located near the working face front, detected CO first. Between 36 and 44 seconds (s) after blasting, M4 and M5 recorded peak CO concentrations reaching 1000 ppm. Subsequently, M3 (Monitor 3) detected 655 ppm CO at 88 s post-blasting, while M1 (Monitor 1) and M2 (Monitor 2) detected 550 and 500 ppm CO at ∼120 s post-blasting, respectively. The CO concentration then decreased rapidly; after 1600 s post-blasting, the CO concentration at each monitor dropped to the mandated safety limit and remained stable.
For CH4, M4 and M5 recorded concentrations of nearly 2000 ppm at ∼20 s post-blasting. The peak concentrations of CH4 detected by M3 and M2 were 300 ppm (at 30 s post-blasting) and 228 ppm (at 48 s post-blasting), respectively. CH4 exceeded the standard for only 18 s during the monitoring period, then remained stable without further increase after the concentration decreased.
For H2S, M4 and M5 detected concentrations of 2.4 and 1.6 ppm at 20 s post-blasting, while M3, M2 and M1 detected 0.63, 0.93 and 0.67 ppm H2S, respectively, between 32 and 58 s post-blasting. After 360 s, no H2S was detected by any monitor. H2S concentrations remained well below the stipulated safety limits.
For CO2, after the blast, the gas concentration increased from an initial 190 ppm. M4 and M5 recorded a peak concentration of 3500 ppm at ∼40 s post-blasting, followed by a rapid decrease. The duration during which the CO2 concentration exceeded the mandated safety limit was 60 s. M3, M2 and M1 detected large amounts of CO2 at 224, 120 and 130 s, respectively. The overall movement of CO2 showed an oscillating decrease in concentration. At ∼600 s post-blasting, each monitor recorded a secondary peak of CO2. This was due to the outward movement of harmful gases in the tunnel in the form of eddies and the differences in CO2 concentration between the edge and core of the eddy. At ∼2400 s, the CO2 concentration stabilized. At 3600 s, during the mucking stage, the entry of mechanical equipment into the tunnel face caused a short-term increase in CO2 concentration. Throughout its generation and movement, the CO2 concentration remained mostly below the specified limit, indicating that CO2 had a weak impact on the tunnel construction environment.
Amongst the four monitored gases, H2S concentrations were far below the mandated safety limit, CO had a longer diffusion time than CH4 and exhibited more consistent diffusion regularity than CO2. Therefore, CO was selected as the representative gas to study the diffusion behaviour of harmful gases under different altitudes and ground temperatures.
Numerical calculation
Mathematical model
With the development of CFD, the accuracy of numerical methods for studying gas diffusion behaviours has significantly improved.
37
This study employed CFD methodology to construct a tunnel simulation model for examining gas diffusion behaviour. The model was based on three fundamental assumptions, which were derived from actual tunnel conditions: The harmful gases were represented as three-dimensional viscous incompressible fluids under idealized conditions. The treatment of the tunnel airflow employed a continuum medium. The physical parameters, such as gas density and viscosity, were treated as constants.
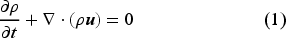
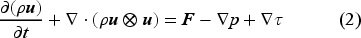
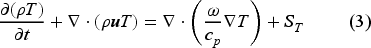
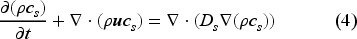
The equations of motion of a fluid in a flow field follow the three fundamental conservation equations of physics: continuity, momentum conservation and energy conservation. Because the dilution and diffusion of CO in a tunnel are non-stationary processes, the component transportation equations must be satisfied in the solution process. There are four equations, equations (1) to (4), for the transportation of hazardous gases in tunnels.
38
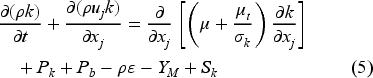
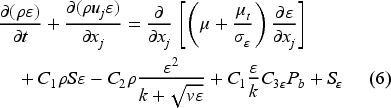
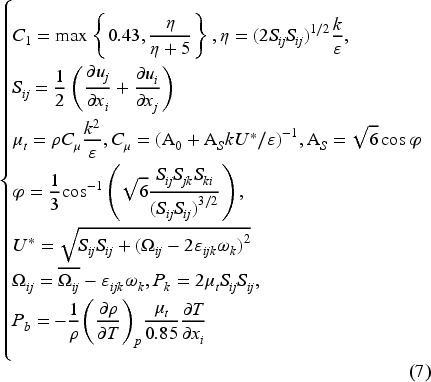
The realizable k-ɛ model represents a significant advancement in turbulence modelling compared to the standard and RNG k-ɛ models. Its innovative formulation features a revised turbulent viscosity calculation and an ɛ equation derived from the exact transport equation for vortex fluctuation dynamics. This model could better simulate rotating flow, flow separation and complex quadratic flow, and more accurately predicts the dispersion ratio of the jet in tunnel ducts. Equations (5) to (7) for the realizable k-ɛ model's turbulent kinetic energy and turbulent dissipation rate are as follows
39
:
Calculation of gas parameters
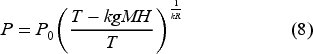
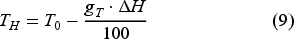
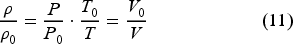
Altitude and ground temperature are critical tunnel environmental parameters. Changes in these parameters induce changes in air pressure, gas density and air temperature. Tunnel ventilation and post-blasting CO diffusion involve airflow problems within a confined space, primarily determined by gas density and air pressure. These physical quantities obey the following principles as illustrated in equations (8) to (11) (Table 3)
40
:
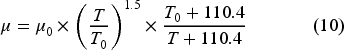
Information about the harmful gas monitoring equipment.
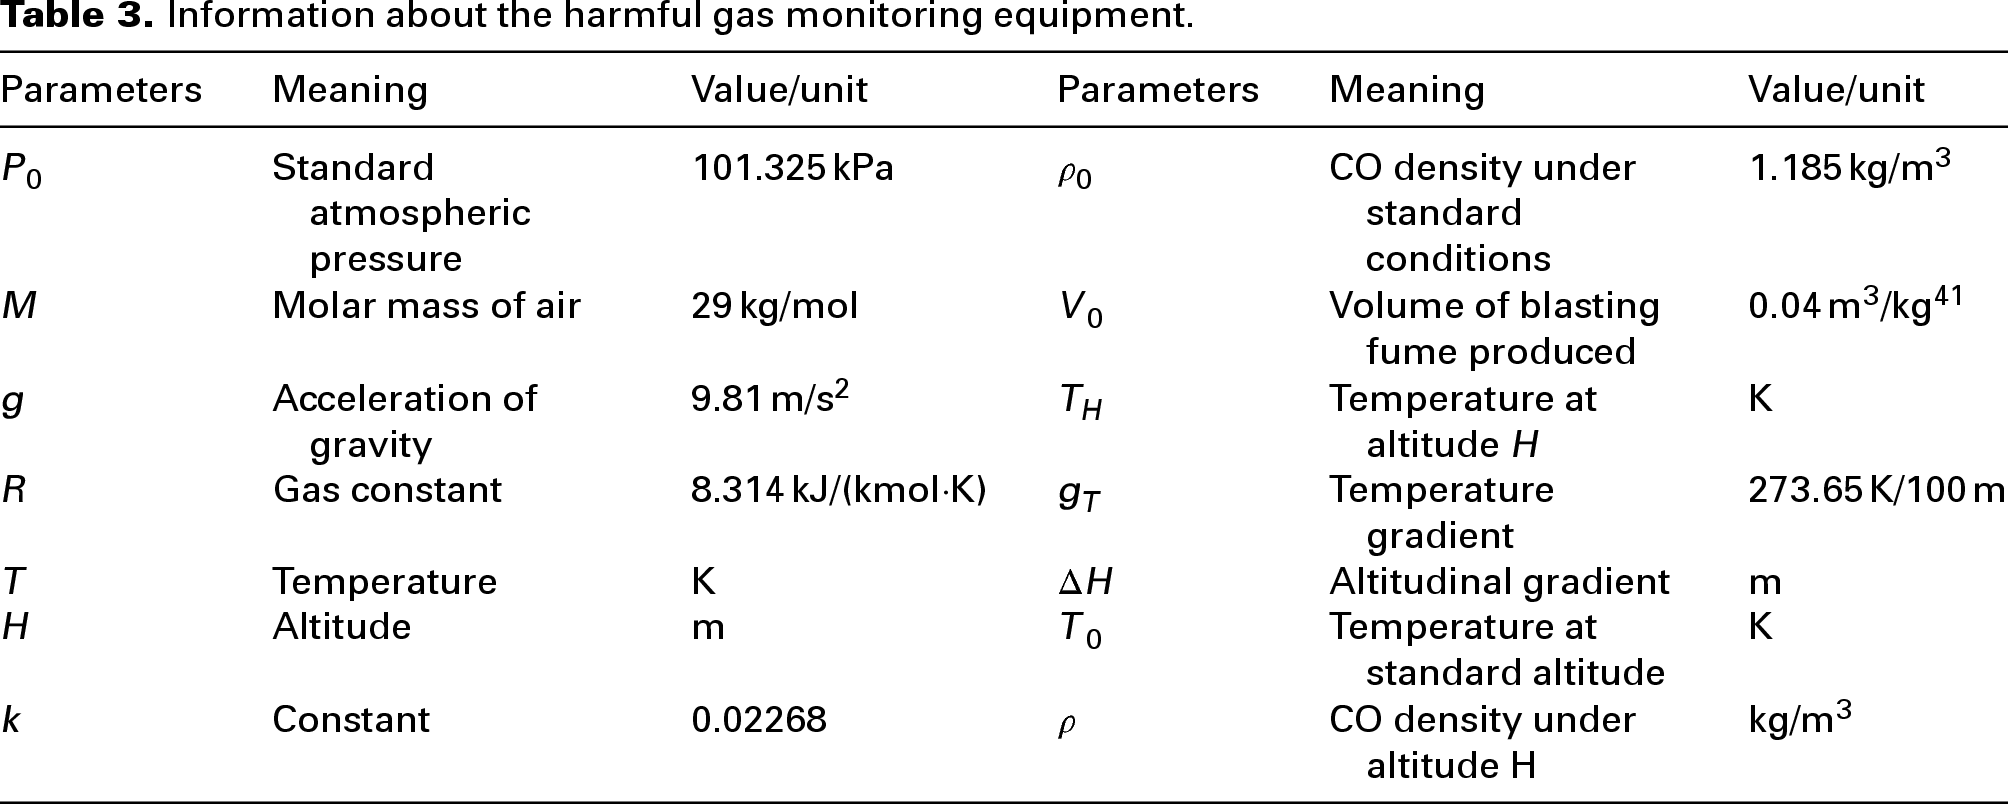
As shown in equation (11), the volume of CO generated increases with the rise in altitude and temperature after blasting with the same mass of explosives. Although the mass of CO generated per unit space remains unchanged, the mass fraction of CO increases. To compare changes in the mass concentration of CO at different altitudes, the mass concentration of CO at each altitude was converted into an equivalent mass concentration at a standard altitude. The conversion formula is as equation (12), and the equivalent concentration of CO is presented in Figure 7.
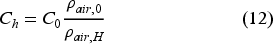
Equivalent concentration of carbon monoxide (CO) per unit volume.
Through the application of equations (8) to (12), the altitude-dependent variation patterns of gas parameters were determined. The analysis demonstrated a 45.4% reduction in air density accompanied by an 82.5% expansion in CO generation per kilogram of explosive material across the 0–5000 m elevation range.
Model building and validation
Numerical model
A numerical model was constructed according to the actual tunnel engineering conditions. Due to the complexity of replicating all tunnel environment details, a 1:1 simplified model of the tunnel was developed using space claims to meet the research objectives, as shown in Figure 8.
Numerical modelling of tunnel.
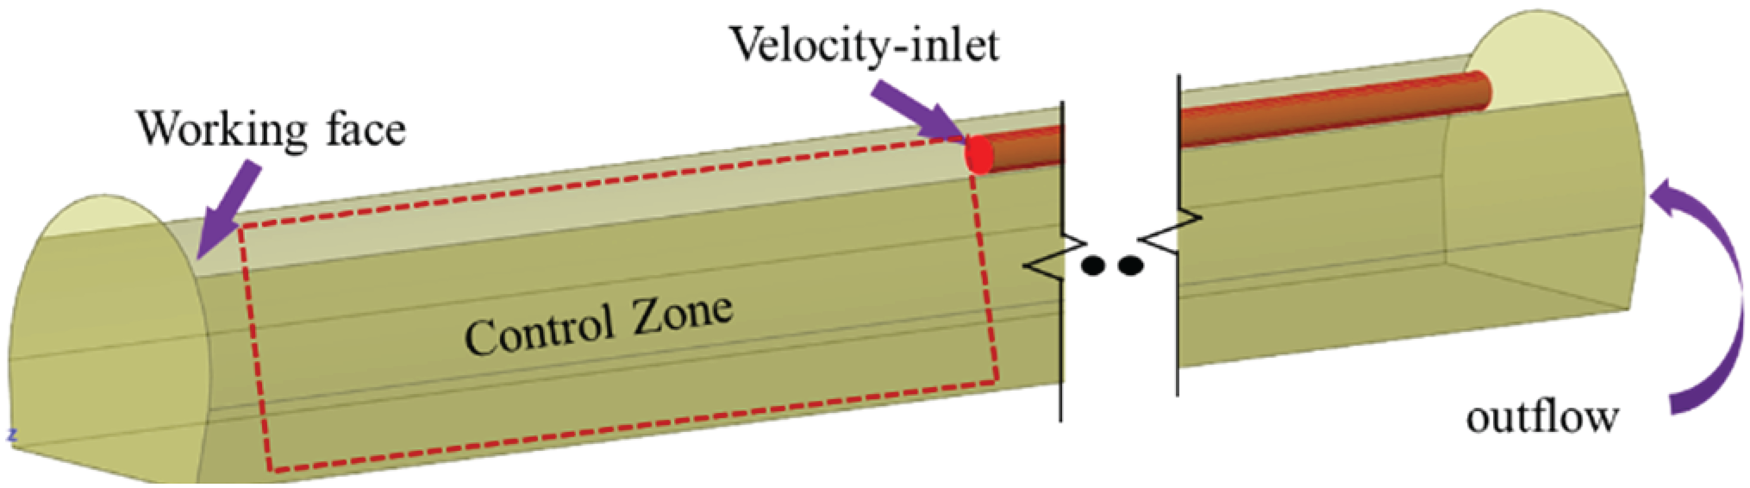
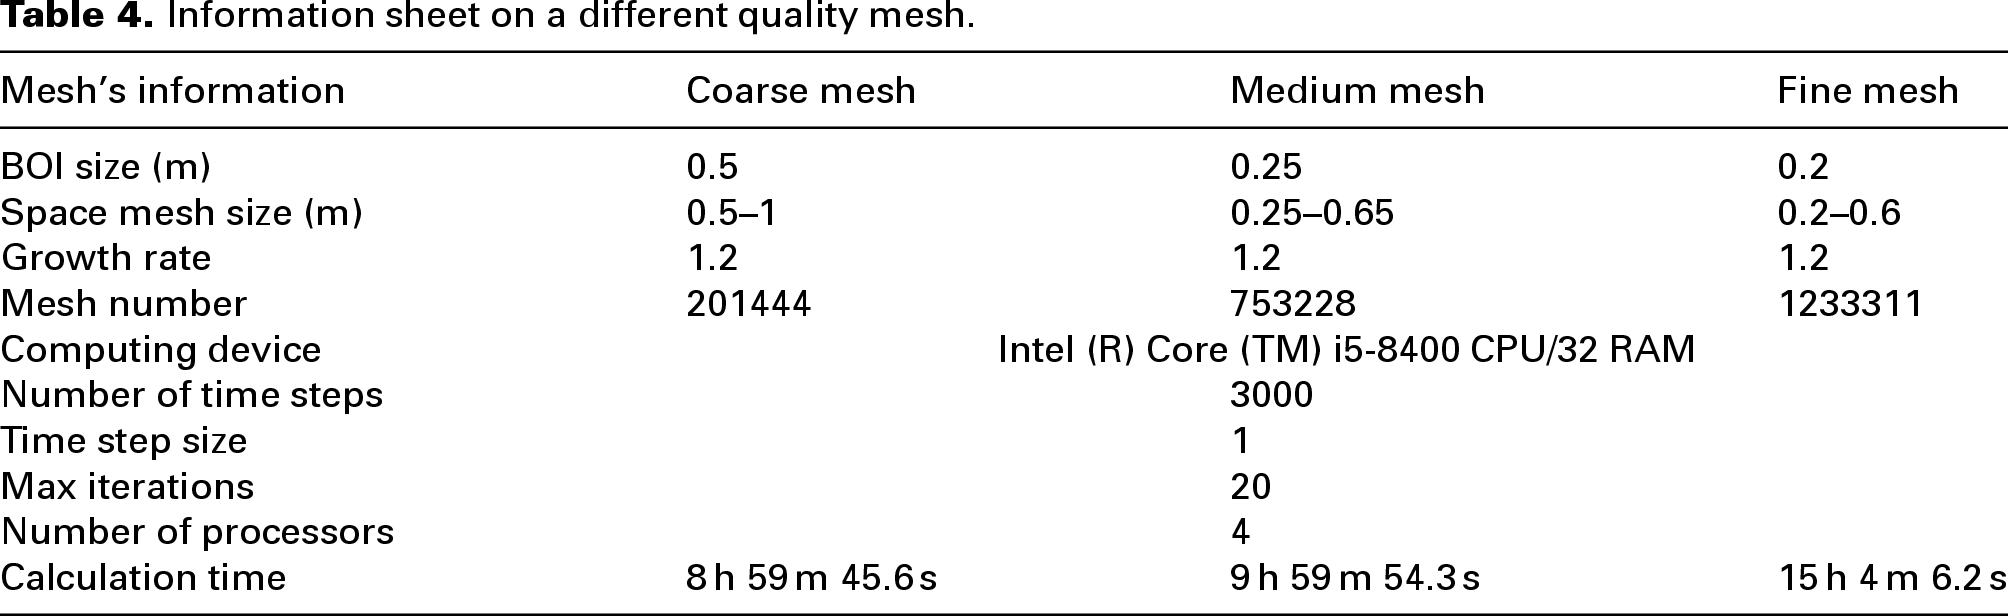
Mesh quality could directly affect the simulation's efficiency and accuracy when CFD is used to simulate the tunnel ventilation fields and CO diffusion. Therefore, verifying mesh independence is essential. To ensure result reliability, this study performed grid independence verification using ANSYS Fluent Mesh by generating three meshes of different qualities, with their grid information and computational time presented in Table 4. For mesh independence verification, air velocity was selected as the evaluation parameter, and fluent simulations were employed to compare its distribution at Y = 1.5 m, as shown in Figure 9. The results revealed that the discrepancy in tunnel air velocity between the medium and fine grids was minimal, whereas the difference between the medium and coarse grids was notable. Considering computational efficiency and computer performance, the medium mesh model was adopted for the simulation. The medium grid size for the working face and ventilation duct was set to 0.25 m, while the grid size for the remaining regions ranged from 0.25 to 0.65 m, with a grid growth rate of 1.2. To ensure calculation accuracy, three boundary layers were added to the modelled tunnel wall and the tunnel bottom.
Mesh independence analysis.
Information sheet on a different quality mesh.
According to the simulation requirements for setting boundary conditions, fluent was used to solve the tunnel blasting CO transport diffusion. The boundary conditions were set as shown in Figure 8. Regarding the fixed wall boundary condition, the working face and tunnel surface received no-slip wall boundaries. For the tunnel wall, it was assigned a roughness height of 0.08 m, while the roughness constant was specified as 0.6.
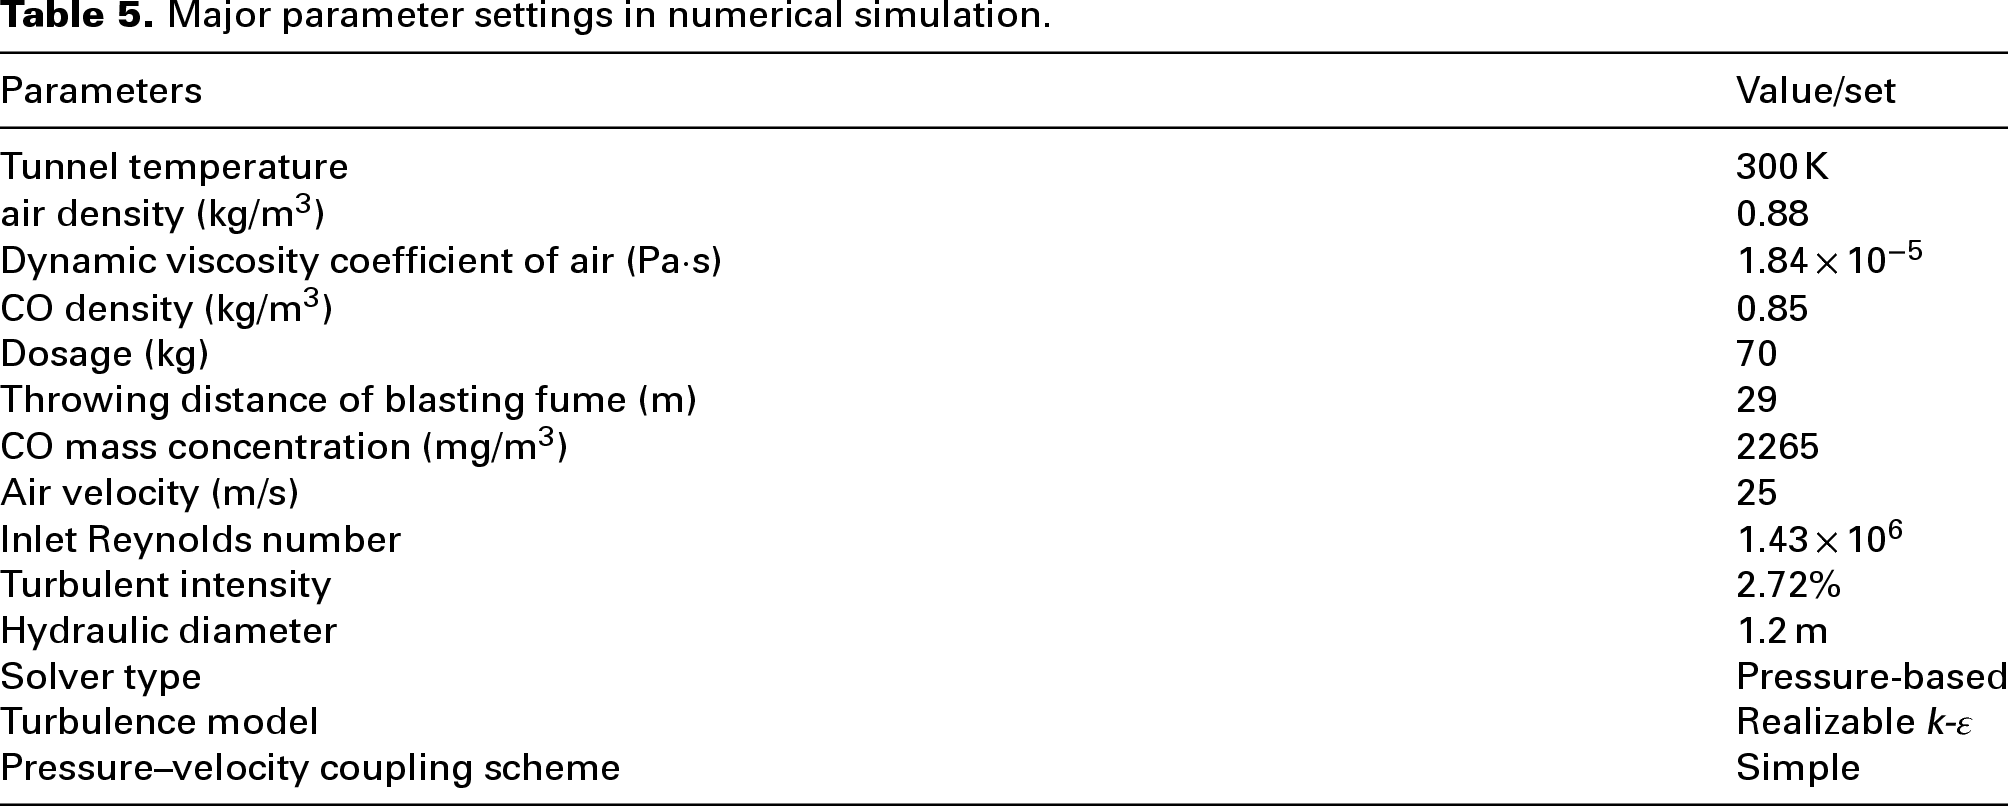
The relevant parameters of the tunnel model and the model simulation conditions are shown in Table 5.
Major parameter settings in numerical simulation.
Model validation
The comparative analysis between the computational results and field measurements is presented in Figure 10. The trends in the numerical simulation and field measurements data were essentially consistent. After 150 s, following blasting, the CO concentration exhibited a sharp increase; after 300 s, CO concentration's decline rate showed a gradual slowdown; after 1480 s, the CO concentration reduced to below the specified limit and gradually approached zero. In addition, the difference between the numerical calculation data and the field measurements data for CO concentration was relatively small. However, a notable discrepancy was observed in the peak concentration interval at 150 s, with a difference of −74 to 100 mg/m3. This discrepancy primarily arises because the numerical model cannot completely simulate the complex flow field conditions within the tunnel environment. In summary, the calculated data align well with the monitoring data, with differences occurring only in specific areas; therefore, the numerical model established in this study is suitable for analysing CO diffusion patterns at varying altitudes and ground temperatures.
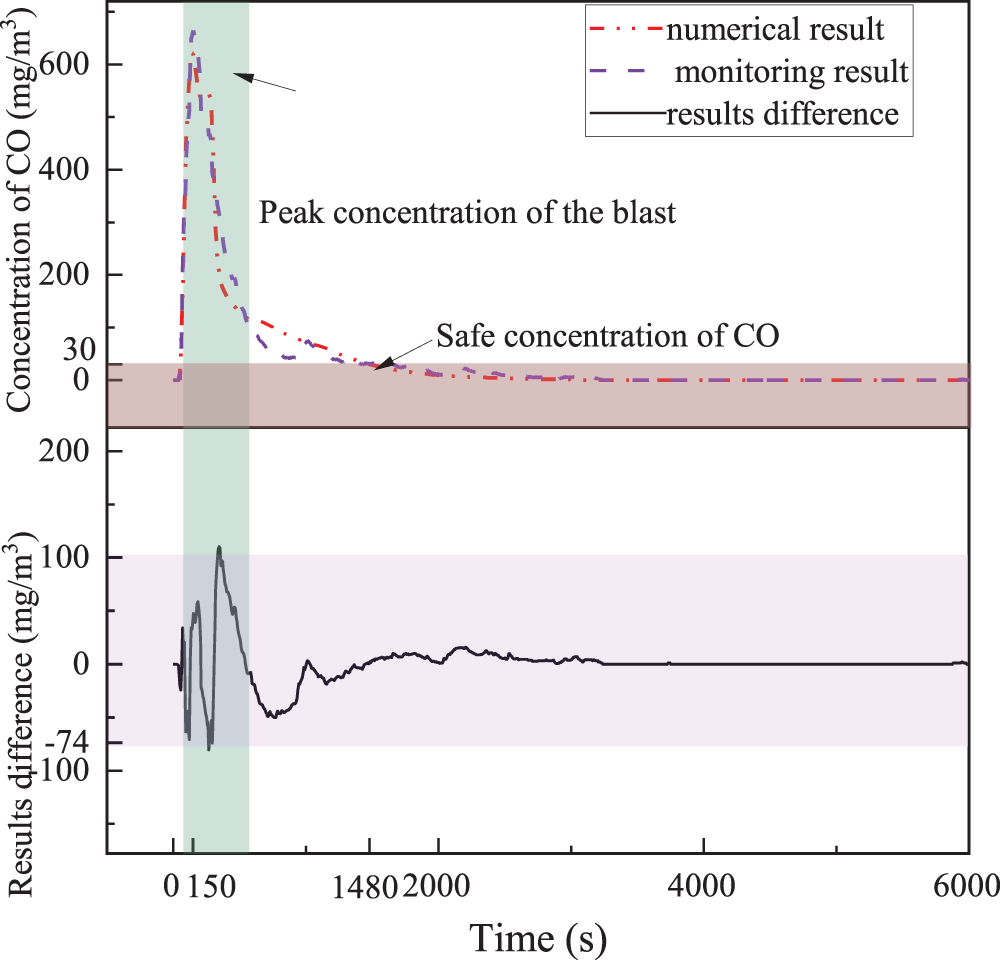
Comparison of numerical model and field measurement.
Results and discussion
Analysis of the tunnel airflow field
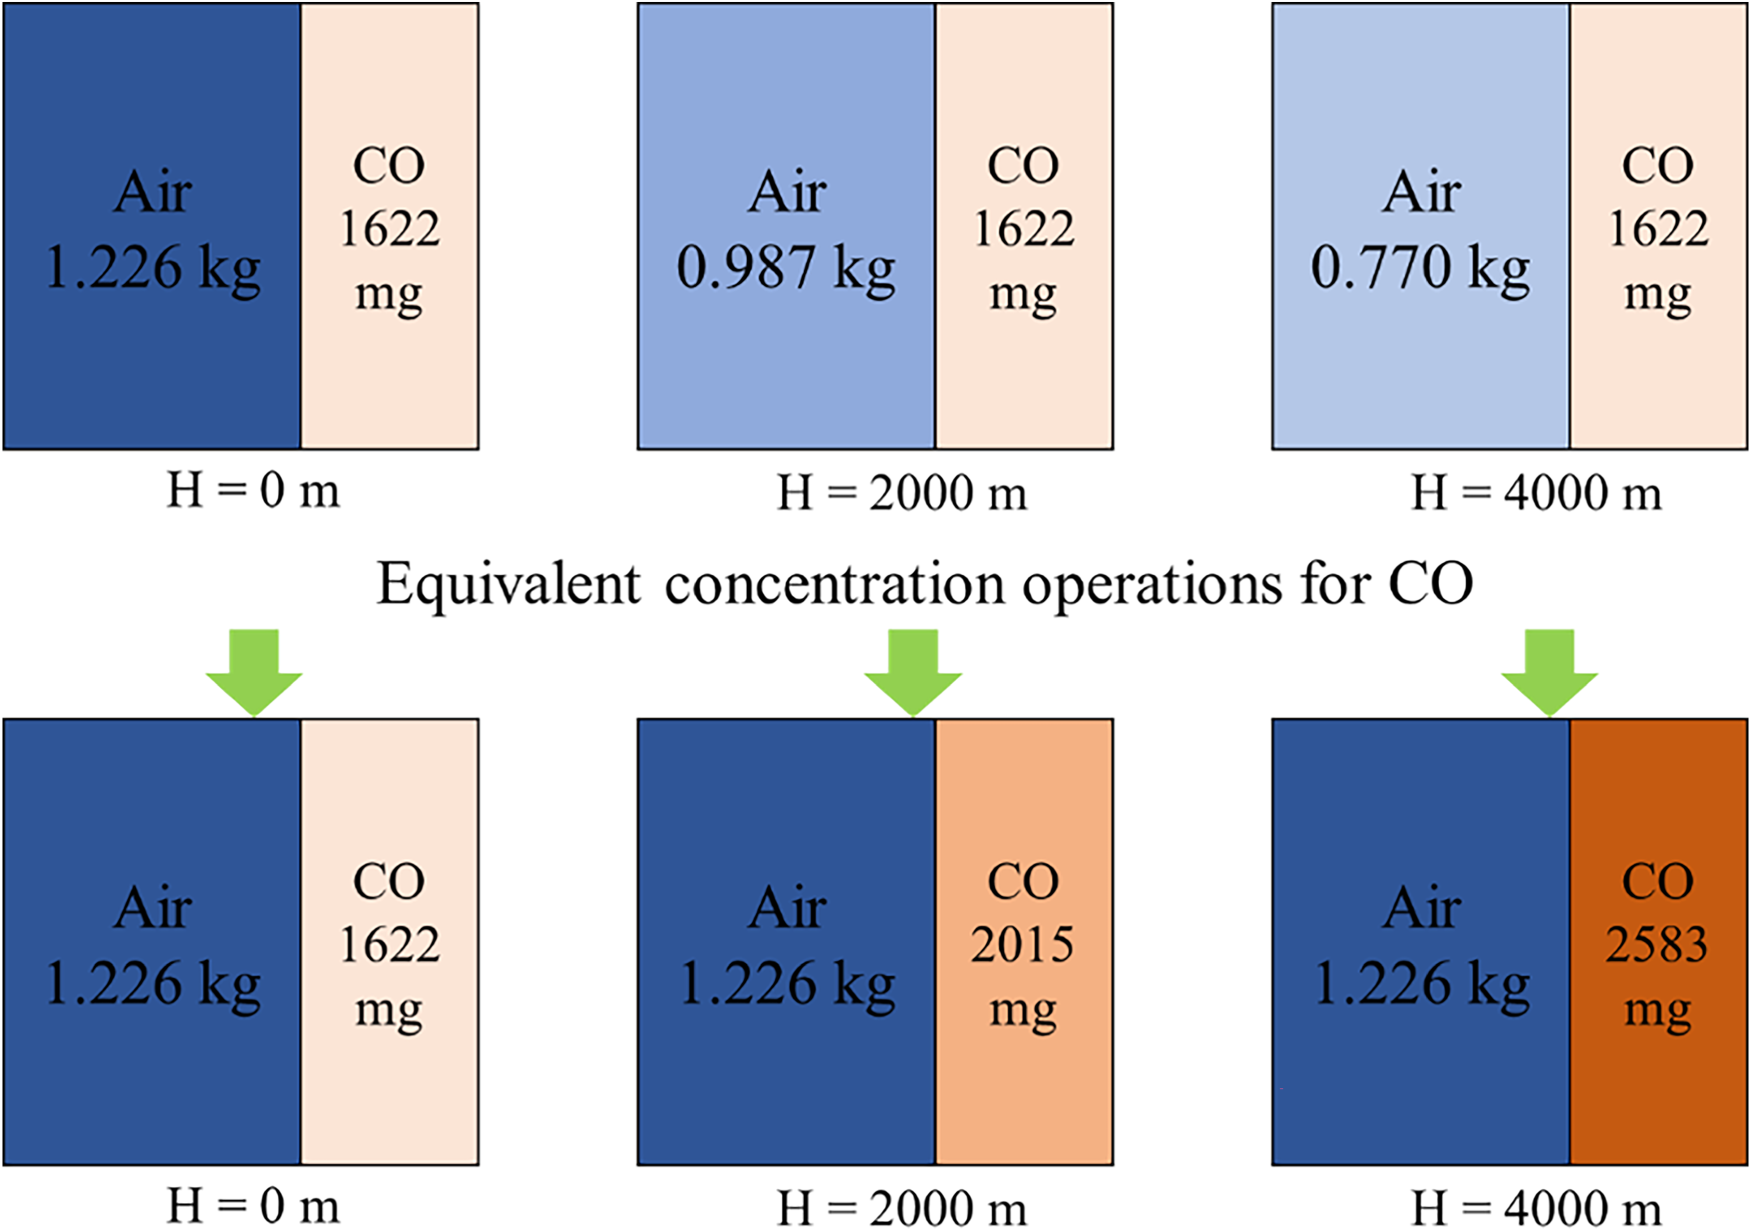
The CO generated by tunnel blasting primarily relies on forced ventilation for diffusion outside the tunnel. Therefore, analysing the airflow field is essential. The air velocity vector diagram of the lengthwise cross-section, where the tunnel ventilation pipe is located, is shown in Figure 11. As illustrated in Figure 11, the airflow field from the ventilation duct outlet to the working face is complex, with varying vector directions of air velocity, which is referred to as the “control zone”. After the air is pressed into the tunnel space from the pipe, it assumes a ray shape, forming a jet zone from the vent to the tunnel face. High-speed air impinges on the tunnel face, changes its direction of motion, and forms a backflow zone. The interaction between the backflow and jet zones creates a vortex zone near the tunnel face. Beyond 50 m from the tunnel face to the exit, the air velocity becomes gradually stratified, forming a laminar flow zone, with the air velocity stabilizing at 0.42 m/s, which exceeds the 0.15 m/s minimum mandated by the safety standard. 34
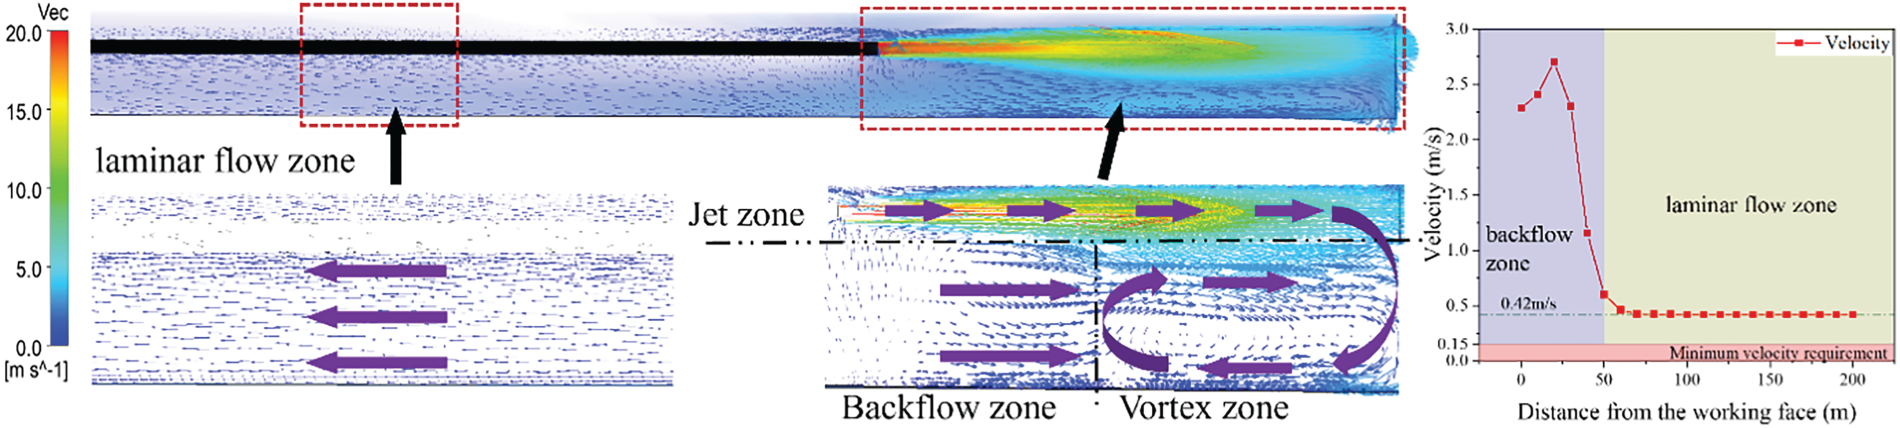
Analysis of the wind field for forced ventilation.
Analysis of the CO diffusion law
A species transport model was employed to examine CO dispersion following tunnel blasting, as illustrated in Figure 12. Initiated with forced ventilation, the CO air mass, located to the left of the red dotted line in the figure, commenced its movement toward the tunnel exit. This concentration progressed as ventilation continued. During this movement, the length of the CO air mass along the Z-axis gradually increased, expanding from 29 to 188 m in length. The CO concentration within the air mass gradually decreased, indicating the gradual dilution of CO during diffusion.
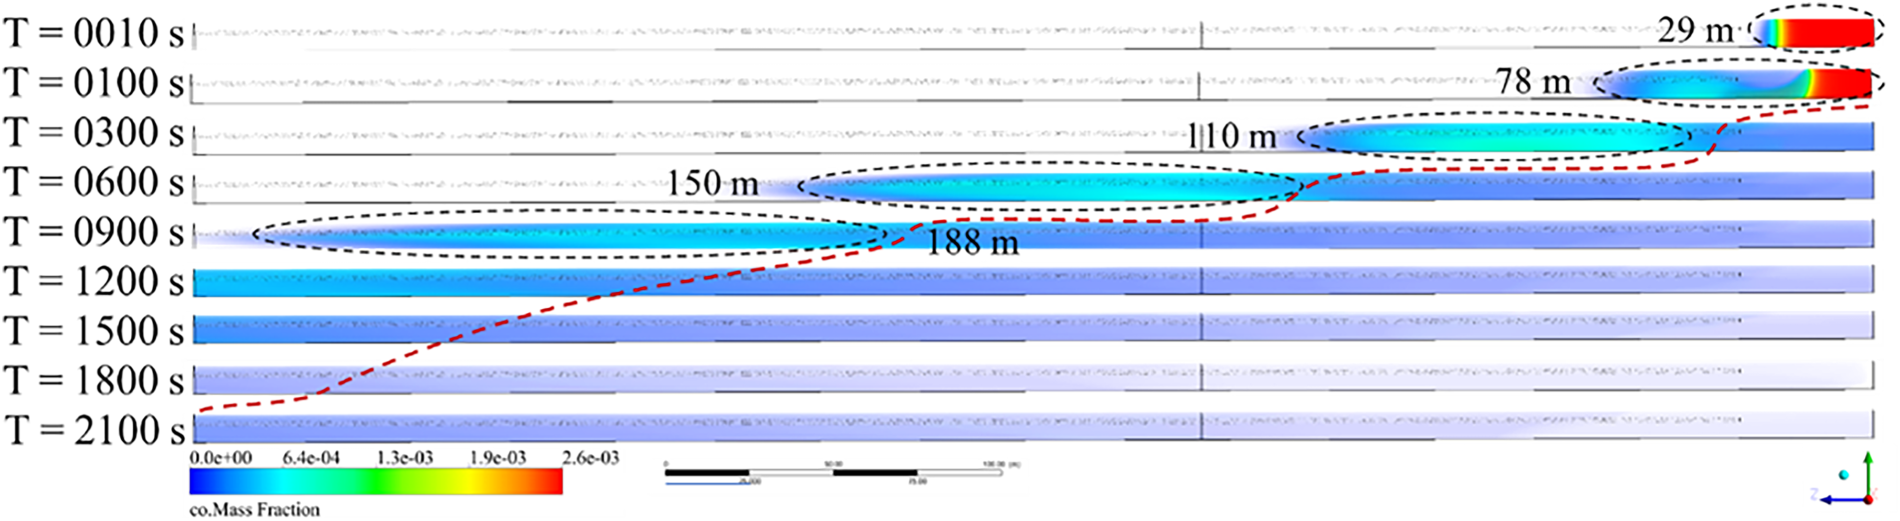
Longitudinal diffusion and diffusion of carbon monoxide (CO).
To record the mean CO concentration, tunnel cross-sections were assessed at 10-m intervals along the passage. Figure 13 presents the recorded CO levels at differing times and distances. The data indicate that the peak concentration progressively shifted away from the tunnel face with continued ventilation. After 300 s of ventilation, the spatial distribution pattern developed an asymmetrical curvature. After 600 s of ventilation, the peak CO concentration reached the tunnel exit. At this stage, the distribution of CO within the tunnel differed from that at 300 s of ventilation, assuming a semi-parabolic shape. With increasing ventilation duration, the CO distribution pattern exhibited a gradual decline in the peak CO concentration. After 1800 and 2100 s of ventilation, the CO concentration within the roadway space decreased to 30 mg/m3, indicating that the tunnel environment had gradually became secure. Therefore, before and after the peak concentration of CO reached the tunnel exit, the distribution pattern of CO changed. To obtain a more accurate fitting curve for CO concentration, it was necessary to determine the time at which the peak concentration of CO reached the tunnel exit.
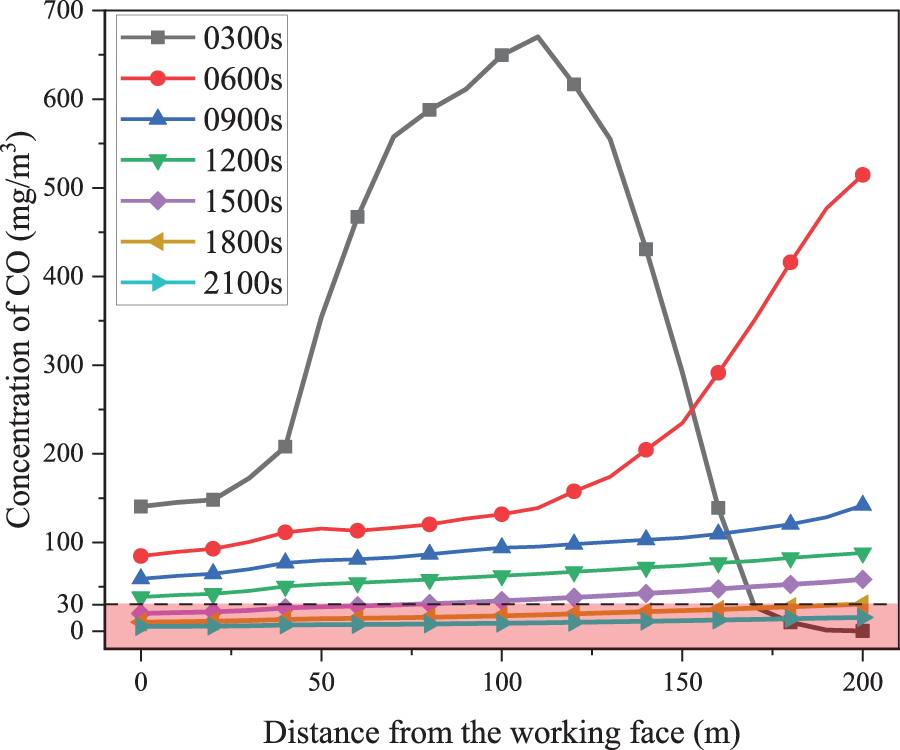
Longitudinal distribution curve of carbon monoxide (CO).
Analysis of the CO diffusion law at different conditions
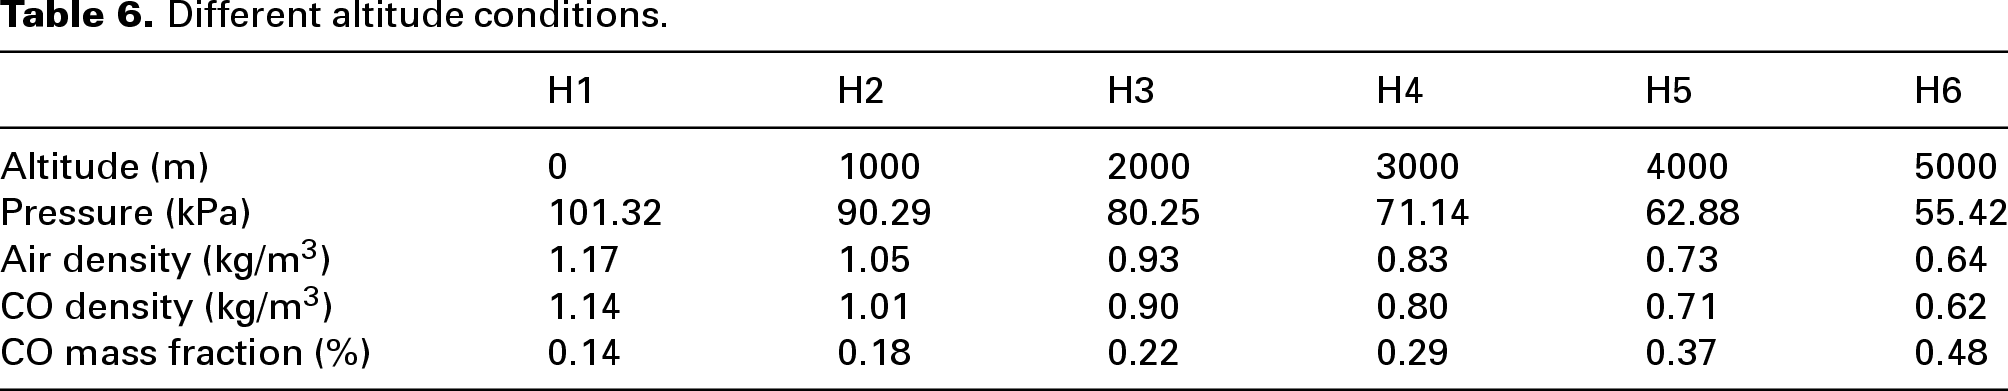
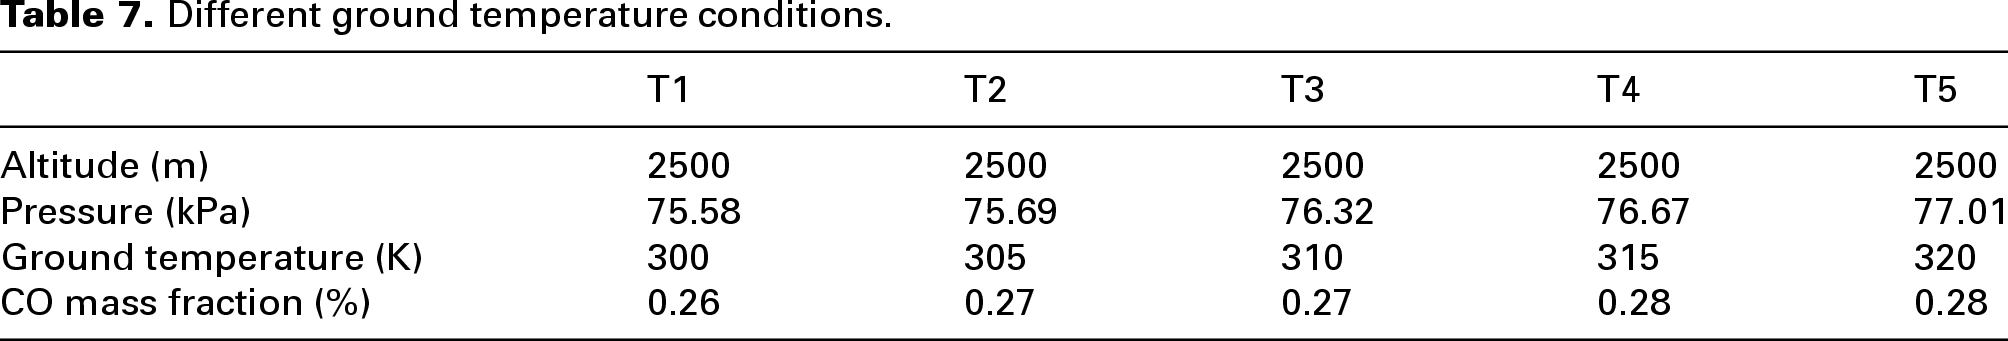
An analysis of CO diffusion under varying elevations and geothermal conditions was conducted using 11 parameterized computational scenarios. The altitude variation ranged from 0 to 5000 m, and the ground temperature variation ranged from 300 to 340 K. Based on the gas parameter calculation equations (7) to (11), the initial parameters for the different working conditions were obtained, as shown in Table 6 for the altitude condition, and Table 7 for the ground temperature condition. When the air velocity of the ventilation pipe remained constant, the time for the peak concentration of CO to reach the tunnel exit depended on the explosive dosage. To determine this time, different working conditions with explosive dosages ranging from 70 to 270 kg were established, as shown in Table 8.
Different altitude conditions.
Different ground temperature conditions.
Different dosages of explosive conditions.
Analysis of the CO diffusion law at different altitudes
From the diffusion law of CO presented in Figure 13, it can be observed that, after 300 s, CO was fully diffused within the tunnel. Therefore, the variation in CO concentration at different distances from the working face at each altitude at the moment of ventilation was selected, as shown in Figure 14.
Co diffusion distribution at different altitudes: (a) carbon monoxide (CO) diffusion mass cloud plot at different altitudes and (b) changes in CO concentration at different altitudes and distances from the working face.
It can be concluded from Figure 14 that (1) Following 300 s of ventilation, the CO mass fraction profile exhibited high consistency in both spatial distribution and temporal evolution. Specifically, the CO mass fraction value gradually increased as altitude rose, with its peak located 110 m away from the working face. (2) As altitude rises, the CO concentration at the same location gradually increased. The peak CO concentration increased by 10.8%, 22.8%, 39.3%, 58.9% and 84% from H1 to H2, H3, H4 and H5, respectively, indicating a gradual increase in concentration.
To examine the effect of altitude on CO concentration, this study introduced a concentration correction coefficient (kH) to predict the CO concentration at identical locations under varying altitudes. Calculation of the altitude-specific correction coefficients is summarized in Table 9. It was determined that the correction coefficient exhibits a power function relationship with altitude; thus, the CO concentration at altitude H is given by equation (13):

Carbon monoxide (CO) concentration correction factor table.
Analysis of CO diffusion behaviour at different ground temperatures
Figure 15 shows the CO diffusion cloud map in the Y = 2 m plane after 300 s of ventilation. It can be observed that under identical ventilation durations, the distribution shape of CO in the tunnel varies. Under the T1 condition, the CO distribution is more concentrated, with a larger area of peak concentration and lower distribution in the central region. Conversely, the other conditions exhibited a smaller peak CO concentration area, a more dispersed overall distribution, and higher concentrations in the central region. With increasing ground temperature, the CO diffusion velocity accelerated. Under the same ventilation duration, the peak CO concentration area accelerated from T1 to T5, and the area with a mass fraction > 0.001 extended toward the tunnel exit by ∼40 m.
Carbon monoxide (CO) mass fraction cloud plot at Y = 2 m.
CO concentration measurements at the exit plane were documented in Figure 16. Results indicate that with increasing ground temperature, the peak exit CO concentration appeared more rapidly, with the maximum increase occurring at 53 s. Elevated ground temperatures induced dispersion of the CO mass distribution along the tunnel, resulting in a diminished peak concentration with reductions up to 224 mg/m3. Moreover, the duration for the exit CO concentration to attain the 30 mg/m3 threshold was increased, exhibiting a maximum delay of 130 s.
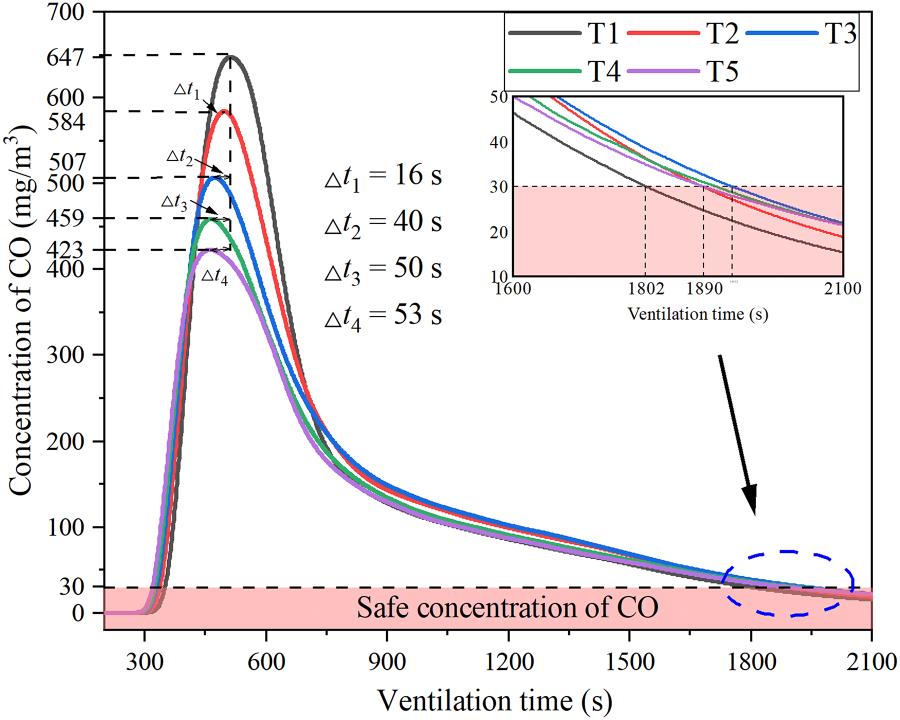
Carbon monoxide (CO) concentration over time at the tunnel exit section.
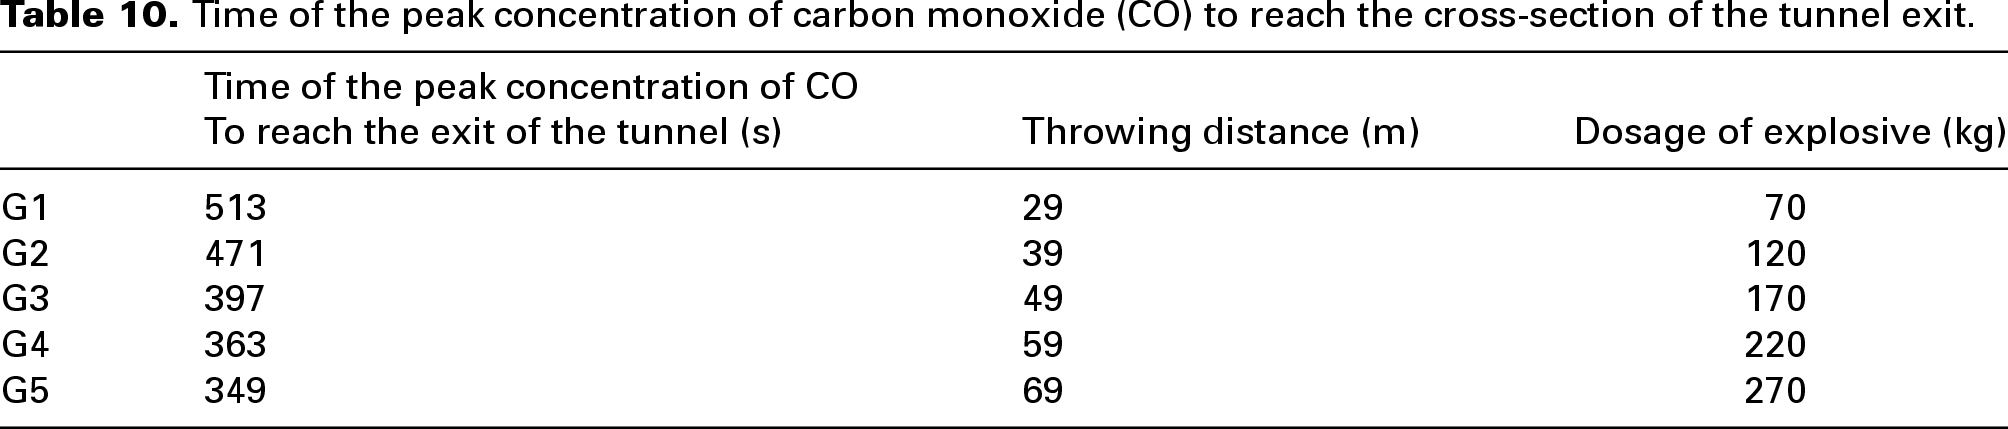
Computational data from the simulations enabled quantification of CO concentration variations across different ground temperatures. The correlation between these concentration differentials and ventilation duration was mathematically expressed as equation (14):
Analysis of CO diffusion behaviour at different dosages
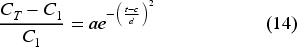
Variations in the CO concentration with different explosive dosages were analysed at the same time. As shown in Figure 17, with an increase in the amount of explosives at the same time and position, the CO concentration was increased. Compared with the G1 working condition, the CO concentration in the G5 working condition was increased by 1994 mg/m3. The peak concentration of CO gradually moved towards the tunnel entrance with an increase in explosive dosage. From the G1 to G4 working conditions, for every 50 kg increase in explosives, the peak concentration of CO shifted 20 m towards the tunnel entrance, but no further increase was observed from G4 to G5. Therefore, the movement of the peak concentration of CO is related to the explosive dosage used.
Carbon monoxide (CO) concentration at various dosages in 300 s.
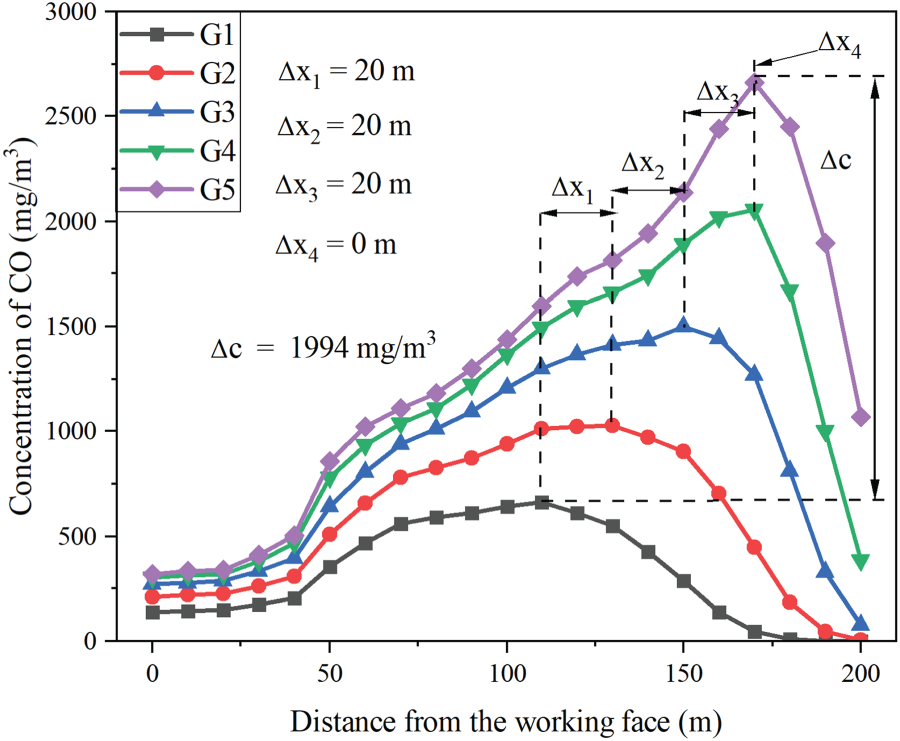
The temporal progression of the peak CO concentration to the exit fundamentally alters CO distribution patterns. Table 10 lists the arrival times of the peak CO concentration at the exit cross-section. Results demonstrate that increased explosive dosage markedly enhances the transit velocity of the peak CO concentration to the tunnel exit. From Table 10, the relationship between the time t0 when the peak CO concentration reached the exit and the explosive dosage was obtained, as shown in equation (15):

Time of the peak concentration of carbon monoxide (CO) to reach the cross-section of the tunnel exit.
Fitting of the CO distribution function
A multivariate analysis was performed to predict CO mass concentration in tunnelling environments, establishing a fitting model that relates CO mass concentration to key parameters: ventilation time t (s), working face distance x (m), altitude H (m) and ground temperature T (K). Under the initial conditions, it was assumed that the CO was uniformly distributed within the blasting fume area, with an initial concentration of C0.
According to the numerical analysis results, the CO concentration Ct at different ventilation durations and tunnel locations was obtained. The CO concentration data at H = 0 m were used to plot the distribution function of ln(Ct/C0) with the distance from the working face at different times. The plotted curves are shown in Figure 18. As can be seen that when the ventilation time t < t0, ln(Ct/C0) exhibits an increasing and then decreasing trend, whereas when t > t0, ln(Ct/C0) follows a monotonically decreasing trend. Therefore, the function fitting was divided into two parts with t0 as the cut-off point.
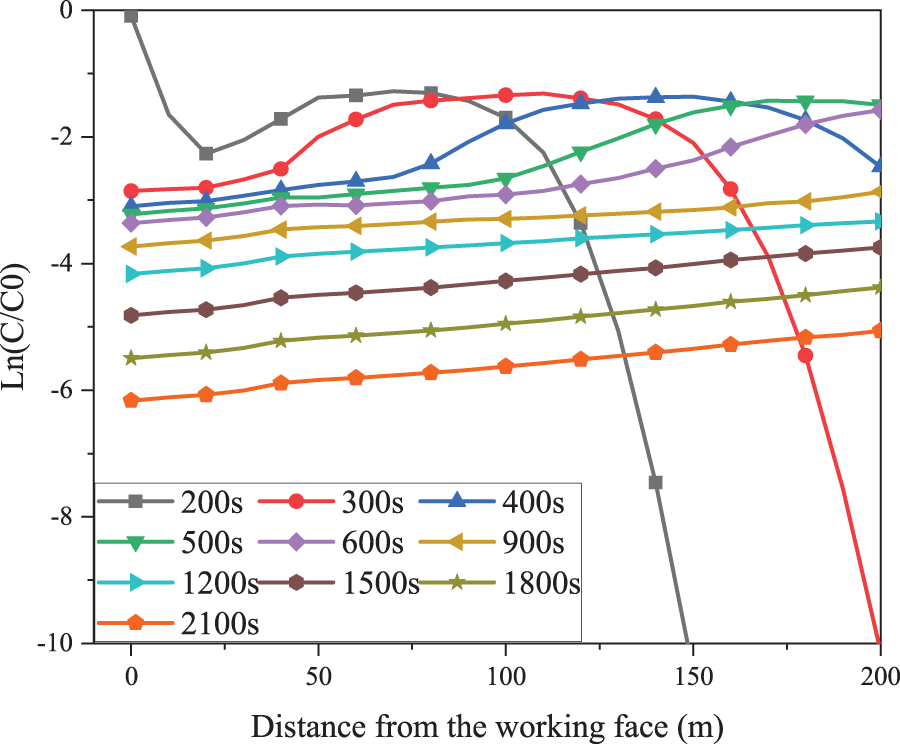
Variation of ln(C/C0) with distance.
For the H1 condition, the simulation data were fitted to derive a functional form describing CO concentration as a function of ventilation durations and tunnel location. The fitting process is summarized in Table 11.
Distribution function fitting of ln(Cx/C0).
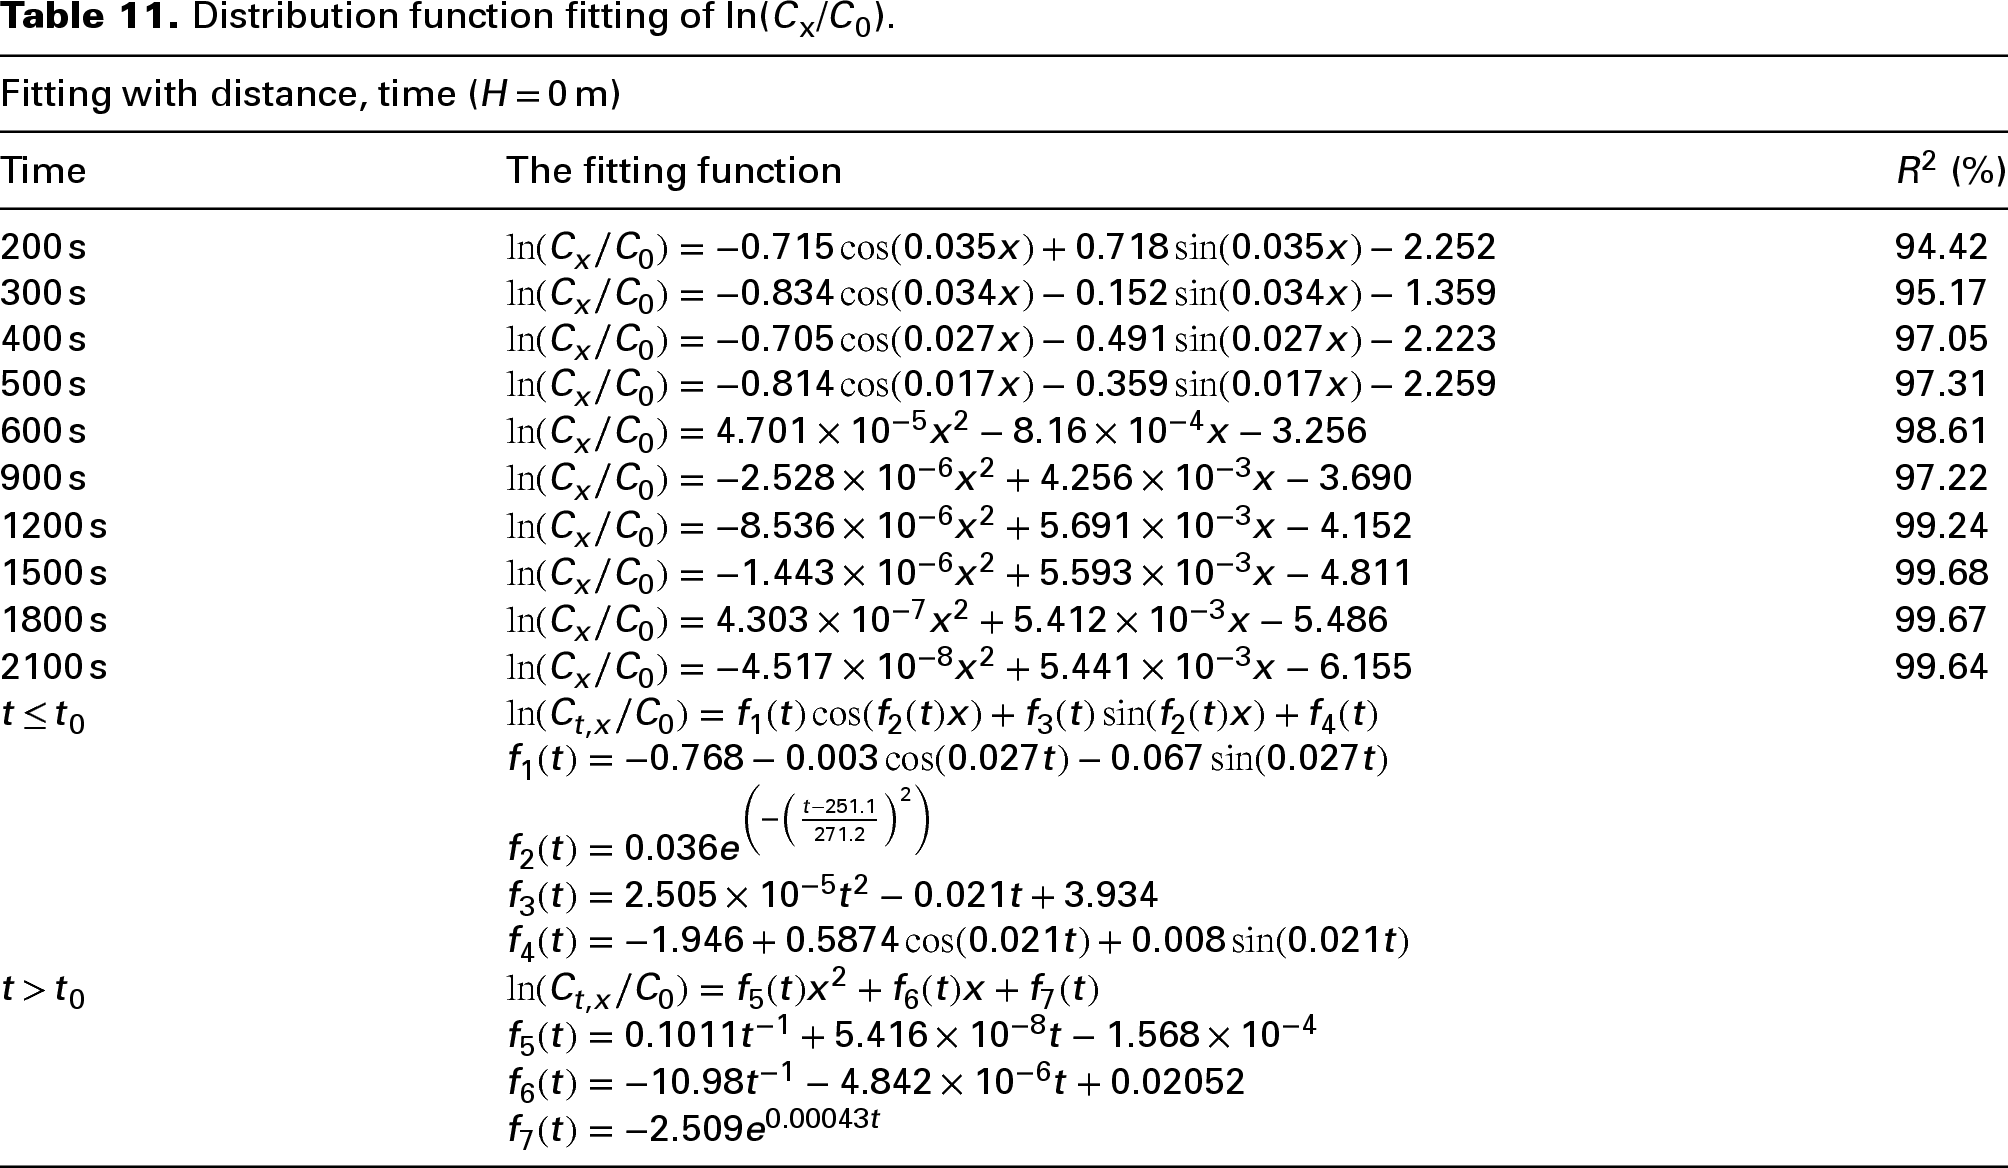
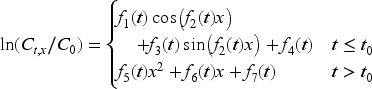
According to Table 11, the distribution function of ln(Ct,x/C0) with distance from the working face and ventilation durations can be expressed by equation (16):
The CO concentrations at different a values from H1 to H6 were fitted to the ventilation durations, distance from the working face and altitude. The distribution process is shown in Table 12.
Distribution function fitting of ln(Ct,x/C0).
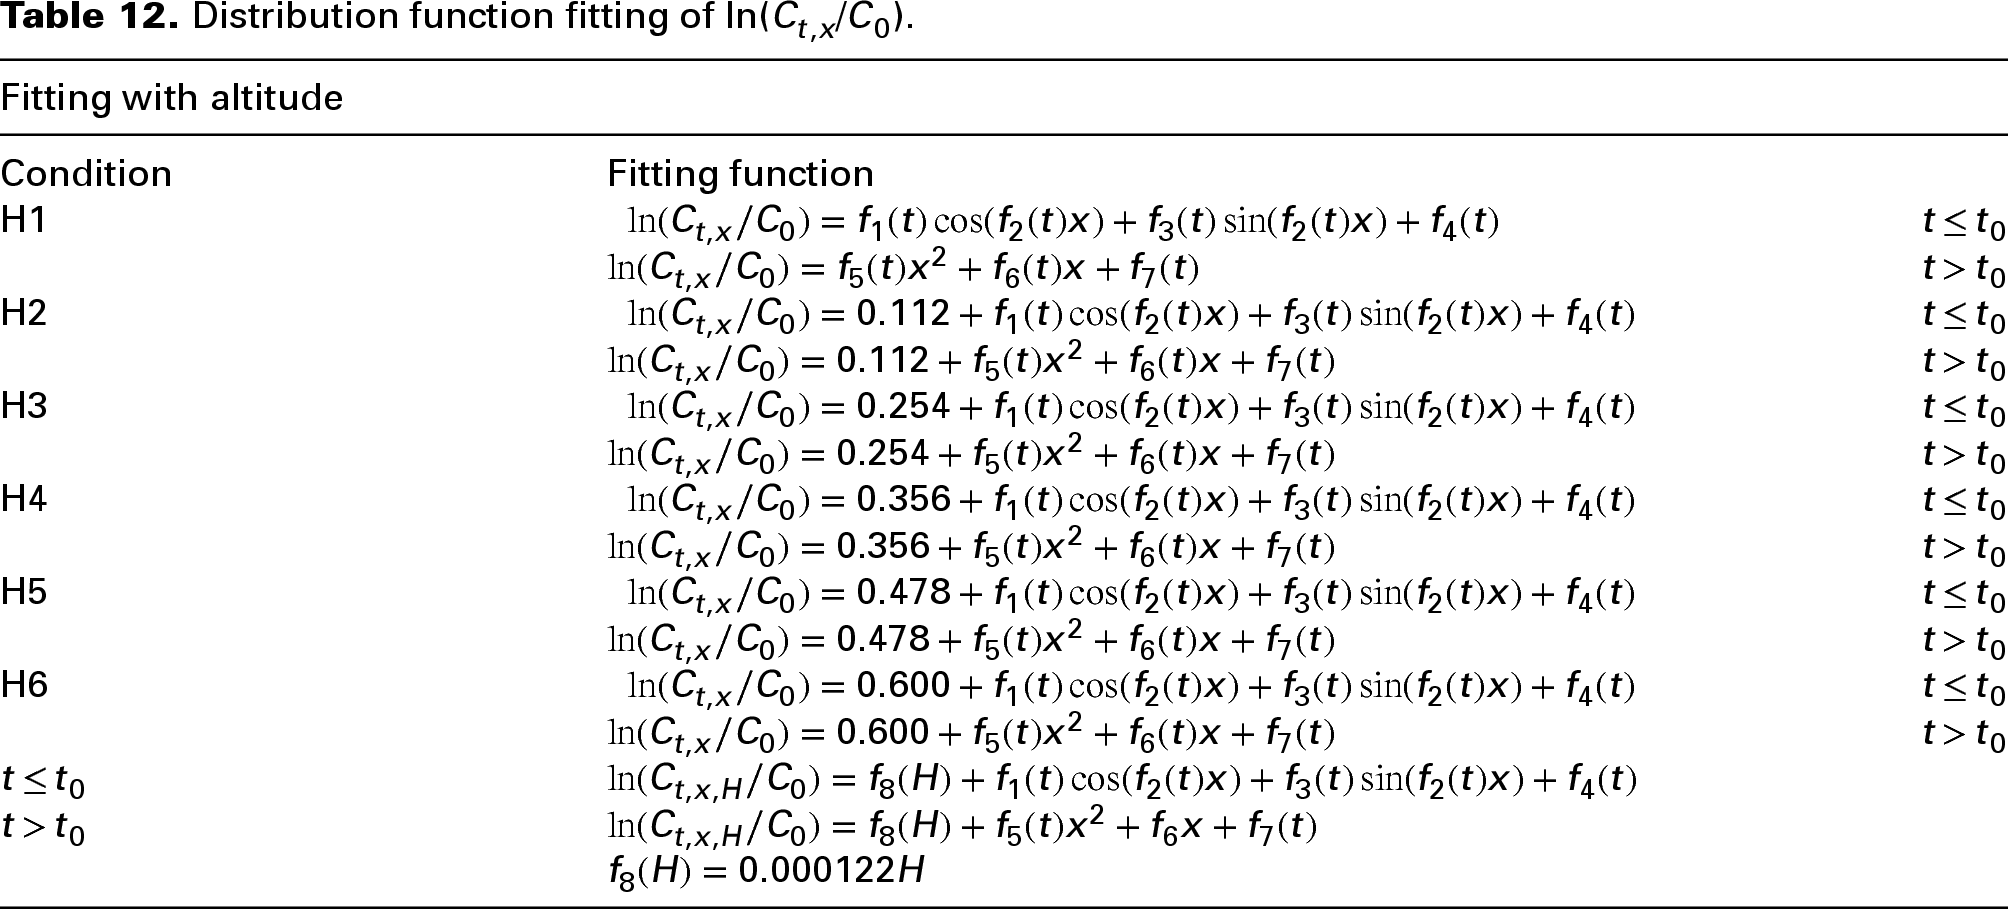
According to Table 12, the distribution function of ln(Ct,x,H/C0) with the distance from the working face, ventilation durations and altitude can be expressed by equation (17):
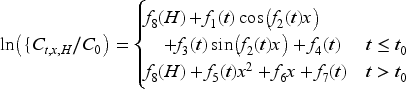
The distribution function of the CO concentration versus the ventilation durations, distance from the working face, altitude and ground temperature from T1 to T5 was fitted, and the fitting process is shown in Table 13.
Distribution function fitting of ln(Ct,x,H/C0).
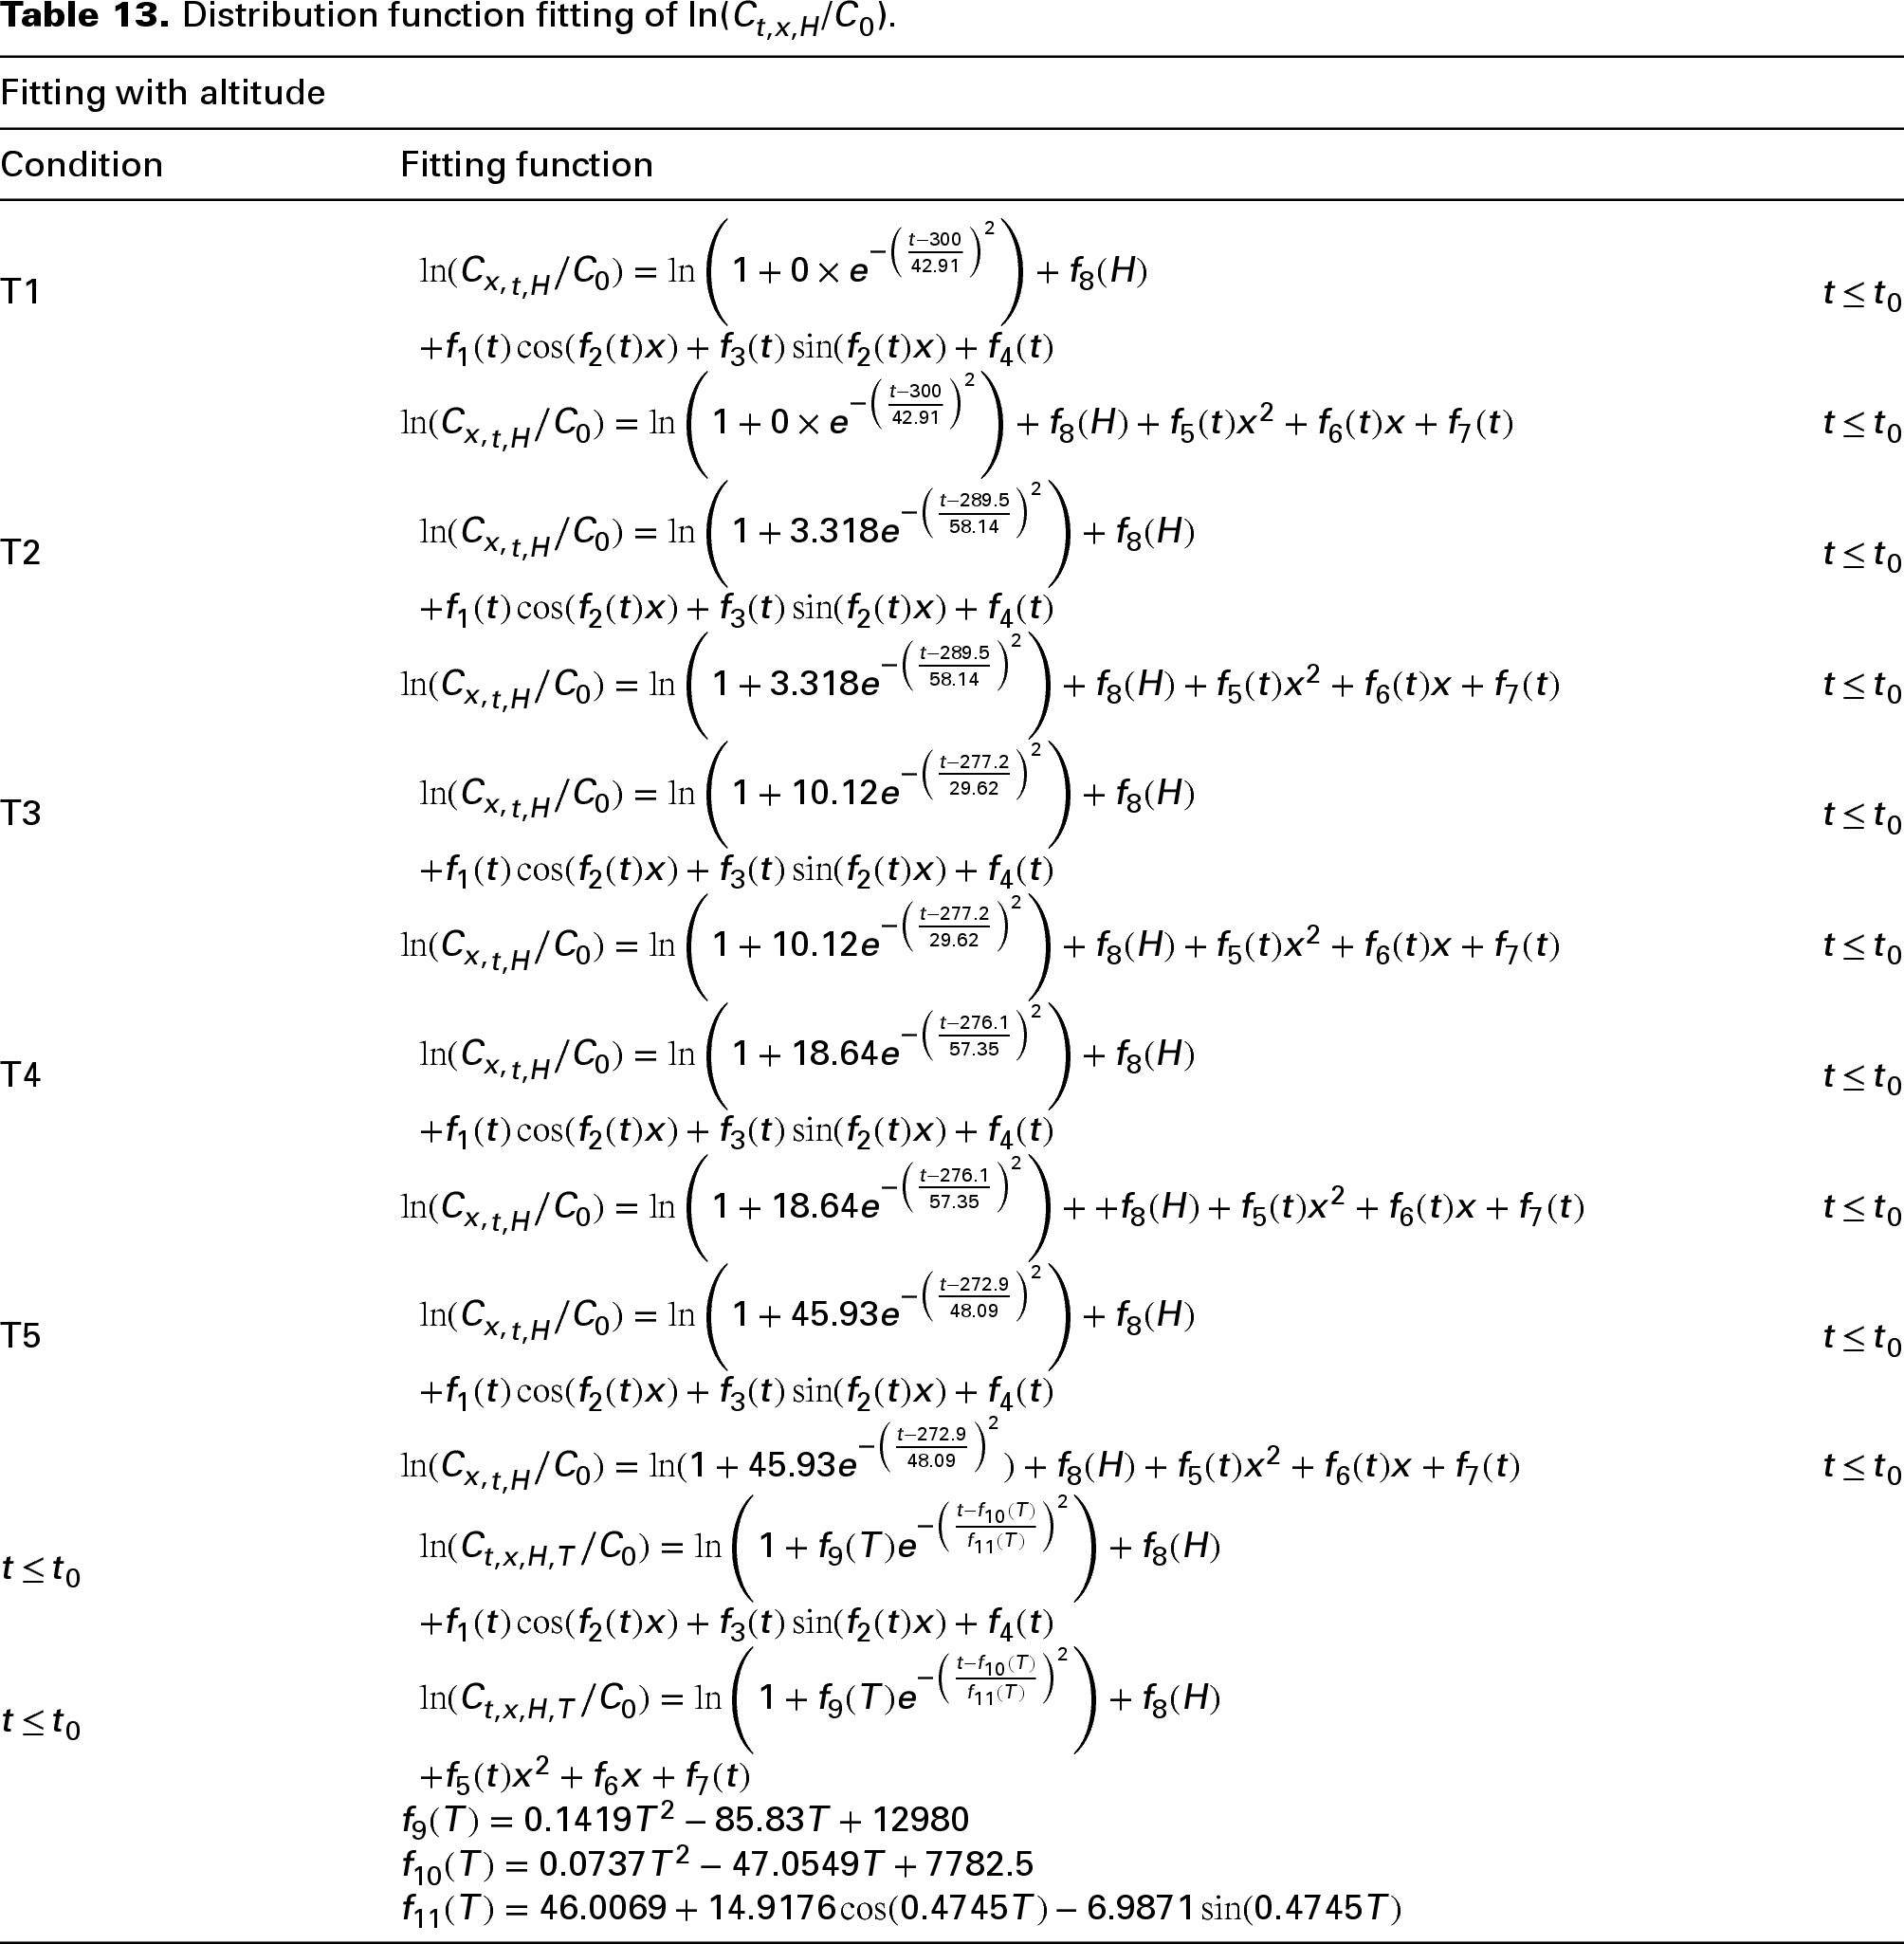
To conclude, under an air velocity of 25 m/s, the distribution function of the CO concentration in the tunnel is shown in equation (18), with corresponding coefficients provided in Table 14.
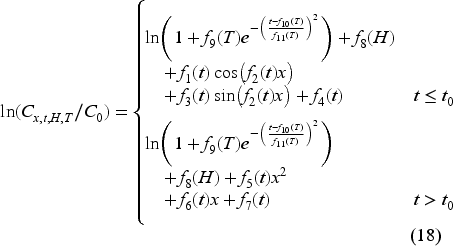
Table of function values.

Conclusion
A numerical calculation model for the CO diffusion law was developed for a tunnel in the southwest plateau area, and the accuracy of the numerical model calculation results was validated through on-site monitoring. Using this numerical model, the transport and diffusion behaviour of CO generated by blasting, and the influence of altitude and tunnel ground temperature on CO diffusion, were analysed. The fitting function of CO concentration related to ventilation time, tunnel spatial location, altitude and ground temperature was established, and the main conclusions are as follows: Changes in altitude and tunnel ground temperature alter the physical parameters of the gas, affecting the CO diffusion law in high-altitude and high-ground-temperature tunnels. With the increase in air pressure at altitude, both the air density and CO density showed a tendency to decrease, and the initial mass fraction of CO showed a tendency to increase. Under forced ventilation, jet, vortex and backflow zones are formed in the tunnel control area and gradually move away from the working face. The wind field gradually stabilizes, forming a laminar flow zone. CO migrates toward the tunnel exit and diffuses within the tunnel under the influence of tunnel ventilation. Altitude influences the CO concentration in the tunnel after blasting; the CO equivalent concentration increases with altitude, with a gradually increasing rate of increase. Tunnel ground temperature affects the peak diffusion speed and diffusion volume of CO; an increase in ground temperature accelerates the peak diffusion speed of CO, while the rate of increase in temperature leads to a gradual decrease in amplitude. This also increases the CO diffusion volume at the tunnel exit, slowing down the decrease in CO concentration at the tunnel exit. The CO diffusion behaviour varies with altitude and tunnel ground temperature. By analysing simulation data under different working conditions, the functional relationship between CO concentration and t, x, H and T after blasting was determined, and the fitting function was derived. This allows for the analysis and prediction of CO concentration under different working conditions or the inversion of tunnel ventilation time based on CO limit concentration, providing a reference for high-altitude tunnel construction.
Footnotes
Acknowledgements
We are very grateful to the tunnel workers for their strong support and understanding of this study.
Authors’ contribution
Chen Zhang did conceptualization, writing–original drafted preparation and statistical analysis. Xiaojing Sun and Zhenliang Zhou contributed to the statistical analysis and writing–review. Zhongsheng Tan did conceptualization and investigation.
Declaration of conflicting interests
The authors declared no potential conflicts of interest with respect to the research, authorship, and/or publication of this article.
Funding
The authors disclosed receipt of the following financial support for the research, authorship, and/or publication of this article: This work was supported by the China Postdoctoral Science Foundation (Certificate Number: 2023M730204).