
Abstract
Investigations into major crimes and cold cases are often faced with an abundance of potential leads. What is required is a systematic method for organising, prioritising, and evaluating them. Although developing timelines and investigative leads is a familiar skill among investigators, the challenge lies in managing and prioritising these leads explicitly and effectively. This article outlines a novel combined approach that merges temporal analyses and the analysis of competing hypotheses to offer a synthesised effective means of explicitly stating, structuring, and organising leads in criminal cases. The approach is designed to map investigative pathways, reduce resource load, and provide a structured process for lead prioritisation. A real-world inspired case is used to exemplify the process which outlines how case strategies may be improved through hypothesis evaluation, supporting resource allocation, and assisting the prioritisation of leads.
Keywords
In major crimes and homicide investigations, the challenge police face is often not a lack of leads, but rather an overwhelming number of them. This is particularly true in complex criminal investigations and cold cases, where multiple potential leads may exist but lack sufficient evidence for prioritisation or refutation. An important aspect of the investigative process is therefore to prioritise the leads fairly, and without bias (Sutmuller et al., 2021). Without the analytical tools or resources to effectively prioritise these leads, investigations can stall or be misled. This may be especially true in no-body homicide (NBH) cases, wherein key details of the case may be unknown, leading to increased hypothesising (Ferguson & Pooley, 2019; Keatley, 2024). Consider the following case: a man is missing, blood is found at his residence, and his car is also missing. The initial obvious questions are: Did the victim get attacked at his home? Did the suspect take the victim's car and dispose of his body somewhere? Did the suspect leave the body in the victim's car or attempt to bury or conceal the body elsewhere? Did the suspect leave the car at the body deposition site (BDS) or move it elsewhere? Or the question of whether a crime has even occurred (perhaps the person simply injured himself, hence the blood, then attempted to drive himself to get help). Of course, police can work through these investigative leads, but it may become difficult to keep track of all the hypothetical pathways, and which should be prioritised. Some leads may overlap; some evidence may not prioritise leads. What is required to assist investigative approaches is a method that simplifies the complexity and maps the myriad pathways (Keatley & Clarke, 2020a). The aim of this article is to provide an overview of structured analytical approaches that, once combined, may help in the management and prioritisation of investigative leads. Namely, temporal analysis, matrix diagrams and the analysis of competing hypotheses.
Temporal analysis and criminal investigations
Applied researchers have recently been developing methods and analyses that may help cold case reviews by focusing on temporal pathways and analyses (Keatley, 2018, 2020; Keatley & Clarke, 2020a). The main focus is to help elucidate, map, and analyse the various hypothetical pathways that may have occurred in a criminal case and provide investigators with strategies to progress their investigation (Chapman et al., 2019; Keatley & Clarke, 2020b). The aim is not to solve the investigation using these temporal methods, but to assist law enforcement organisations by streamlining their work and potentially opening new lines of enquiry based on re-analysing and reviewing the information. Importantly, this is not to suggest that investigators are not fully aware of the importance of timelines and interactions between victims and offenders, but to highlight how new methods may provide new frameworks to understand and investigate the crimes (Keatley, 2024, 2025a). Often the phrase, “the suspect is in your files“ is repeated; that being said, some of the newer temporal methods may provide different lenses through which to see the suspect more clearly. Although researchers have developed various temporal methods individually (Keatley, 2020; Leclerc & Wortley, 2014; Taylor et al., 2008) there is always a focus on combining and developing such methods (Keatley et al., 2019; Keatley et al., 2022), and that is the aim of this article, to provide an exploration and example of how various methods may be integrated in a novel way to assist with timeline prioritisation.
Providing analytical frameworks that are fit for purpose in investigations is a key concern in applied criminology (Halford, 2024; Tejeiro et al., 2023). To this extent, researchers have been developing ways of presenting very complex processes in relatively straightforward visual representations (Gityamwi et al., 2025) that replicate digital visualisation and analysis tools police already use (e.g., i2 Analyst's Notebook). Rossmo and Beauregard (2025), for example, researched very complex cases, including a murder trial and wrongful conviction, and analysed the temporal progression of the case. The very complex analyses were then presented in visual flow diagrams. This approach to representing complex data and pathways in a visual flow or “sequence” format has also been suggested by others (Beauregard et al., 2007; Dawid et al., 2025; Keatley, 2018; Keatley et al., 2021; Winter & Rossi, 2021), and is sometimes referred to as a “matrix diagram”, highlighting the link between the diagram and the underlying matrix (Keatley & Clarke, 2020b). The temporal approach may help investigators identify critical decision points and overlooked pathways for evidence discovery. For example, in understanding the temporal and spatial dynamics of an NBH that involves moving the body from the primary crime scene, where the offender's actions may span multiple days or locations (Keatley, 2024). Temporal diagrams may help to show potential gaps or areas in the investigation that require further investigation. The difficulty becomes how to prioritise pathways in a clear and unbiased way. For that, another approach for structuring and analysing multiple hypotheses is required.
Analysis of competing hypotheses
Analysis of competing hypotheses (ACH), as outlined by Jones (1998), is a method for evaluating multiple hypotheses in complex investigations. The ACH process involves generating a list of all plausible hypotheses and evaluating evidence consistent or inconsistent with each one. Hypotheses are then assessed through a process of elimination, focusing on whether the available evidence is consistent or inconsistent with them. Importantly, “elimination“ refers only to their removal from the analytical comparison table—not from the broader investigation. As new evidence becomes available, previously discarded hypotheses may gain support. Therefore, reviews can account for why paths were removed and how newer information may affect an investigation (Houck, 2020). In investigations, ACH is particularly useful for reducing bias, identifying gaps in the evidence, and organising data (Jones, 1998). By applying this method, investigators can minimise cognitive biases, ensure a comprehensive evaluation of all possibilities, and develop prioritised investigation leads (Keatley, 2025a). ACH is a potentially valuable tool for evidence-based hypothesis prioritisation in cases in which multiple plausible scenarios exist (Houck, 2020; Jones, 1998).
A combined approach in cold case investigations
The combination of temporal analyses and ACH offers a potentially useful framework for tackling the complexities of cold case investigations. To make this combined approach more useful to investigators, a simplified temporal visualisation output is needed. Plotting hypothetical temporal scenarios in a diagram has been previously shown in matrix diagrams (Keatley & Clarke, 2020b). These diagrams provide a relatively simplified temporal flow chart of the hypothetical timelines, which can be integrated and reviewed using an ACH approach. ACH complements this by systematically evaluating the investigative value, relevance, and potential implications of the information, ensuring that no viable hypothesis is overlooked (Keatley, 2025a). Together, these methods may facilitate investigators’ organisation of evidence, identify gaps in the investigative process, and prioritise the most plausible leads. Although these methods and techniques have been shown to be useful, some research has suggested that their effectiveness may be limited by lack of awareness of comprehensive training (Dhami et al., 2019; Maegherman et al., 2021). Therefore, an aim of the current research is to showcase how the methods can be combined and applied to a NBH cold case. A combined approach is used because it facilitates the identification of overlooked decision points, narrows the search parameters, and ideally enhances the likelihood of locating the victim's remains. Although ACH and the development of competing hypotheses require some training and experience to apply effectively (Dhami et al., 2019; Maegherman et al., 2021), the benefit of combining ACH with matrix diagrams is that, unlike more technical analytical tools, these visual representations require minimal additional training, because they rely on natural pattern recognition and temporal reasoning (Gityamwi et al., 2025; Keatley, 2020; Keatley & Clarke, 2020a). However, although such diagrams are effective for visually organising complex data, they are not sufficient as a standalone analytical tool. Without structured analysis, matrix diagrams risk reinforcing surface-level reasoning rather than evidential scrutiny. Consequently, diagrams are most effective when supported by a formal analytical framework that evaluates the information in the case. Explicit outlining of assumptions and reasoning helps to reduce the concealment of cognitive biases and reduces bias carryover across reviews (Dror, 2025; Dror & Kukucka, 2021; Roach, 2019; Robbennolt & Sobus, 1997; van den Eeden et al., 2018). By integrating these analytical tools, investigators can potentially bring renewed clarity and direction to cold cases, ultimately advancing the pursuit of justice for victims and their families.
Cold case reviews of NBHs
Cases typically go cold when potential avenues of investigation have been exhausted within the limits of the methods and technology available at the time (Bennett & Ferguson, 2024; Toolin et al., 2022), or when high investigative workloads contribute to missed or under-prioritised leads (Demerouti et al., 2001; Keech & Drew, 2026; Rostad & Langvik, 2025; Sharafizad et al., 2024). Cold case reviews involve revisiting unsolved investigations using fresh perspectives, advanced methods, and new technologies (Bettels et al., 2022; Toolin et al., 2022). Cold case reviews can bring renewed focus and direction to long-dormant investigations by re-analysing existing information with fresh eyes and utilising advances in forensic science and criminology (Bettels et al., 2022; Toolin et al., 2022).
Cold case investigations, including those involving NBHs, pose significant challenges for law enforcement owing to the limited availability of evidence and the passage of time (Chapman et al., 2019; Price et al., 2025; Toolin et al., 2022). In the absence of forensic evidence, cold case reviews typically turn to other methods of developing timelines with hypothetical pathways (Keatley & Clarke, 2020a). A crucial aspect of this process is mapping the myriad hypothetical pathways and then attempting to prioritise them. Methods such as matrix diagrams are valuable visual and analytical tools for mapping complex timelines (Keatley & Clarke, 2020b). However, the diagrams can quickly become tangled pathways of possibilities (Zakopcanova et al., 2021). A means of reducing the complexity or pruning the pathways may expedite investigations (Keatley & Clarke, 2020a). Of course, any “pruning” (which is to say, the removal of pathways) must be done fairly and explicitly, without bias so that future investigators or attorneys can understand the process. In addition, structured analytical techniques, like analysis of a competing hypotheses framework, enable investigators to compare and contrast hypothetical timelines (Keatley, 2025a). By systematically organising, analysing, and evaluating pieces of evidence, investigators can potentially uncover new or overlooked leads, reframe investigative priorities, reconstruct potential timelines, and guide the search for critical missing elements.
Methods
This study combined temporal analyses with ACH to review a NBH cold case. 1 The focus of this article is on outlining the use of matrix diagrams and ACH, not on solving the cold case, per se. Therefore, the current case provides a useful example to help elucidate and clarify the methodological approach.
Case review
The case involved a NBH wherein the offender confessed to and was charged with the murder of the victim, yet the precise location of the victim's body remains unknown. The offender, while currently serving his sentence in prison, has not complied with attempts to locate the victim's body. A particular challenge, in this case, is the range of plausible timeframes during which the offender could have deposited the body, creating at first glance a multitude of potential scenarios requiring rigorous evaluation. Despite the offender's conviction, the absence of the victim's body leaves unanswered questions and hinders closure for the victim's family (Keatley, 2024).
To provide some foundation for readers, a general overview of the case is given here. Beyond this, variations in timelines are analysed as part of the Results section. In 2000, the victim was murdered by a close family friend in the early hours of the morning in or around his home 2 . The offender placed the victim's body into the back of the victim's vehicle, and the offender left the scene of the crime. The offender's movements for the next six hours are unknown. That evening, the victim's family reported the victim missing to the police. A search occurred, but no evidence of the victim's whereabouts was found until three days later, when the victim's car was found ∼70 km (∼43.5 miles) north of the victim's residence. One week after the crime, the offender made several suspicious purchases that have not been found or explained. During this period, the offender also had access to a rental van and trailer. One month post crime, the offender was arrested and eventually convicted of the crime despite the missing body never being found.
Investigative questions
In cases like this the central questions that remain are: (a) Where is the victim's body?; (b) When was the victim's body deposited?; (c) When was the car dumped?; and (d) What are the known movements of the offender?
From here, three main hypotheses were formed
3
:
A key consideration when reviewing a crime relates to timings. When was the crime planned? How long before the actual crime episode did the offender begin making preparations? How long did the post-crime activities continue? A matrix diagram could begin at any point in time before the crime occurred. However, owing to the dynamics in this case and for the sake of expediency, this diagram begins with the main crime phase: the attack on the victim. However, remember that the diagram's starting point may change on a case-by-case basis.
Results
Analytical strategy
A matrix diagram (Figure 1) was developed to visualise the pathways and highlight potential key critical points. These critical points are key nodes in the diagram where evidence could drastically influence the possibility of that pathway occurring. By mapping these out, the diagram enables a structured comparison between competing hypotheses and allows for an exploration of further investigative possibilities. The matrix diagram is a visual representation of the hypotheses and was refined to improve clarity and interpretation. In particular, repeated nodes in the diagram were identified. These nodes represent critical events integral to all pathways, but the time point in which they occur is unclear. These were distinguished from the other nodes by using colour (grey) and shape modifications. In addition, a dashed line was used to represent a second recurring group: the possibility that the offender returns to the BDS to further conceal the body. This group is hypothetical; it does not have to occur but instead is an important potential event that is relevant in all three hypotheses, regardless of the initial deposition day. To further support the interpretation and discussion of individual nodes, a numbering system was implemented. This allows each event to be easily referenced during discussion. Collectively, these refinements improve the diagram's value as an analytical tool, providing a structured foundation for investigation.
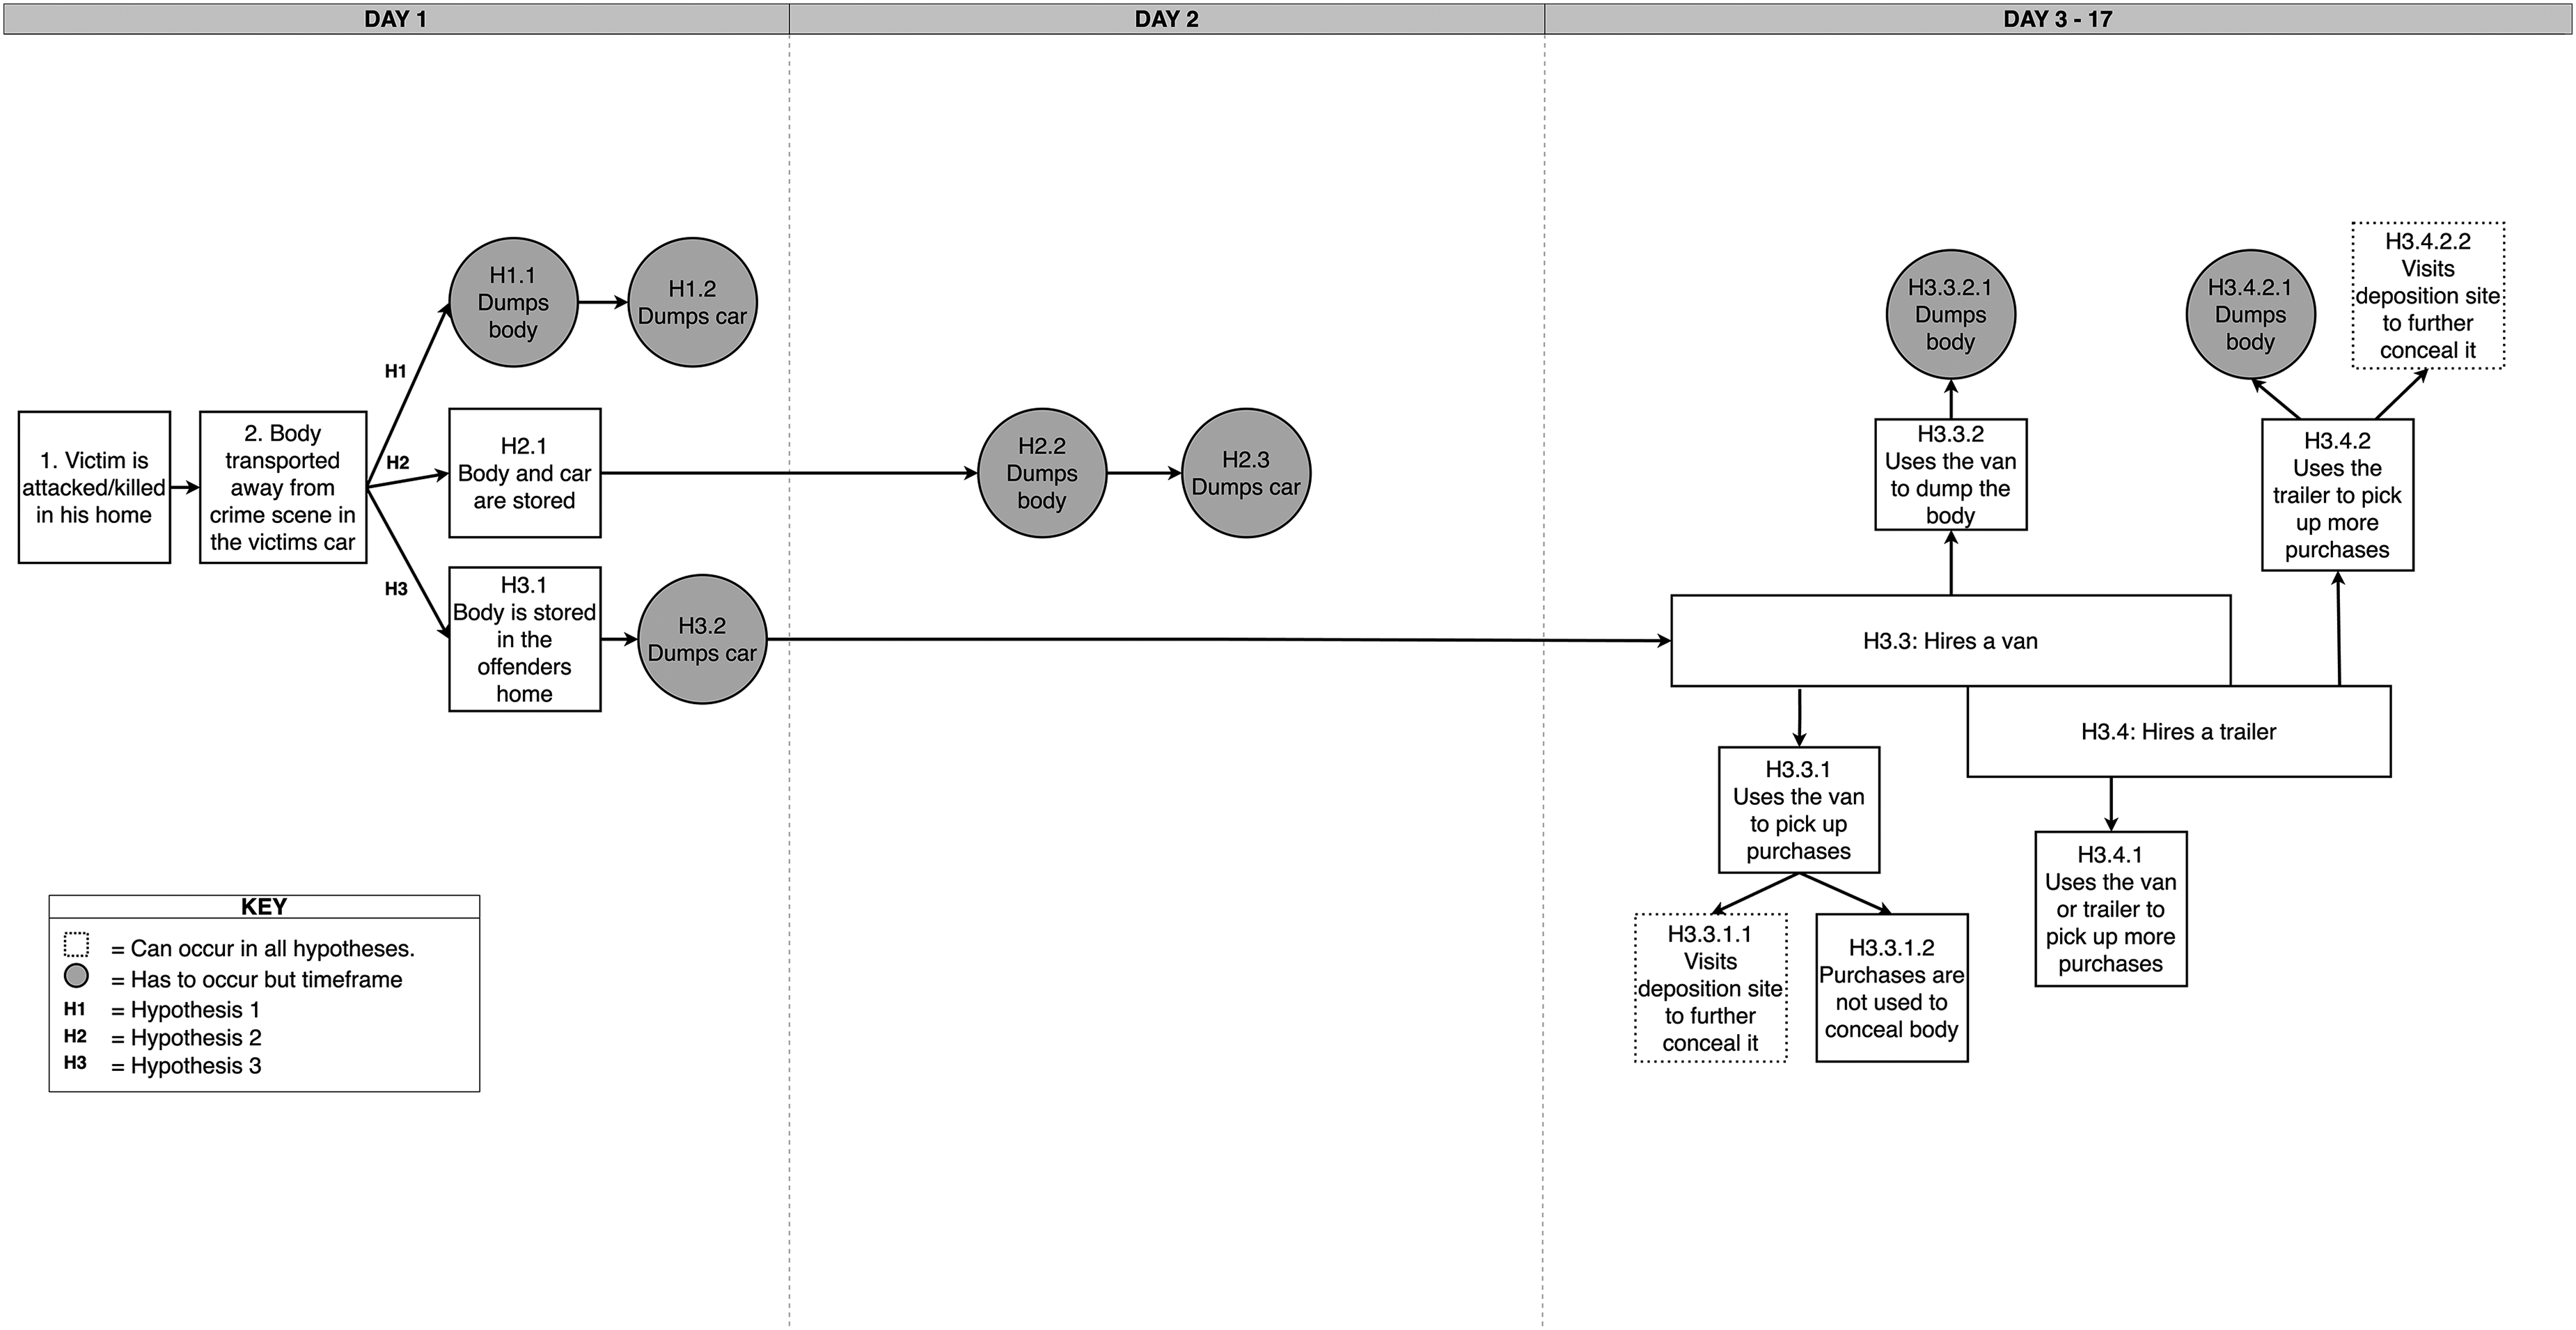
Matrix diagram showing the branching pathways for each hypothesis.
After the diagram was created, the evidence could be incorporated into an ACH table. However, during the completion of this table, it became apparent that the standard ACH table would not meet key goals for the case, and therefore, some adjustments were made (Table 1). Classifying individual evidence into “consistent” and “inconsistent” was useful for each hypothesis; however, it was clear that some of these pieces of evidence carried a higher investigative value 4 for the case-specific question, “Where is the body deposition site?” An addition to the table was created to individually consider the investigative value of the evidence for the hypotheses and the BDS. Essentially, does this line (row) of evidence specifically help locate the victim. In addition, it became clear that several potential rows of evidence did not have any results included in the files. The original investigation included requested tests on these items, but no results were included. This led to separate classifications of evidence into “evidence known” and “evidence unknown”. The reason to include the unknown evidence is to ensure that the potential implications of these results are clear. Lastly, the developed ACH also included a “prioritisation” column to simplify ranking the priority for further investigation and reviews. This column is only included in the refined version of the ACH table (Table 2). This ensures that only the evidence identified as potentially relevant to the hypotheses or BDS is considered for the priority ranking.
Figure 1, in its most basic interpretation, can be viewed as a flow diagram. Without any specialist training or statistical knowledge, it simply represents the possible behavioural pathways. Further examination of the nodes and pathways may help elucidate new leads or investigative opportunities in the case. The results here begin with the first hypothetical scenario: the victim is attacked/killed in his home (node 1). This scenario is presented as hypothetical because it derives solely from the suspect's confession to killing the victim there; but from an investigative standpoint it is not proven. In addition, the exact timing and location of the death have not been confirmed; therefore, framing it as a hypothesis helps to mitigate bias and encourages consideration of alternative possibilities if additional evidence were to emerge. This is crucial to remind investigators to seek alternative hypotheses throughout, even when confronted with a confession.
Each node can be explored for investigative considerations; for example, node 2: “Victim's body transported away from crime scene in the victim's car“. There is strong forensic and eyewitness evidence supporting this node, as well as the temporary disappearance and subsequent recovery of the victim's car. Given the strength of this evidence, this remains the primary sequence considered here. However, if new information were to emerge—such as confirmation that the offender had access to an additional vehicle at the time, with forensic testing revealing the victim's blood in that vehicle—this would require a reconsideration of the sequence. If new evidence emerged, rather than discarding the existing diagram and starting over, the most effective approach would be to integrate this new information by adding a branching pathway. This would allow for the development of new hypotheses while maintaining the integrity of prior investigative findings. The goal of the initial timeline reconstruction diagram is to present all pathways underpinned by some form of evidence. Pruning of pathways comes later. By incorporating additional nodes, investigators can explore alternative scenarios and refine their understanding of the offender's movements.
Nodes H1, H2 and H3
Here is where the hypotheses branch into separate pathways. This article outlines them individually.
Sequence H1
In the diagram, H1 is a straightforward timeline hypothesis: the offender kills the victim, transports the body in the victim's car to the BDS and subsequently abandons the car. However, while the sequence may seem simple, the investigative possibilities are far more complex. A key consideration is the direction in which the victim's car travelled from the crime scene. The vehicle was ultimately discovered ∼70 km (∼43.5 miles) north of the crime scene in a major city without the body inside. This raises several critical questions: did the offender deposit the body en route? Alternatively, did he first travel south, to a familiar and vast national park, to deposit the body before driving north to abandon the car? Could the BDS be located near the location of the victim's abandoned car? Each of these scenarios remains plausible within the seemingly simple sequence. To navigate these complexities, investigators can use ACH tables to systematically support, manage and facilitate the prioritising of possibilities by using additional sources of information or evidence (Table 1). For example, in Table 1, an eyewitness reports seeing the victim's car travelling south shortly after the crime. This observation has potential implications for the validity of H3. Further investigation into this lead could provide support for or challenge the hypothesis. It could also help prioritise locations for the BDS. Likewise, during an active investigation, leads like this should be prioritised for corroboration, collecting evidence to support or oppose the lead (CCTV, number plate recognition, dash cam footage, etc.), the collection of this evidence is vital for the development and analysis of hypotheses and can be very hard, if not impossible, to obtain as time goes by.
Full analysis of competing hypotheses table with evidence ranked as “consistent” or “inconsistent” against each hypothesis, this is then used to determine the investigative value of each based on two separate factors: (a) the day of deposition (hypotheses) and (b) the body deposition site
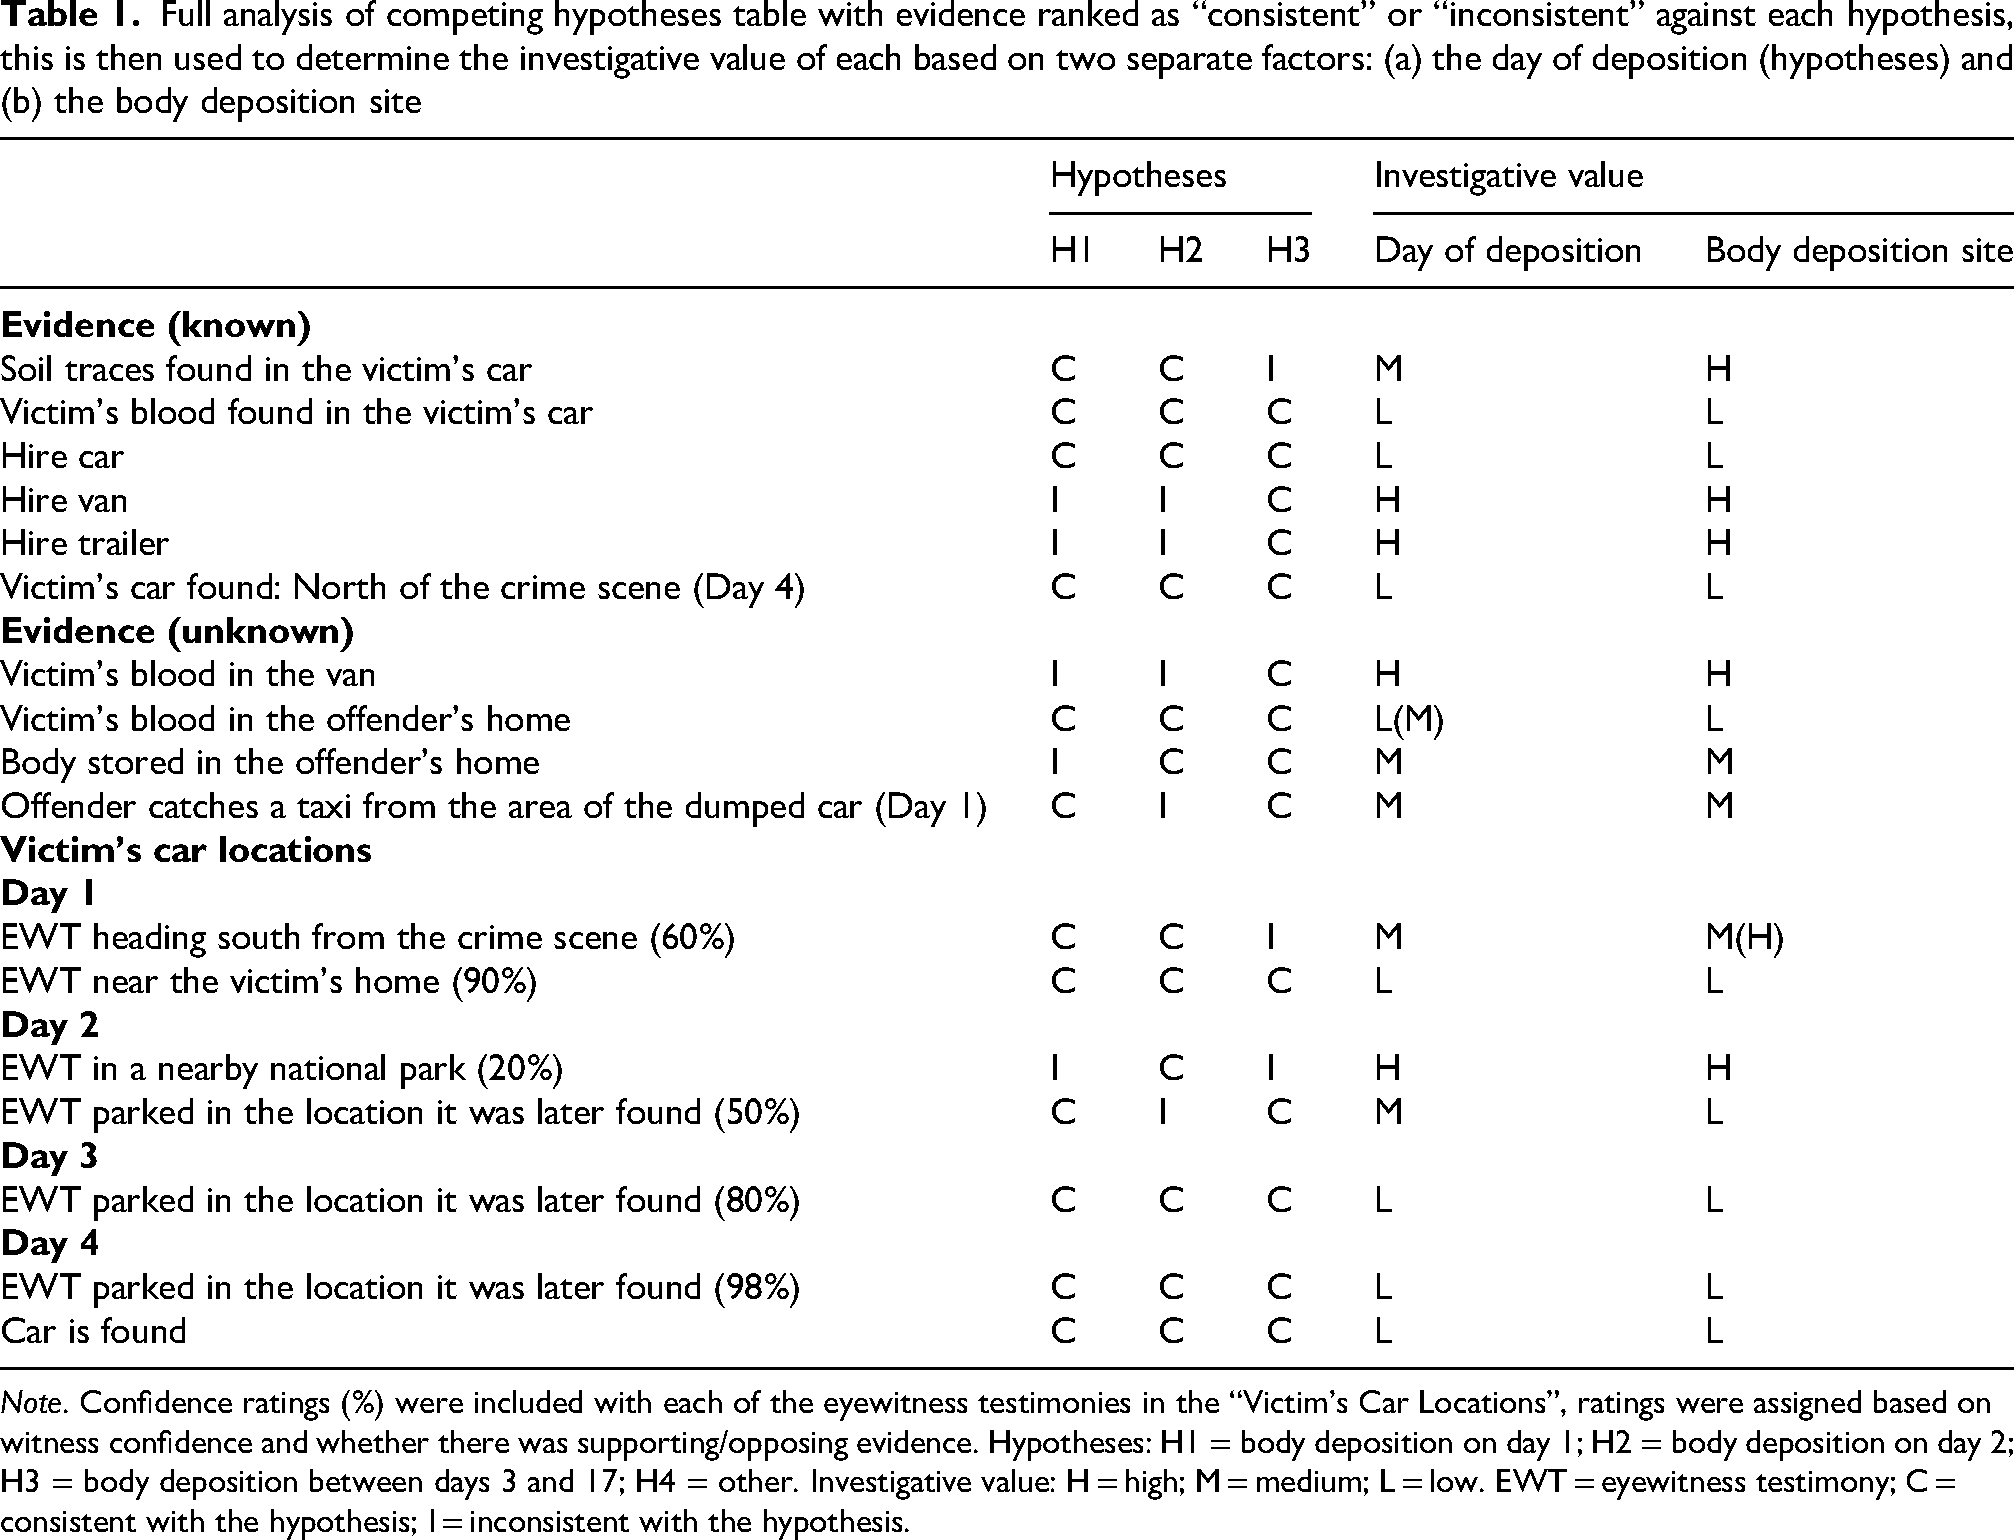
Note. Confidence ratings (%) were included with each of the eyewitness testimonies in the “Victim's Car Locations”, ratings were assigned based on witness confidence and whether there was supporting/opposing evidence. Hypotheses: H1 = body deposition on day 1; H2 = body deposition on day 2; H3 = body deposition between days 3 and 17; H4 = other. Investigative value: H = high; M = medium; L = low. EWT = eyewitness testimony; C = consistent with the hypothesis; I = inconsistent with the hypothesis.
Sequence H2
In this hypothesis sequence, the offender kills the victim, transports the body in the victim's car to an unknown storage location, returns to the car the next day, deposits the body and then abandons the car. This scenario introduces additional complexities compared with the first, particularly due to the temporary storage phase.
A sighting of the victim's car on day two initially provided some credibility to this hypothesis. However, conflicting eyewitness testimony suggests simultaneously that the car was seen parked at its final location prior to its official discovery on day three. This raises a critical challenge for investigators: how should they assess these contradictory accounts? Both eyewitness testimonies hold medium–high investigative value for the hypothesis, yet neither is independently corroborated. To further evaluate these claims, investigators could scrutinise the locations in question. One sighting places the car within the national park, a location also known to the offender, suggesting a potential BDS. A search of this area was negative. However, further avenues of enquiry remain. By identifying their potential importance, investigators can consider what additional evidence could support or refute this eyewitness testimony.
Similarly, the eyewitness account of the abandoned car parked at its final location directly contradicts the national park sighting. This raises another key question: what types of evidence could corroborate or discredit this claim? By systematically gathering and evaluating available data, investigators can work towards resolving these inconsistencies and refining their hypotheses. The ACH table (Tables 1 and 2) allows investigators to easily identify and prioritise these key areas for evidence collection and ultimately aims to assist with the investigation process.
Sequence H3
In this hypothesis, the offender kills the victim and transports the body in the victim's car to his (the offender's) house, where it is temporarily stored. The offender then abandons the car north of the crime scene. The next sequence of events that may have investigative relevance in this timeline occurs between days 3 and 17, when the offender hires a van and a trailer and makes some unusual purchases that remain unexplained. This hypothetical timeline clearly highlights investigative leads, pathways and questions, such as:
Does the offender use the van to deposit the body? Does the offender use the van to pick up the purchases? Does the offender use the van to visit the BDS? Does the offender use the trailer to deposit the body? Does the offender use the trailer to pick up the purchases? Does the offender use the trailer to visit the BDS?
It is important to note that the later post-crime events in H3 include the possibility that the offender returns to the BDS, likely intending to further conceal the body. This suggests that evidence related to the hire van, trailer and unexplained purchases remain significant for the BDS, regardless of the exact timing of the initial disposal. Analysing these elements may provide critical insights into the offender's movements, actions and possible attempts of detection avoidance.
Complexities in the timeline can be seen in H3.3 and H3.4 (Figure 1), which overlap temporally. This overlap is illustrated to show the sequential order of the events but also highlights the temporal overlap between them. For example, if new evidence was found that clarified the offender's reasoning behind switching from a hire vehicle to a hire trailer. In that case, the matrix diagram easily shows the ordering of these events and the branches that lead from them. For example, a Google search could show that the offender read about GPS tracking on hire vehicles, and then the following day, hired a trailer. The trailer would be elevated in priority as a potential lead for the BDS.
Nodes H3.3.1.1 and H3.4.2.2 only appear in H3 because the cluster of events from which they stem occurs later in the post-crime phase. However, these two nodes are important because they remind investigators that these events can be considered in all hypotheses; the offender could use the hire van, hire trailer, or suspicious purchases to further conceal the body at the BDS, even if the body has already been deposited. These nodes consider that the offender could visit the BDS post crime, and therefore, the cluster in H3 is important regardless of when the body is deposited.
Analysis of competing hypotheses
Figure 1 provides visual outlines of the case; however, it leads to many more questions than it answers. Each hypothetical pathways contains follow-up hypotheses. This shows the complexity of cases and highlights the need for a method that can “prune” (reduce) the number of pathways.
The ACH table (Table 1) presents selected evidence from the case and evaluates whether it is consistent or inconsistent with each hypothesis. To maintain the integrity of the investigation, the evidence has been deliberately limited in detail and scope, because the case remains cold. The table assesses the investigative value (high, medium or low) of each piece of evidence across two factors: (a) its relevance to the hypothesis—the when; and (b) its relevance to the BDS—the where.
The investigative value reflects whether the evidence is consistent or inconsistent with each hypothesis and how meaningful it is regarding BDS information. For example, as shown in Table 1, the presence of the “victim's blood in the victim's car” holds a low investigative value for distinguishing between the hypotheses. This is because all three hypotheses include transportation of the victim's body in the victim's car, making the evidence equally consistent across them. This is not to say that blood in the car is not important from an investigative standpoint (it clearly was), but for the purposes of finding the victim, it is not as important now. Figure 1 further supports this by illustrating that all pathways stem from this common event. This consistency in all three hypotheses minimises the probability that the victim was moved from the crime scene in another vehicle or that the victim is still around the crime scene and was not transported at all.
However, evidence can sometimes include important caveats, particularly when dealing with unknown or ambiguous findings. Consider the example of “Victim's blood in the offender's home”. Even if forensic analysis confirms that the blood traces originate from the victim, they do not necessarily support only H3, which posits that the victim's body was temporarily stored in the offender's home. The presence of the victim's blood could align with all three hypotheses, regardless of whether the body itself was stored at that location. Transfer of blood by the offender to their home is consistent with all three hypotheses, thus the value of DNA evidence is not useful in determining the hypothetical timelines. The investigative value of this evidence may depend on additional related factors, such as the quantity of blood present. Given the significance of this caveat, a distinct investigative value was assigned in the ACH table to reflect its conditional relevance. The evidence is rated a value of low–medium (L(M)), indicating that although it is consistent with all hypotheses, its investigative value may increase with further follow-up investigation, for example, through further forensic testing or witness and suspect interviews.
In addition, through the application of ACH to homicide investigations and cold cases, a necessary addition was developed: the need for an additional column assessing the investigative value of the individual evidence in relation to the BDS. An example of this is the “soil traces found in the victim's car”. If it is determined that the soil likely originates from the BDS, this evidence cannot effectively differentiate between H1 and H2, because both hypotheses involve the car being abandoned after being used to deposit the body. However, this evidence could reduce the likelihood of H3. In this context, the soil traces hold a high investigative value for determining potential BDS, even if the relative value in distinguishing between hypotheses remains limited.
The addition of an investigative value column for the BDS within the ACH table represents the adaptability of the method. In investigations, there is sometimes a large amount of evidence that could be tested. To deal with this, investigators must prioritise. Adding this to the ACH allows the decision-making process to be structured explicitly and reviewed later, if necessary. It may lend itself to later research purposes in terms of biases of investigative value ranking.
In Table 2, the full version of the ACH table (Table 1) was refined to only include evidence with a medium or high investigative value for the two factors: day of deposition and BDS. This streamlines the focus of the table and allows for effective prioritisation of the leads. ACH tables are refined to improve the accuracy and clarity of ambiguous evidence; it is a typical but important step in strengthening the analysis. The evidence with a low investigative value for both factors was hidden during the refinement process, rather than focusing only on “hiding” the evidence that was consistent with all hypotheses.
Refined analysis of competing hypotheses table
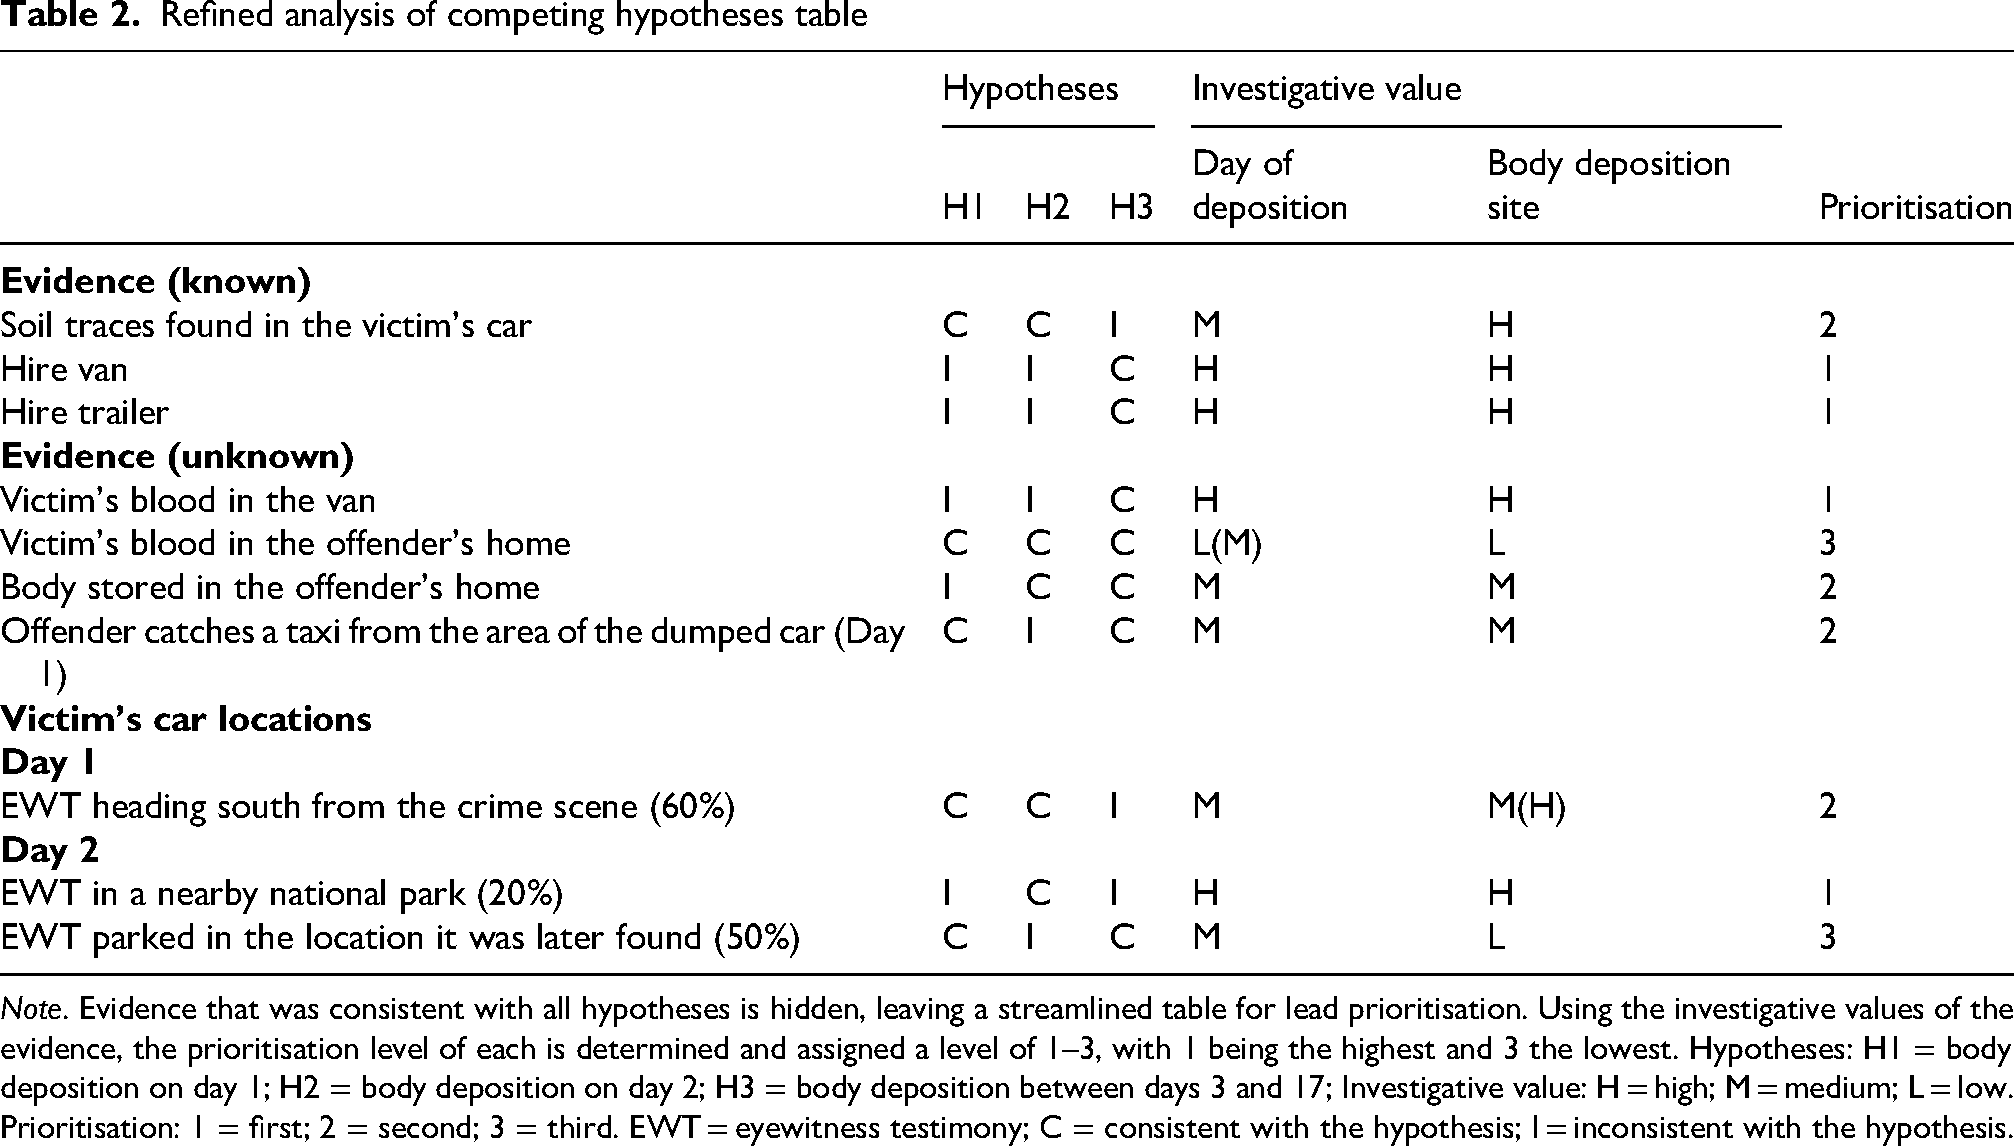
Note. Evidence that was consistent with all hypotheses is hidden, leaving a streamlined table for lead prioritisation. Using the investigative values of the evidence, the prioritisation level of each is determined and assigned a level of 1–3, with 1 being the highest and 3 the lowest. Hypotheses: H1 = body deposition on day 1; H2 = body deposition on day 2; H3 = body deposition between days 3 and 17; Investigative value: H = high; M = medium; L = low. Prioritisation: 1 = first; 2 = second; 3 = third. EWT = eyewitness testimony; C = consistent with the hypothesis; I = inconsistent with the hypothesis.
Discussion
The aim of this article was to illustrate how a combined approach—mapping sequences and organising competing hypotheses—can facilitate a comprehensive cold case and major crimes analysis and assist the prioritisation of investigation leads. To show how this approach can be applied, an example of a NBH case was used. In this case, the pathways were structured into three distinct hypothetical timeline sequences. Although the current case involved the search for a hidden body, the analytical approach can be applied to many other major crimes and cold cases. To this extent, the analyses provided here are not necessarily any different from what already happens in such cases. The main advancement shown here is the explicit structuring of these processes. For example, the matrix diagram aids in visualising the events leading to the when of case reviews, thereby facilitating the investigation into both the when and thus perhaps the where. The ACH table further enhances this process by organising and prioritising evidence in relation to each hypothesis, the “what” of the case. A key strength of this approach is its inherent flexibility. It is designed to adapt dynamically to new information, evolving to the necessities of each case. Although this article focuses on an NBH case, the investigative value could also apply to other major crimes investigations, including homicides, equivocal deaths, and missing persons cases. In homicide investigations, this approach may support the analysis of crime phases, including suspect and victim movements. In cases of equivocal death, where the manner of death remains uncertain, matrix diagrams can assist by visually structuring multiple scenarios (e.g., accident, suicide, homicide), while ACH provides a framework for evaluating what evidence is consistent or inconsistent with each hypothesis, giving evidence-based reasoning for investigative decision-making. Similarly, in missing person investigations, this method may help the comparative analysis of temporal, behavioural, and environmental evidence to assess competing outcomes, such as, voluntary absence, accidental death, or third-party involvement. Across these contexts, the approach helps promote transparent analysis and support the prioritisation of investigative leads through structured, evidence-based reasoning.
The aim of cold case reviews is to generate new leads. The matrix diagram and ACH approach may assist with this. For example, in the current case it may become known that the offender hired a second trailer shortly after the first; using this second trailer, he picked up building materials that remain unexplained. Instead of starting from the beginning again, the additional information can be incorporated directly into the existing diagram. These new nodes fit sequentially into H3. The diagram is now more complex, but an abundance of new questions and investigative pathways can be identified. These additions to the matrix diagram can also be included in the ACH process to further prioritise whether they add investigative leads or substantive value. This analytical process, although seeming to take time, may actually expedite investigations by allowing investigators to consider which leads are more important moving forward. In the case presented, the ACH table and the matrix diagram can support the decision-making process regarding which leads to prioritise. For example, the refined ACH table (Table 2) identifies the “hire van” and “hire trailer” as holding a high investigative value and therefore a high level of prioritisation for the case. This suggests that all leads connected to the van and trailer could be re-assessed and exhibits re-examined, further supporting the discussion of resource allocation.
Furthermore, during an active investigation or review, some of the leads may seem obvious to senior police investigators, but for training purposes, this approach can be used to help less-experienced investigators. In addition, explicitly showing the hypothetical construction and decision-making allows for clearer feedback to be given. Novice officers must “show their working” and therefore create opportunities for more tailored guidance and development. While this may initially take more time, it may also lead to more streamlined, effective investigation approaches in the long run. Leads like the eyewitness testimonies should be prioritised for corroboration, collecting evidence to support or oppose the lead (e.g., CCTV, number plate recognition, dash cam footage, etc.). The collection of this evidence is vital for the development and analysis of hypotheses and can be very difficult, if not impossible, to obtain as time passes.
In addition, a potential application of this approach to cold case reviews is that it can prioritise which cases have further avenues of enquiry that may lead to supporting or refuting hypotheses, ultimately aiming to close cases. Solvability is a central issue in police resource management. Prioritising cases is a difficult process. A “desktop solvability strategy” wherein reviewers can come together to review the facts, evidence, and hypotheses of their cases and then see which are more solvable may be done using the framework provided here. This approach provides an explicit, clear, structured basis for prioritising which case to pursue when there are several cold cases.
While matrix forecasting encourages the use of top-down, expertise-driven input, the current method provides a critical lens through which hypotheses are formed and “tested” against evidence. The ACH diagram approach is based on thorough case reviews and alternative pathways are hypothesised based on information in the case in the first instance. Through analysis and the “Alexander question”, which encourages investigators to consider what other evidence may become known that would affect the hypotheses, a comprehensive list of hypothetical pathways is developed and the constant revision of hypotheses-to-evidence is what elevates this process from a “brainstorming” session into a more applied approach (Keatley, 2025a). The investigative value, therefore, is in better training investigators to conduct more thorough, critical analyses. Although this may appear to take more time initially, it may expedite reviews if the case goes cold. It also becomes a method that may train a more investigative mindset (Keatley, 2025a, 2025b; Oatley et al., 2020). In some cold cases, where information is minimal or unknown, producing a fully developed diagram is not feasible because the number of possible pathways is too great—this situation underlines how the method can be used in terms of solvability assessments. Nonetheless, the method retains value even in situations where data or evidence are limited.
This approach can be used as a training tool, enabling academic and law enforcement students to practice structured hypothesis generation, critically evaluate case files, and identify opportunities in the original investigation where information gathering could have improved the investigative outcomes of the case. A limitation of the current research is, of course, that it is a single case review. To focus too strongly on this issue, however, would be to miss the aim of the article, which was to provide a review of how ACH could be combined with matrix diagrams, which can be used in various cases. This is akin to statistical modelling that uses “dummy data” to show how a statistical technique works. Rather than apply this newly developed ACH matrix diagram meta-approach to real cases prematurely, it is prudent to provide a blueprint that other academics and experts can develop before procedural deployment. In that vein, it is hoped that academic and practitioner audiences see the value and perhaps how to develop and improve it. Future research may consider weighting options of evidence and assessing substantiveness, as well as establishing best-practice guidelines for applying the approach in investigations. Furthermore, refinements for case types may be necessary to make the process more streamlined. Further integration with methods like matrix forecasting may also help make hypothesis generation more explicit and thus help reduce biases. Similarly, the sequential unmasking process may be beneficial to the development of hypothesis generation.
Although the method incorporates a structured bias-reducing framework, it is important to acknowledge that bias can never be fully eliminated. Analysts, investigators, and reviewers must remain aware of their own bias, actively questioning their own assumptions and interpretations, and avoid over-reliance on the framework as a sole safeguard against bias. Furthermore, in the context of cold case reviews, this bias awareness must extend to the original case files, which may reflect the investigative priorities and assumptions of earlier investigators. Maintaining a constant awareness of potential influences is essential to ensure an investigation is thorough and all scenarios can be considered.
Conclusions
Major crimes and cold cases in particular can often be stalled by a seeming abundance of hypotheses. Many detectives and investigators are very capable of “brainstorming” hypothetical timelines. What is often required is an approach that reduces the complexity and narrows the focus of an investigation. The current sequence–ACH approach allows for structured analysis of cases. Owing to the novelty of the combined approach and the development of the ACH, this article provides an overview rather than real-world direct case review. It is hoped that academics and practitioners in the area will see the potential and further develop and corroborate the approach across various cases.
Footnotes
Funding
The authors received no financial support for the research, authorship, and/or publication of this article.
Declaration of conflicting interests
The authors declared no potential conflicts of interest with respect to the research, authorship, and/or publication of this article.
CRediT roles
Conceptualization: CS, KB, DK; Data curation: CS, KB, DK; Formal analysis: CS, KB, DK; Funding acquisition: N/A Investigation: CS, KB, DK; Methodology: CS, KB, DK; Project administration: CS, DK Software: CS Resources: CS Supervision: DK Validation: KB Visualization: CS Writing – original draft: CS, KB, DK; Writing – review & editing: CS, KB, DK.