
Abstract
The current researches of metaverse have focused mainly on data management, security, networking, and 3D modeling. The deployment of 3D data visualization in metaverses for entrepreneurship applications has not been studied. To review metaverse and data visualization technologies and propose a novel method of combining 3D data visualization with exploratory analysis using artificial intelligence (AI) and ontology for data analysis and visualization in the metaverse. The research methods include exploratory reviews of metaverse and data visualization technologies, and case studies as a proof of concept of the proposed model. The review results of existing data visualization are devoid of an analytical process, are inflexible for customization, have no collaborative data interaction or evaluation, and are lack of guidance of using those tools. Artificial intelligence models, 3D visualizations, metaverse, and ontology-based AI chatbots have been proposed to solve these problems respectively. The case study demonstrates the effectiveness of these methods to guide users on 3D data visualization collaboratively to generate insights and recommendations. The research impacts are using ontology to structure the data, an AI chatbot in metaverse to explain the analysis, and a 3D data visualization in metaverse for improving collaborative work and insight generation.
Key messages
WHAT IS ACKNOWLEDGED ON THIS TOPIC
The metaverse is a future Internet technology for business collaboration. It provides avatars, 3D objects, and immersive technologies for users to interact and collaborate with. Meta-entrepreneurship creates a virtual environment in a metaverse. It enables users to create virtual stores and operate businesses to overcome human, time, and space boundaries. However, conventional data visualization has two dimensions and uses predefined visualization templates. The identified pattern does not associate with data visualization for insight creation. It does not provide guidance on collaborating, evaluating, interacting, manipulating, or analyzing data in a virtual environment. Therefore, this study reviews metaverse technologies and develops 3D data visualization in a metaverse that enables multi-dimensional data evaluation, interaction, and manipulation. The ontology was designed as a knowledge base for users to select and customize data for analysis, and to guide inexperienced users on data evaluation, collaboration, manipulation, and interaction. Artificial intelligence (AI) models have identified and associated new knowledge regarding 3D data visualization for insight creation. The reviews and conceptual framework of ontology-based AI 3D data visualization help readers to understand the state-of-the-art metaverse technologies; learn how to apply ontology and AI to 3D data visualization to overcome the limitations of the conventional 2D data visualization for data evaluation, collaboration, manipulation, interaction, and analysis in a collaborative environment; and create collective intelligence. The case study demonstrated as a use-case for lesson learnt.
WHAT THIS STUDY ADDS
HOW THIS STUDY MAY AFFECT META-ENTREPRENEURSHIP DEVELOPMENT
Introduction
A metaverse is a virtual universe with persistent, shared, interactive, and 3D virtual spaces. It reduces operational costs, increases effectiveness, and provides richer and more personalized user experiences than online stores (Dincelli and Yayla, 2022). This enables users to evaluate remote areas (Dwivedi et al., 2022), work collaboratively with identical goals, and share concepts in the virtual world (Huang and Jin, 2022). It is an interoperable and highly scalable network that enables an infinite number of participants to share their experiences simultaneously and maintain the continuity of data including the identity, history, transactions, communications, and entitlements in the virtual world (Matthew, 2022). To make the virtual world interoperable and scalable, researchers have focused mainly on data management, data privacy, and networking (Wang et al., 2022). Virtual reality (VR), augmented reality (AR), mixed reality (MR), digital twins, and AI are a few of the current popular topics related to the metaverse (Alimamy and Jung, 2024; Bartoli et al., 2024; Li and Li, 2024; Šímová et al., 2023; Singh, 2024). However, the metaverse applications and 3D collaborative content development for businesses is insufficient. Many researchers mainly discuss how to deploy the metaverse for business opportunities and innovation. They debate the advantages, disadvantages, and challenges of deploying the metaverse in businesses (Firmansyah and Umar, 2023; Tomini et al., 2024). However, the unique features of 3D visualization in metaverse environments have not been mentioned. The metaverse enables users to view the visualization in a 3D format for multi-dimensional data correlation. VR, AR, MR, and extended reality (XR) provide immersive experiences to users for collaborative work and intelligence. By combining it with ontology and AI, it can capture human intelligence and use an AI chatbot to provide guidance for users to navigate and analyze data.
Therefore, this research aims to present a case study to demonstrate how to design 3D data visualization content for users to gain data interaction, manipulation, and a collaborative experience in a metaverse for business analysis. The research objectives are to review the metaverse and data visualization technologies; propose a novel method of combining ontology, AI, and 3D data visualization for data exploration, visualization, manipulation, and interaction in the metaverse; and conduct a case study for proof of concept. The contributions of this study are that readers can learn how an ontology can be used for data evaluation, manipulation, customization, and visualization, and how an ontology interface is used for selecting the data for data evaluation, manipulation, customization, and visualization. Second, we demonstrate how AI can be used to analyze and associate observations in 3D data visualization for insight creation and recommendations. Third, it allows for metaverse collaborative work to create collective intelligence among groups of individuals in different spaces. Ontology-based AI 3D data visualization overcomes the limitations of existing data visualization methods for the collaborative data customization, interaction, and evaluation of insight creation.
The following sections discuss related studies on data visualization and metaverse technologies. Results section describes the research methodology. Case study for proof-of-concept section reviews the strengths and limitations of the underlying data visualization technologies and presents a novel method for ontology-based AI 3D-data visualization. Conclusions and future work section discusses a case study on how 3D data visualization in the metaverse improves data customization, manipulation, evaluation, interaction, analysis, collaboration, and personalized recommendations. Finally, the conclusions and future work are discussed.
Related work on data visualization
Data visualization provides graphical representations of data to identify patterns, trends, and business insights. Data visualization tools are classified into static comparison, user interaction, trend analysis, and programming (Lavanya et al., 2023). Static comparative visualization focuses on using bar charts, line graphs, scatter plots, heat maps, tree maps, and network diagrams to show the similarities and differences between datasets and enable direct comparison (Fox and Hendler, 2011). User-interactive visualizations such as D3.js, Tableau, Power BI, and Google Data Studio overcome the limitations of static comparison and use clicking, sliding, and hovering to reveal more information from charts or graphs (Qin et al., 2020). Trend analyses such as time-series analysis, R's ggplot2 package, and Google Trends analyze data trends rather than comparing datasets (Qin et al., 2020). However, these visualization tools require user experience to interpret the data and create business insights. Programming visualization (Ahammad Fahad and Yahya 2018) such as R, Python, Matplotlib, Seaborn, and Plotly can overcome these limitations. It focuses on integrating data analysis and interpretation to generate business insights and provides detailed and interactive visualizations, rather than visualizing only trends and patterns.
However, limited knowledge to use these visualization tools are the major problem of users. In addition, an effective visualization tool should be clear, simple, and consistent in its design and contextual relevance. It should support users in customizing and manipulating data and work collaboratively to create collective intelligence for decision-making (Franconeri et al., 2021). Ontologies and AI are new technologies that can be integrated into existing data visualization tools to provide a contextual knowledge base (Lau, 2009) for data analysis and structure the information in a hierarchy for dataset comparisons, pattern co-relations, data annotations, and interpretations. By using it with a chatbot in metaverse, users can understand how to analyze and visualize data. It also overcomes time and space barriers to manipulate, customize, and interact with 3D data objects via VR/AR/MR/XR for collaborative work and decision-making (Fu et al., 2022).
Therefore, this research used these novel technologies to develop an ontology-based AI 3D data visualization model in metaverse to overcome the limitations of the existing data visualization methods. An ontology was used to structure the data for analysis and user interaction. An AI chatbot in metaverse was used to explain the analysis. A 3D data visualization in metaverse was used for improving collaborative work and insight generation. These novel visualization technologies are reviewed in the following chapters.
Technologies for meta-entrepreneurship business
Entrepreneurship can be defined as the use of innovation and entrepreneurial and management skills to develop, organize, and operate a business enterprise (Diandra and Azmy, 2020). Since the 2019 COVID-19 pandemic, online meetings have become a new human behavior and company working practice. These transitions have attracted widespread attention to the use of metaverses in new business entrepreneurship (meta-entrepreneurship) (Fu et al., 2022). Virtual entrepreneurship adopts Internet technologies to develop a virtual office for business operations (Badiuzzaman, 2016; Fox, 2024). Meta-entrepreneurship is defined as the operation of a business in the metaverse. It adopts virtual entrepreneurship technologies and adds a meta-layer on top, such as 3D objects; ontology; AI chatbots; immersive technologies; and the analytics of emotion, text, audio, video, and social media, to enhance human interaction, collaboration, and immersive experience.
Improving communication in a virtual environment by AI and emotion detection
Metaverse enables users to use their avatars to shake hands, hug, dance, and express emotions (Park et al., 2021). Facial expressions and body movements reflect on the avatar to provide an immersive user interaction and communication experience (Luan et al., 2024). However, the network bandwidth, computational time, and privacy issues pose challenges (Abbas et al., 2018; Uddin et al., 2023). Although edge-computing technologies can improve the image-processing time, these require substantial computational resources to simultaneously detect avatar emotions (Muhammad and Hossain, 2021). A decentralized parallel or distributed edge-computing AI method could be a solution (Chen et al., 2019). However, these technologies are still under development.
Improving realistic communication by ontology and emotional AI chatbot
Text analyses such as large language models, natural language processing, name entity recognition, n-grams, and sentiment analysis are other techniques used for emotion detection. However, the limitation of text analysis is its requirement for massive computational resources; context dependence in human conversation; and CPU time to understand, analyze, and compute the questions for responses. Synonyms, context domains, and the semantic meaning of text are other problems that make conversations ambiguous. Therefore, an ontology-based emotional AI Chatbot structures the conversation hierarchy and analyzes conversations in a manner similar to that of humans (Lau, 2009). This enhances the accuracy of the text analysis and realistic communication.
Improving user interaction and data manipulation by metaverse's immersive technologies
VR, AR, MR, and XR are real-time immersive metaverse technologies. It integrates humans and machines in two worlds to generate a realistic experience for users. Users can touch and manipulate 3D objects. However, these technologies require considerable computational power, network bandwidths, and secure networks for image analysis and data transmission. Furthermore, the metaverse requires the creation of many 3D objects. Moreover, their movement may cause network delay because of the limited bandwidth supply. Although 6G technology, a decentralized cloud environment, AI, and image compression techniques could be solutions (Aslam et al., 2023), these require another 2 years for development.
Improving collaborative work by 3D data visualization for collective intelligence
3D visualization provides multi-dimensional combinations of data for customization and evaluation and thereby, makes business data conveniently understandable. Users can filter, select, and integrate information for business analysis and create collective intelligence such as Wikipedia (Lau, 2009). Users from different backgrounds and data sources can gather for data selection, integration, comparison, and evaluation (Zhao et al., 2022). However, mapping data into a standardized and hierarchical view remains unclear. In the following paragraphs, the existing data visualization methods are reviewed.
Strengths of the existing data-visualization tools
Data visualization uses quantitative or qualitative data to produce graphs or charts that reflect the underlying information for better data understanding, evaluation, investigation, and communication (Azzam et al., 2013). Data visualization of the robust human perceptual system helps decision-makers comprehend data, reveal its patterns and relationships, evaluate information rapidly, and identify issues and deficits (Luo, 2019). How well and rapidly an organization obtains insights from the collected data determines the success of its visualization tool.
Limitations of the existing data-visualization tools
However, DV is typically a scientific analysis rather than an exploratory tool (Fox and Hendler, 2011). Researchers (Batch and Elmqvist, 2017) considered data visualization as a communication tool for presenting results. It is used infrequently in analytical processes (Qin et al., 2020) and is separate from other computational tools. The commonly used data visualization tools are declarative languages and GUI-based tools. Although GUI-based tools use the direct manipulation principle to design visualizations with more user-friendly features (Qin et al., 2020), these have limited templates and are not sufficiently flexible to modify the graph details (Qin et al., 2020). Users need to use declarative visualization languages to fine-tune or re-implement the desired visuals. Third, most current data visualization products do not provide sufficient data for interaction, evaluation, and collaboration (Franconeri et al., 2021). Users cannot evaluate, manipulate, interact with, or discuss data collaboratively. Finally, the data visualization provides only 2D data points for correlation. Certain hidden patterns in multiple dimensions cannot be visualized. Therefore, a 3D data visualization tool integrating analytical tools in the metaverse is required to enable user-defined visualization and engage in data interaction and collaboration.
Using metaverse to improve collaborative work, data manipulation, and personal customization
The metaverse strongly emphasizes the importance of collaboration and communication (Dwivedi et al., 2022). This enables individuals from different places to view each other in the virtual world, thereby facilitating communication. Multiple users manipulate and edit objects collaboratively by modifying their properties, positions, or orientations. Any user-created element is maintained, altered, or shifted by other users using VR goggles or hand gloves. This creates new value during work collaboration and sharing (Dwivedi et al., 2022). Users can rotate the 3D-visualization product by 360° to obtain the desired view of the environment (Park and Kim, 2022; Sharma et al., 2020). This enables their imagination and immersion (Kovacova et al., 2022) to obtain new knowledge and retain their learning (Sharma et al., 2020).
Using AI and 3D data visualization in the metaverse to improve data evaluation, interaction, and collaboration
Metaverse has attracted widespread attention for business applications owing to its 3D data evaluation, interaction, manipulation, and collaborative capabilities (Fu et al., 2022). The additional Z-axis in 3D objects provides higher-dimensional data for visualization and correlation analysis (Zhao et al., 2022). Users can analyze 3D data from different perspectives collaboratively (Sharma et al., 2020) and identify how multi-dimensional data can be correlated, which 2D data visualization cannot achieve (Cota et al., 2017). To integrate the analytical process into data visualization for effective insight creation, AI can be used to identify and associate hidden patterns in a 3D visualization. However, the limited guidance on how to evaluate, analyze, and interact with 3D data is a problem. Therefore, an ontology based on an AI chatbot provides a knowledge base for users (Lau, 2009; Lau et al., 2009) to guide them in data evaluation, interaction, and collaboration.
Using AI and emotion detection and chatbot in the metaverse to improve personalized recommendations
Unlike conventional data visualization tools, the metaverse can dynamically use AI and its immersive technologies such as VR Google and hand gloves to capture more hidden physiological and human behavioral data such as user clicks, eye movements, trajectories, emotions, searches, and user preferences (Asensio et al., 2014; Dwivedi et al., 2022; Sharma et al., 2020; Zhao et al., 2022); identify underlying patterns for analysis; and predict users’ need for personalized recommendations (Batch and Elmqvist, 2017; Zhao et al., 2022) and situational awareness (Sharma et al., 2020). An ontology can also be used as a knowledge base in conjunction with an AI chatbot to guide inexperienced users in customizing and personalizing data and collaborative work.
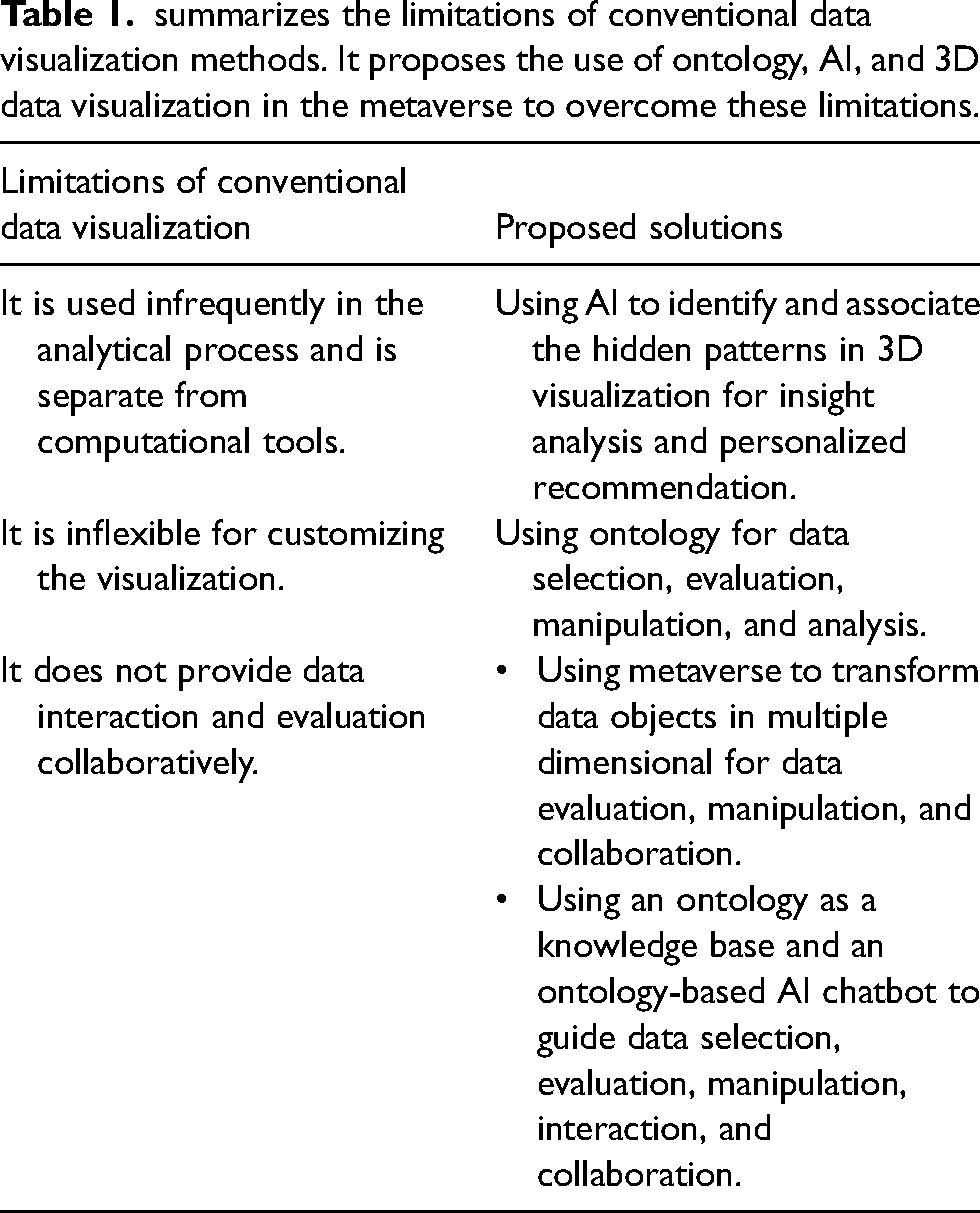
Table 1 Limitations of the conventional data visualization methods and the proposed solutions
summarizes the limitations of conventional data visualization methods. It proposes the use of ontology, AI, and 3D data visualization in the metaverse to overcome these limitations.
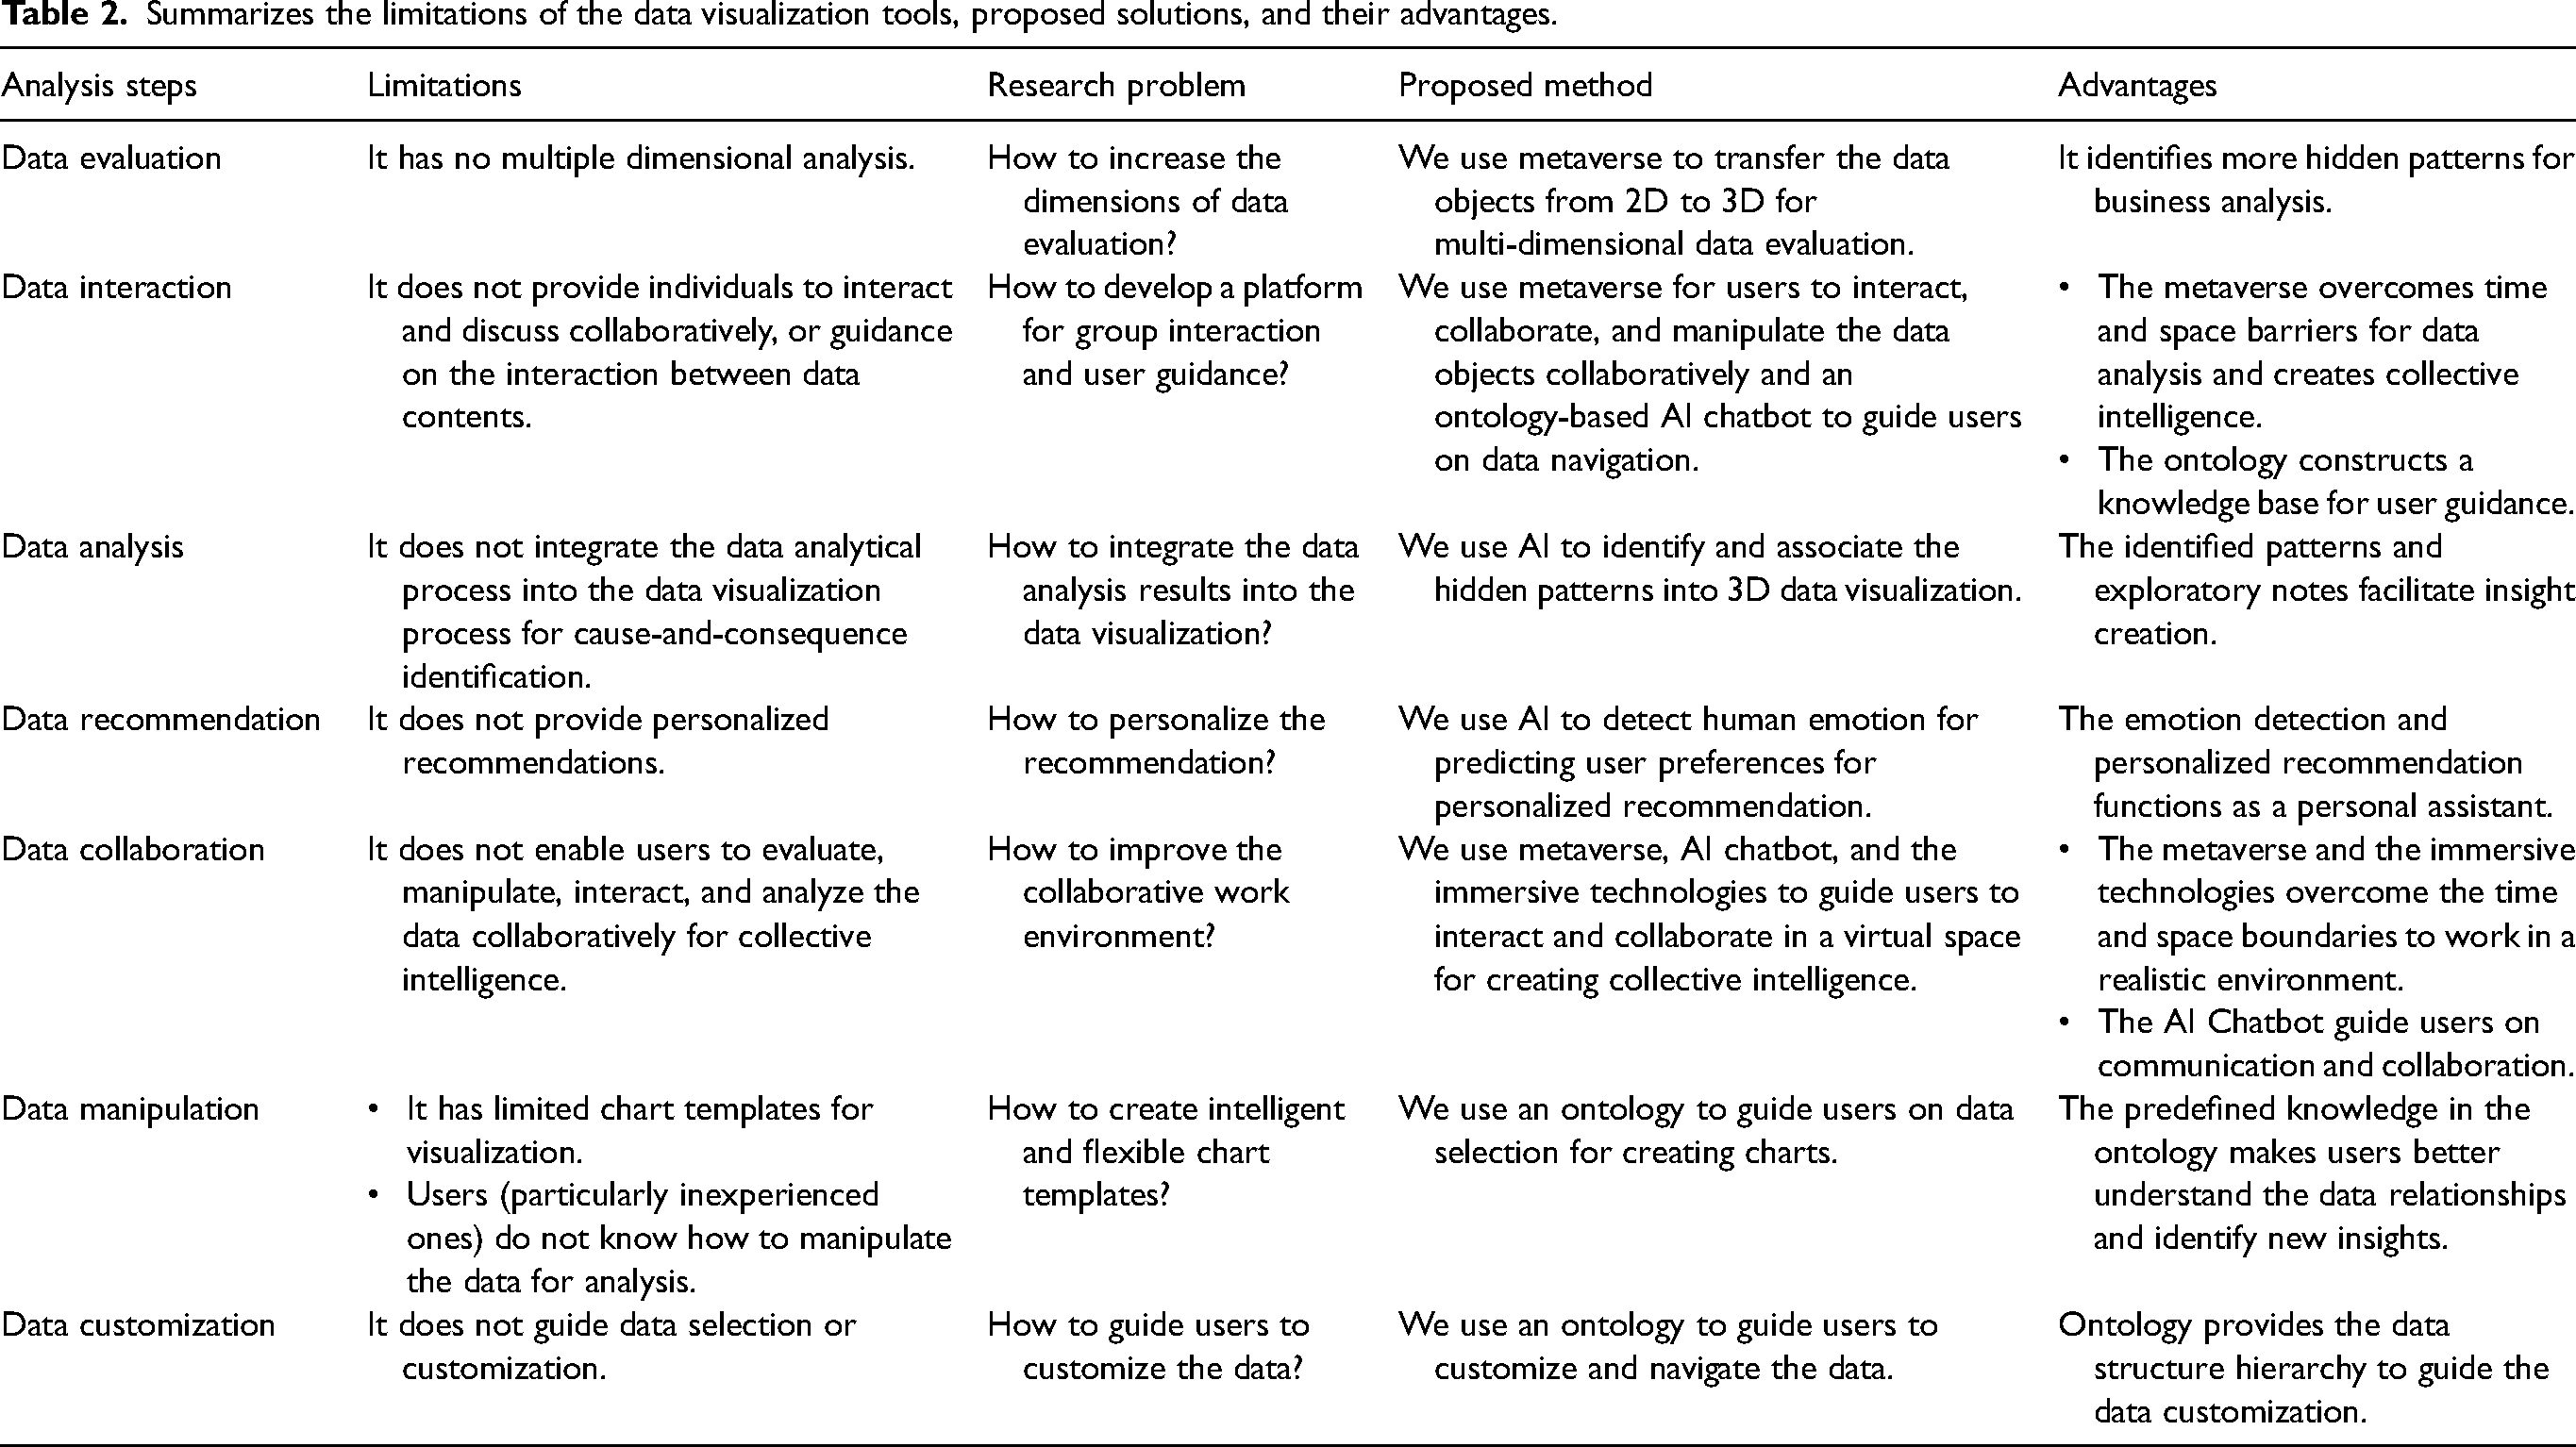
Summarizes the limitations of the data visualization tools, proposed solutions, and their advantages.
Research methods
This study used an exploratory review and proof-of-concept case study. A conceptual design for ontology-based AI data visualization was developed. This exploratory review used a novel knowledge management approach to analyze conventional data visualization. Knowledge management involved the processes of knowledge acquisition, interaction, capture, generation, storage, sharing, collaboration and application (Igbinovia and Ikenwe, 2018). To capture the knowledge to guide users for data analysis and visualization, it included the following steps.
Data exploration: How to identify data characteristics and patterns? Data interaction: How to interact between data contents? Data analysis: How to relate, summarize, and evaluate data? Data recommendation: How to generate recommendations? Data collaboration: How to develop a collaborative environment? Data manipulation: How to analyze data? Data customization: How to personalize the visualization?
The case study is a use case for a proof of concept. The inclusion criterion for the case selection was that the company had a data analysis and visualization problem, required several experts to collaborate and analyze the problems, and currently used conventional data visualization. The exclusion criterion was that the company did not fulfill the inclusion criteria or used 2D data visualization for data analysis.
Results
The conceptual design of the ontology-based AI 3D data visualization for meta-entrepreneurship is shown in Figure 1.
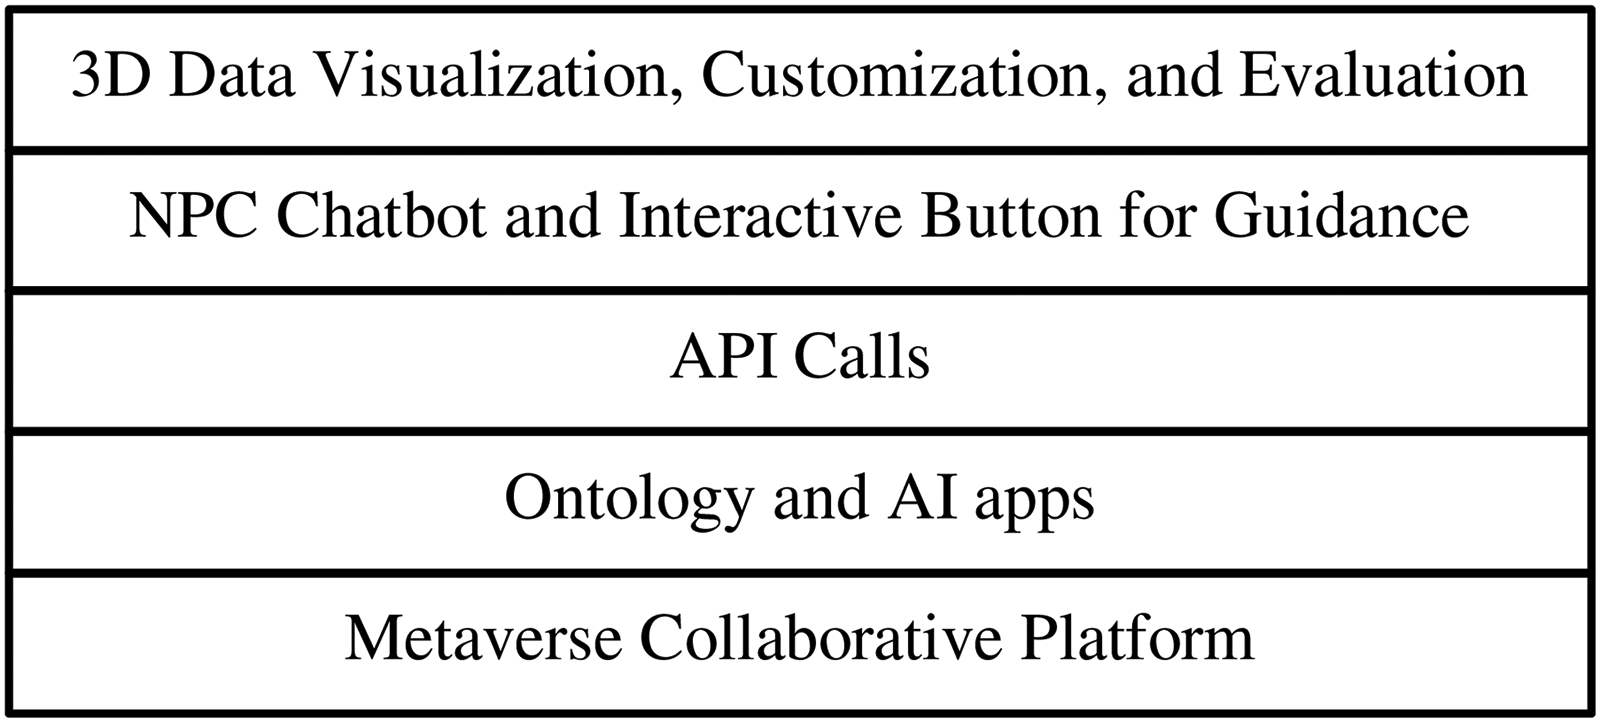
Conceptual design of the ontology-based AI 3D data visualization.
Platform used: Because Roblox provides both GUI-based tools and a declarative visualization language to design 3D objects, it was used to construct a 3D data-visualization prototype in the HKU CampusLand in this case study. The participants could discuss, collaborate, and interact with the metaverse.
Ontology and AI apps: The ontology is designed as a knowledge base for guidance. The AI apps were implemented on the HKU SAAS Data Science Lab (DSL) server to analyze and associate business data with 3D data visualization.
API calls: API apps are called by Roblox session programs in response to user inquiries between Roblox and the DSL server.
NPC chatbot and interactive buttons: The ontology button was designed for users to understand and interact with the data for analysis. The NPC robot communicates between the users and Roblox in synchronized or asynchronized modes. Users can interact with and ask questions regarding NPC robots to identify new patterns and business insights.
3D data visualization, customization, and evaluation: Users can select data from the ontology menu to customize and manipulate the 3D visualization. Explanation notes are associated with the visualization of users to evaluate the data and create business insights.
The functions in the meta-entrepreneurship environment are designed as follows:
Ontology database for data storage: This captures domain knowledge and defines the ontology attributes and data relationships for users to select, evaluate, manipulate, and customize the data. Ontology interface for data retrieval and evaluation: It communicates with the ontology database and AI engine for data retrieval, analysis, and visualization. An AI engine for data analysis: It trains AI models to identify hidden data patterns and associates these with 3D data visualization and personalized recommendations. It also defines the rules for guiding users in data analysis and navigation in the ontology. 3D data visualization for insight creation: Creates multi-dimensional charts and explanatory notes on 3D data visualization for data visualization and insight creation. AI chatbot for data communication: An AI chatbot guides and communicates with users for data navigation and analysis, collective intelligence, and collaborative work.
The architecture of the model is illustrated in Figure 2. The first layer constructs ontology attributes and their rules for the knowledge base. An ontology-based AI chatbot was implemented for communication between the users and machines. An interface was designed to enable users to navigate the ontology for data evaluation and customization. The second layer is designed to construct an AI engine to identify and associate hidden patterns with 3D visualization and recommendations. The third layer renders data from the ontology database to prepare graphics and charts for the 3D data visualization layer. The top layer provides 3D data visualization for users to evaluate, interact, manipulate, and analyze the data.
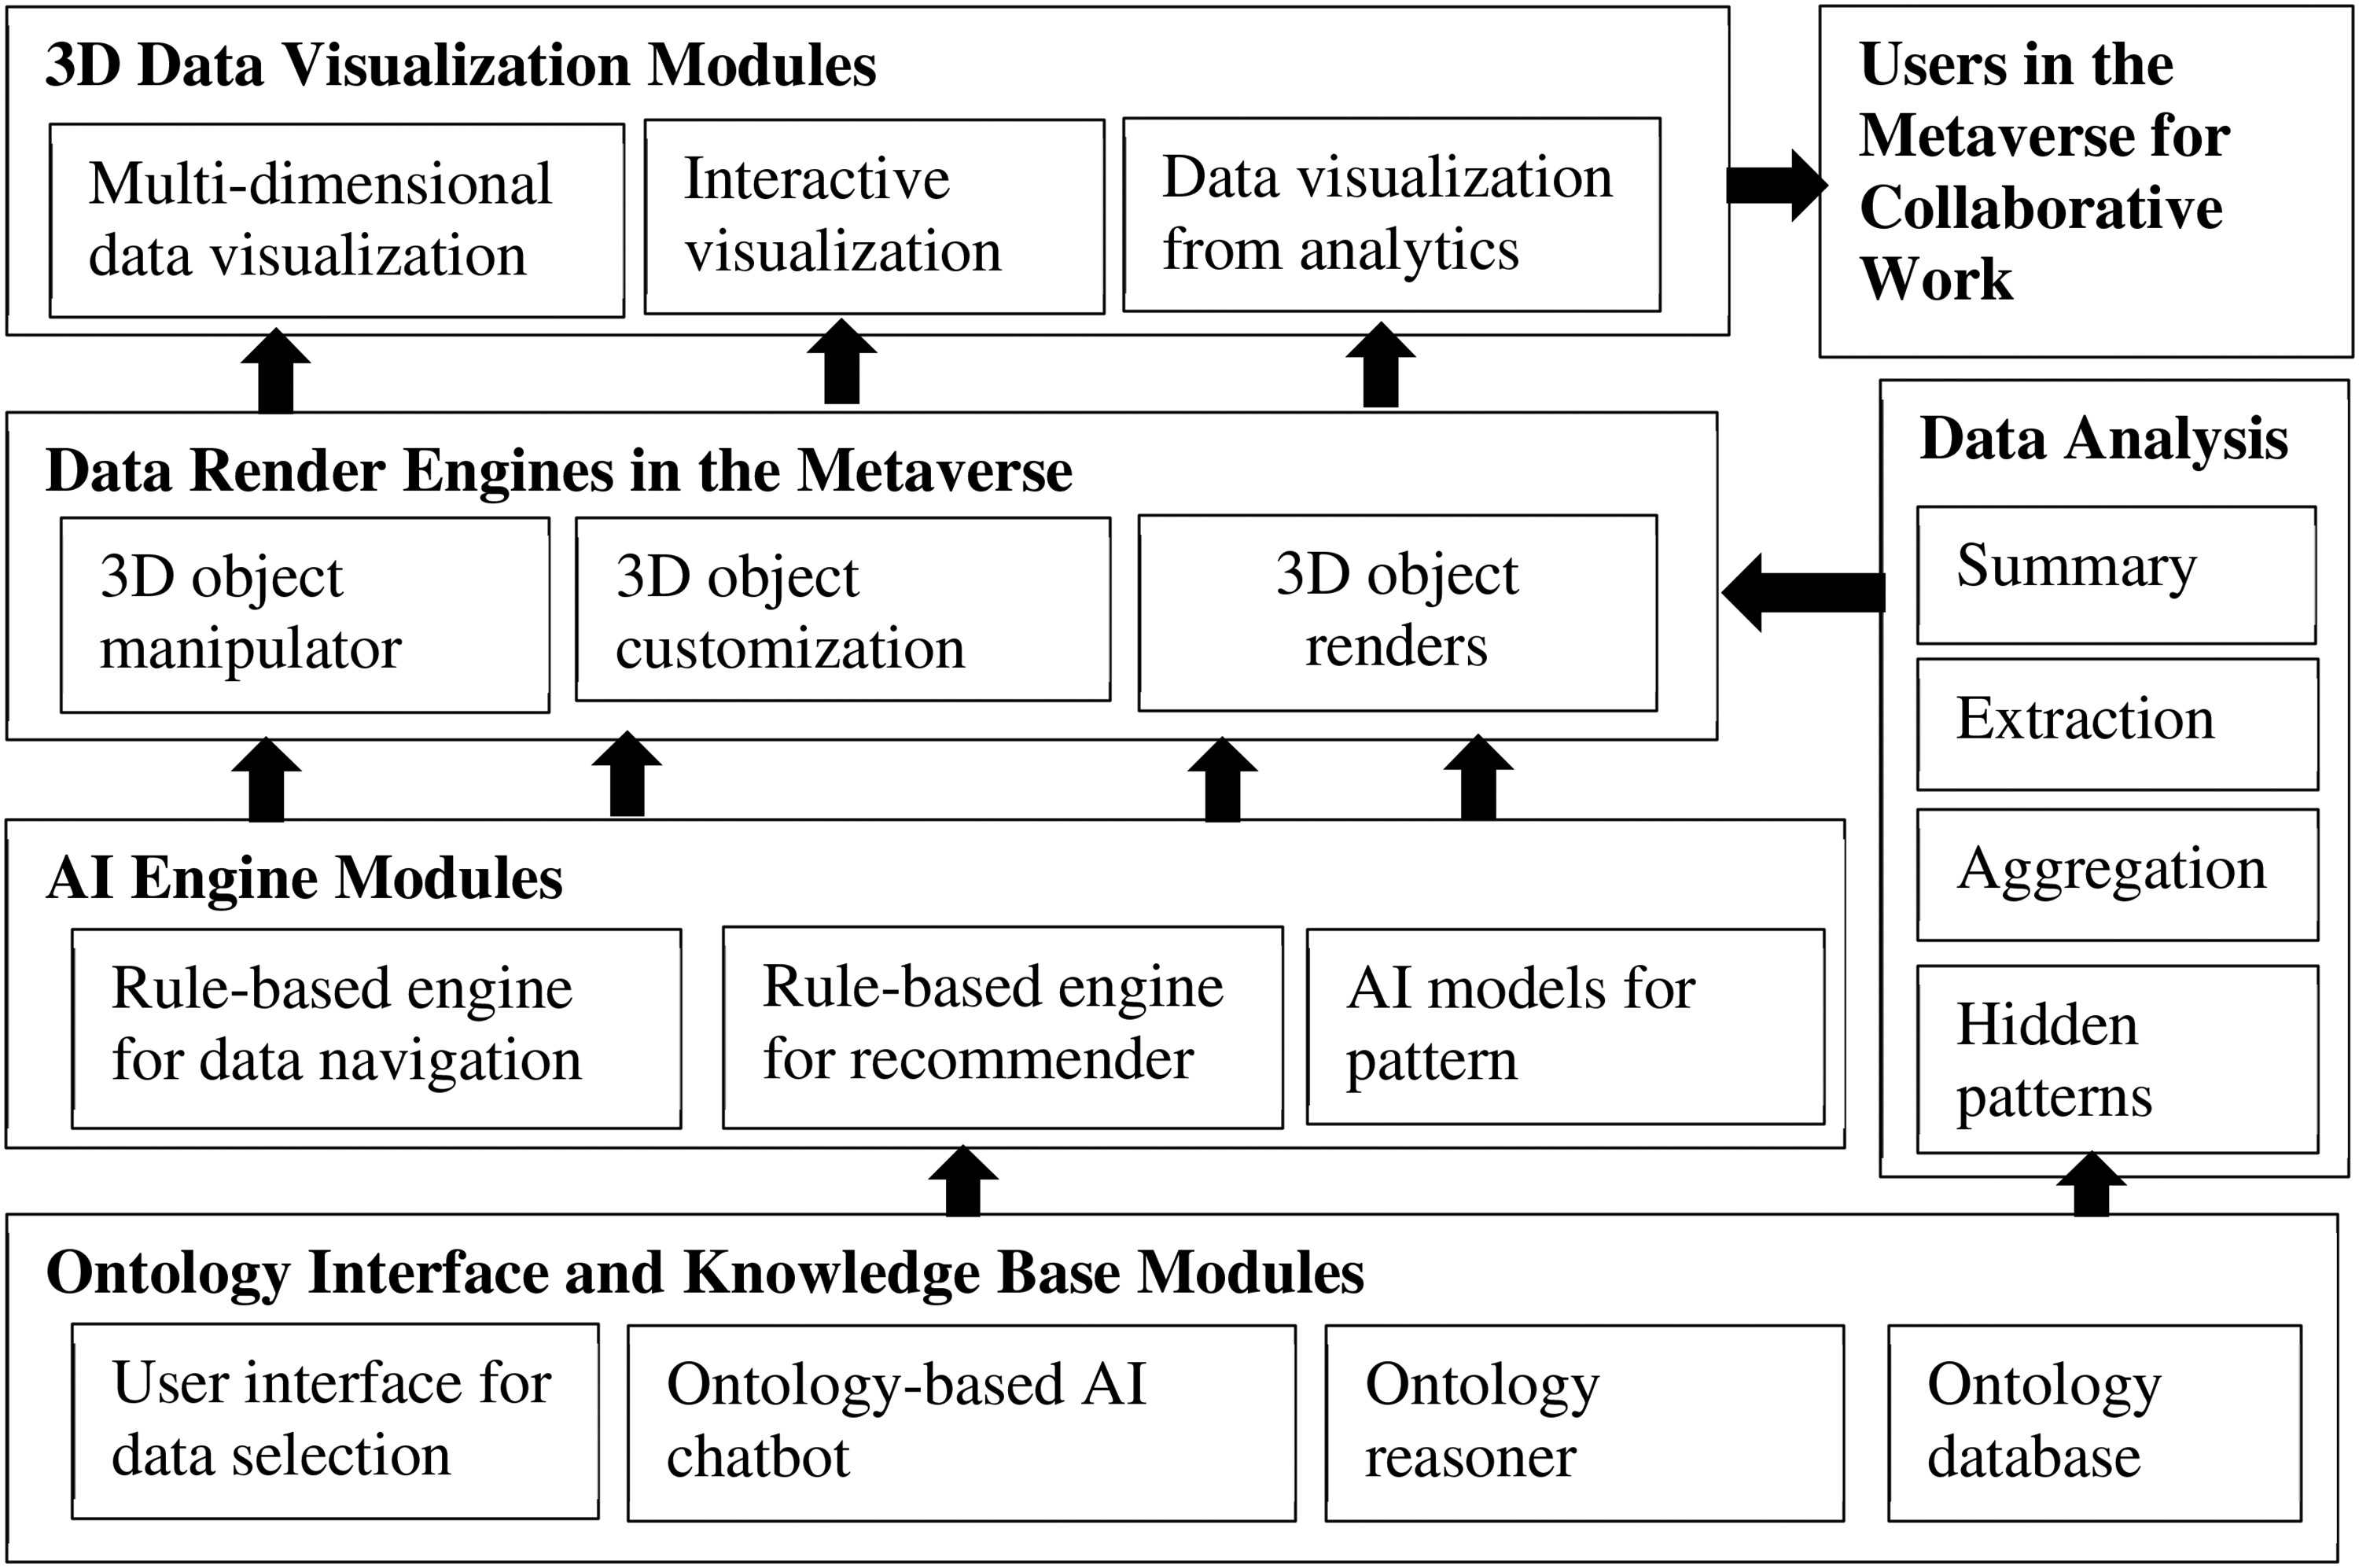
Overview of the AI-based 3D data visualization architecture.
Case study for proof-of-concept
Case background and problems
ABC is a manufacturing company encountering energy consumption problems, including predicting the machine failure time and maintenance period. The goal of this study was to develop an ontology-based AI 3D data visualization prototype for staff to evaluate, manipulate, and visualize data objects in different dimensions for correlation analysis and consumption prediction.
Proposed solution
Ontology-based AI 3D data visualization has been proposed for users to evaluate and analyze data in a metaverse environment. An ontology (Figure 3) defines data objects in different categories, such as device location, line, time, and electricity consumption. Thereby, collaborators can select and navigate the data objects for analysis. The causes of machine failure and maintenance periods were analyzed using machine learning models. Ontology-based AI 3D data visualization provided dynamic and interactive data analyses and recommendations.
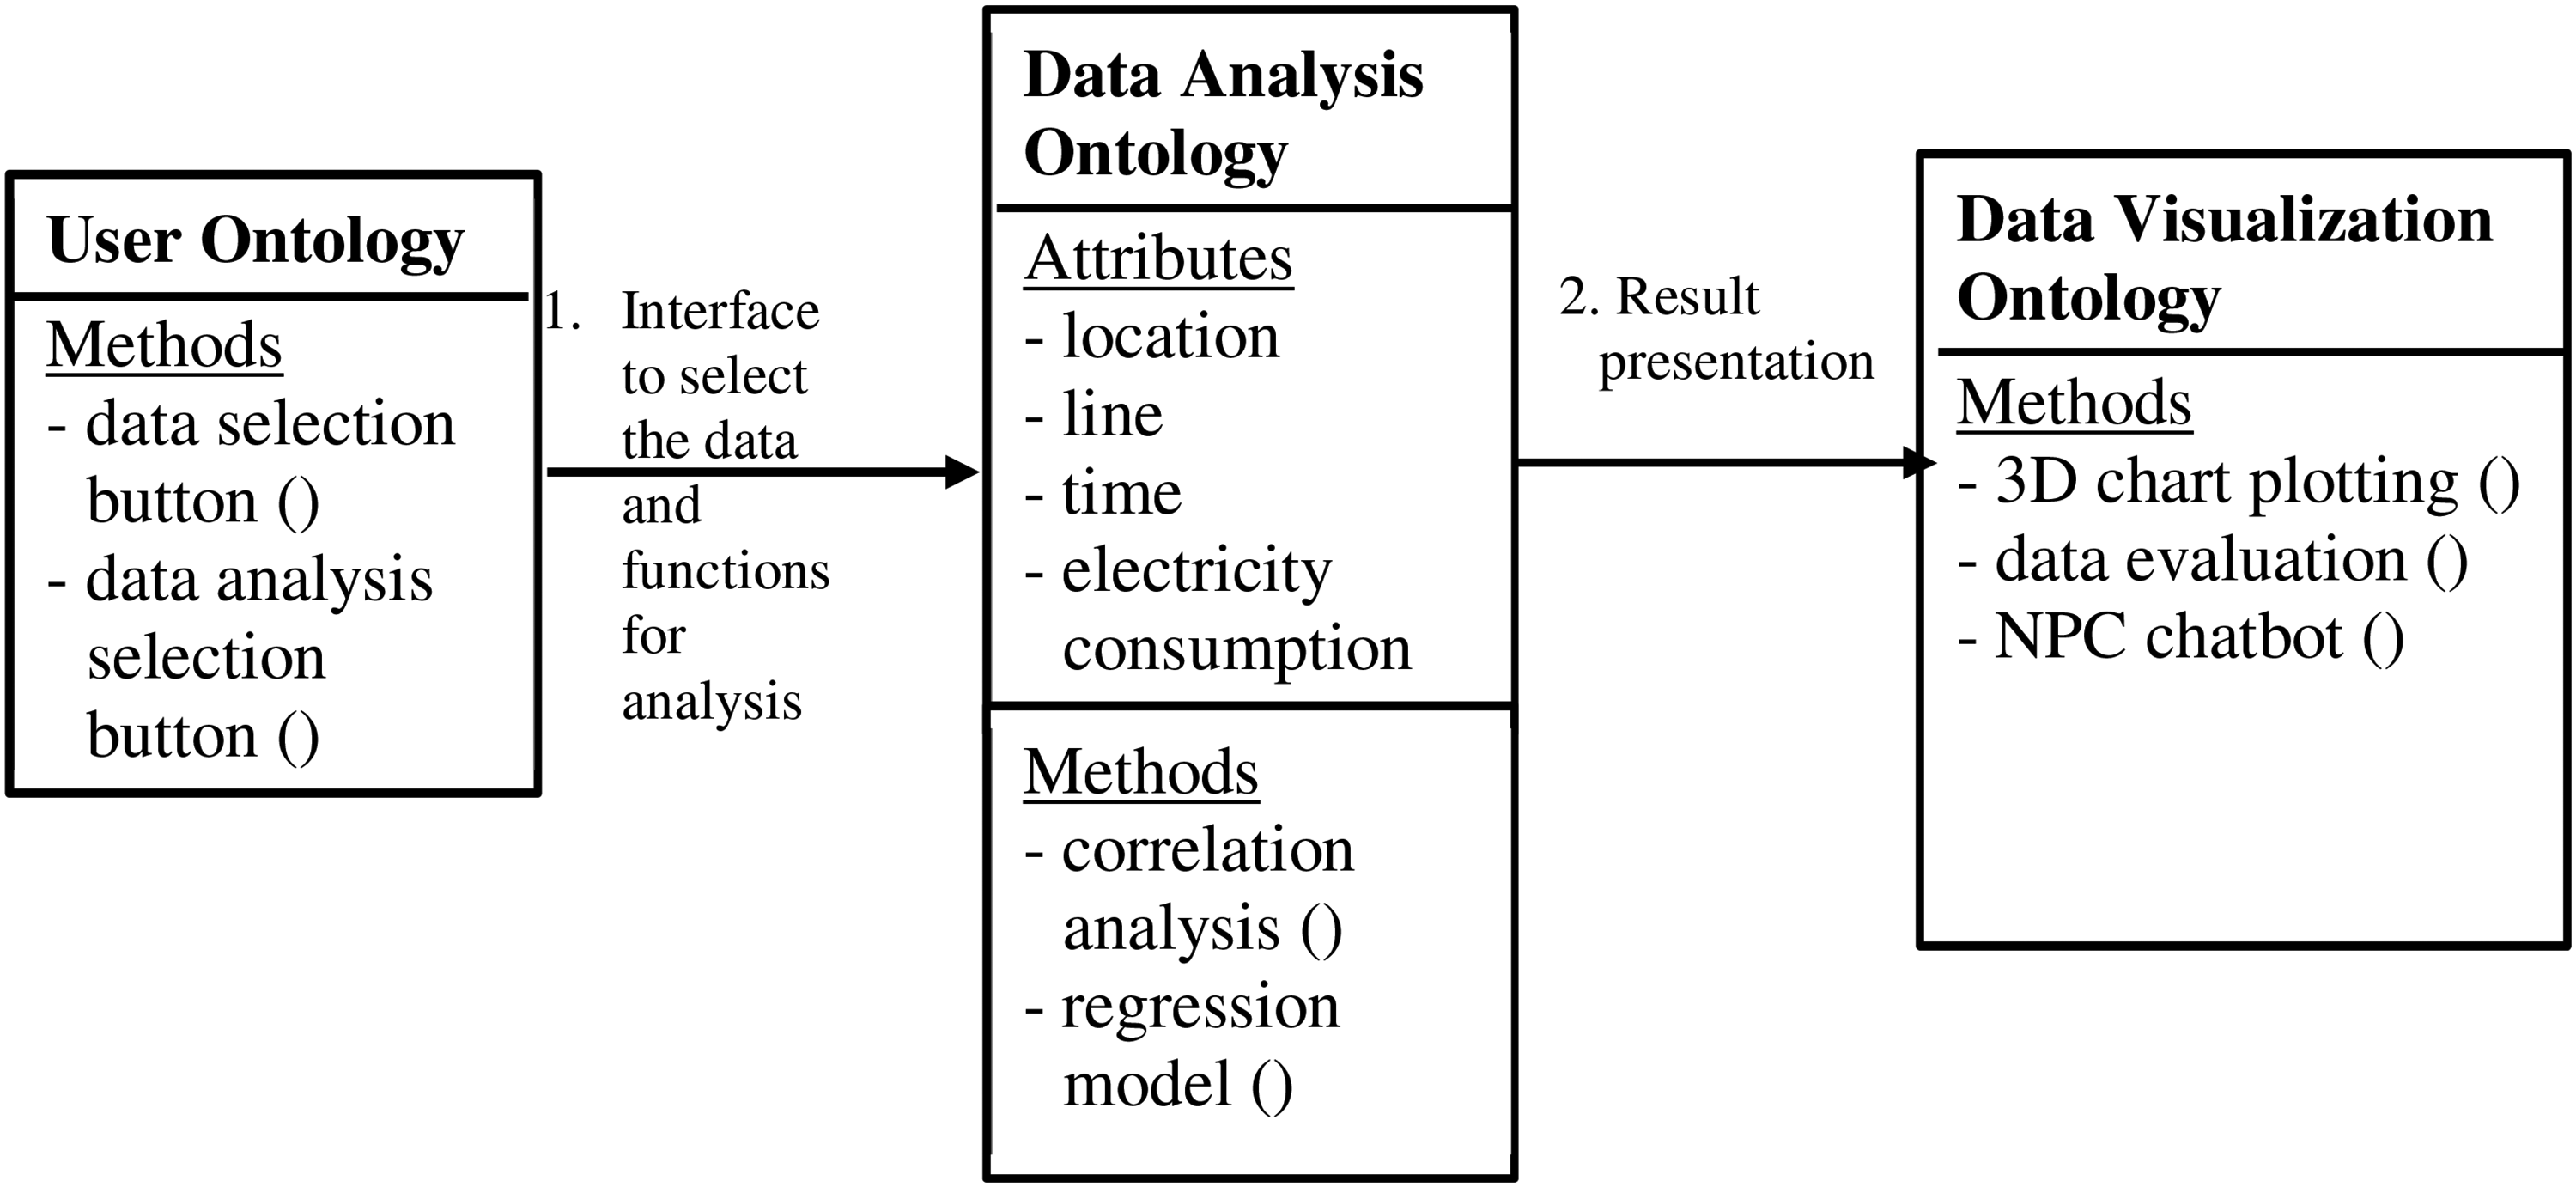
Top view of the energy consumption ontology.
Data sources and preprocessing
The workdate, capture time, location, line, voltage, current, power, and energy of the dataset were analyzed using correlation analysis and a regression model. The results were presented to engineers and decision-makers to formulate strategies for optimizing the tradeoff between electricity costs and operational efficiency.
Ontology design
A unified modeling language (UML) class diagram (Rajab et al., 2022) was used to model the relationships in the dataset.
The ontology model had four classes.
Line class: It represents the different electricity lines in a location and is the composition of the location class (a subset of the location class). The attributes of the line class are related to the electricity consumption for lines 1, 2, and 3. The functions include daily () and hourly () functions that calculate the average voltage, current power consumption, and total energy consumption per day or hour.
Location class: It represents different locations in the company and is a composition of the Company class (a subset of the company class). Its attributes are identical to those of the line class, whereas the attribute values are the mean values of all the lines of the selected locations. The Location class has a Location Name attribute and functions identical to those of the daily () and hourly () classes.
Company class: This class represents the total energy consumption of the company and has the same four attributes as the location class. Here, the values of the attributes are the mean values of the locations. The Company class has functions identical to those of the daily () and hourly () classes.
Data-analysis class: It represents data analysis. It provides correlation tests and time-series predictions for the three classes.
Experimental design and results
Two-dimensional and 3D data visualizations were implemented to compare the performances of 3D data visualization, manipulation, interaction, evaluation, analysis, and collaboration (Figure 4).
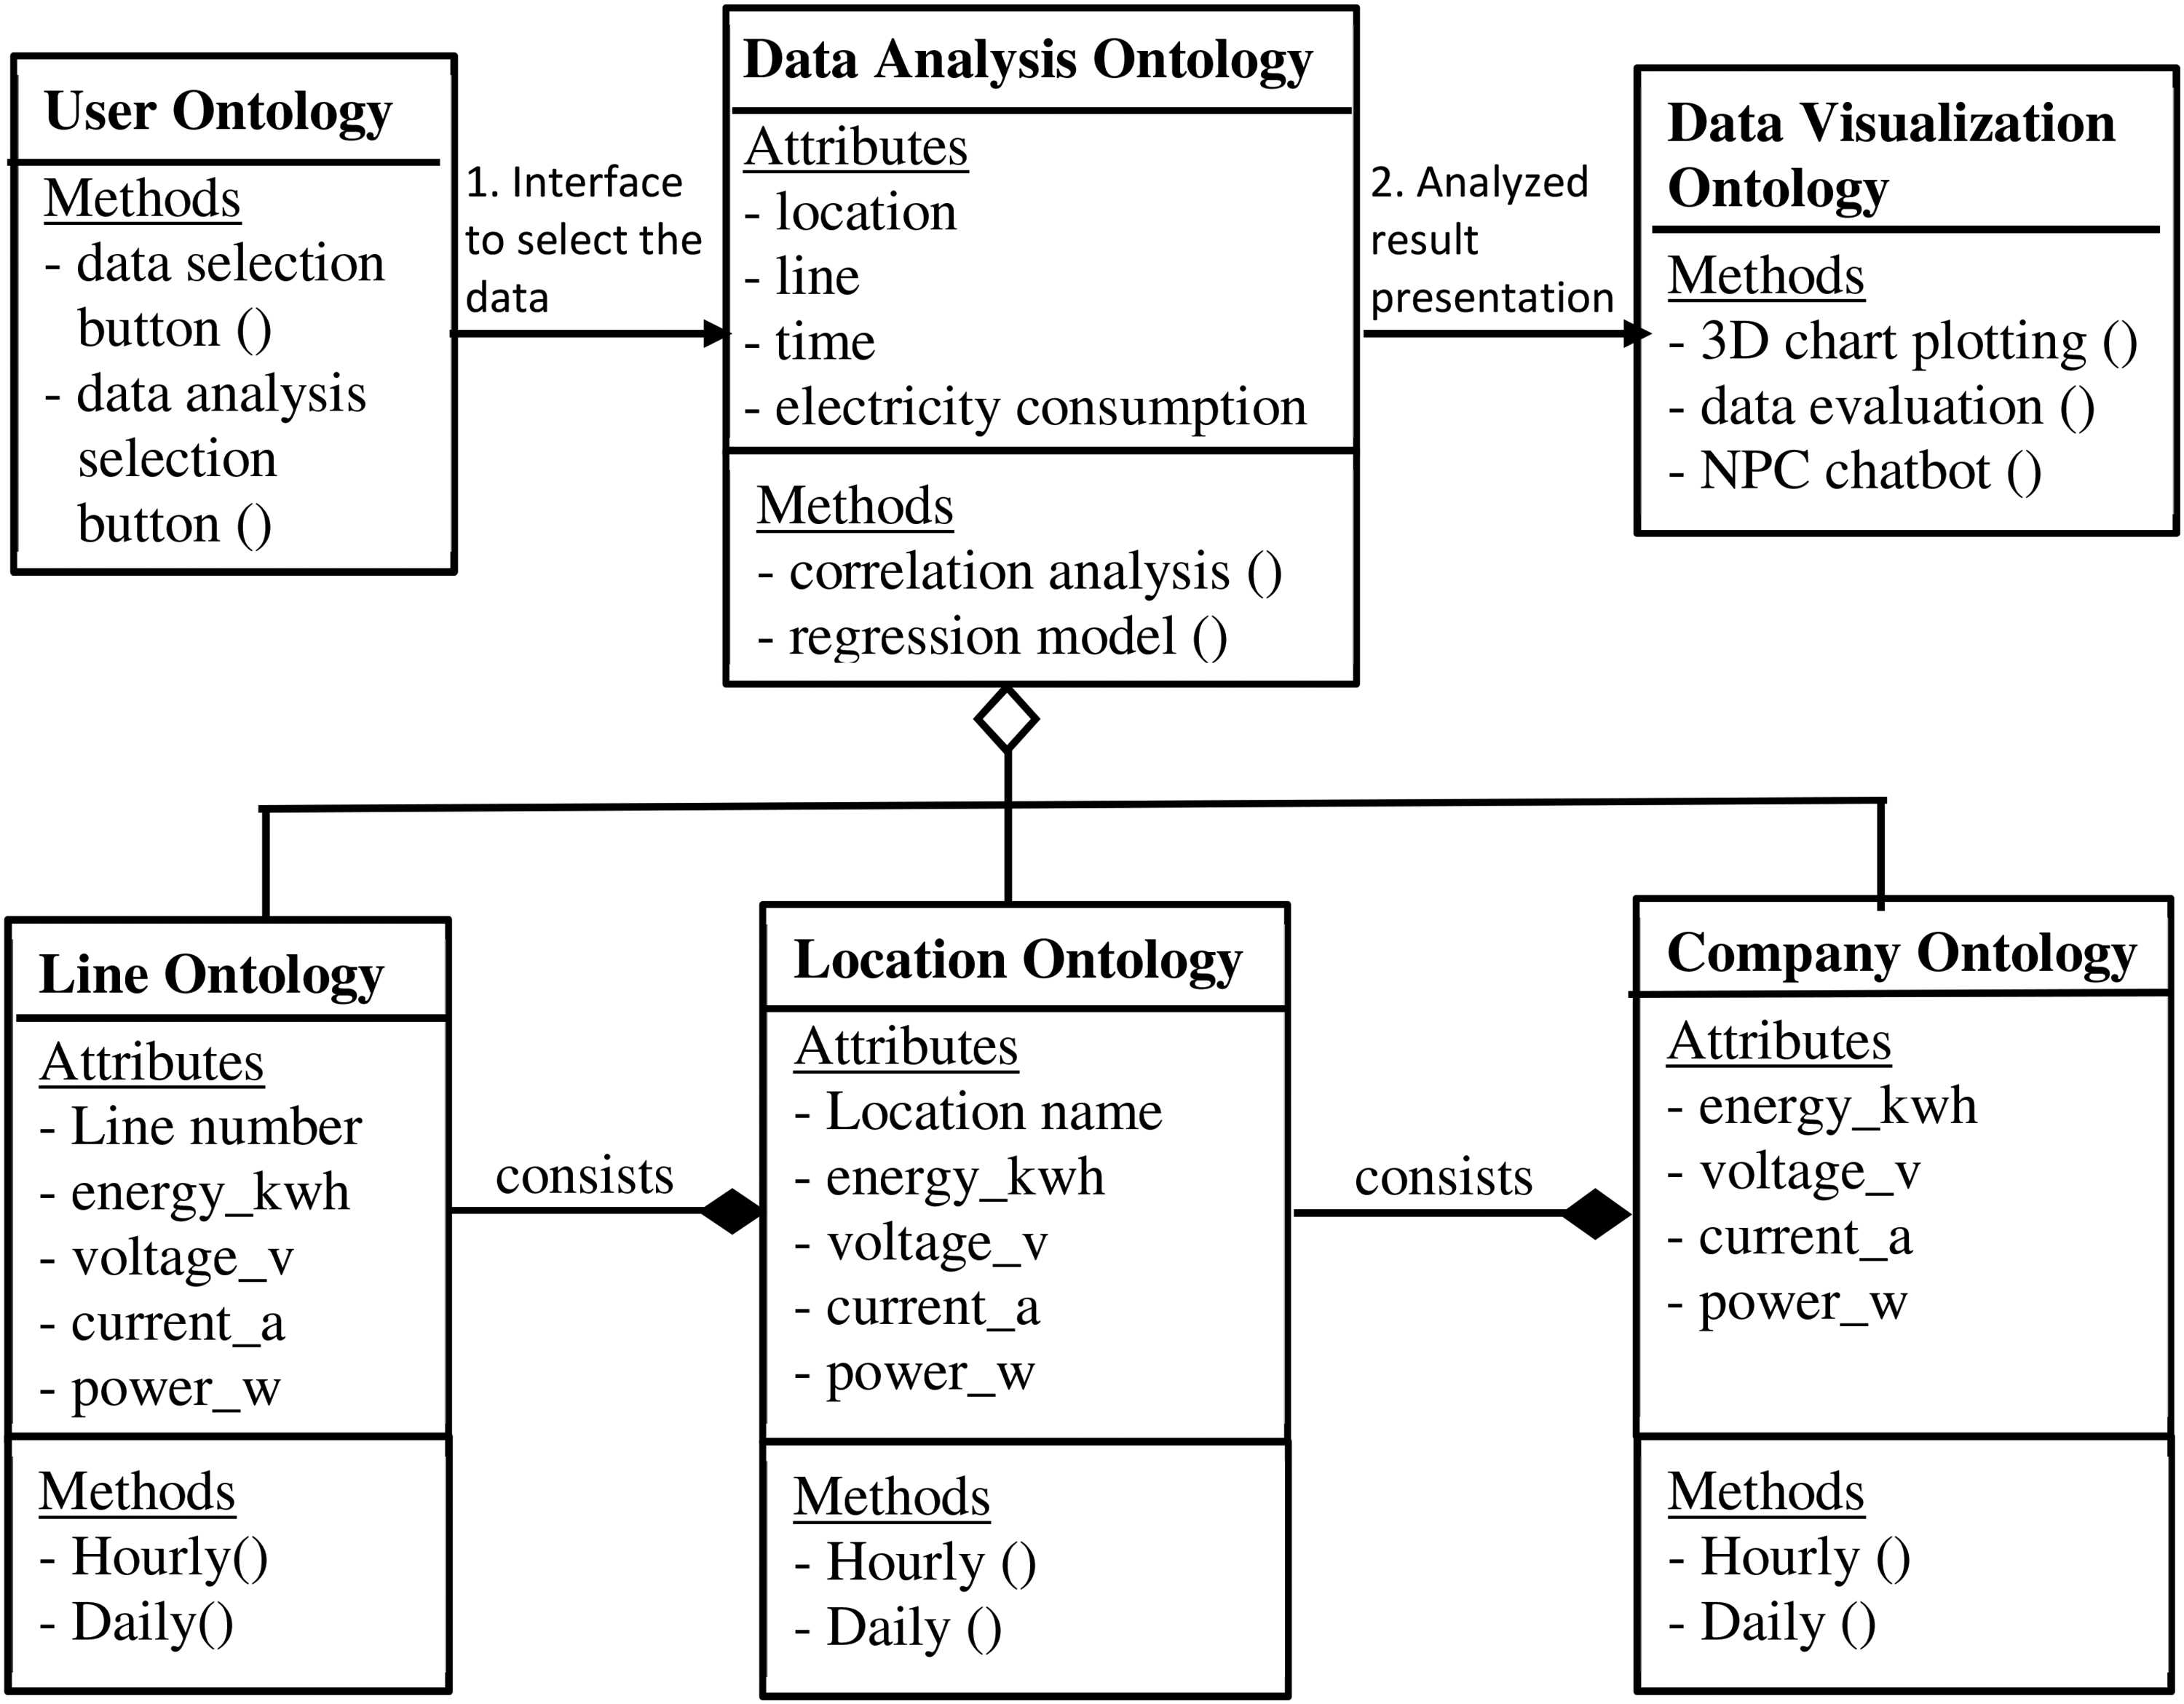
UML class diagram for electricity dataset.
Two-dimensional data visualization: The declarative language Python was used to plot line charts of the daily energy consumption of the six locations (Figure 5) and total energy consumption of the three production lines in each location (Figure 6). Notes explaining this pattern could not be documented on the graph. For example, in Figure 5, the likely factors causing the abnormally high value around July 19, 2022 could not be explained. Second, it did not provide further data evaluation (such as a different perspective of the analysis) or whether this abnormal pattern occurred in other locations as well. Third, it did not provide a visual link for the graphs in either figure that could be solved using 3D data visualization.
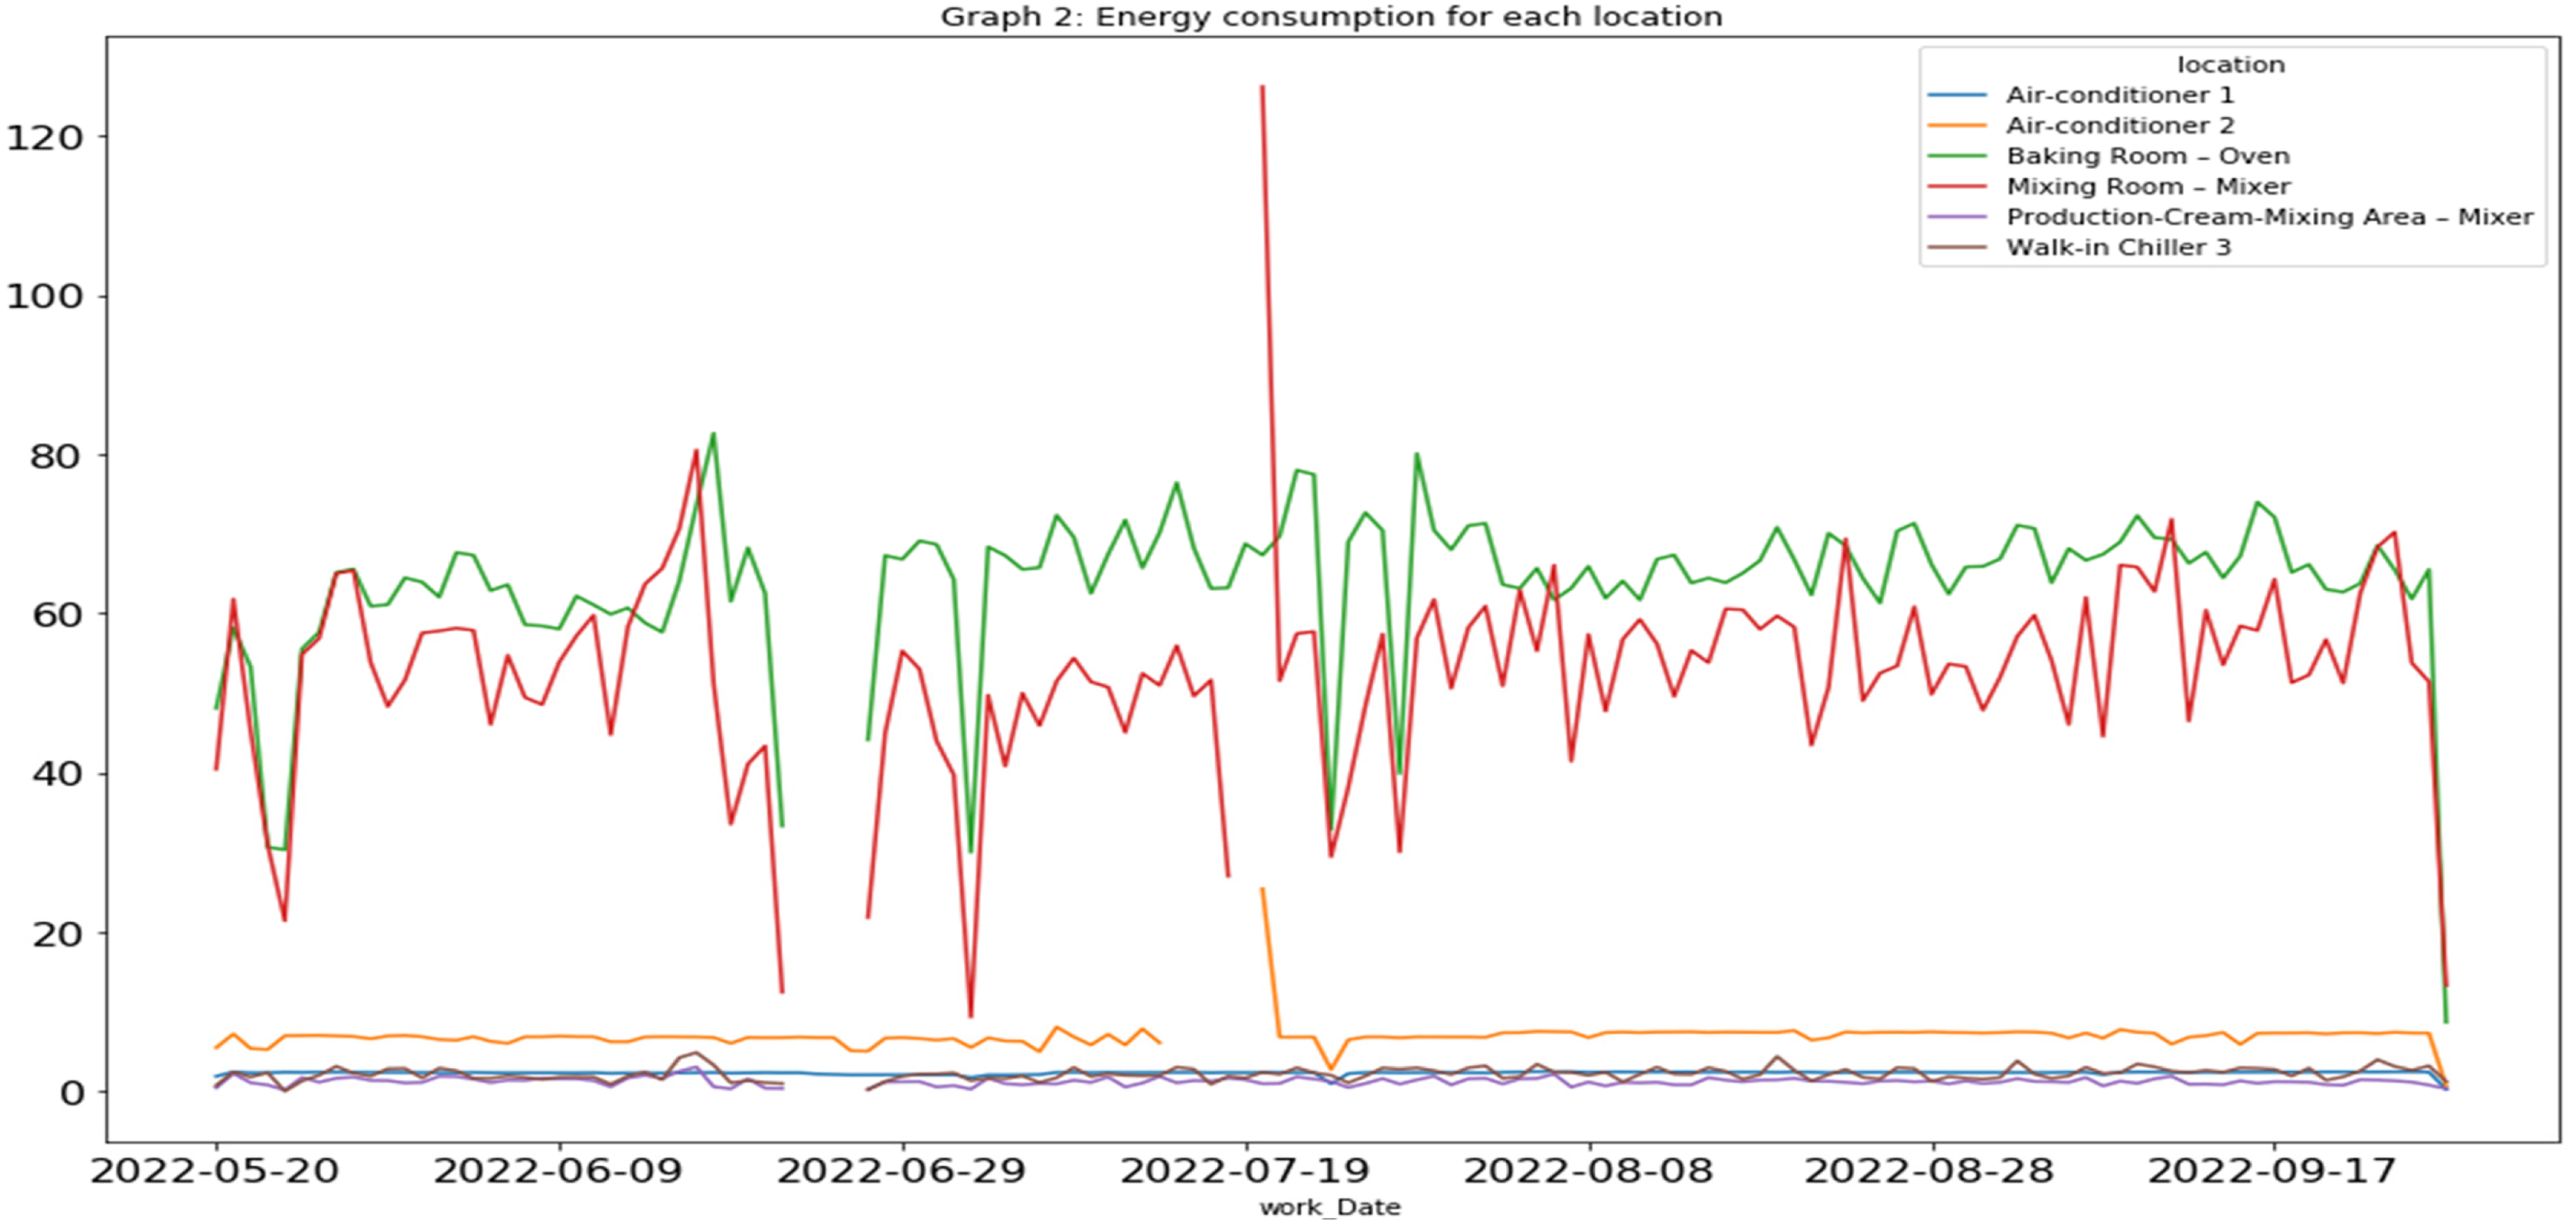
Python line plot of the six locations.
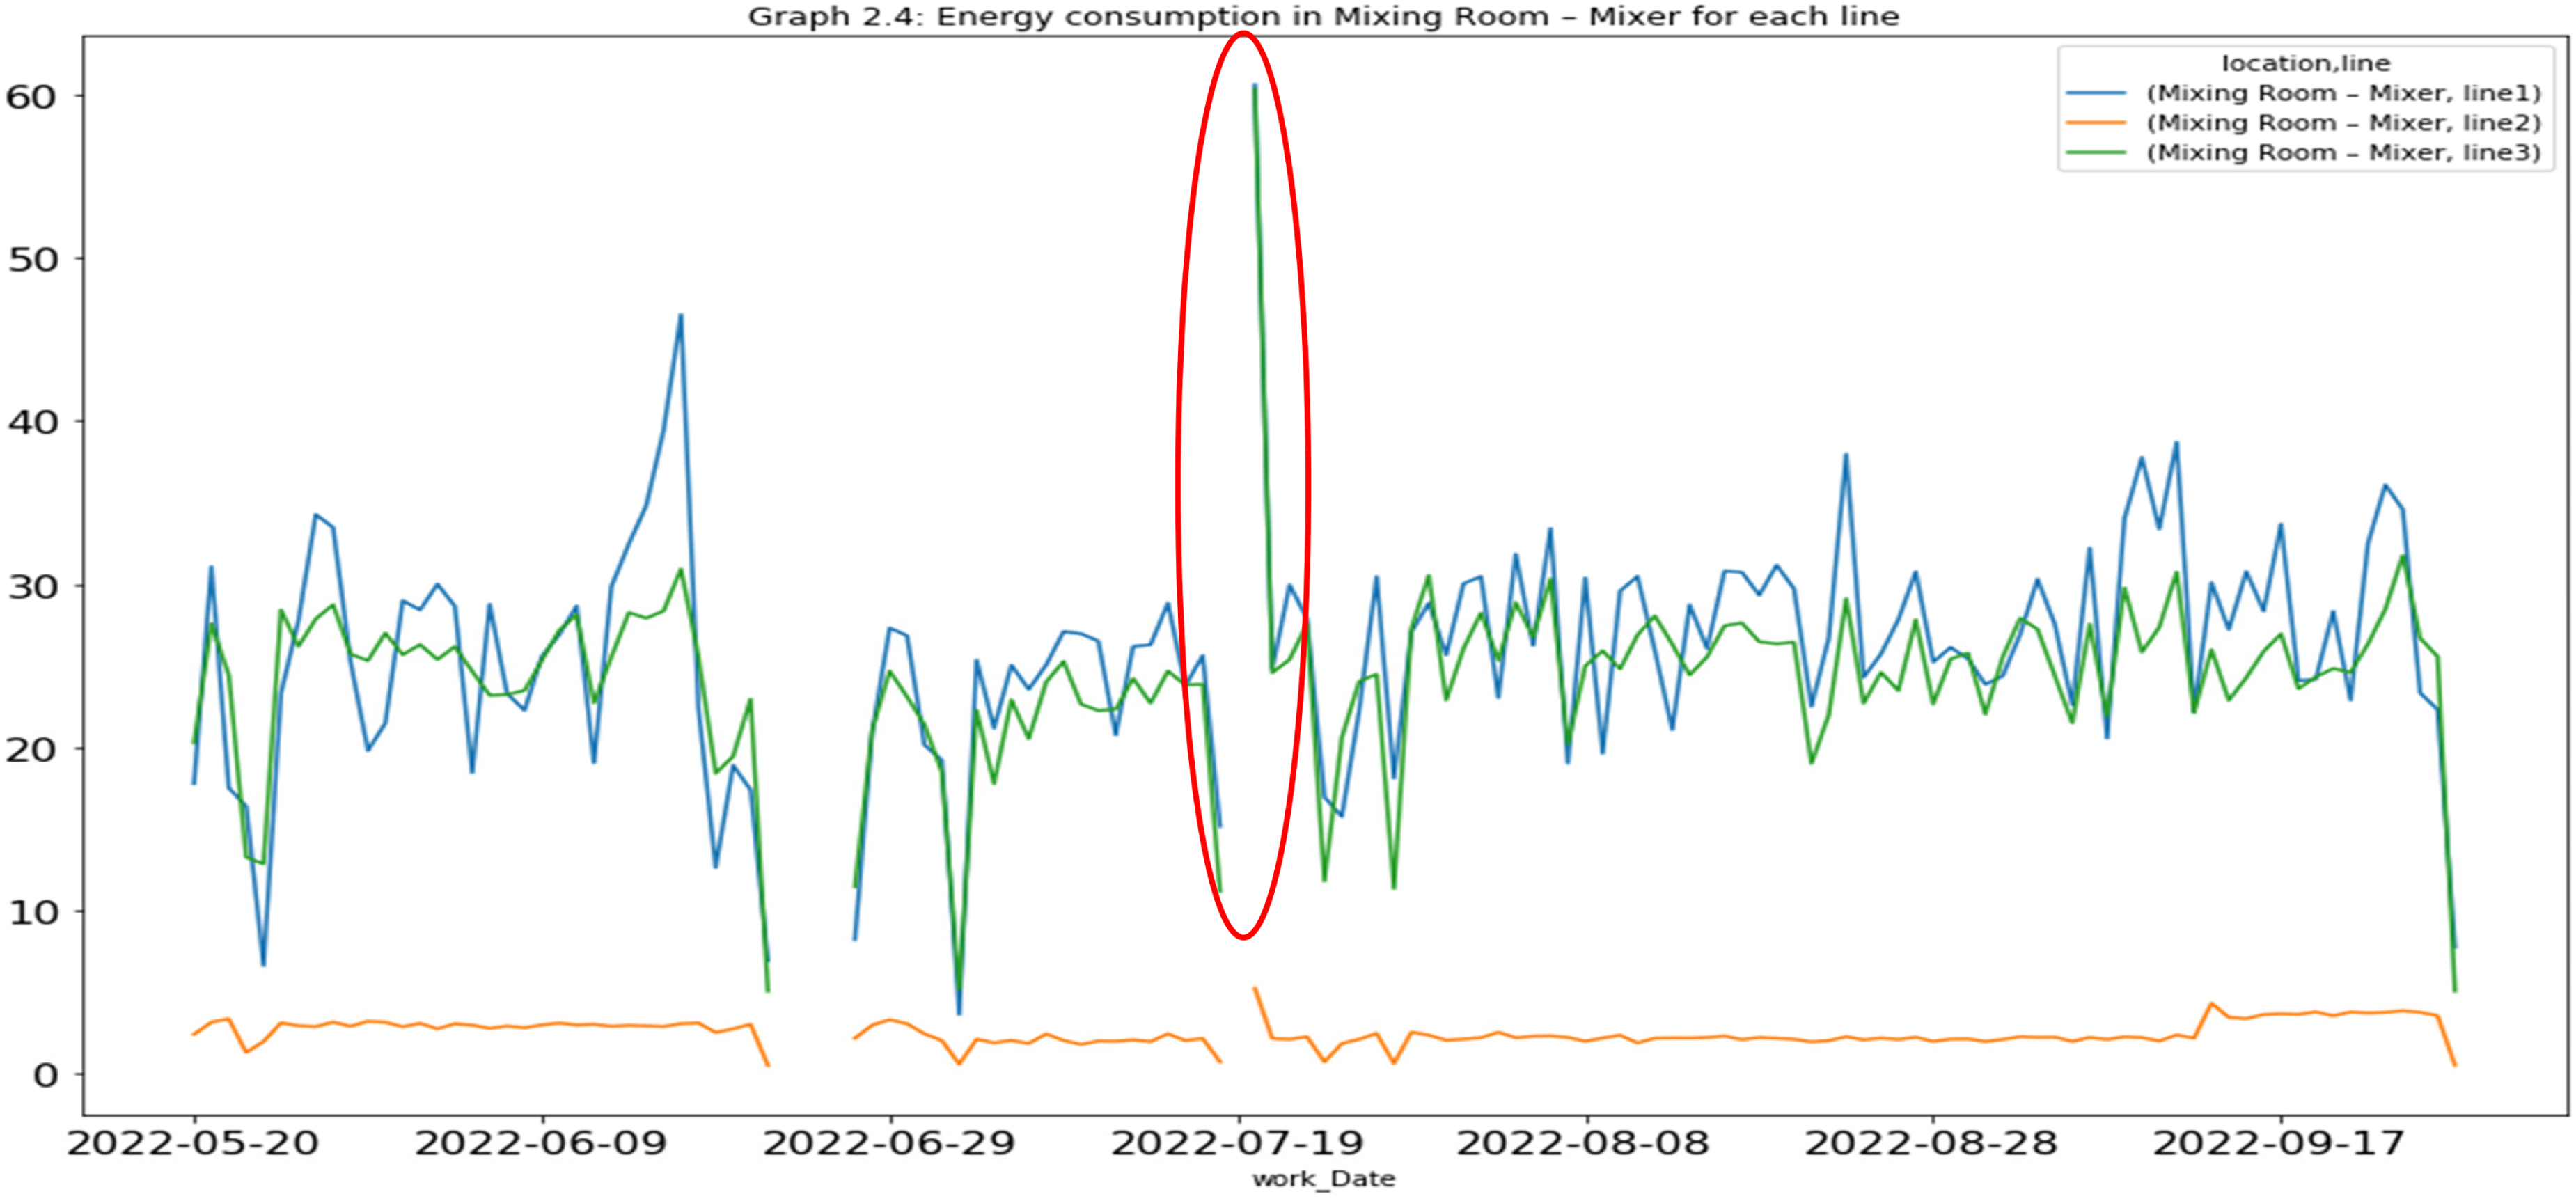
Abnormally high value around July 19, 2022 on the three production lines of a specific location.
Ontology design for 3D visualization: An ontology was constructed with the electricity consumption dataset in the UML class diagram shown in Figure 4. Users can view the ontology design by clicking the 3D ontology design button (see Figure 7).
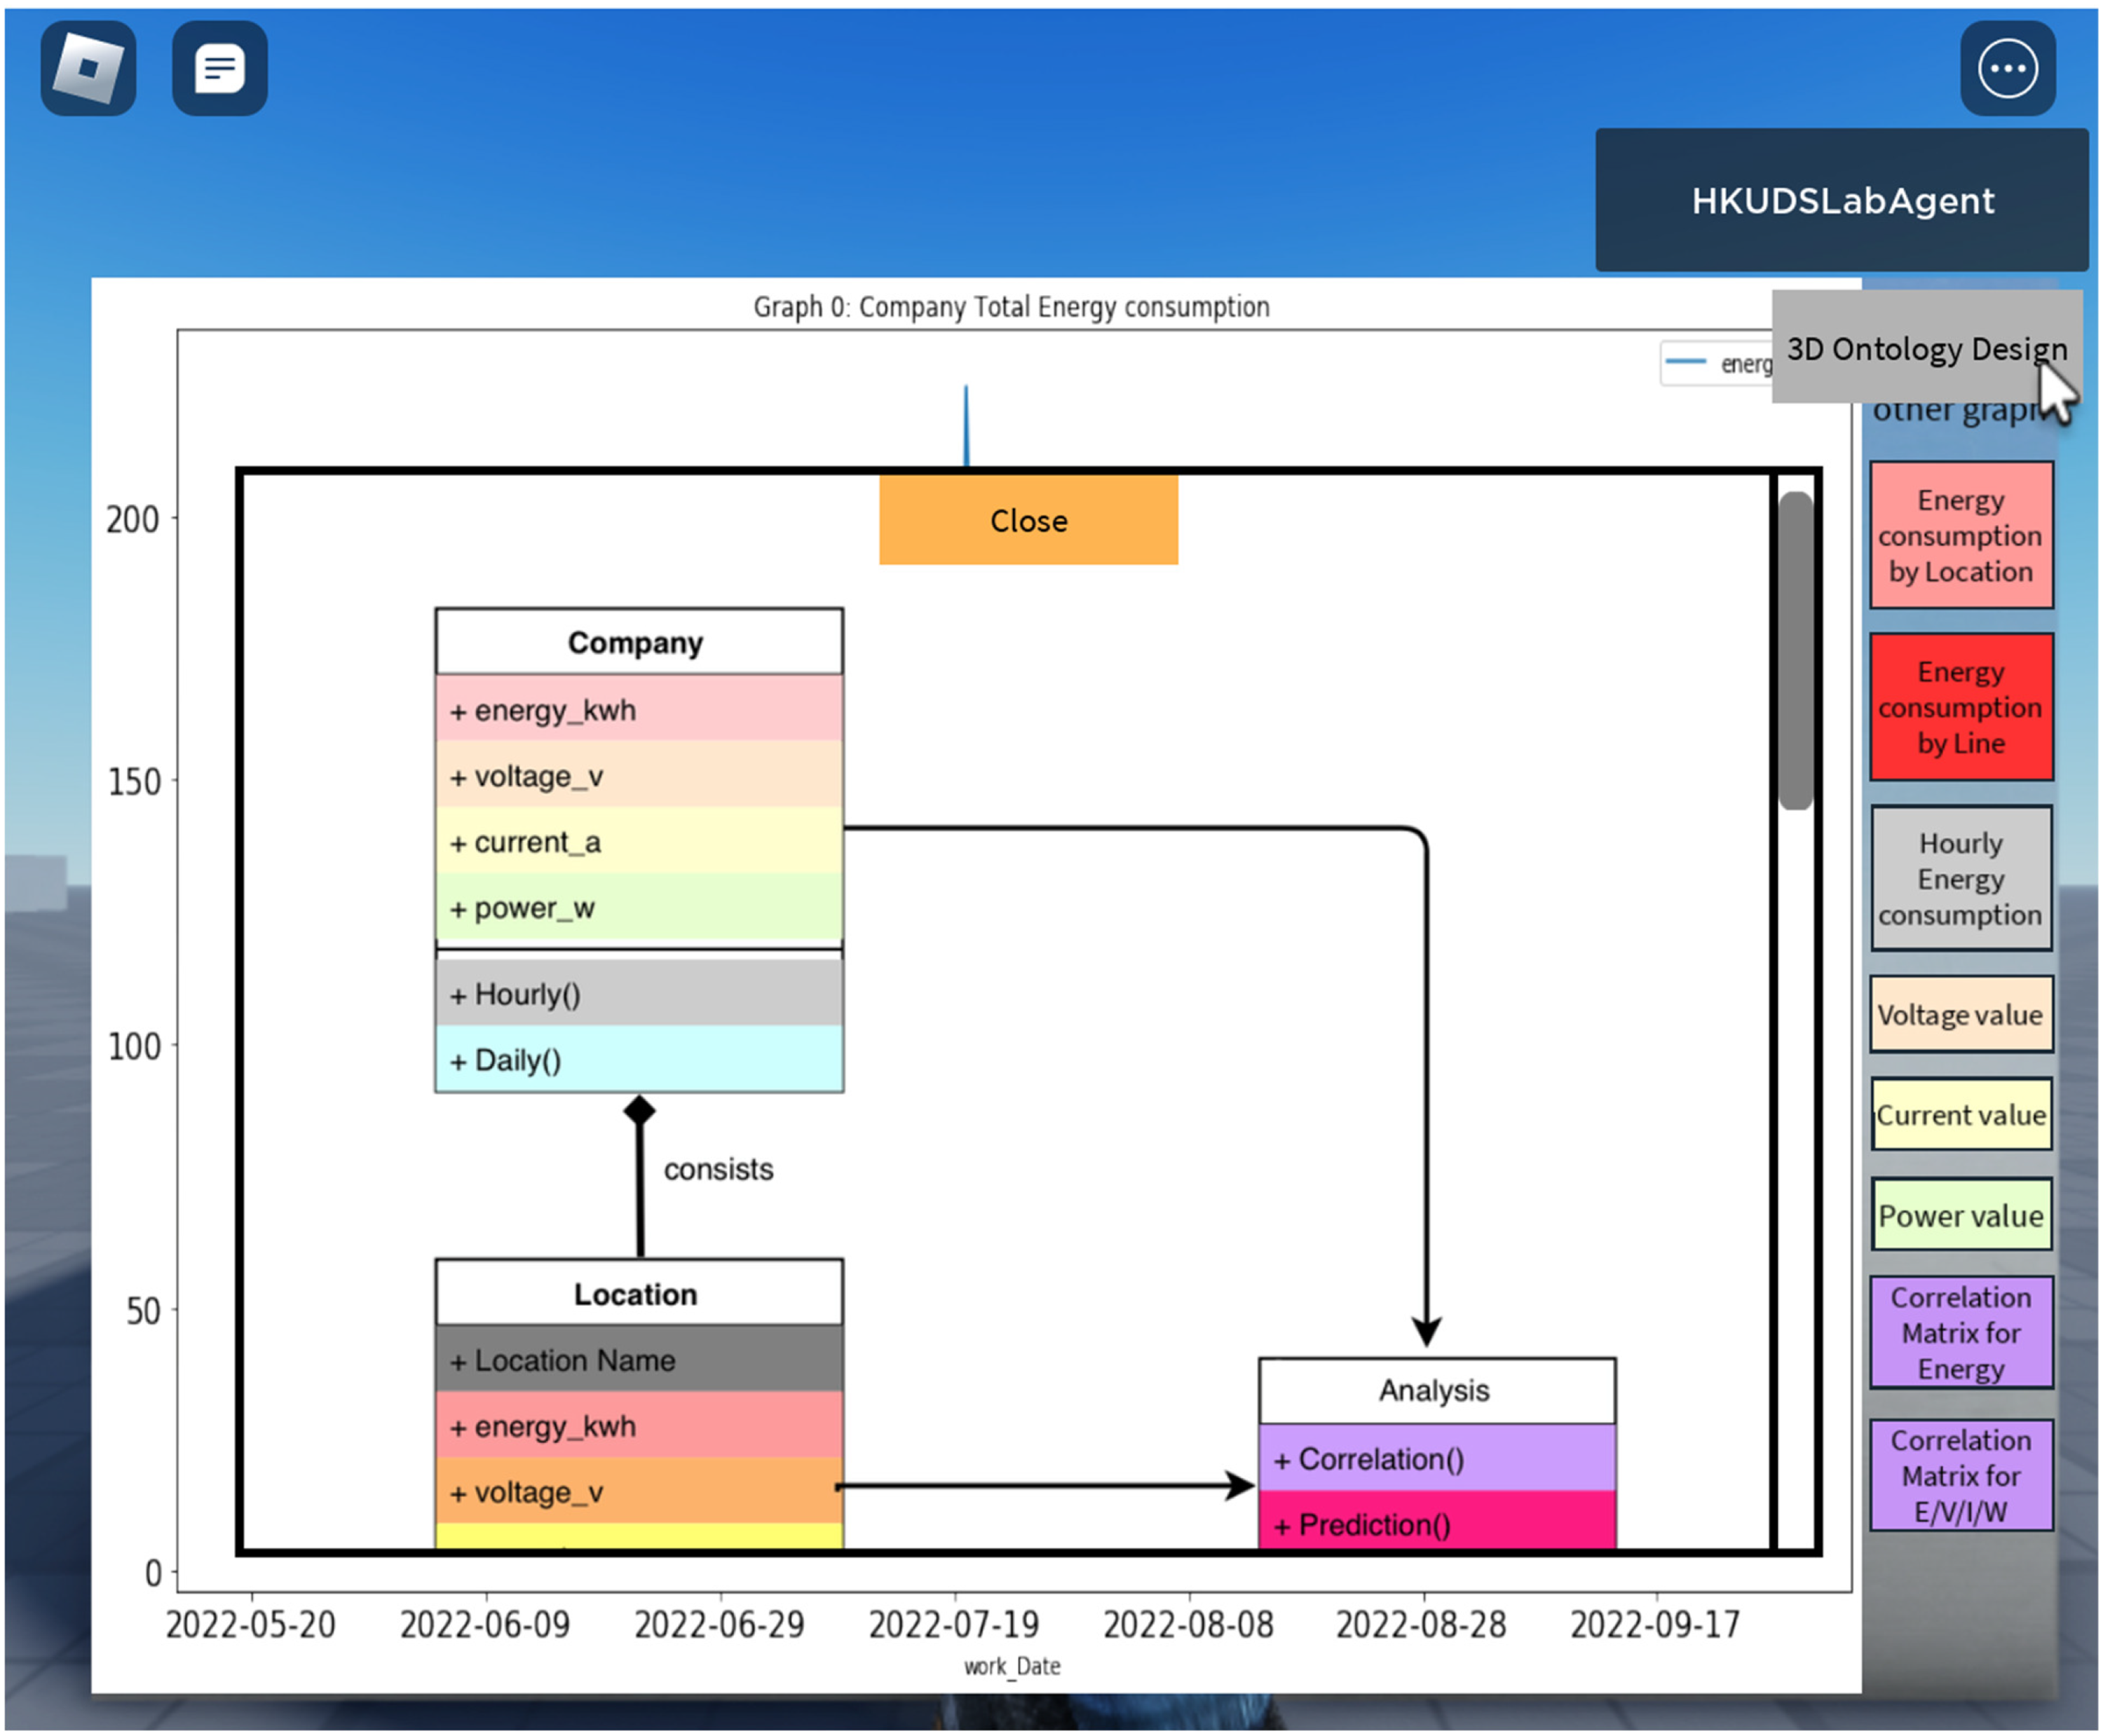
Ontology design button showing the UML class diagram.
3D data visualization in the Roblox metaverse
Roblox's cube presented charts on each face (see Figure 8). Users can view, manipulate, and rotate cubic objects using VR, AR, or MR equipment to relate data.
One face of the 3D presentation cube.
The two important properties in the 3D data visualization prototype are as follows:
Data interaction in 3D visualization: The chart is divided into N equal portions with a hidden clickable button. When the user's cursor moved over (see Figure 9(a)) and clicked on a portion, a window popped up containing the explanation note (see Figure 9(b)). Chart patterns such as the peak values, tuning points, and abnormal patterns were explained. This engaged data analysis and interaction to users.
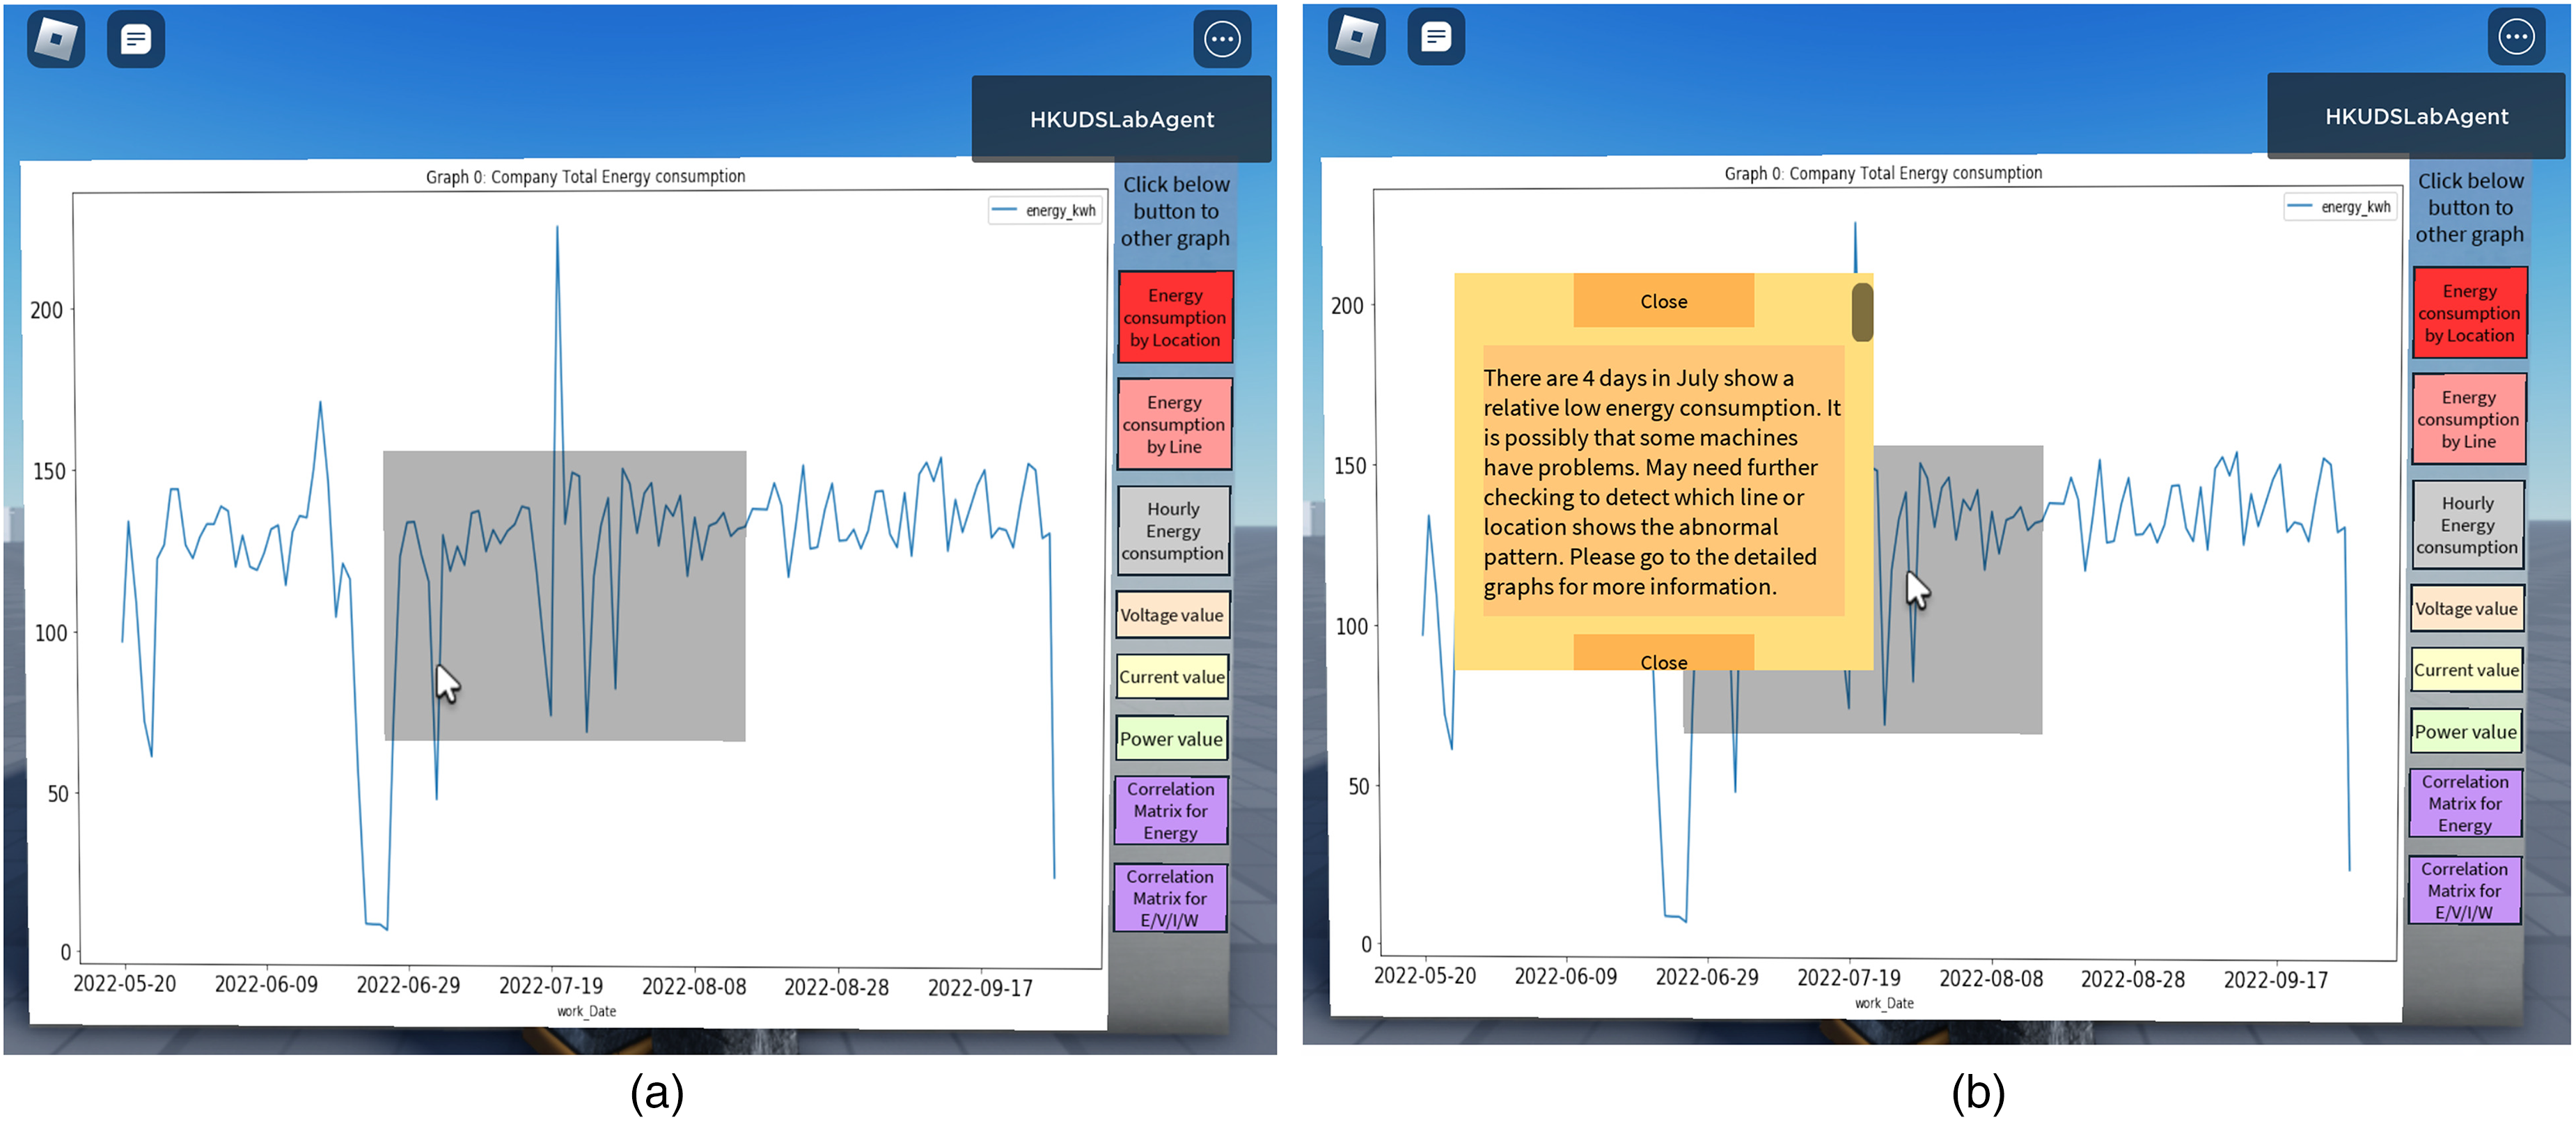
(a) Darkened portion when hovering; (b) Pop-up window with explanation.
Data manipulation in 3D visualization
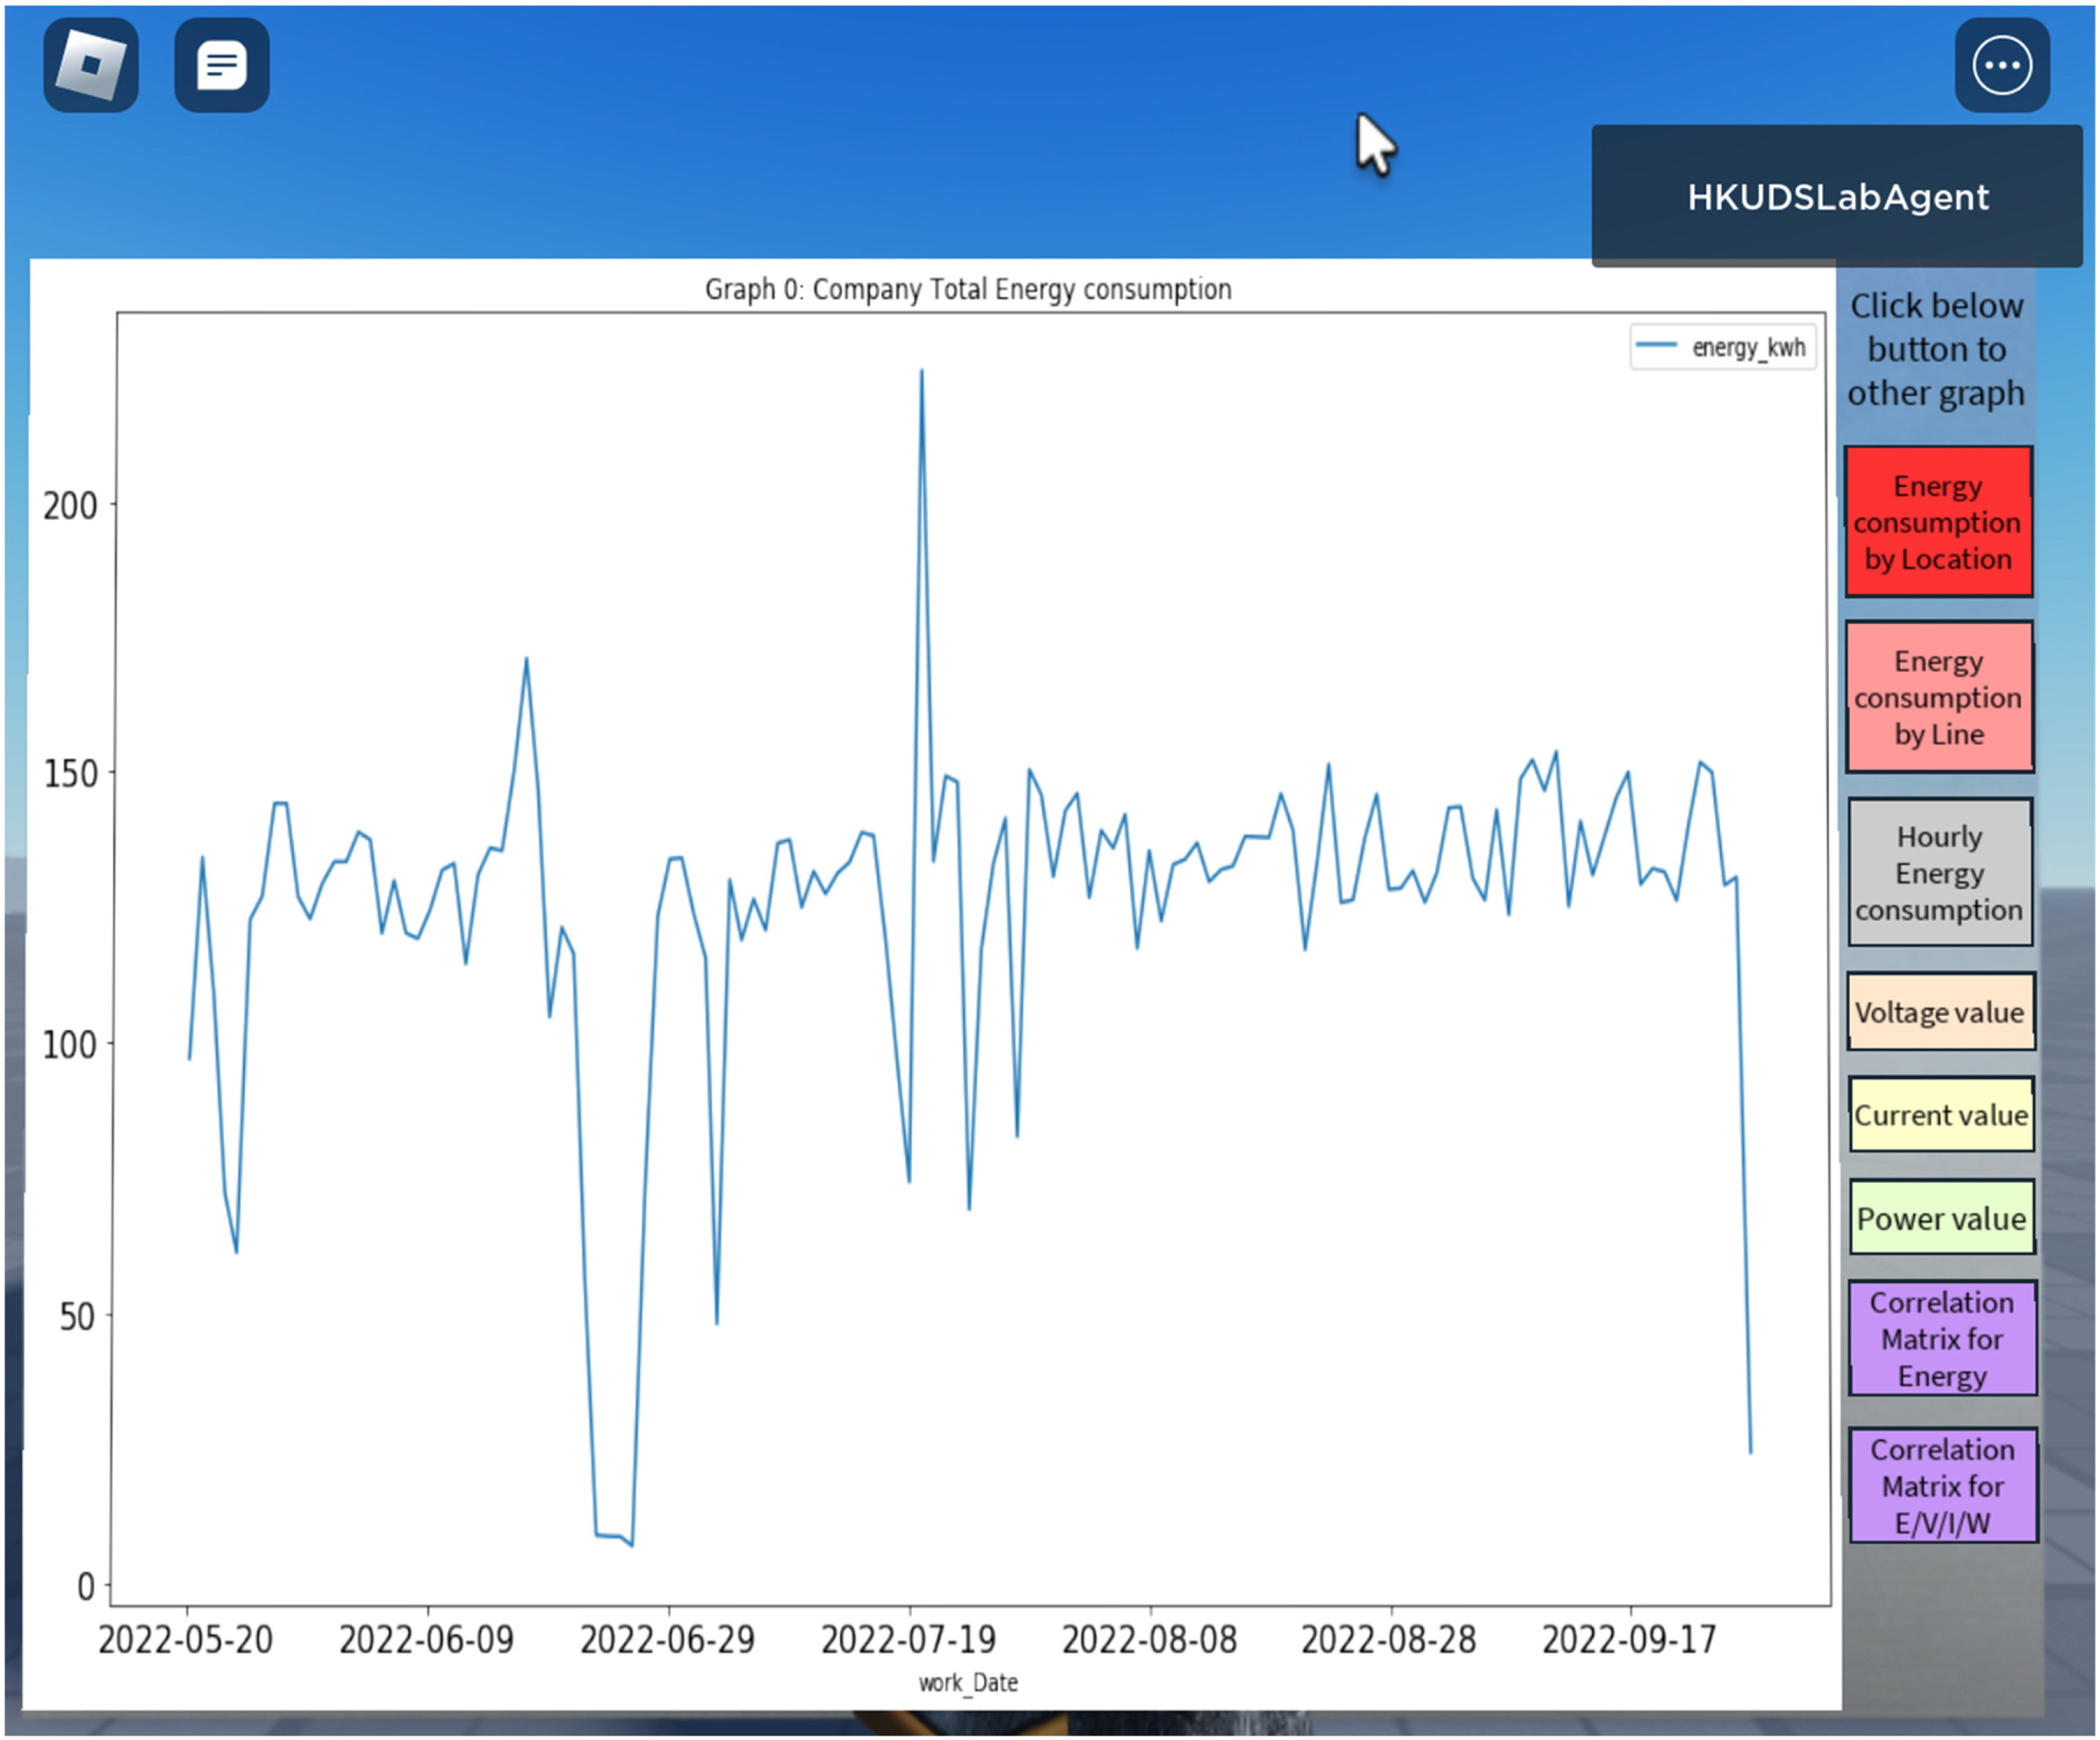
To extract and re-organize the data for multidimensional visualization, evaluation, and analysis, the parent–child relationship in the ontology (Figure 4) was used. In Figure 10, a set of buttons is implemented based on the ontology structure for users to navigate and manipulate the data with VR, AR, or MR equipment for analysis and to create an immersive experience.
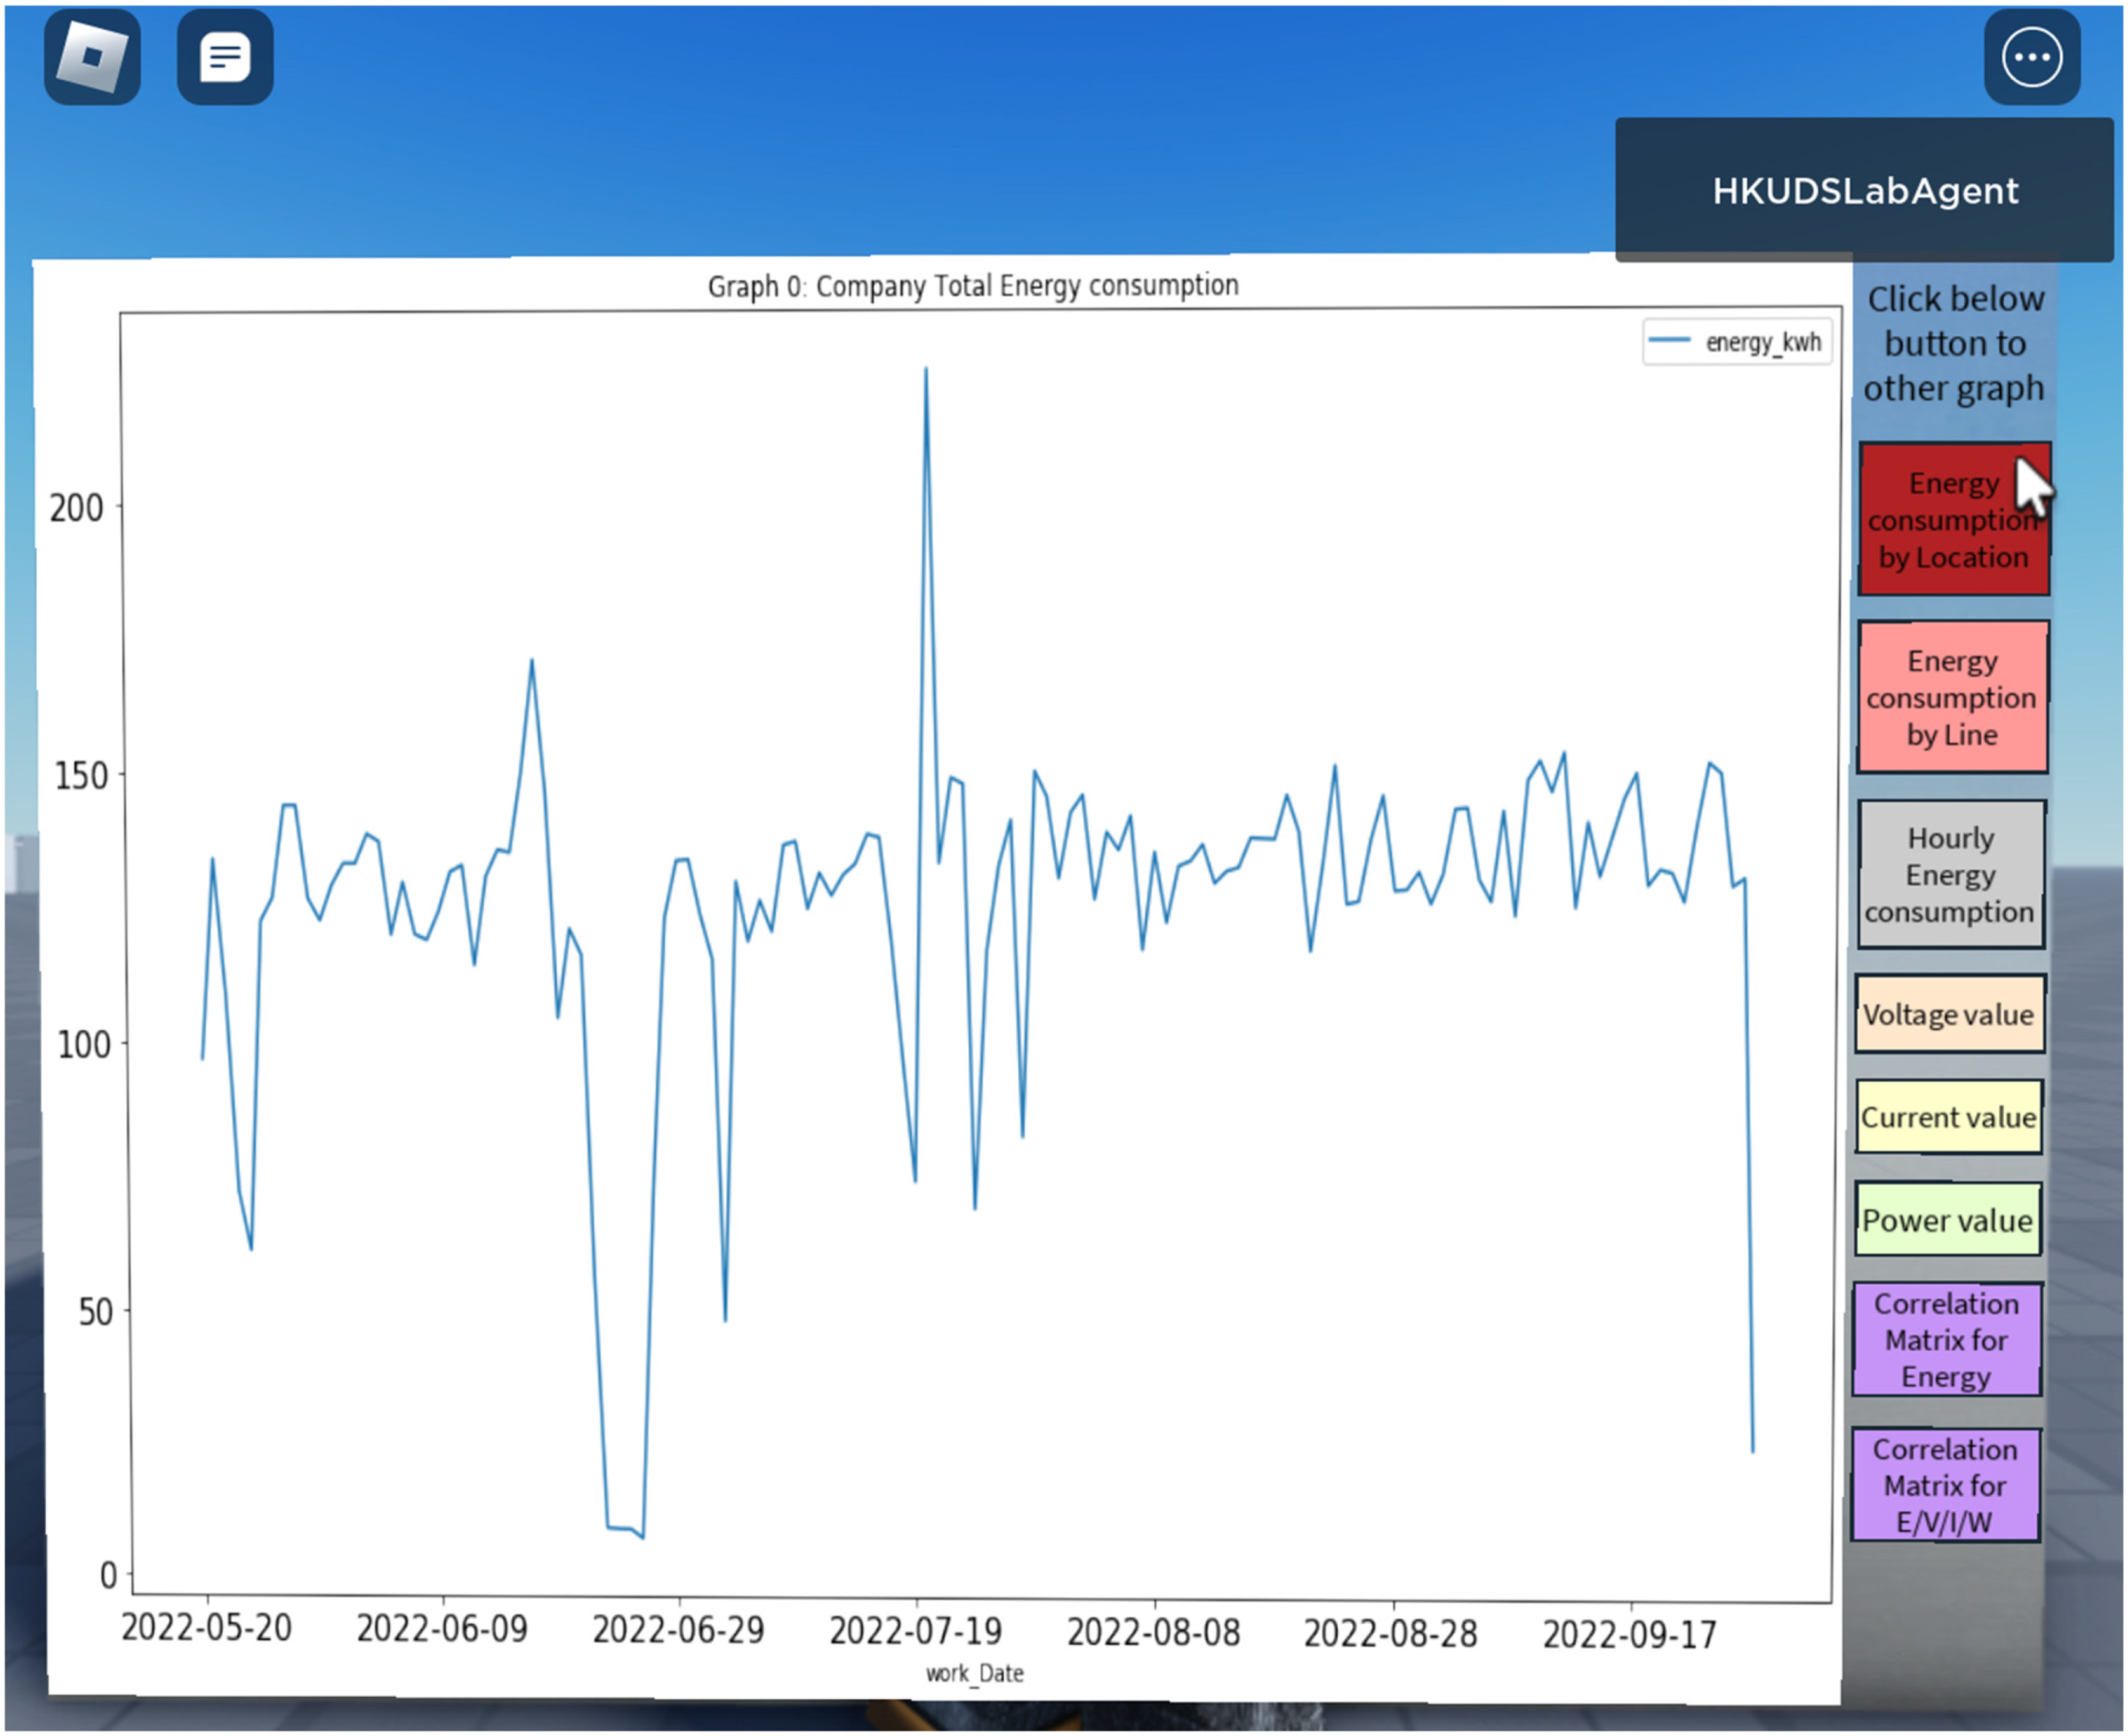
Total company energy consumption.
In Figures 11(a) and 11(b), users can use the ontology buttons to extract data based on the data attributes and parent–child relationships to visualize the new pattern and perform analysis. Hence, 3D data manipulation could identify new insights by relating or comparing the chart's attributes or the parent–child relationships that overcome the limitations of data manipulation in 2D data visualization.
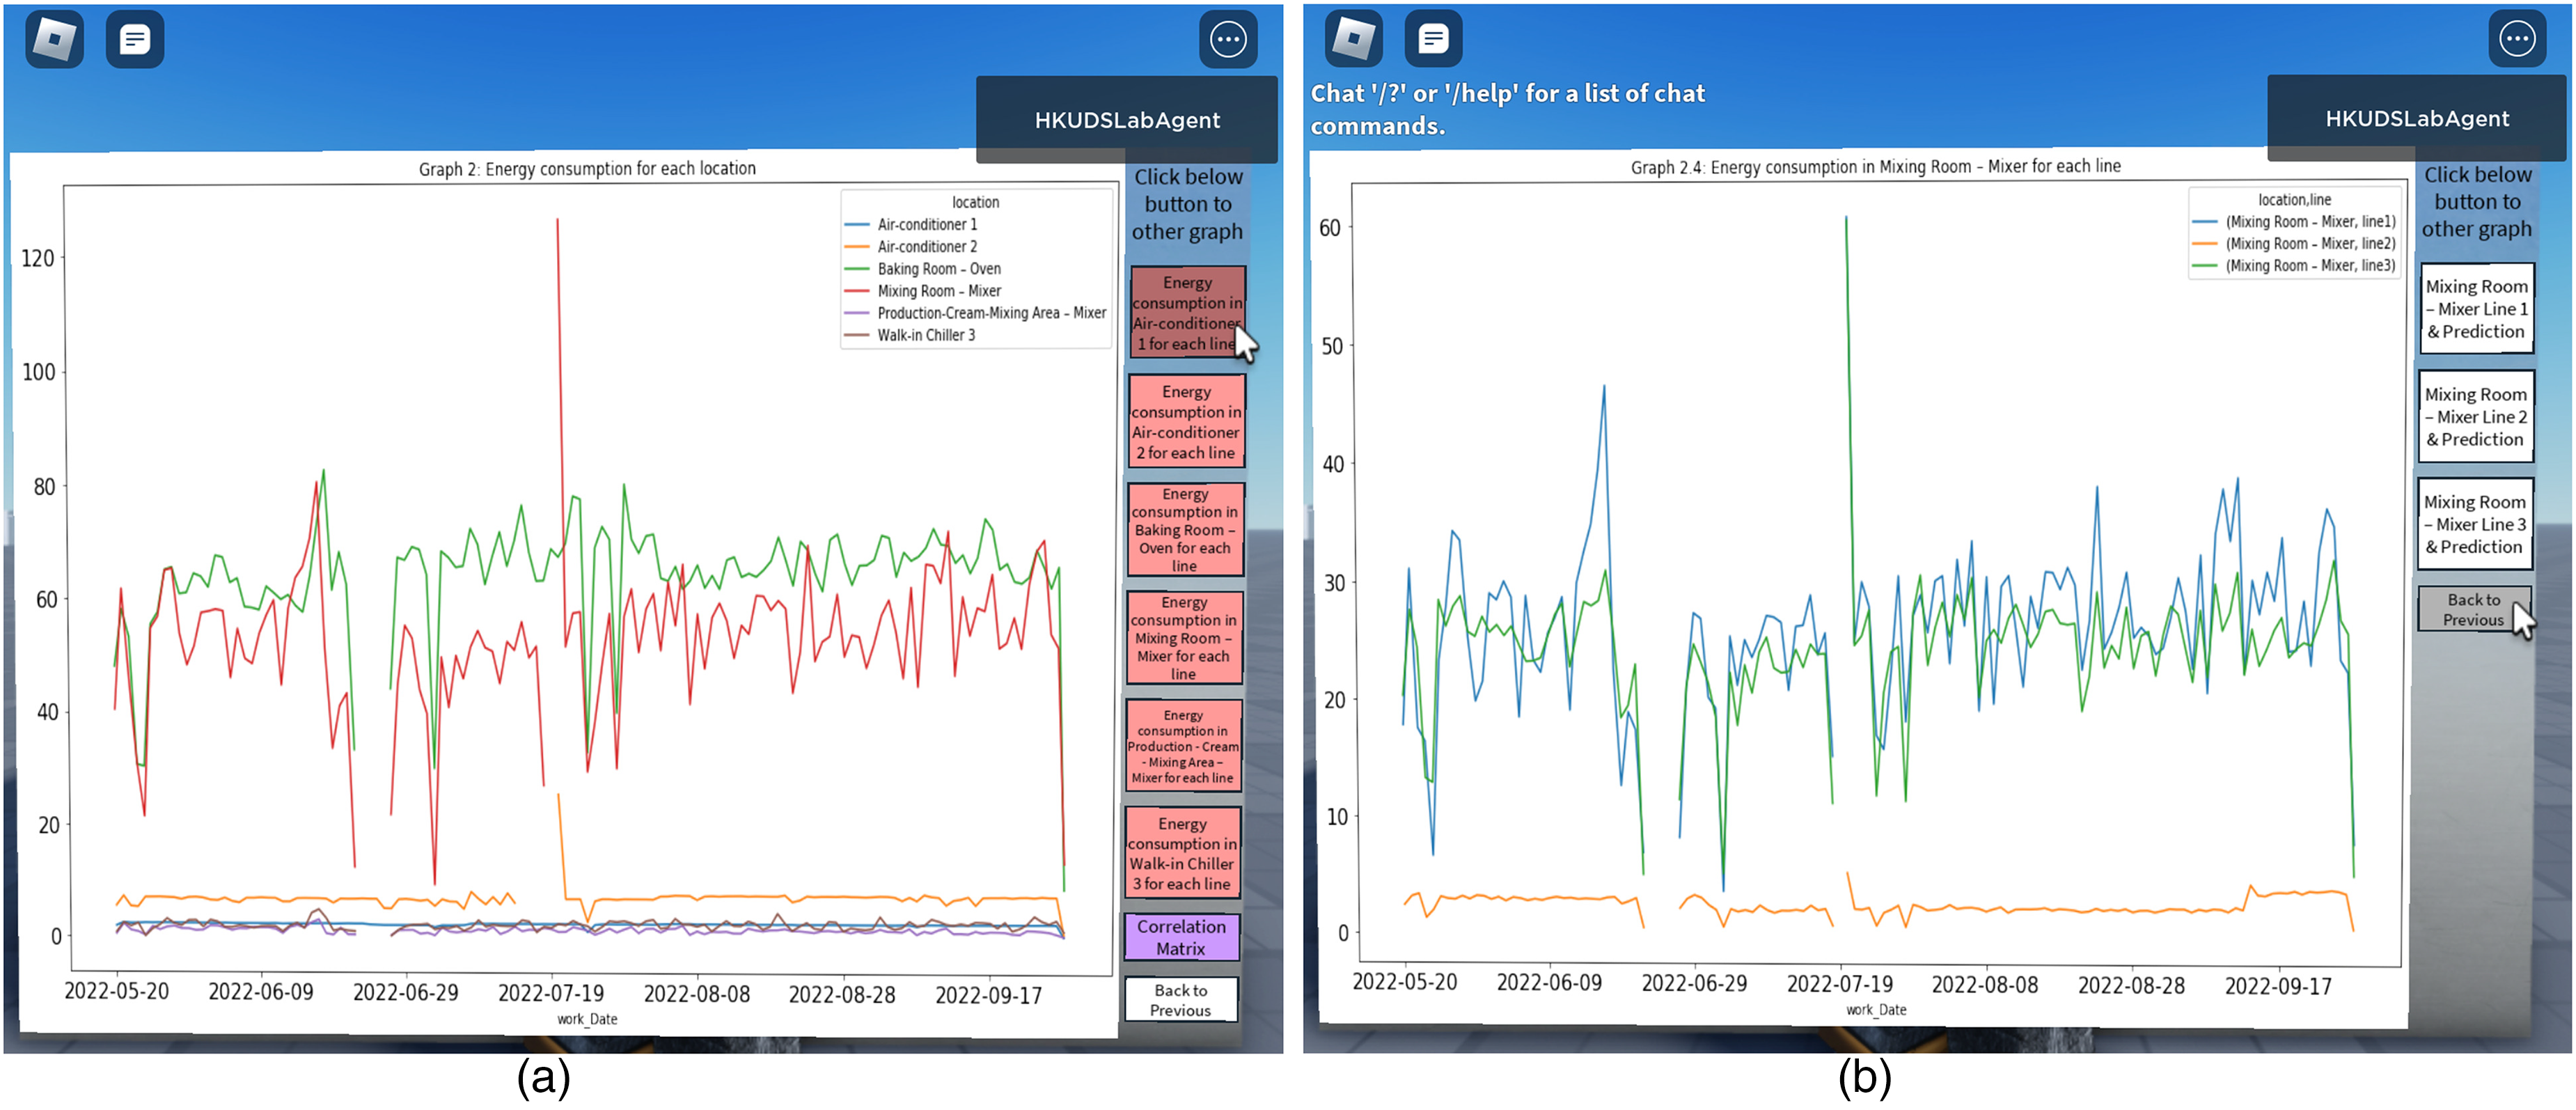
(a) Analyzing energy consumption of six locations; (b) Analyzing the energy consumption of the three lines of a specific location.
User engagement and real-time responses in Roblox's 3D visualization
Figure 12(a) to (d) shows how users can talk to an NPC robot in the dialogue box.
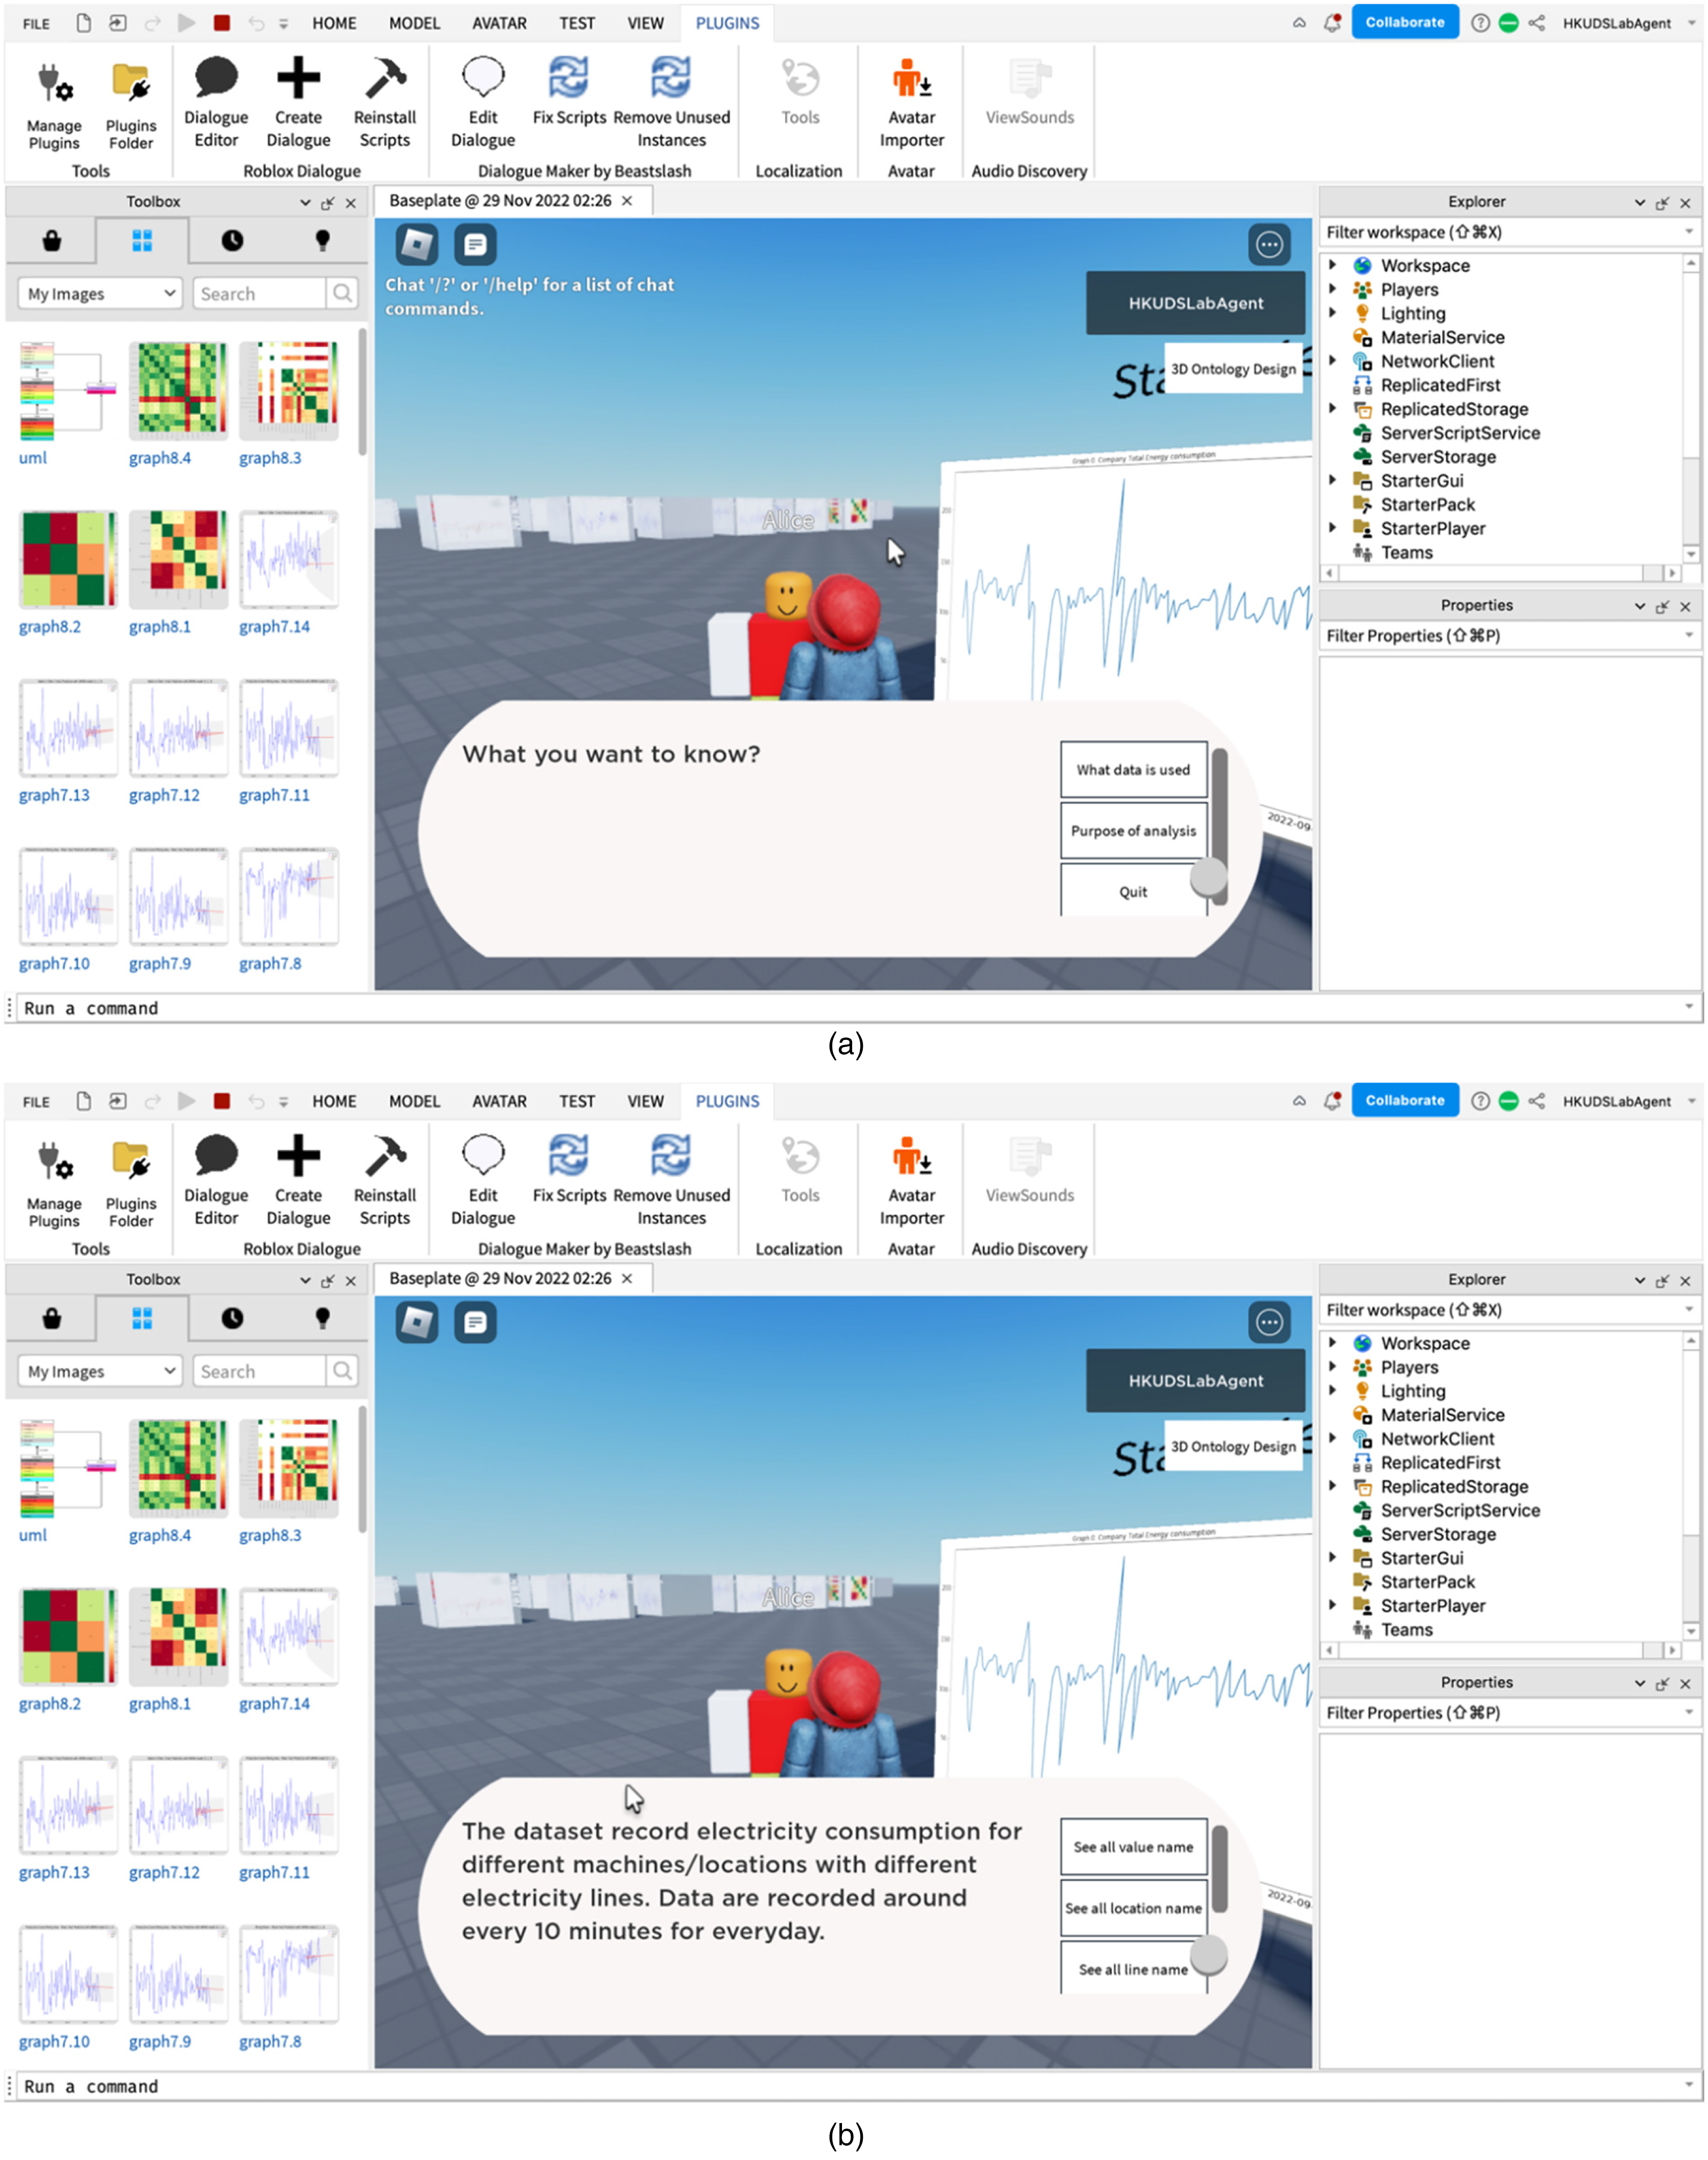
Figure 12. (a) Question in multiple-choice dialogue box from NPC robot. (b) Answer in multiple-choice dialogue box. (c) Text chat with robot NPC. (d) Text chat with robot NPC for chart inquiry.
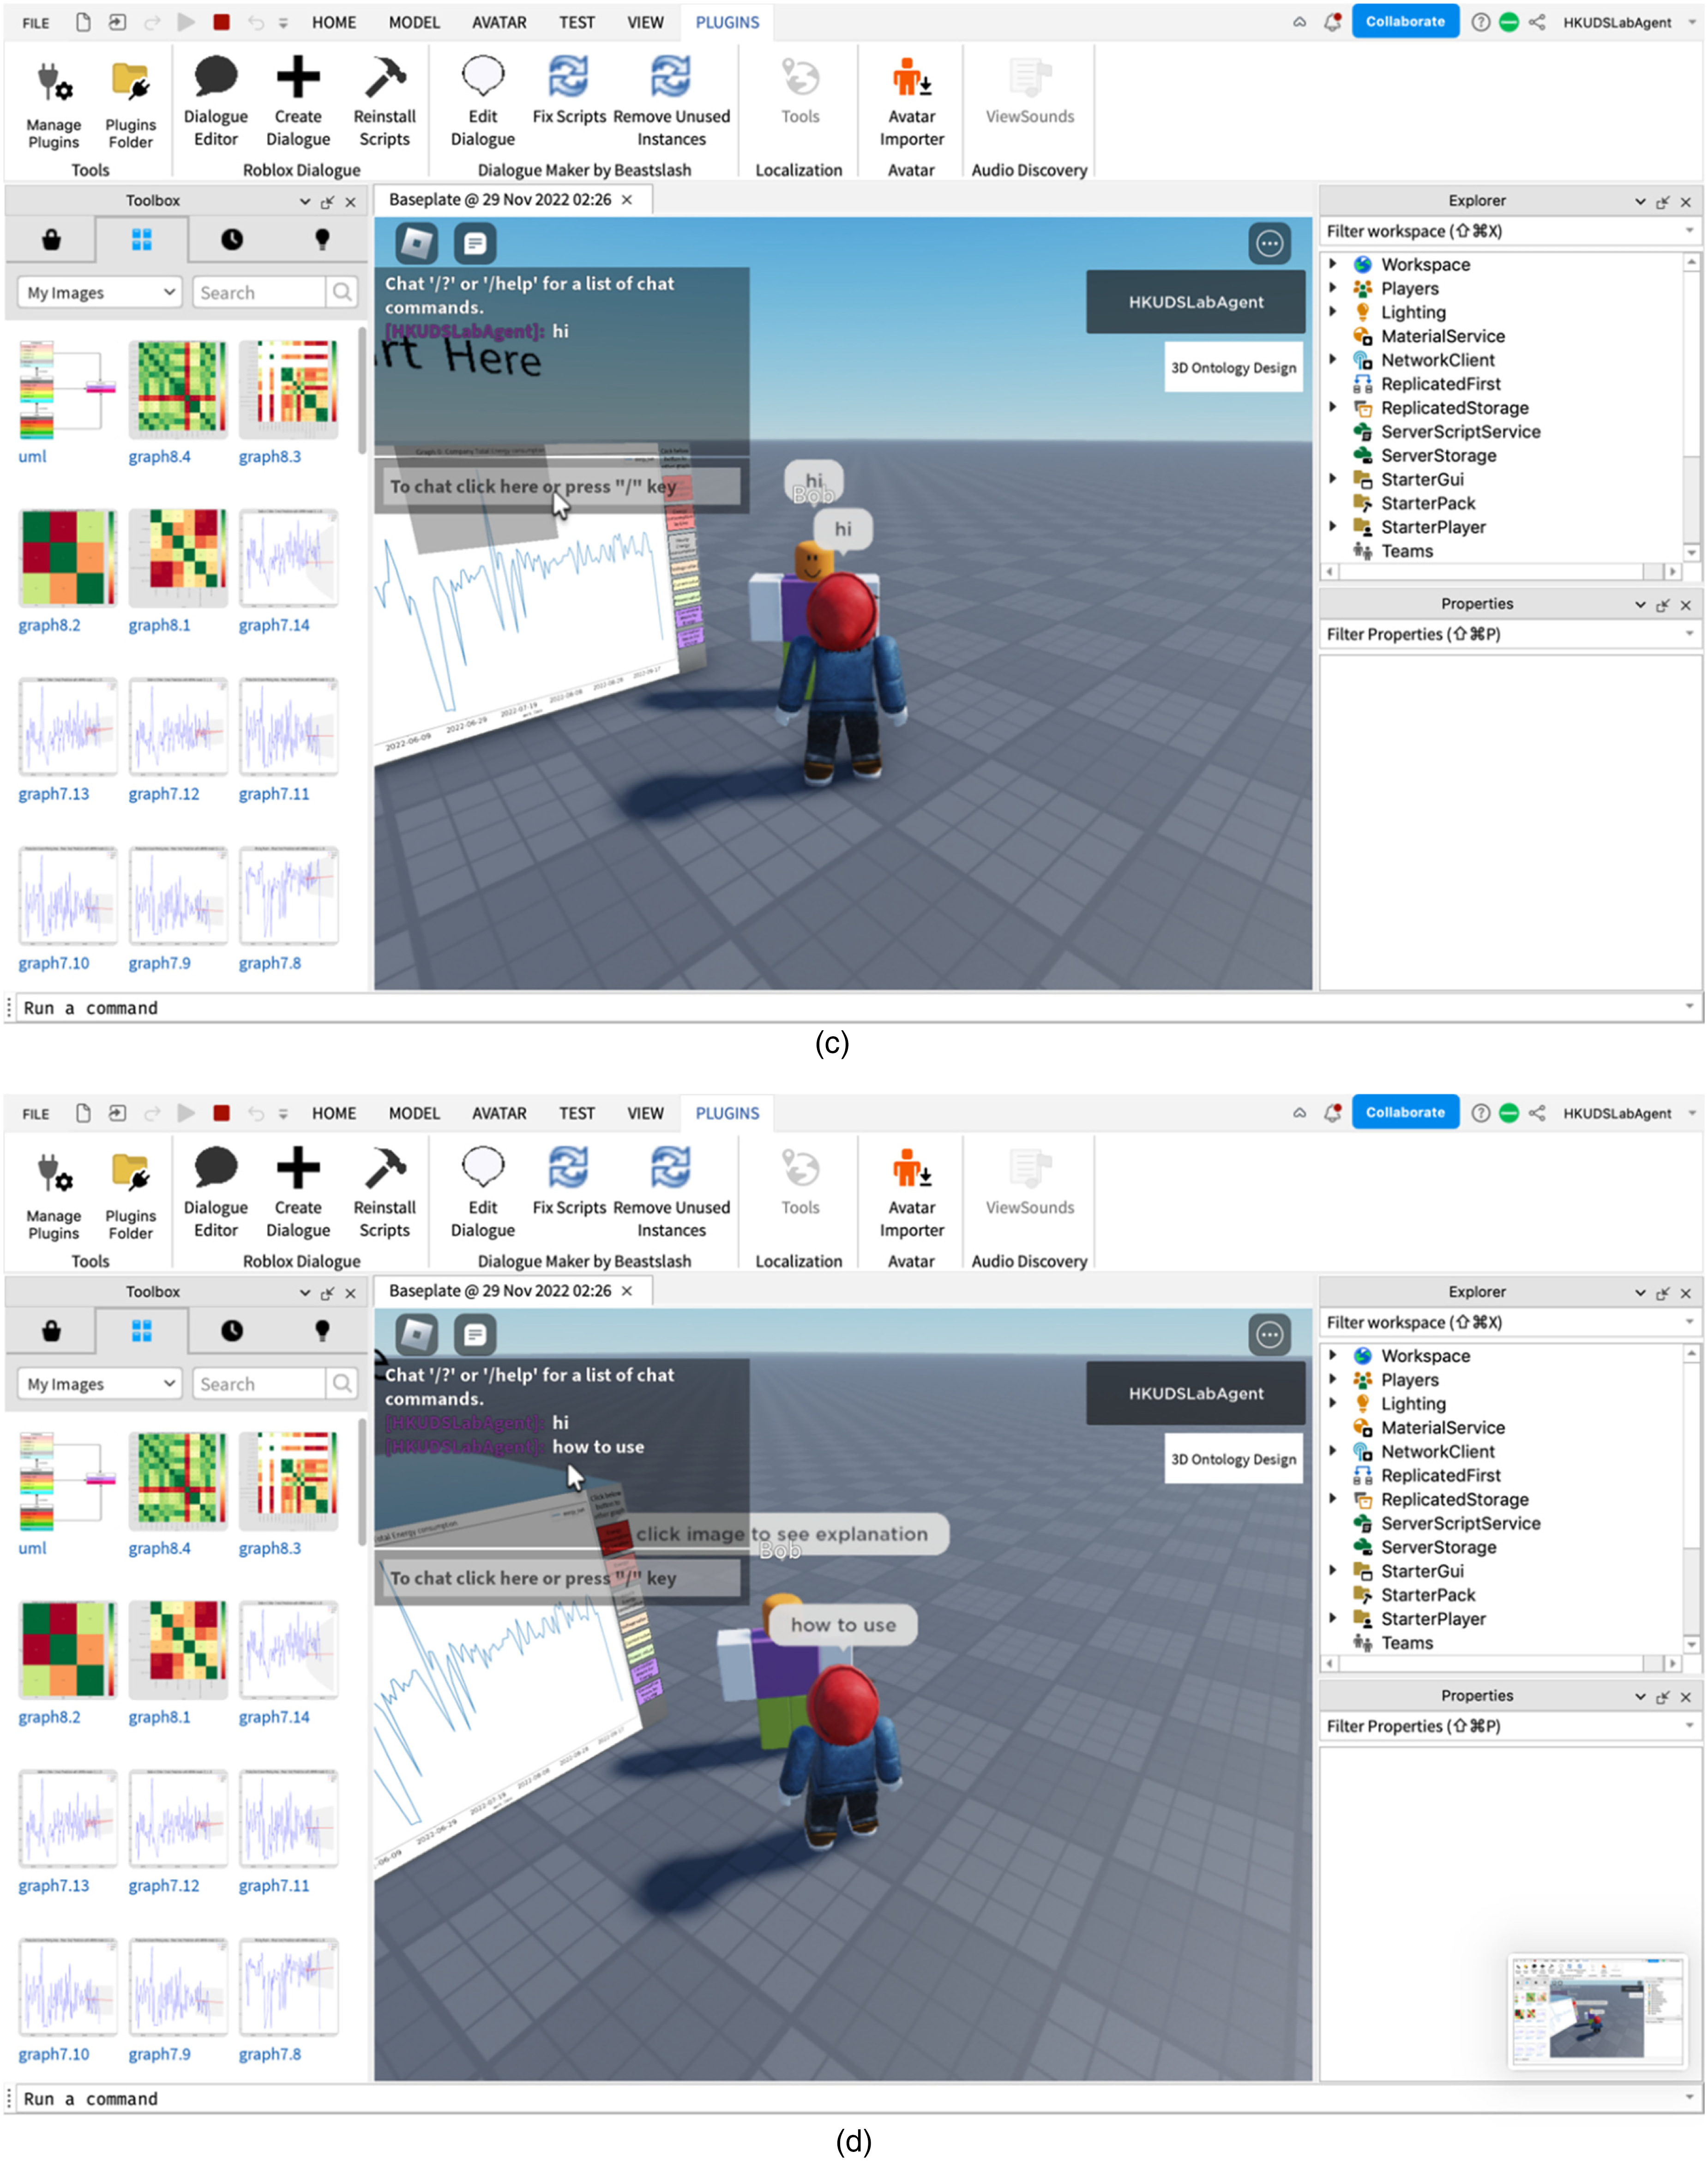
The user can also input a question into the chat, and the NPC can talk to the users via pre-trained answers. An AI chatbox can guide and communicate with teams regarding data analysis, interpretation, and insight creation.
To conclude, this case study implemented 3D data visualization using an ontology and AI models. Ontology provides an information structure and hierarchy. Users can select data from the ontology for data analysis and visualization, and gain a better understanding of the data relationships to identify new insights. Second, the entities and rules in the ontology construct a knowledge base that can be used by a chatbot to guide analysis and visualization. This improves data analysis, particularly for inexperienced users. With AI generating exploratory notes for 3D visualization and recommendations, it is more convenient to identify and analyze abnormal patterns and provide personalized recommendations to users. Because a metaverse enables a group of individuals to interact and exchange concepts collaborative, they can overcome time and space boundaries to work and collaborate to create collective intelligence.
Lessons learnt
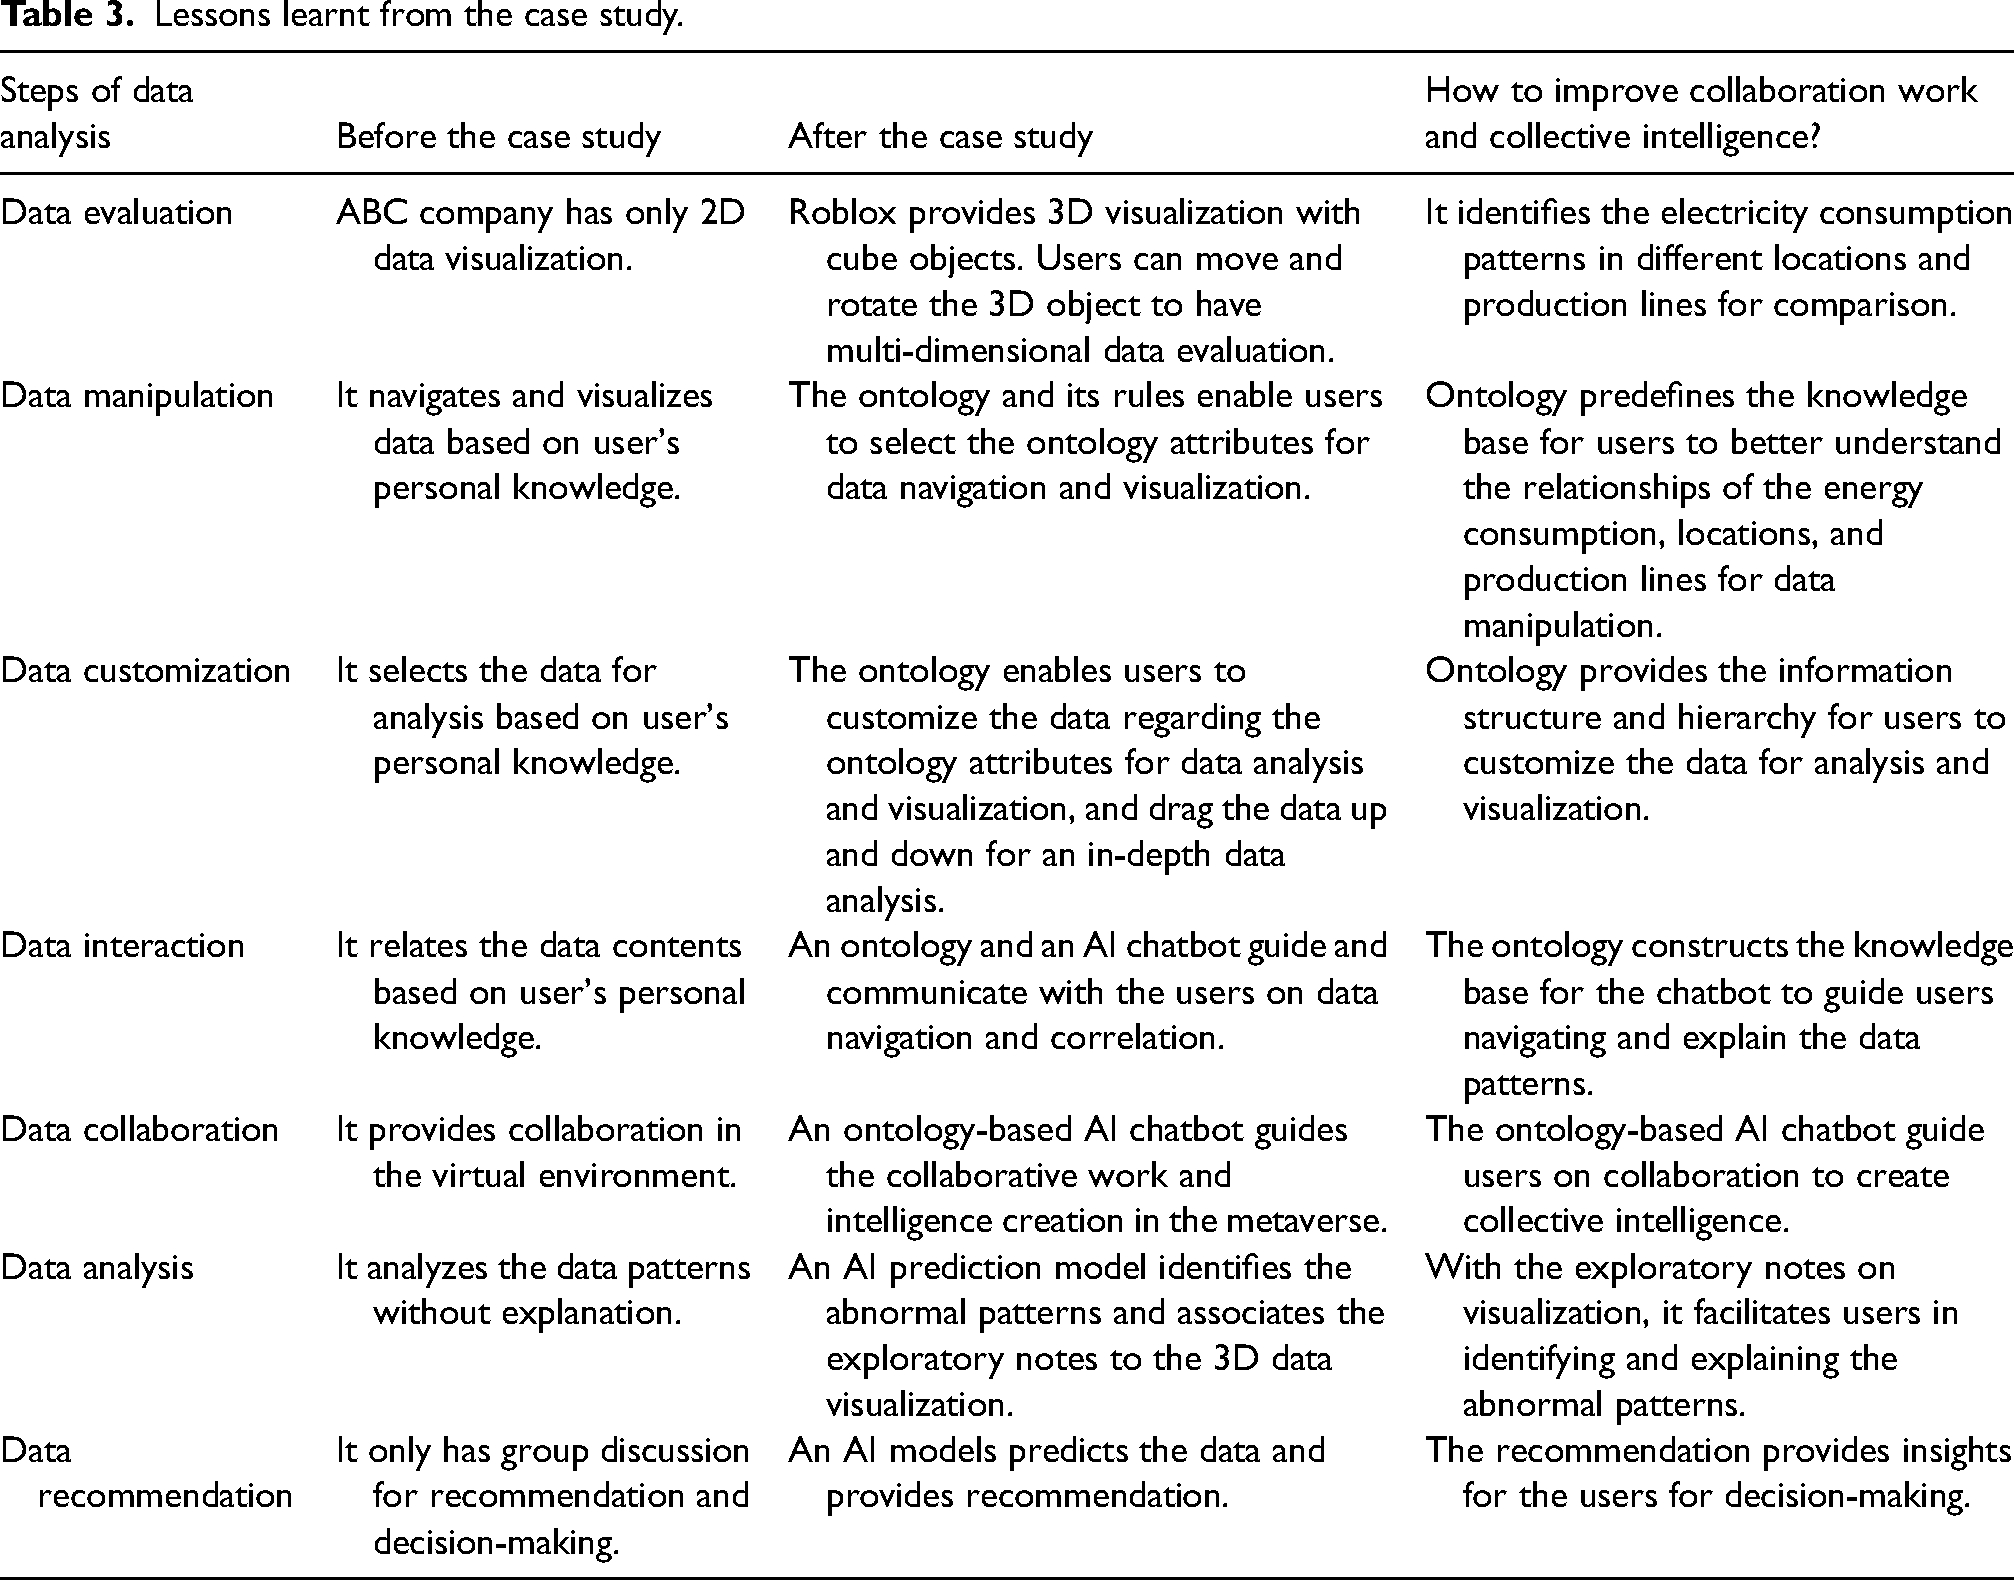
Table 3 summarizes the lessons learned by ABC on how ontology, AI, and 3D data visualization can be deployed in the Roblox metaverse environment to improve collaborative work and collective intelligence.
Lessons learnt from the case study.
An ontology-based AI 3D data-visualization prototype was implemented using the Roblox Metaverse platform. Users could customize, evaluate, and manipulate data in different dimensions by an ontology menu for 3D visualization in a collaborative environment. The AI models identified the hidden patterns by correlation analyses and consumption predictions. The models associated these with the visualization for a convenient-to-understand visual form for users to improve the analysis of electricity consumption. However, improvements can be achieved in future studies.
The current chart should first be produced. Then, an image is imported into the Roblox prototype. In future studies, data uploading, processing, and analysis functions would be added.
Users can modify the data relationships of the ontology, charting, and explanation in the watch or play modes in Roblox rather than in the editing mode. Thereby, they can select views regarding their needs. AI can be used to automatically create explanation notes in 3D data visualization, and auto-detect, auto-explain, auto-correlate, and auto-correct data. The sequence of the current chart is ordered by the UML class diagram relationship. Therefore, users cannot jump directly to the other layers. In future work, a new function could be constructed for users to click a line in the graph or any location in the ontology diagram to view the data. The current visualization is static. A real-time data visualization dashboard can be added to link the database to auto-refresh data and provide real-time warnings to users when an abnormal pattern is detected in the data analysis.
Conclusions and future work
Conclusions
A meta-entrepreneurship information architecture for collaborative work was constructed as shown in Figure 13. Roblox uses session A for users to make an inquiry. Another session (session B) is created to call the apps of the external server to obtain data in Step 2. The data are extracted and analyzed with the AI models in Step 3. The charts and responses are returned in session B in Step 4 for Roblox. Roblox reviews and approves the returned chart image for the 3D cube display in Step 5. Finally, the NPC responds to the user's request in section A.
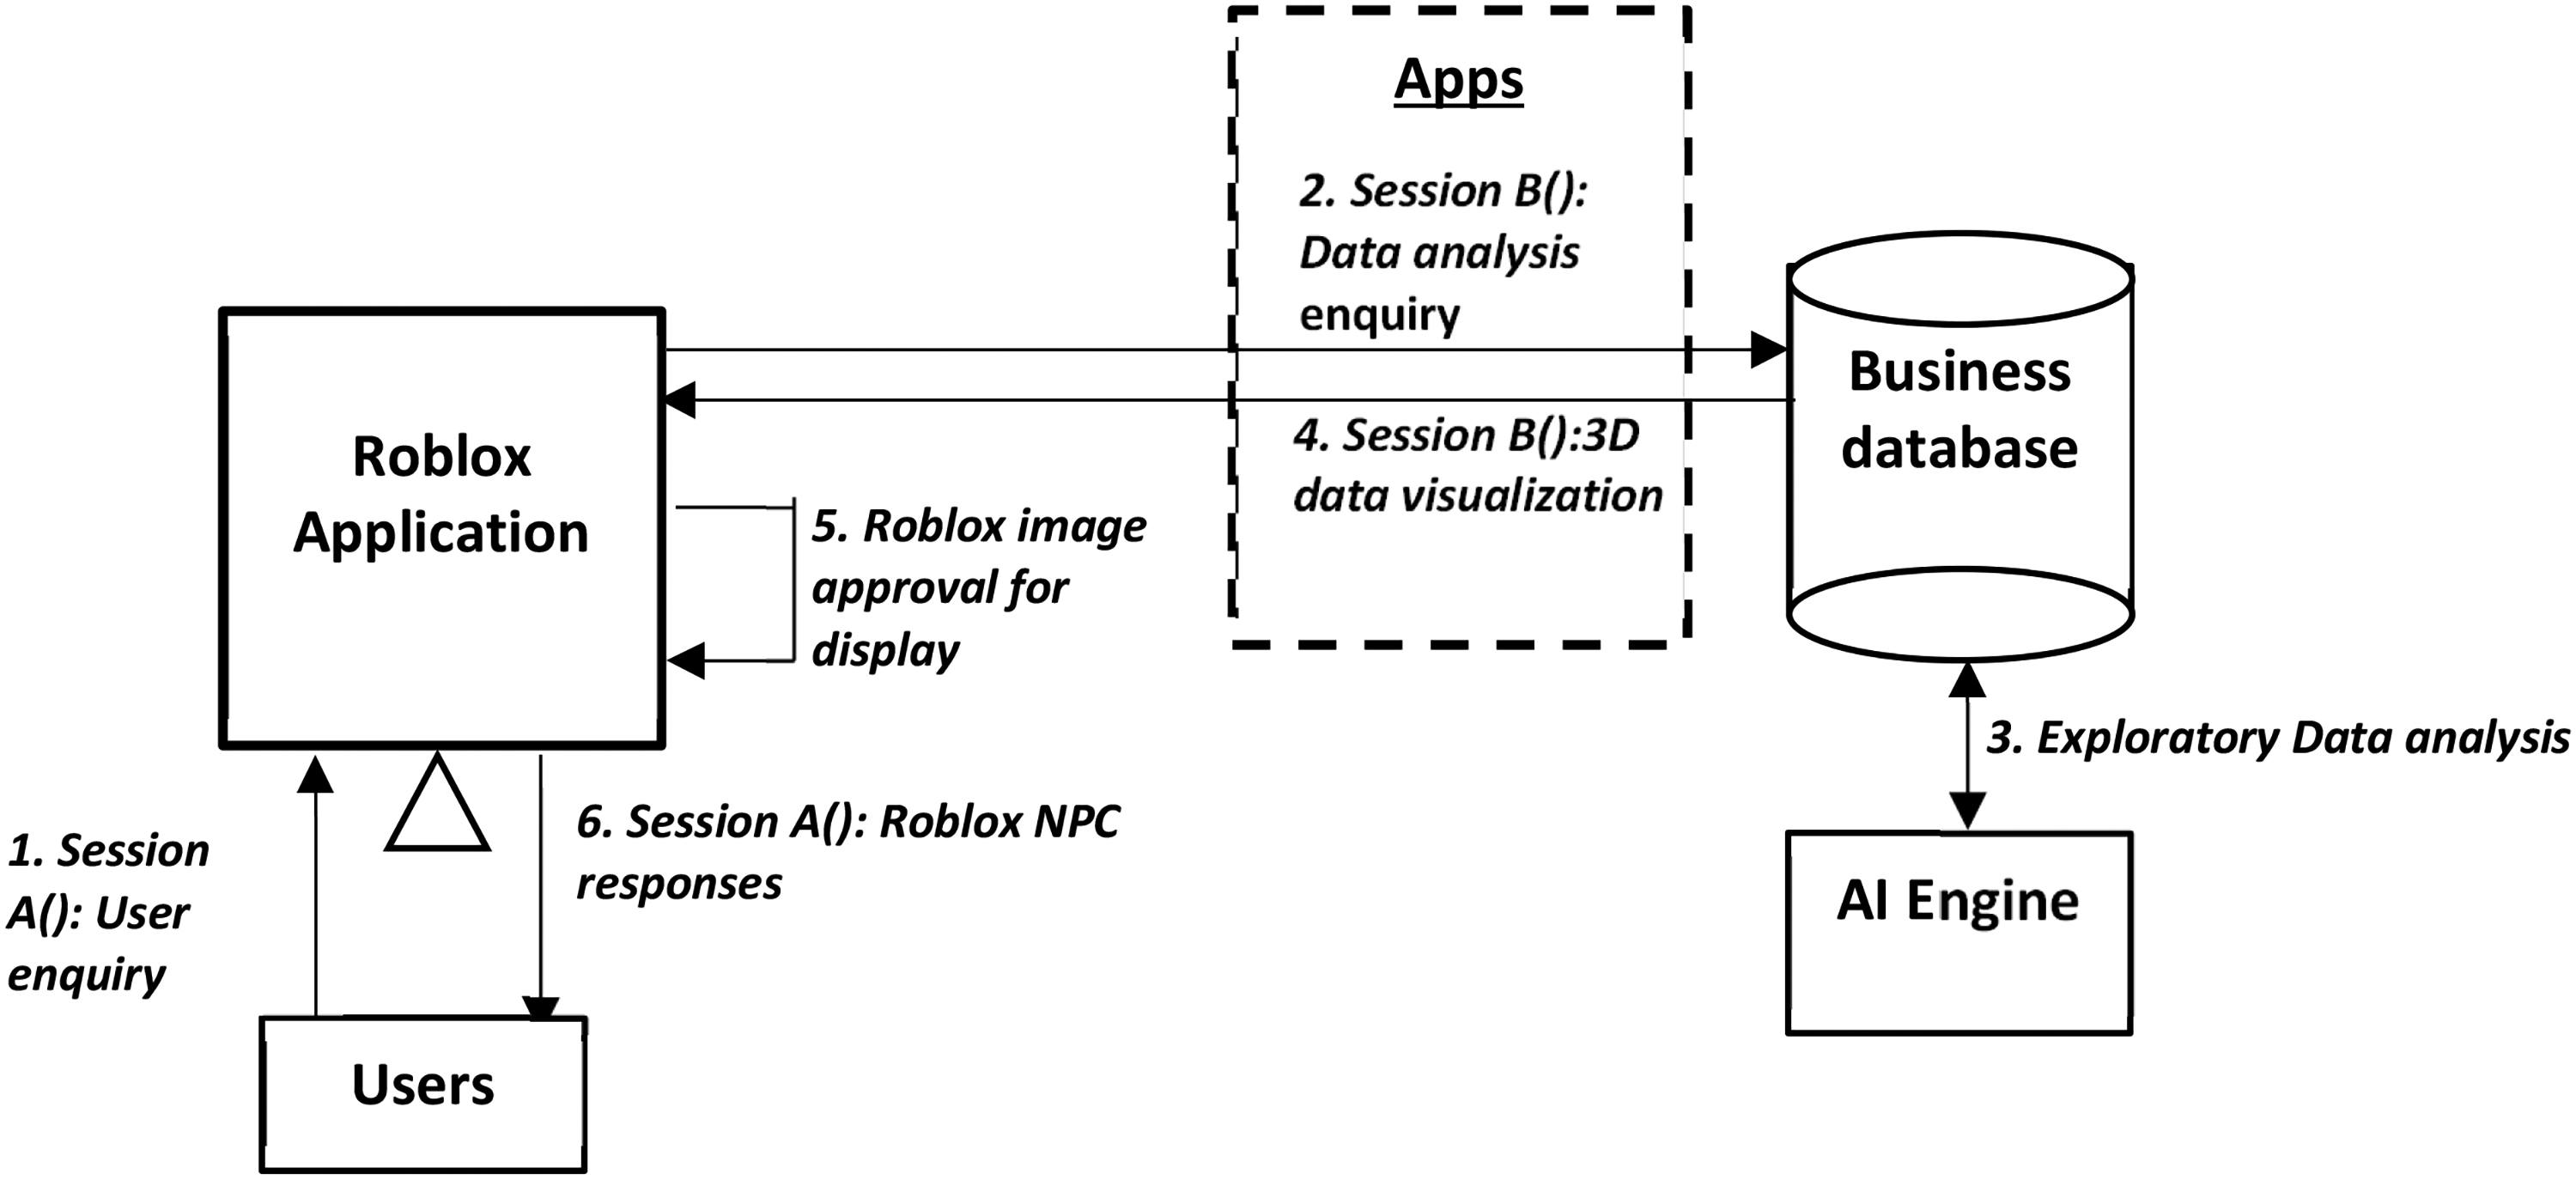
Decentralized information architecture between Roblox application and external servers for collaborative work.
The new features of AI, ontology, and 3D data visualization to overcome the limitations of existing 2D data visualization are summarized in Table 4.
AI-based 3D data-visualization components in the metaverse.
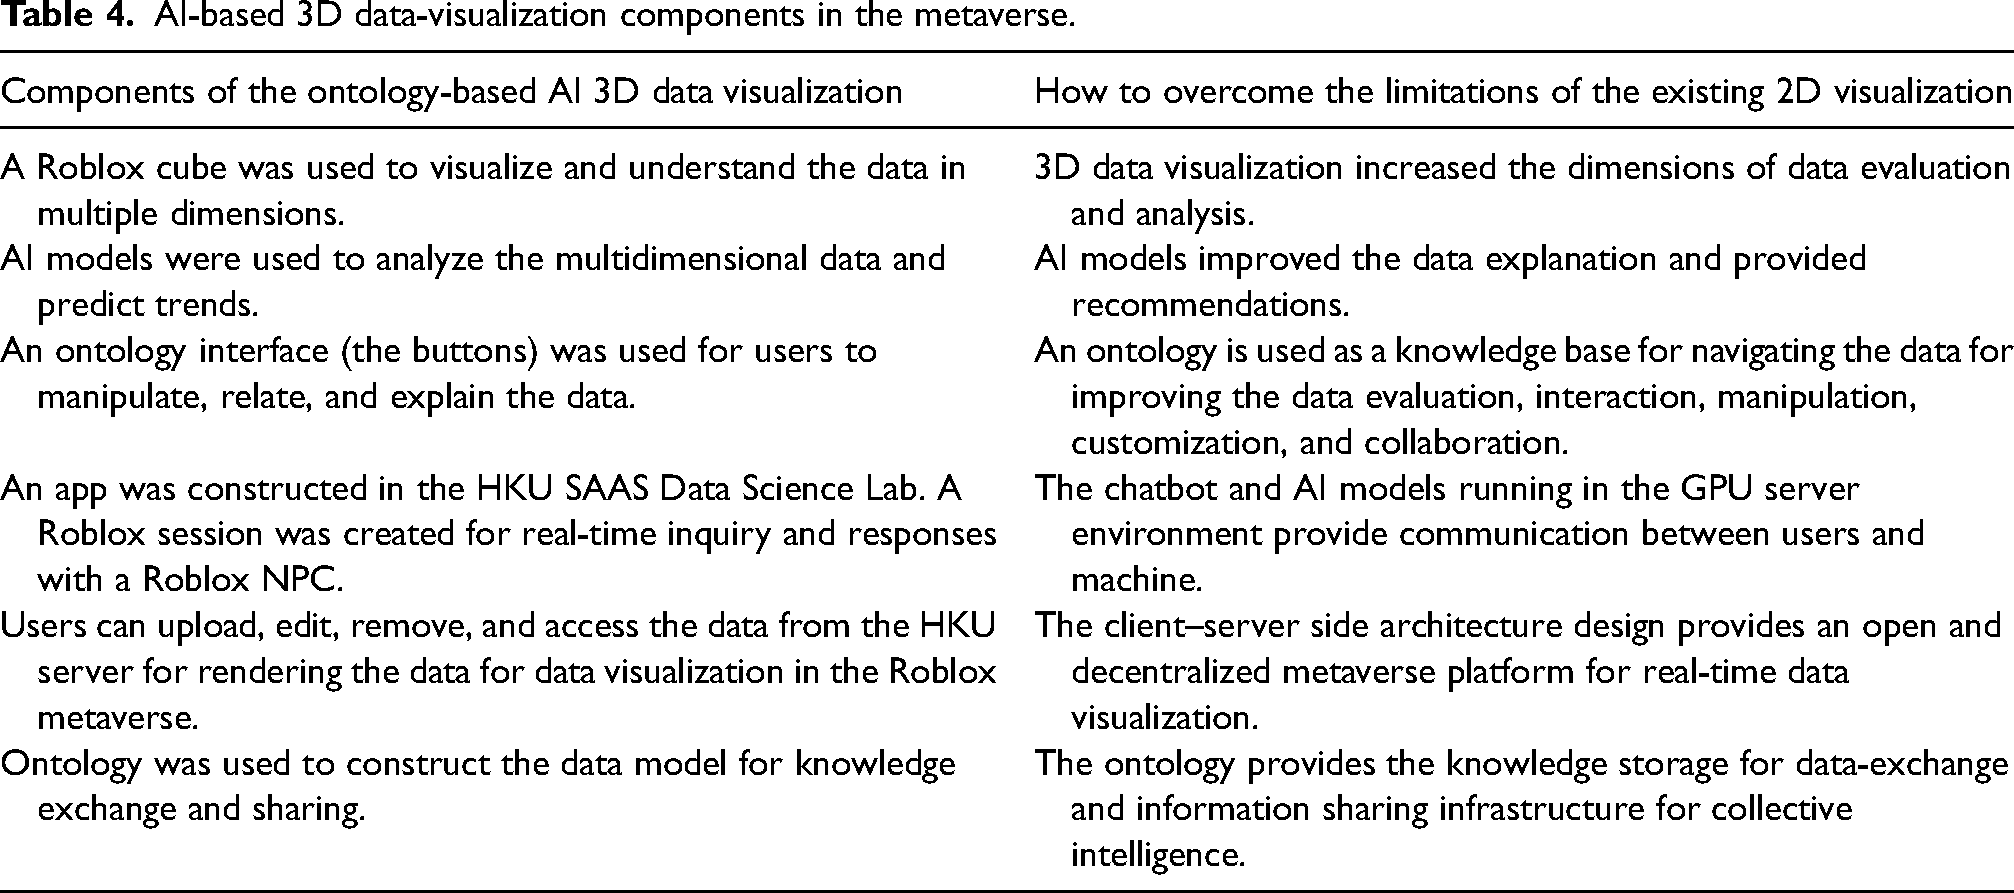
To conclude, with 3D data visualization, ontology, and AI, business knowledge of data analysis can be captured in the ontology and shared in the metaverse to improve business analysis and collaborative work. Business can use AI models to identify and associate knowledge with 3D data visualization for data explanation and insight creation. Because ontology-based AI 3D data visualization enables users to select, interact, and manipulate data in a collaborative metaverse environment. It can create collective intelligence for decision-making and overcome the human, time, and space barriers for collaborative work.
Future work
Figure 14 presents the information architecture of meta-entrepreneurship for future development. EdX.com and HKU CampusLand in Roblox are contrasting examples for comparing the difference between the virtual internet and metaverse platforms for education.
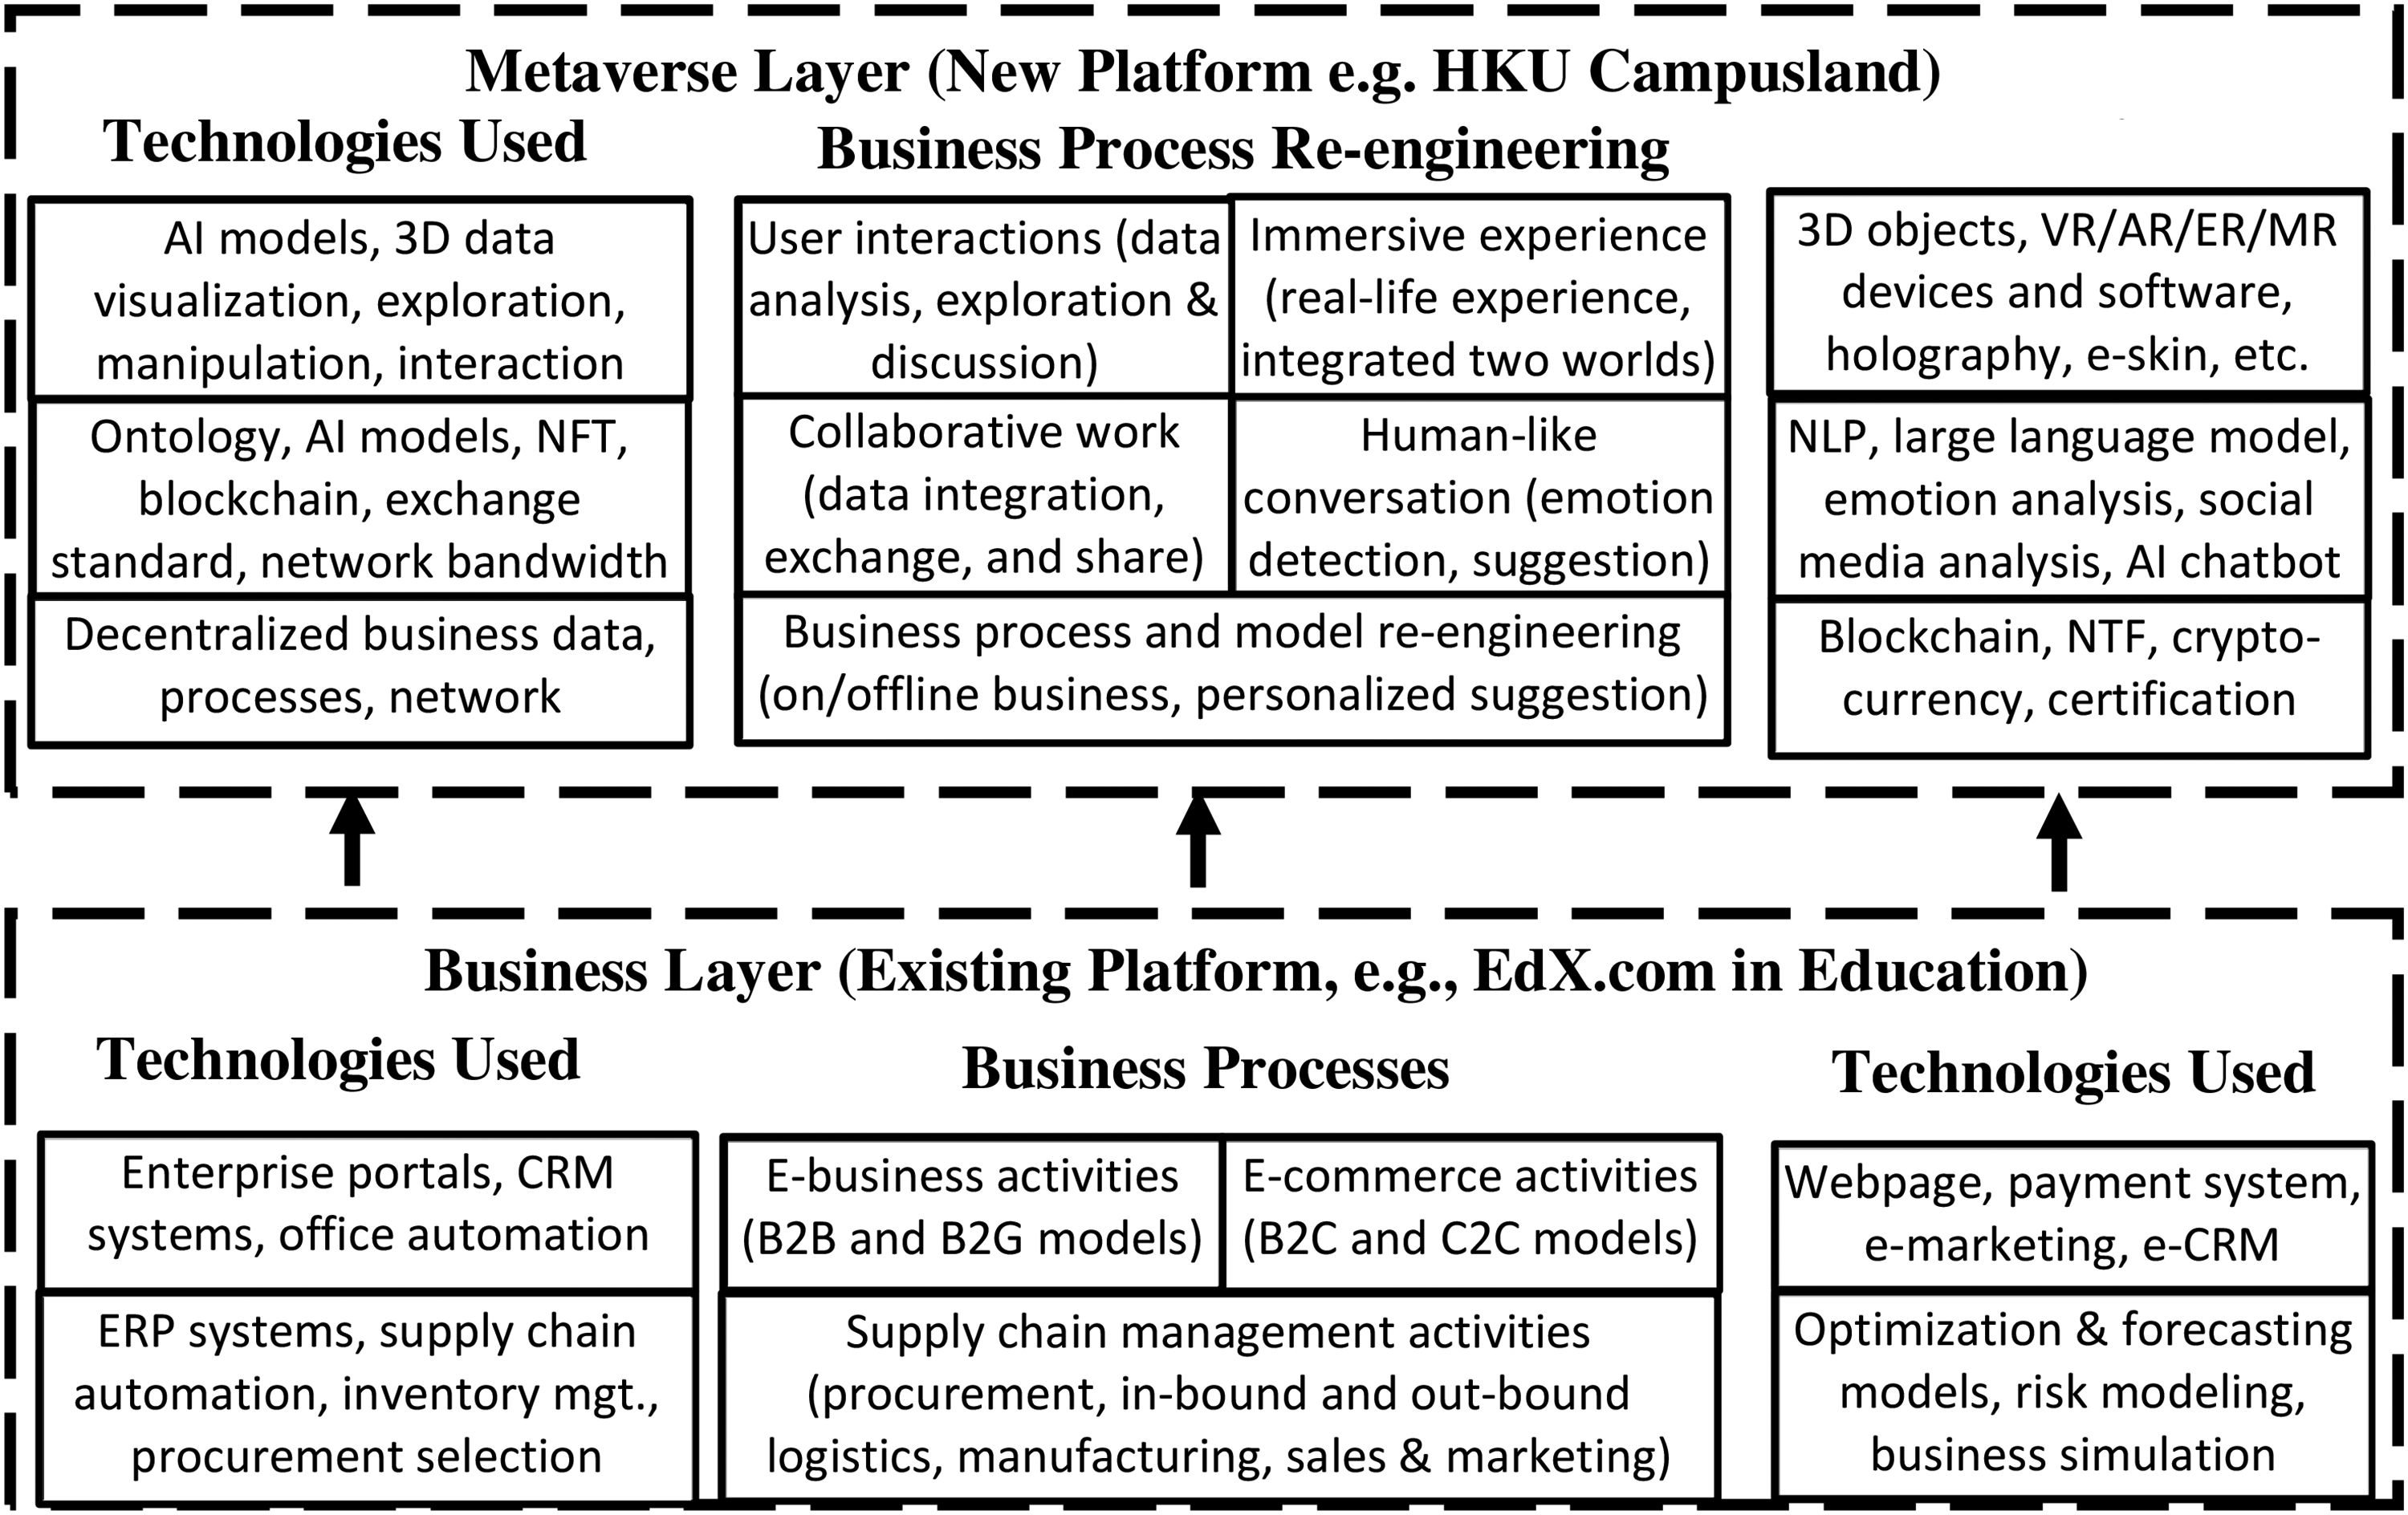
Technology transition from virtual entrepreneurship to meta-entrepreneurship.
To develop meta-entrepreneurship, entrepreneurs should determine the business operations, products, and services to deploy in the metaverse. A metaverse virtual store is constructed to test the new business model and identify customer preferences. Social media is used to determine new product designs and provide real-time customer recommendations. A metaverse requires developers to reflect physical objects in a virtual world (Zhao et al., 2022). However, this requires multiple developers to work collaboratively to develop 3D models of the metaverse. Web services are implemented to share 3D models, AI models, and the ontologies of different domains to scale up the development of meta-entrepreneurship.
Footnotes
Declaration of conflicting interests
The authors declared no potential conflicts of interest with respect to the research, authorship, and/or publication of this article.
Funding
The authors received no financial support for the research, authorship, and/or publication of this article.