
Abstract
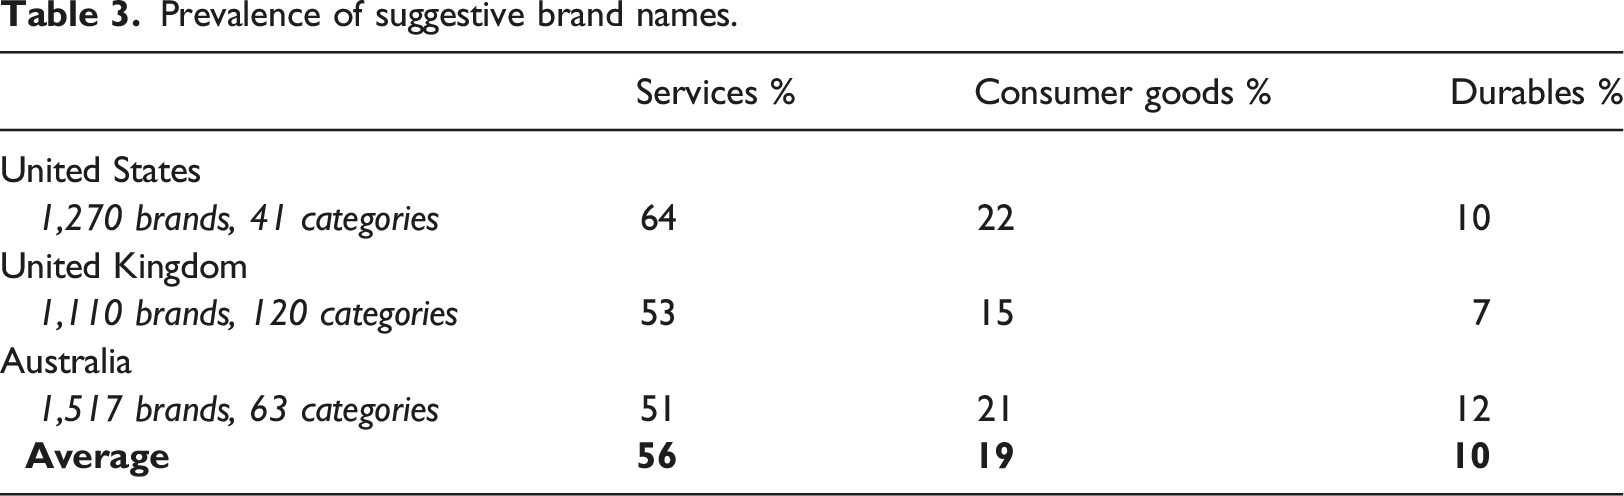
Despite the concept of a suggestive brand name existing for over one hundred years (Viehoever, 1920), the prevalence of suggestive versus non-suggestive brand names has not been documented. Previously, to do so extensively would have taken considerable time and money. We now show that artificial intelligence can replace manual coding with increased accuracy. We found the coding performances of Chat GPT-4 are 34% more accurate than GPT-3.5 and 44% more accurate than human coders. Systematically expanding our research to over 4,600 brands from consumer goods, services, and durables in major English-speaking markets (United Kingdom, United States, and Australia), we find that overall, slightly more than a quarter of all brand names are suggestive - ranging from 10% of durables to 56% of service brands. Further, we expand the suggestiveness research to non-brand name elements of almost 600 Distinctive Assets (e.g., colours, logos) across consumer goods, services, durables, and retailers (in the same three countries), finding that two in five are suggestive. The brand name and Distinctive Asset prevalence distributions are positively skewed, with most categories falling beneath the respective averages. Furthermore, regarding performance, on average, suggestive Distinctive Assets display lower levels of Fame and Uniqueness than non-suggestive Distinctive Assets.
Keywords
Introduction
Suggestive branding was introduced in the early 1900s (Viehoever, 1920) and became popularised following the seminal work of Keller et al. (1998). Suggestive brand names involve deliberately embedding a product and/or category-related attribute or benefit to leverage existing memory structures (Keller et al., 1998). An excellent example of a suggestive name is Specsavers, which contains category (Specs) and product (savers) contexts. Opposingly, non-suggestive names are more abstract or unrelated (e.g., Knorr spices). Within marketing literature, brand suggestiveness definitions closely align with the seminal paper (Keller et al., 1998), with subsequent studies adopting attribute (Sen, 1999), feature (Muzellec, 2006), or benefit (Kohli et al., 2005; Lam et al., 2013) classifications.
Minimal knowledge exists to demonstrate how often suggestive names are used in different industries, categories, and countries and how effective they are in each circumstance. However, marketing practitioners value suggestive brand names instead of non-suggestive alternatives (Romaniuk, 2022). Although marketers claim they value suggestive names, there is confusion about the translation into practice. The most extensive study explores the popularity of brand name types used by the top 500 brands in the United States and finds that suggestive names make up 15% (Arora et al., 2015); contradicting industry beliefs (Romaniuk, 2022).
Twenty-five years after Keller et al. (1998) argued for implementing suggestive brand names, studies have primarily examined the effects on recall and attitudes, citing memory theories to understand findings (Sen, 1999). Thus, focusing on the intricacies of suggestive naming, neglecting the if and when they should be used. Although exploring prevalence through brand name type popularity has indirectly occurred (Arora et al., 2015), more extensive suggestiveness research is required to confidently establish whether the gap between marketer beliefs and implementation exists.
Undertaking prevalence research on a large scale is traditionally timely and costly, with tedious collection posing risks to accuracy. Thus, our study is the first to demonstrate the viability of employing artificial intelligence, specifically GPT-4, to solve this problem. Due to the help of artificial intelligence, brand name prevalence has been determined for over 4,000 brand names, over 200 categories, across three industries (i.e., consumer goods, services, and durables), and three dominantly English-speaking countries (i.e., United Kingdom, United States, and Australia) wherein GPT-4 performs best (Learnship, 2023; Ray, 2023).
Furthermore, current research is adept at exploring suggestive brand names. However, Distinctive Assets also contribute to branding success (Zaichkowsky, 2010). Distinctive Assets are the non-name elements that make up a brand’s identity (e.g., logos, slogans, characters) (Romaniuk & Sharp, 2016). The current study adds to the extant literature by expanding into suggestive Distinctive Assets (e.g., the Burger King burger logo) and determining their prevalence in four distinctly varied industries (i.e., consumer goods, services, durables, and retailers (Saji et al., 2013)) across three English-speaking countries (i.e., United Kingdom, United States, and Australia).
Although exploring the prevalence of a suggestive name is a critical first step, there is further value in exploring suggestive Distinctive Assets; their Fame and Uniqueness can measure their strength. Such measurements discern whether suggestive Distinctive Assets outperform non-suggestive equivalents (or vice versa), providing practical insights into their comparative effectiveness. Subsequently, our findings give insights into the efficacy of these branding practices in different sectors. Hence, marketers can refine their strategies and make informed decisions rooted in country, industry, and category-specific knowledge regarding how often and how well suggestive brands perform.
Background and research questions
Brand name suggestiveness and Associative Network Theories
The Associative Network Theories (ANT) (Collins & Quillian, 1969) and the Spreading Activation Theory (SAT) (Anderson, 1983) are often applied to explain how suggestiveness operates in consumer memory. Similar to memory structures, brand knowledge is conceptualised as a collection of nodes or items of brand information that are interconnected by links to form an associative network (Anderson & Bower, 1980; Collins & Quillian, 1969; Romaniuk, 2013; Vaughan et al., 2021). ‘Suggestiveness’ can be classified as attributes (represented as nodes) that attach to a brand, forming a direct link (Keller, 1987). The number of connections impacts the probability of retrieval (Alba & Marmorstein, 1987; Krishnan, 1996). More links mean more pathways and a higher chance of node activation (Romaniuk, 2003). The quality and quantity of node connections differ among people and change over time (Hutchinson & Alba, 1991).
Hence, suggestive brands should have a mental advantage over non-suggestive brands. For example, the Specsavers brand name (i.e., saving on spectacles) and Distinctive Assets (i.e., the glasses-shaped logo) tap into suggestiveness. The congruency of the link between associations should mean the information is learned and remembered more easily (Keller, 1993). However, non-suggestive brands can still forge connections through other means, like advertising (Vaughan et al., 2021).
Brand name suggestiveness and Interference Theory
Conversely, interference theory demonstrates the potential drawbacks to suggestive naming strategy (Keller et al., 1998; Lam et al., 2013). The theory is concerned with information containing a strong link that impedes information that has not formed as strong a connection (Murnane & Shiffrin, 1991; Postman & Underwood, 1973). For example, when a brand expands into a new category, suggestive attribute/s may not transfer well and become non-suggestive with the risk of confusion (Keller et al., 1998).
Keller et al. (1998) found suggestive names performed poorly compared to non-suggestive names when the associated attribute was inconsistent with the name’s suggestion (e.g., using LifeLong Luggage being stylish). Thus, using a non-suggestive name is recommended. Although brands will not benefit from forming immediate connections to target information, they have directional flexibility (Keller et al., 1998). However, subsequent studies question this advice, inferring these challenges can be overcome (Lam et al., 2013), or they are non-issues (Sen, 1999), perhaps due to memory interferences differing from person to person, attributed to having varying experiences (Morin, 2011), and learning new information (Ellis & Lambon Ralph, 2000).
Meanwhile, Sen (1999) found that names suggesting a product’s attribute are more readily remembered than names suggesting a category connection. The findings were against Keller et al. (1998)’s recommendation that specific brand names will struggle when applied to unrelated brand extensions, as product suggestiveness is more specific than category suggestiveness. Over a decade later, Lam et al. (2013) found a middle ground to the contention between Keller et al. (1998) and Sen (1999). The study explained suggestive names are limited in their abilities, but extendibility issues can be combated with careful marketing strategy. Should a brand wish to extend beyond a product benefit tied to its name, it can leverage the parent brand name that relates to the category, which links to more general associations, receiving the advantages of a suggestive name, whilst remaining unattached to a specific attribute, that would otherwise leave a brand pigeon-holed.
Brand suggestiveness and attitudinal responses
Other research on brand name suggestiveness pays greater attention to the attitudinal response of the consumer (e.g., Djedi, 2018; Lee & Ang, 2003). Akin to previous studies, Lee and Ang (2003) found that suggestive names not only receive greater recall but a more positive attitudinal response than non-suggestive names. Djedi (2018) found that the strength of the attributes linked to a suggestive name overpowered any other information provided and could lead to negative perceptions. Subsequently, this study introduced the potential for suggestive names to have negative connotations associated with the direct link.
Gunasti et al. (2020) investigated how product consumption journey situations compete with suggestive brand names for attention when incongruent with one another (e.g., products with high tartare concentration but misguided naming - cavity protection). Results varied, finding the brand name was favoured in situations before (ingredients on pack) and after product use (emotions after watching a clip). However, product usage experiences (printing quality) outpowered the name. The findings primarily tie into the fact that, on average, shoppers spend less than 13 seconds purchasing from a category online and offline (Anesbury et al., 2016; Hoyer, 1984); thus, the true product performance is not always known.
Limitations of brand suggestiveness research
Previous suggestiveness research exhibits limitations. Research has over-relied on student samples (e.g., Gunasti et al., 2020; Kara et al., 2020; Lam et al., 2013; Sen, 1999), fictitious brand names (e.g., Djedi, 2018; Gunasti et al., 2020; Keller et al., 1998; Sen, 1999), and small sets of data with less than ten names (e.g., Djedi, 2018; Gunasti et al., 2020; Kara et al., 2020; Keller et al., 1998; Lam et al., 2013; Lee & Ang, 2003; Sen, 1999). These practices are advantageous to researchers through substantially reducing time and monetary costs (Espinosa & Ortinau, 2016). However, they minimise the applicability of results to the real world (Yoon, 2013). Rather than focusing on how findings relate to practice, these studies primarily focused on brand name intricacies analysis, with links to memory theories (Gunasti et al., 2020; Keller et al., 1998; Lee & Ang, 2003; Sen, 1999), or differences in attitudes (Djedi, 2018; Kara et al., 2020), subsequently never establishing their usage.
Brand suggestiveness prevalence research and pitfalls
Arora et al. (2015) is the only study to document suggestive name prevalence across 11 categories (from consumer goods, durables, and services) and 500 brands, though only in the United States. The study finds that 15% of these brands are suggestive; however, to establish the prevalence of suggestive names robustly, the data must include more brands, categories, and countries to provide generalisable results across different conditions (Barwise, 1995; Bass, 1995).
Consumer goods contain hundreds of categories and tens of thousands of brand names (e.g., one Australian online supermarket has 2,626 brands from 124 categories in the pantry section alone (Woolworths, 2023)). In this instance, manual coding would take over 7 hours and cost over £130 (i.e., 10 seconds per brand at £20 per hour), a figure doubled to calculate inter-coder reliability. Expanding the research to online platforms, services, and durable goods would exponentially increase expenses. However, this problem may be solved through an alternative: artificial intelligence (AI). GPT-3.5 is free, and GPT-4 has a low monthly fee. If artificial intelligence can assist with manual coding, researchers and managers can use it for traditionally expensive, time-consuming, monotonous coding tasks – providing cheaper, faster, and potentially more accurate results.
A ‘Human-in-The-Loop’ Approach
Artificial intelligence continues to improve (Gemini, 2024; OpenAI, 2024) - in complexity and efficiency (IBM, 2024; Stanford University, 2023). Consequently, usage in academia (Dogan et al., 2023; Livberber & Ayvaz, 2023), industry (McKinsey & Company, 2023; Watson, 2022), and general population’s day-to-day life (Office for National Statistics, 2023) is rising. However, artificial intelligence still cannot operate reliably alone; thus, several streams employ a coveted approach referred to as ‘human-in-the-loop’, including medicine (Bien et al., 2018), law (Enarsson et al., 2022), and business (Metcalf et al., 2019). Human-in-the-loop combines artificial intelligence with human power (Holzinger, 2016) to distil more accurate results than either could attain individually (Wu et al., 2022).
Marketing academia is beginning to tap into the power of AI (Kim et al., 2023); therefore, this study leverages AI to answer our first research question:
RQ1: What is the prevalence and variance of suggestive brand names?
Exploring suggestive and non-suggestive Distinctive Assets
Although there has been academic exploration into suggestive brand names (Keller et al., 1998; Lee & Ang, 2003), suggestive Distinctive Assets (examples shown in Figure 1) offer many advantages (Zaichkowsky, 2010), yet have received no scholarly interest, with just one industry article relating to the area (Luffarelli et al., 2019). Unlike direct branding, which solely includes the brand name, several types of Distinctive Assets exist (Gaillard, 2007; Keller, 2012). For example, logos such as the McDonald’s Golden Arches are used as an identification symbol or design, while the M&M characters act as mascots for the brand. Examples of suggestive Distinctive Assets.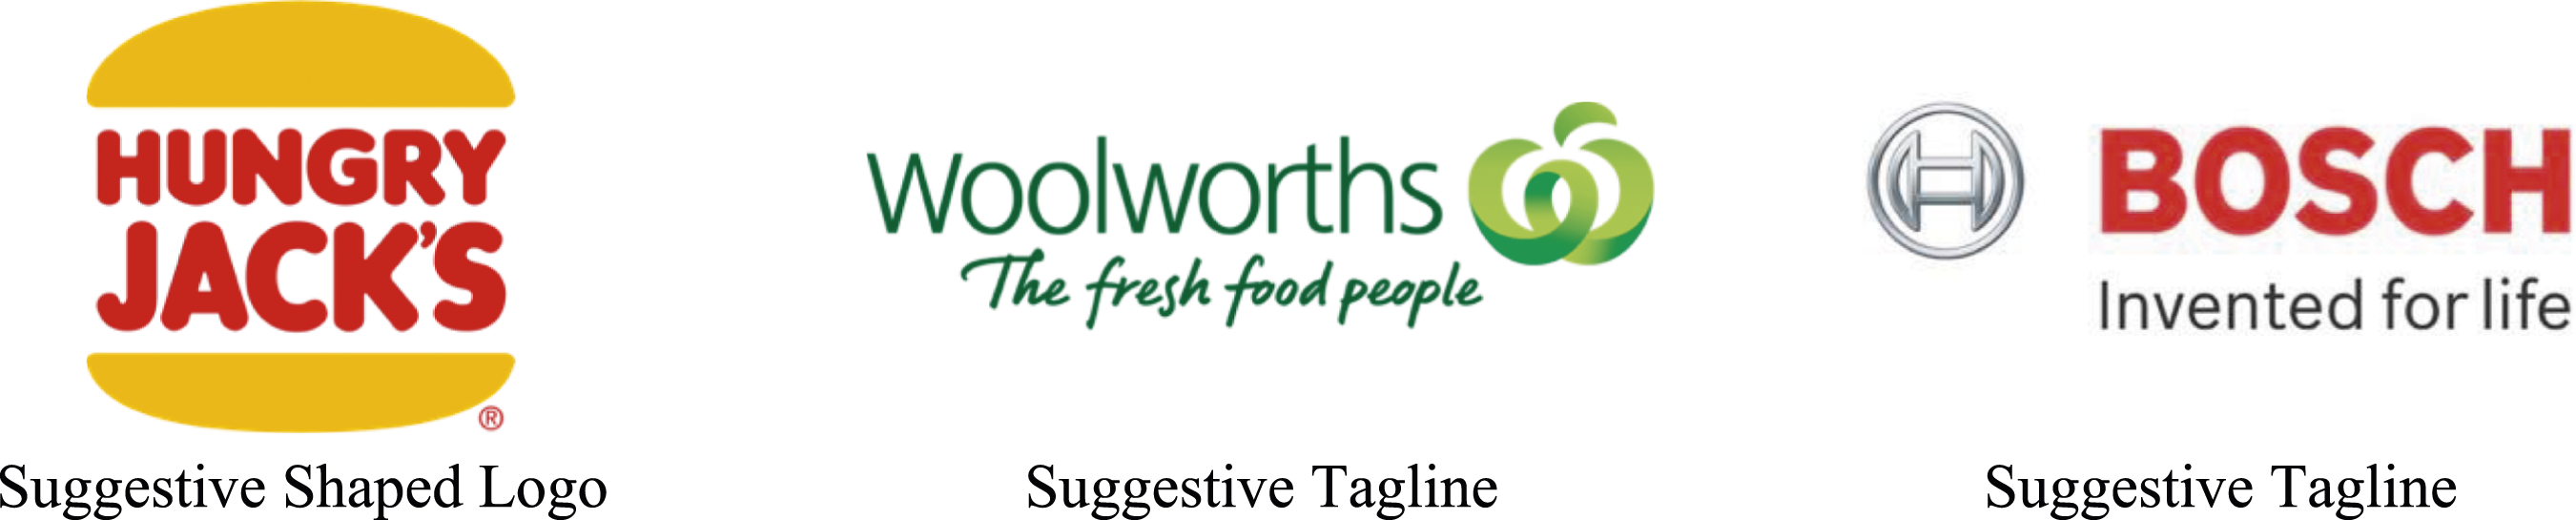
Distinctive Assets offer various advantages to brands; however, many do not utilise them and forego a crucial aspect of brand management (Weinburg & Lombardo 2004). First, they provide avenues for enriching consumers’ brand memory. Distinctive Assets can tap into multiple senses (e.g., sight and hearing), providing flexibility in creating richer memory links (Hartnett, Romaniuk, & Kennedy, 2016). Furthermore, the range of creative devices that can be used allows brands to easily stand out amongst the ‘clutter’ in both retailing and advertising contexts (Bellman et al., 2019; Pinero et al., 2010), particularly where consumers pay little attention (Anesbury et al., 2016; Heath, 1999). With the value of Distinctive Assets established, it is worthwhile to benchmark their prevalence across industries, categories, and countries. Thus, the second research question is:
RQ2: What is the prevalence of suggestive Distinctive Assets?
Strength of suggestive and non-suggestive Distinctive Assets
When assessing Distinctive Assets, objective measures can serve a purpose beyond determining their prevalence. The strength of a Distinctive Asset can be measured, allowing for performance comparisons between suggestive and non-suggestive Distinctive Assets. When strong, Distinctive Assets are brand name proxies; their strength can improve brand elicitation. The two measures of Distinctive Asset strength are Fame and Uniqueness (Romaniuk, 2018).
Distinctive Assets that contain meaning have been noted as a risky strategy due to the potential for other non-brand-related associations to be attached to the same link, creating mental competition (Romaniuk, 2018). However, meaning has been noted as a necessary strategy to create strong brand linkages (Bulmer & Buchanan-Oliver, 2004).
Objectively assessing Distinctive Asset performance
Assessing Distinctive Asset performance should not rely on gut feeling. Often, marketers use intuition to guide strategic decisions, like making a random guess at the outcome of marketing decisions (Hartnett, Kennedy, et al., 2016). Instead, we can eliminate guesswork by incorporating measures that can directly test Distinctive Asset strength (Romaniuk & Nenycz-Thiel, 2014). Results will either confirm or deny that suggestive Distinctive Assets are risky by presenting equal or greater Fame and Uniqueness metric scores than non-suggestive alternatives.
Scant amounts of publicly available data disclose the Fame and Uniqueness metric performance of real brands/categories. To the best of the authors’ knowledge, Romaniuk (2018) is the only known source, and demonstrates logos received an average Fame of 32% and Uniqueness of 59%, and audio assets an average of 23% Fame and 62% Uniqueness. These results suggest that visual assets have higher levels of Fame but slightly lower levels of Uniqueness than audio assets. With the ability to measure Distinctive Asset strength, we can determine the effectiveness of a suggestive Distinctive Asset through the final research question:
RQ3: What are the Fame and Uniqueness scores of suggestive and non-suggestive Distinctive Assets, and are there any differences between them?
Data and method
Establishing the feasibility of using artificial intelligence
To test the feasibility of artificial intelligence as a coding tool, we examine 282 brands from ten consumer goods categories: multi-vitamins (n = 44), breakfast cereals (n = 43), tea (n = 38), salad dressing (n = 33), pizza and pasta sauce (n = 28), instant noodles (n = 23), coffee beans (n = 22), long-life milk (n = 22), honey (n = 20), and Mexican food (n = 9), from the two largest Australian supermarkets’ websites (Gannon, 2023). Through the data, we could determine the differences in prevalence across categories.
Comparison of brand suggestiveness.
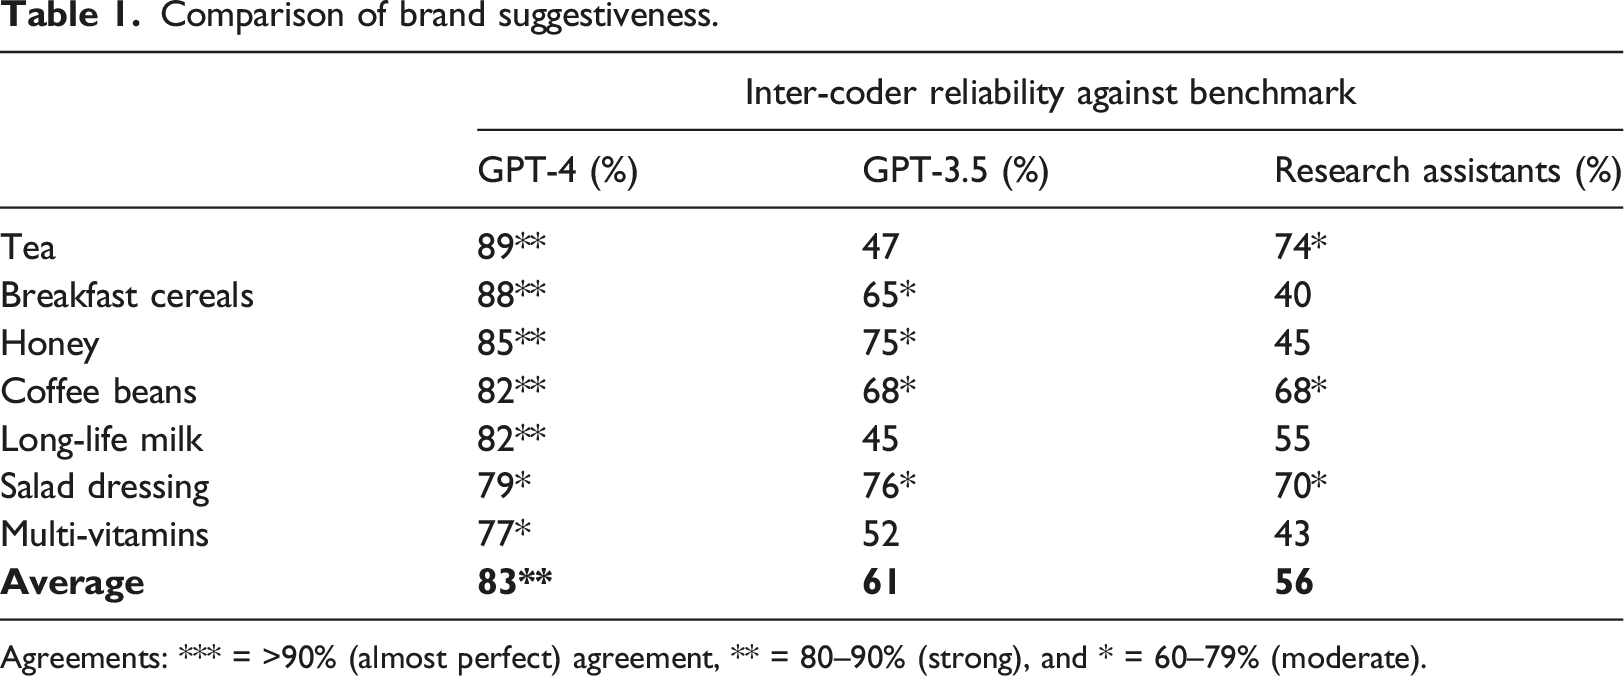
Agreements: *** = >90% (almost perfect) agreement, ** = 80–90% (strong), and * = 60–79% (moderate).
Comparison of ‘international’ brand suggestiveness.
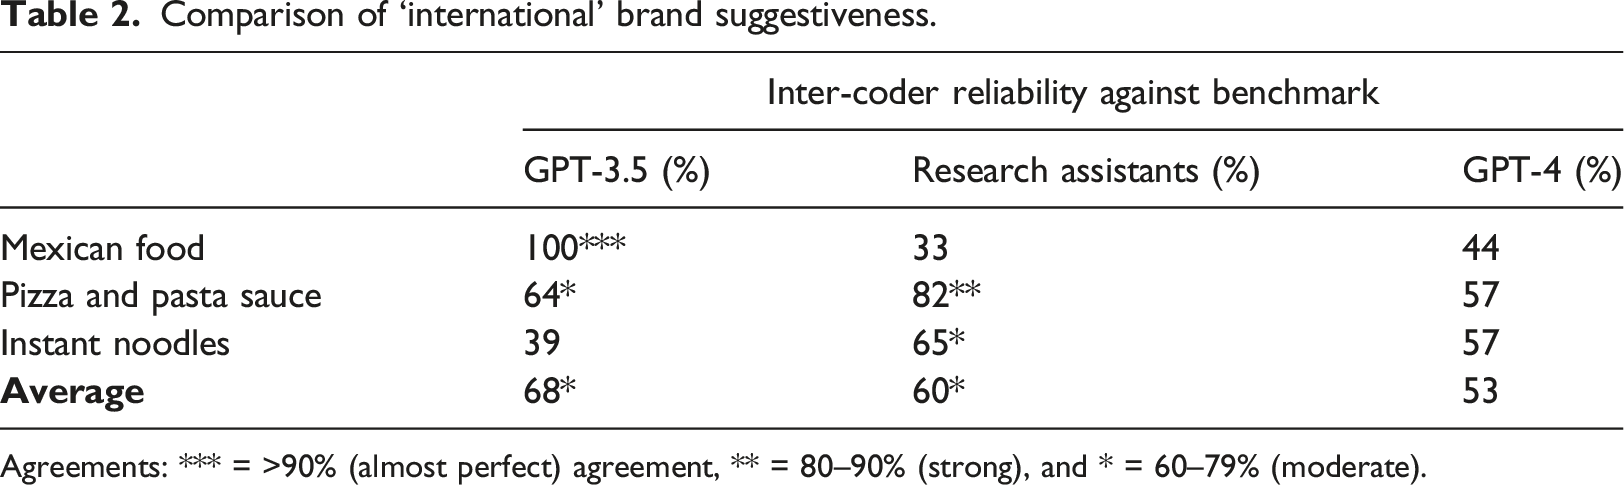
Agreements: *** = >90% (almost perfect) agreement, ** = 80–90% (strong), and * = 60–79% (moderate).
We tested the consistency in GPT’s results against itself on five occasions. GPT-4 is more consistent when re-prompted with the same brand list than GPT-3.5 (88% vs. 26%). The result supports that GPT-4 is the most appropriate tool for this task. Variances in language backgrounds can cause the same word to be interpreted differently (Degani & Tokowicz, 2010). Therefore, we focus on the suggestiveness of brand names within predominantly English-speaking countries to maximise the probability of more reliable and accurate coding outcomes.
Brand name suggestiveness
To address RQ1 regarding prevalence of suggestive brand names, we examined 3,897 brands from 224 categories (e.g., breakfast cereals and insurance) from diverse industry types (i.e., consumer goods, services, and durables). In line with our earlier discovery, three Western countries were chosen, wherein English is the dominant language (i.e., the United States - 78% (United States Census Bureau, 2022), the United Kingdom – 91% (Office for National Statistics, 2021), and Australia) - 73% (Australian Bureau of Statistics, 2017)). Although Chat GPT-4 is proficient across multiple languages, English is its strongest (Learnship, 2023; Ray, 2023). The deliberate diversity in data with built-in replications (Uncles & Wright, 2004) aligns with multiple sets of data approach (Bound & Ehrenberg, 1989; Ehrenberg, 1966, 1990), providing more robust results.
We audited brand name data from leading retailers’ websites to accurately represent the brands available in each category and country, the specific details regarding the audit can be found in Appendix C. For example, for consumer goods categories, data was collected from Target in the United States (Statista, 2023), Morrison’s in the United Kingdom (Bedford, 2023), and Coles and Woolworths (Gannon, 2023) in Australia.
The analysis approach is demonstrated using the breakfast cereals category. GPT-4 was prompted with relevant contextual information needed (shown in Appendix A), including the definition of “A brand name that conveys relevant attribute or benefit information in a particular product or category context” (Keller et al., 1998), the category of ‘Breakfast Cereal”, and the list of 44 available brands across two Australian supermarkets. Examples of suggestive brands include All-Bran, Corn Flakes, and Rice Bubbles, while non-suggestive brands include Cheerios, Guardian, and the Private Labels ‘Woolworths’ and ‘Coles’. A human-in-the-loop approach (Holzinger, 2016) is then employed, with the primary researcher auditing GPT-4’s results to ensure there were no objectively wrong classifications (e.g., ‘Corn Flakes’ being classified as non-suggestive when it is suggestive); this approach provided the highest possible accuracy in the classification.
We tested a combination of all coders used in the pilot study (Research Assistants, GPT-3.5, and GPT-4) to see how consistent each was compared to the other on their results from the seven non-foreign dominant categories. The results indicate a combination of GPT-4 and the benchmark created was the best method due to having the highest level of inter-coder reliability (83%). The best method was 22% higher than the next closest of the benchmark and GPT-3.5 (61%), and Research Assistants (57%). The combination of GPT-4 and Research Assistants (59%) and GPT-3.5 (54%) had low levels of inter-coder reliability, but the worst combination was Research Assistants and Chat GPT-3.5 (30%). We have added a table (Appendix B) to assess the inter-coder reliabilities, when research assistants, GPT-3.5 and GPT-4 are the benchmark. Time constraints meant getting all three brand experts to audit results was not possible, thus, the primary researcher was employed to do the auditing for the expanded dataset. Audit findings indicated that 12% of GPT-4’s results were considered incorrect to the auditor and adjusted to ensure the highest accuracy. Overall, 51% of brands were classified as being suggestive. The process is systematically replicated for 60 additional Australian consumer goods categories (e.g., multi-vitamins, salad dressing, and coffee beans) before expanding to all categories and countries.
Distinctive Asset suggestiveness
To address RQ2 and RQ3 concerning Distinctive Assets, we examine a broad set of data from a commercial research provider collected across seven years (2016–2022). In total, we examine 593 assets from 38 Distinctive Asset types (e.g., logos and colours) across 12 categories and three countries. The Distinctive Asset data had sample sizes ranging from 229 to 1,108 respondents. OpenAI released GPT-4V (ision) to the public in late September 2023; however, this system card comes with multiple risks due to being newly released to the market (OpenAI, 2023a). Therefore, artificial intelligence was not used to code for Distinctive Asset suggestiveness. Instead, three brand suggestiveness experts independently coded the suggestiveness of the assets before comparing and debating the differences and defining the classification. The adapted prominent brand name definition (Keller et al., 1998) was used (i.e., “a non-brand name element that conveys relevant attribute or benefit information in a particular product or category context”). The inter-coder reliability between the researchers was 77%. Where differences existed, they were quickly resolved through discussion, with human error as the root cause, which is common when undertaking a tedious task (Reason, 2000).
Distinctive Assets were tested for their prevalence and strength. Fame reflects how many people can link the Distinctive Asset to the target brand (Romaniuk & Nenycz-Thiel, 2014). Uniqueness is the share of responses the target brand attains versus competitor brands (Romaniuk & Nenycz-Thiel, 2014). These metrics are shown in equation (1) and equation (2).
Equation (1): Distinctive Asset Fame
Equation (2): Distinctive Asset Uniqueness
To illustrate, we use the short-haul personal travel flights in Europe category. The Colour Distinctive Asset (classified as not suggestive) had 247 of the 404 respondents indicate that the correct brand came to mind when they thought of the category (i.e., 61% Fame), and of those, 213 indicated this was the only brand that came to mind (i.e., 86% Uniqueness). The process was repeated within this category for 53 assets from six brands. Overall, suggestive Distinctive Assets score an average Fame and Uniqueness of 49% and 21%, respectively. In comparison, Fame and Uniqueness scores are significantly higher for non-suggestive assets, at 76% and 35%.
Results
Prevalence of suggestive brand names.
However, the average prevalence score only partially explains the results. Regardless of the industry, most categories fall beneath their industry average. Thus, brand names often have a lower prevalence of suggestive names than the average. Figure 2 illustrates this as an aggregate result across all industries. The outliers in Figure 2 are from the services industry, or, the consumer goods categories with very few brands. Suggestive name prevalence - positively skewed distribution.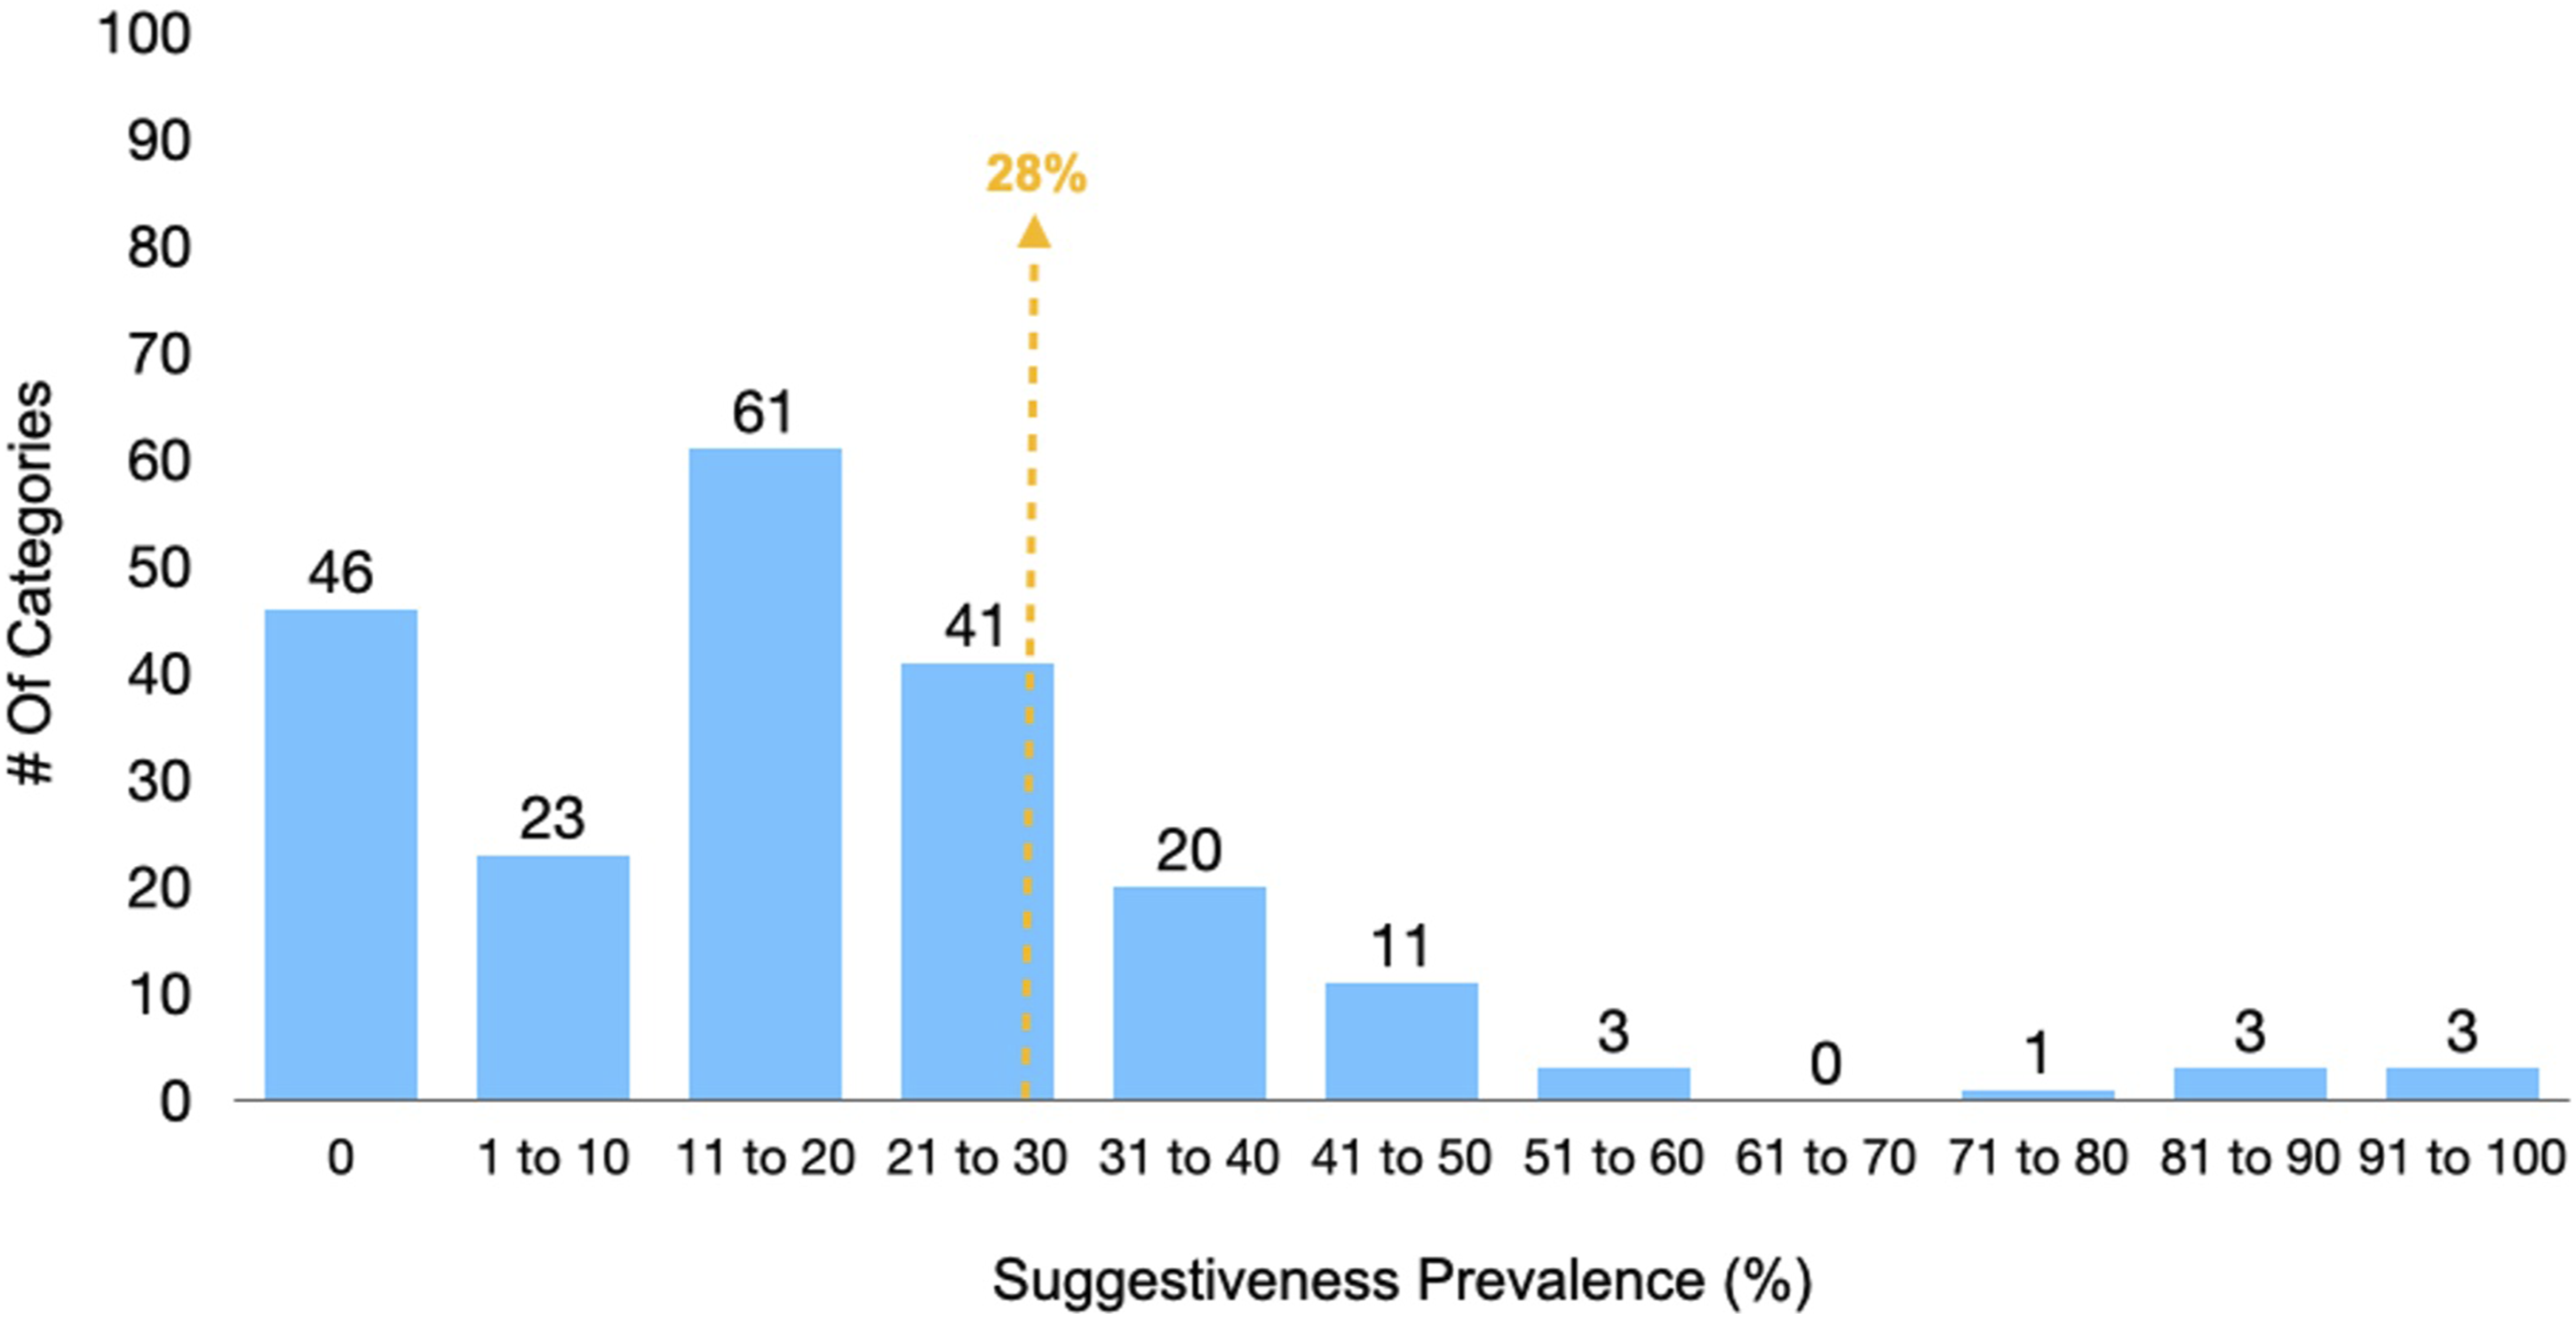
Prevalence of suggestive Distinctive Assets.
Like brand names, the distribution is positively skewed, with 58% of categories falling beneath the 40% prevalence, indicating that, more often than not, the prevalence of suggestive Distinctive Assets is less than 40% for a given category.
Finally, in addressing RQ3, comparing the scores between suggestive and non-suggestive Distinctive Assets, Fame results are statistically insignificant (p = .110), and Uniqueness statistically significant (p = .002) but with a small effect size (Cohen’s d = −0.245). The results suggest that whether a Distinctive Asset is suggestive or not may have a minor influence on its Uniqueness score, while other factors should also be considered. Across the four industries, suggestive Distinctive Assets have an average Fame of 27% and Uniqueness of 54%, while non-suggestive elements score 30% Fame and 63% Uniqueness. The result is consistent in each industry, shown in Figure 3, with non-suggestive Distinctive Assets consistently scoring marginally higher. Fame and Uniqueness for suggestive and non-suggestive Distinctive Assets.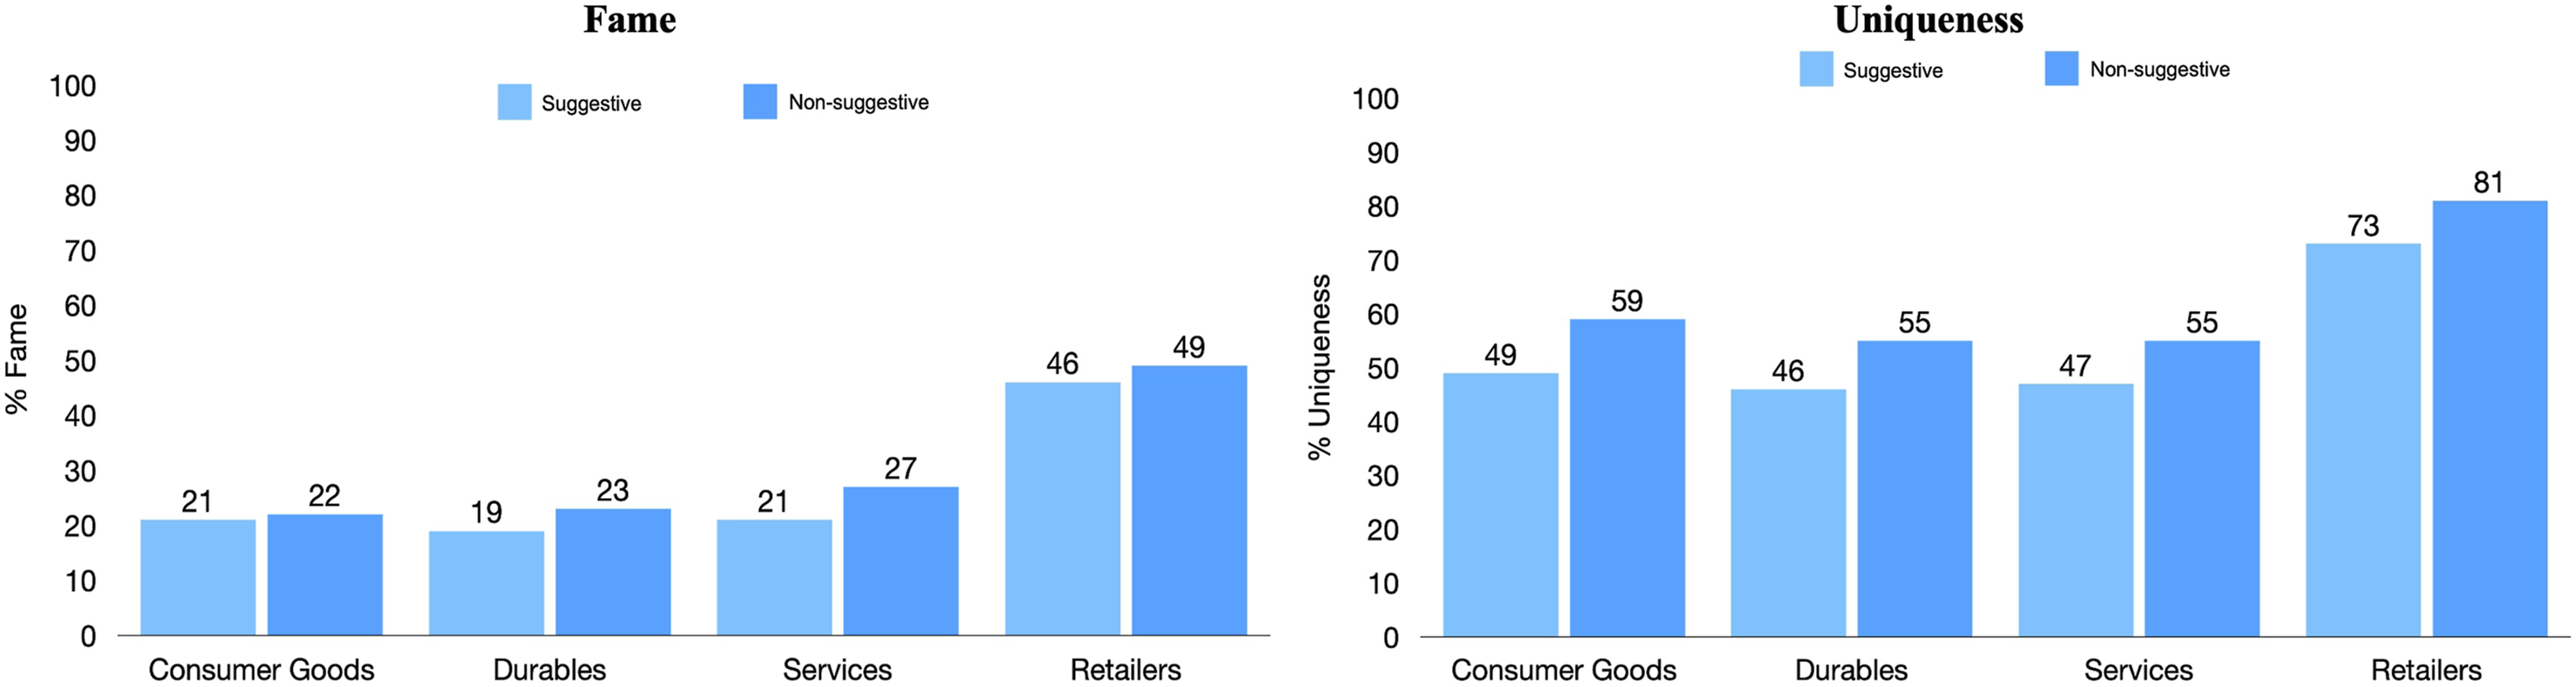
Discussion and implications
Despite research in the area vouching for the use of a suggestive name (Kara et al., 2020; Sen, 1999), our results show that almost three-quarters of brands (72%) incorporate a non-suggestive name. With a human-in-the-loop approach involved, data collection was less fatiguing on human coders, maintaining the highest level of accuracy possible. In most categories, the prevalence of a non-suggestive name is higher than 72%, as the distribution is positively skewed. Our findings can be understood through the research that recommends suggestive names may limit the associations brands can make and thus lessen the flexibility of brand extension (i.e., Keller et al. (1998)). Therefore, suggestive names are not a good choice. However, the service industry shows an opposing result, with a 56% prevalence of suggestive names. Services functionally differ from consumer goods and durables (Ashour, 2018); notably, their intangibility, meaning consumers cannot physically assess a product before purchasing (Lovelock & Gummesson, 2004). Therefore, other branding devices (e.g., suggestive names) may need to rely on establishing strong mental links to a service brand (du Plessis, 1994). However, other essential factors, such as the time in a market, may influence the results (Pecot et al., 2022; Phua et al., 2023). Furthermore, two categories within services had a prevalence between 91%–100%, bringing the overall prevalence average up. The other category in this group was a one brand category, displaying 100% suggestiveness.
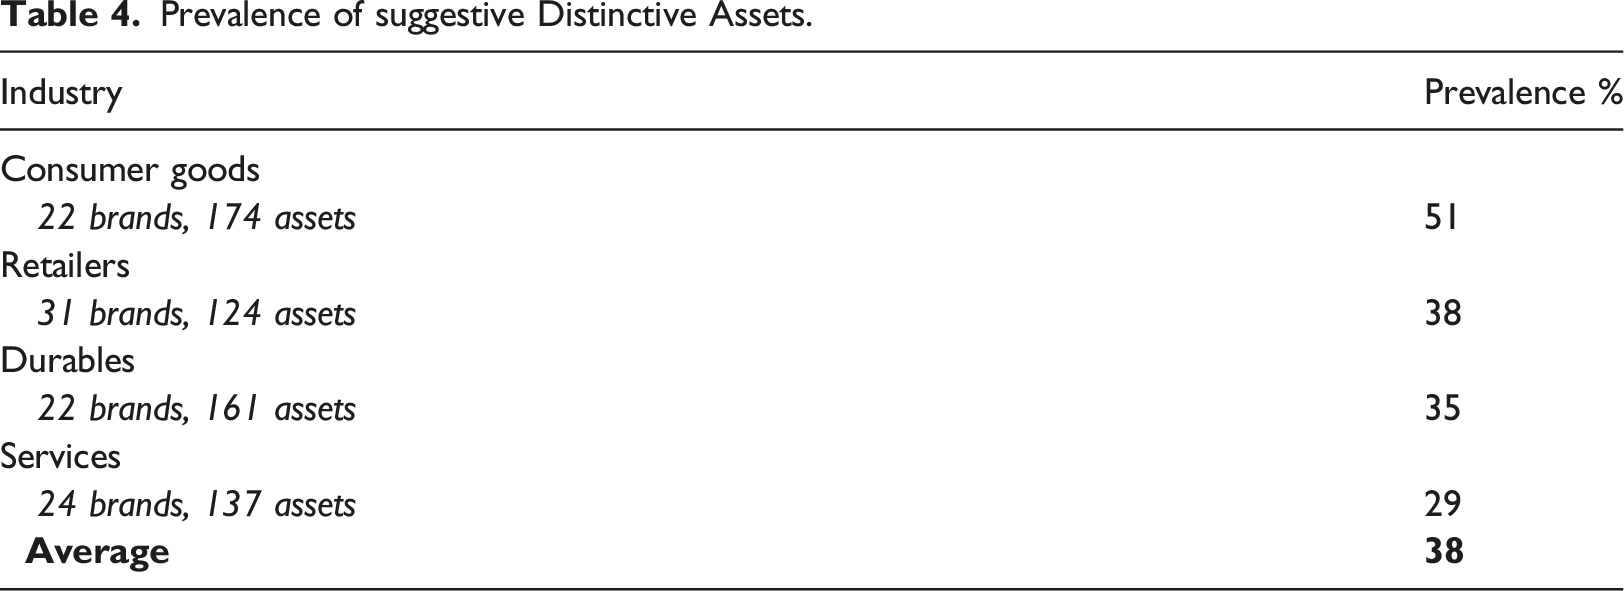
For Distinctive Assets, our results demonstrate that, like brand names, prevalence is lower for suggestive Distinctive Assets than for non-suggestive, at 38%, with a positive distribution skew. Suggestive branding may cause tactical and strategic flexibility issues for direct and in-direct brand name elements (Keller et al., 1998). However, we find that services have the lowest prevalence and consumer goods the highest, opposite to the brand name results. There may be less use of suggestive Distinctive Assets in services as no tangible product can be leveraged (Lovelock & Gummesson, 2004). However, consumer goods are physical products that can benefit from visually enhancing Distinctive Assets. Given, the short amount of time consumers take to select a consumer good product (Anesbury et al., 2016), Distinctive Assets may make these brands easier to spot and select (Romaniuk, 2018). Moreover, Fame and Uniqueness are measures of a Distinctive Asset’s strength. Findings show that suggestive Distinctive Assets are, on average, slightly weaker (in both measures) than non-suggestive – potentially due to suggestive Distinctive Assets creating additional mental competition and interfering with already well-established memories (Murnane & Shiffrin, 1991; Postman & Underwood, 1973); for this reason, brand EXXON chose a non-suggestive name, avoiding the complications that come with being suggestive (Zaichkowsky, 2010). Although there are differences across the brand name types in their performance across Distinctive Asset metrics, the results are either statistically insignificant or have a small effect size. Thus, it does not necessarily mean suggestive branding will cause more harm than good if used in a Distinctive Asset form.
Academic contributions
Our study tested a new method that combats issues with past research on suggestive brand names. We were able to extensively test and succeed with a new method, using artificial intelligence (GPT-4) to collect prevalence results on a large scale (4,000 brand names), wherein the collection process would not pose any of the traditional risks (timely, costly, human error). Our novel method allows brand suggestiveness researchers to circumvent an overreliance on student samples (e.g., Gunasti et al., 2020; Kara et al., 2020; Lam et al., 2013; Sen, 1999) and fictitious brands (e.g., Djedi, 2018; Gunasti et al., 2020; Keller et al., 1998; Sen, 1999).
Our research expanded the over 100 years of brand suggestiveness literature (Keller et al., 1998; Viehoever, 1920) from a purely text-based brand name context to one of non-brand name elements. To our knowledge, our research is the first academic study to explore the area. In doing so, our examination of many data sets across industries, categories, and markets provides researchers with robust benchmarks for the prevalence and strength (i.e., Fame and Uniqueness) of suggestive and non-suggestive Distinctive Assets.
Industry contributions
The overwhelming majority of marketers (73%) stated meaningful names were of greater value than non-meaningful names (Romaniuk, 2022). However, our findings demonstrate that suggestive branding (names and Distinctive Assets) are only used one-third (34%) of the time. Although many other stakeholders are also involved in deciding on a brand name (Kohli et al., 2005) the significant disconnect suggests that beliefs do not necessarily equal behaviour, a theory that has also been confirmed for consumers (Nguyen et al., 2022; Young et al., 1998). Understanding the prominent gap may likely prompt branding practitioners to re-think their strategies to ensure their beliefs are reflected in their brands. Furthermore, the research demonstrates that suggestive Distinctive Assets perform slightly worse than non-suggestive. However, the difference is not large, nor statistically significant for Fame. Therefore, marketers should not change their Distinctive Assets from suggestive to non-suggestive; instead, we suggest prioritising a non-suggestive asset when creating a new brand or Distinctive Asset to minimise the risk of mental competition.
Limitations and future research
There are some key limitations of this research that should be overcome with future research. Although GPT-4 was proven to make significantly fewer errors than human alternatives, the task of coding for suggestiveness is innately subjective, so future researchers should take action to minimise this effect. Artificial Intelligence continues to complete tasks of increasing complexity with greater efficiency (IBM, 2024; Stanford University, 2023), thus, it is likely that soon it will be able to complete this task alone, which will be an exciting avenue for future research. Furthermore, this study explored three major Western countries, excluding any ‘international dominant’ categories in the consumer goods industry, for example, Mexican food. Suggestiveness of words outside of the English language was beyond the scope, as determined by the pilot study. However, expansion into non-English speaking markets is valuable for future study. Chat-GPT is proficient in Neo Latin languages as well as English (e.g., Spanish and Italian) (Paul et al., 2023)). Also, Lam et al. (2013) mention that Chinese speakers rely more heavily on the semantic associations between words, which could indicate a potential difference between English and Chinese. Furthermore, our brand name suggestiveness research was contained to a snapshot in time and potentially subject to survival bias (i.e., brands coming in and out of the market) (Li & Xu, 2002). Future research should consider data over multiple years to capture data from new brands that may have failed (Ployhart & Vandenberg, 2010) with critical learnings to be discovered. Last, our research examined Distinctive Assets as a whole, yet there is scope for research into the nuances in suggestive Distinctive Asset performance across different asset types. Research suggests picture-based assets like logos would be easier to process than text-based assets like taglines (Childers et al., 1986), to which some benchmarks can be drawn upon as comparative measures (Romaniuk, 2018). Such Distinctive Asset research could be done with GPT-4V or a newer equivalent when the AI is sufficiently proficient and should be explored in future.
Footnotes
Author contributions
All authors contributed to each section of the manuscript.
Declaration of conflicting interests
The author(s) declared no potential conflicts of interest with respect to the research, authorship, and/or publication of this article.
Funding
The author(s) received no financial support for the research, authorship, and/or publication of this article.