
Abstract
Brand love is a widely researched marketing concept, yet its prevalence across different high involvement product categories is relatively unexplored. The absence of clear empirical guidelines concerning the prevalence of brand love undermines the ability, for both researchers and marketers, to turn evaluations of brand love into meaningful conclusions for brand-building efforts. To address this issue, this study replicates and extends prior research by investigating how common brand love is across high- and low-involvement product categories, and its relationship with purchase intentions and behavioural loyalty, measured via Share of Category Requirements (SCR). The analysis of survey data from 1,554 US consumers for four product categories (cars, running shoes, retail banking, and beer) suggests that four in ten category users loved at least one brand within each category. Yet, brand-level love is more uncommon, ranging between 3.5% to 15%, on average, across the product categories tested. Brand love was higher in transformational high-involvement categories (cars, running shoes) than in informational ones, but high-involvement categories alone did not exhibit more love compared to low-involvement ones. Additionally, although brand love correlates with higher purchase intentions, the link with behavioural loyalty appeared rather weak across all categories. These results challenge assumptions about brand love’s scalability and strategic value of brand love, offering empirically grounded benchmarks for marketing researchers and practitioners.
Keywords
Introduction
Since the late 1990s, emotional branding has been of increasing interest to marketing practitioners and academics, based on the belief that brands can hold emotional significance for consumers (Bou Saada et al., 2023; Cachero-Martínez & Vázquez-Casielles, 2021; Kim & Sullivan, 2019; Park & MacInnis, 2018). Emotional connections are suggested to make brands stronger and ‘lifelike’, transcending mere product benefits (Fournier, 1998; Keller, 2003). Firms employ emotional branding to build consumer-brand connections in competitive markets with limited perceived differentiation (Steenkamp, 2017). By appealing to consumers’ hearts in emotionally meaningful ways, emotional branding is used to foster increased brand loyalty as a competitive strategy (Gobe, 2001; Jindal et al., 2022).
Reflecting these assumptions, and the emphasis in marketing theory and practice placed on the establishment of consumer-brand emotional links, there is research on a variety of relational concepts (see Alvarez et al., 2023, for review), including attachment, (Park et al., 2010), friendships (Ohlwein & Bruno, 2022), and hate (Zarantonello, Romani, et al., 2016). Of the relational concepts explored within this body of knowledge, brand love is among the most popular in academia and industry (Batra et al., 2012; Carroll & Ahuvia, 2006; Palusuk et al., 2019). Broadly, brand love refers to the love-like emotions and relationships consumers form with brands (Batra et al., 2012; Bergkvist & Bech-Larsen, 2010; Carroll & Ahuvia, 2006; Rossiter & Bellman, 2012). Theoretically, brand love implies consumers can develop love-like relationships with brands, mimicking psychological mechanisms typical of interpersonal relationships adapted to inanimate objects (Fournier, 1998; Whang et al., 2004).
Research on brand love is extensive (for a systematic review, see (Gumparthi & Patra, 2020; Palusuk et al., 2019; Setiyati et al., 2025), with contributions focused on uncovering the antecedents of brand love (Carroll & Ahuvia, 2006; Nguyen & Feng, 2021; Roy et al., 2013). Several studies have also explored the outcomes of brand love, linking it, for instance, to increased brand loyalty (Bıçakcıoğlu et al., 2018; Drennan et al., 2015; Robertson et al., 2022). This academic evidence aligns with marketing practice, where efforts to win consumers’ love are based on the assumption that love translates into loyalty (Roberts, 2004). Harley Davidson motorcycles, for example, is often cited as having built loyalty through emotional advertising and its ‘Harley Owners Group’ (Morrison & Crane, 2007). Furthermore, several advertising agencies promise to build brand love while market research companies increasingly include love in brand tracking (Ritson, 2022; Talkwalker, 2024).
Studies Reporting Prevalence of Brand Love
Therefore, the key objective of this paper is to investigate the prevalence of brand love across product categories, with four examined in this study: running shoes, cars, personal banking and beer. In addition, the relationship between brand love and behavioural loyalty within these categories is documented, comparing outcomes for high- versus low-involvement products, and between brand lovers and non-lovers. To achieve this, we specify hypotheses that allow for empirical testing, via a differentiated replication and extension of Rossiter and Bellman (2012), one of the few studies to document both the prevalence of brand love and its link with behavioural loyalty.
This research advances marketing theory by measuring the prevalence of brand love in high-involvement categories and extending Rossiter and Bellman’s (2012) documentation of love for low-involvement categories. Specifically, it investigates the link between brand love and behavioural loyalty in the context of high involvement categories, investigating whether such categories are inherently more ‘lovable’ than low-involvement ones. Practically, the findings help set realistic benchmarks for how many of a brand’s consumers are lovers. It also provides an understanding of the behavioural loyalty patterns among brand lovers.
Background and Hypotheses Development
Brand Love
Love was originally among the 15 consumer-brand relationship metaphors described by Fournier (1998) in her seminal work proposing brands can become relationship partners for consumers. Consumers’ love toward brands has since been thoroughly examined, including its role in fostering positive brand relationships (Ahuvia, 2005; Albert & Merunka, 2013; Coelho et al., 2019), and as an outcome of emotional branding (Rossiter & Bellman, 2012). There are several brand love conceptualisations, ranging from unidimensional constructs (Carroll & Ahuvia, 2006) to multidimensional frameworks comprising several dimensions (Batra et al., 2012). Scholars also view brand love as an emotion or a relationship. From the emotional perspective, brand love is considered a short-term, episodic state of affection (Bergkvist & Bech-Larsen, 2010; Carroll & Ahuvia, 2006; Rossiter, 2012). Whereas relationship conceptualisations view it as a relatively enduring bond that develops over time based on multiple affective and behavioural brand-consumer experiences (Batra et al., 2012). Duration and temporal stability can therefore distinguish between love as an emotion and a relationship. In this study, we view brand love as an affective emotional state consistent with Rossiter and Bellman (2012).
Hence, brand love refers to a consumer’s intense emotional attachment with a brand (Carroll & Ahuvia, 2006), including passion and separation anxiety (Batra et al., 2012; Rossiter, 2012). It is linked to desirable outcomes such as increased consumer loyalty (Bergkvist & Bech-Larsen, 2010; Carroll & Ahuvia, 2006; Robertson et al., 2022), positive word of mouth (Batra et al., 2012; Coelho et al., 2019; Karjaluoto et al., 2016), increased purchase intentions (Fetscherin, 2014), higher brand equity (Machado et al., 2019; Robertson et al., 2022) and firm performance (Fetscherin et al., 2015). Moreover, since Roberts’ (2004) seminal work on ‘Lovemarks’, which popularised the idea that brands can drive behavioural outcomes by cultivating love and respect, the concept of brand love has gained significant traction in industry. Firms such as Coca-Cola, among others, seek to build brand love, aiming to convert ‘intimate’ relationships with customers into sales (Carroll, 2010; Ritson, 2022). Meanwhile, several market research agencies consider love as a brand equity outcome (Halloran, 2015; Talkwalker, 2024).
Prevalence of Brand Love
Despite great academic and managerial interest, few studies document the prevalence of brand love. Instead, prior research has mainly investigated brand love’s antecedents and outcomes. But a perhaps more vital question is: how common is brand love among consumers? Brand love theorists acknowledge consumers become emotionally attached to and love ‘few brands, if they love any at all’ (Bagozzi et al., 2017, p. 2). This selectivity is due to low levels of identification with brands, and the tendency to establish relationships with only a few brands (Park et al., 2010; Thomson, MacInnis, & Park, 2005). That is, consumers develop emotional relationships with brands selectively, as only a limited number will align with their self-concept. As a result brands may struggle to obtain attachment with consumers beyond mere indifference (Alvarez & Fournier, 2016). Therefore, a long alluded to, but relatively unanswered question is: how many consumers love brands?
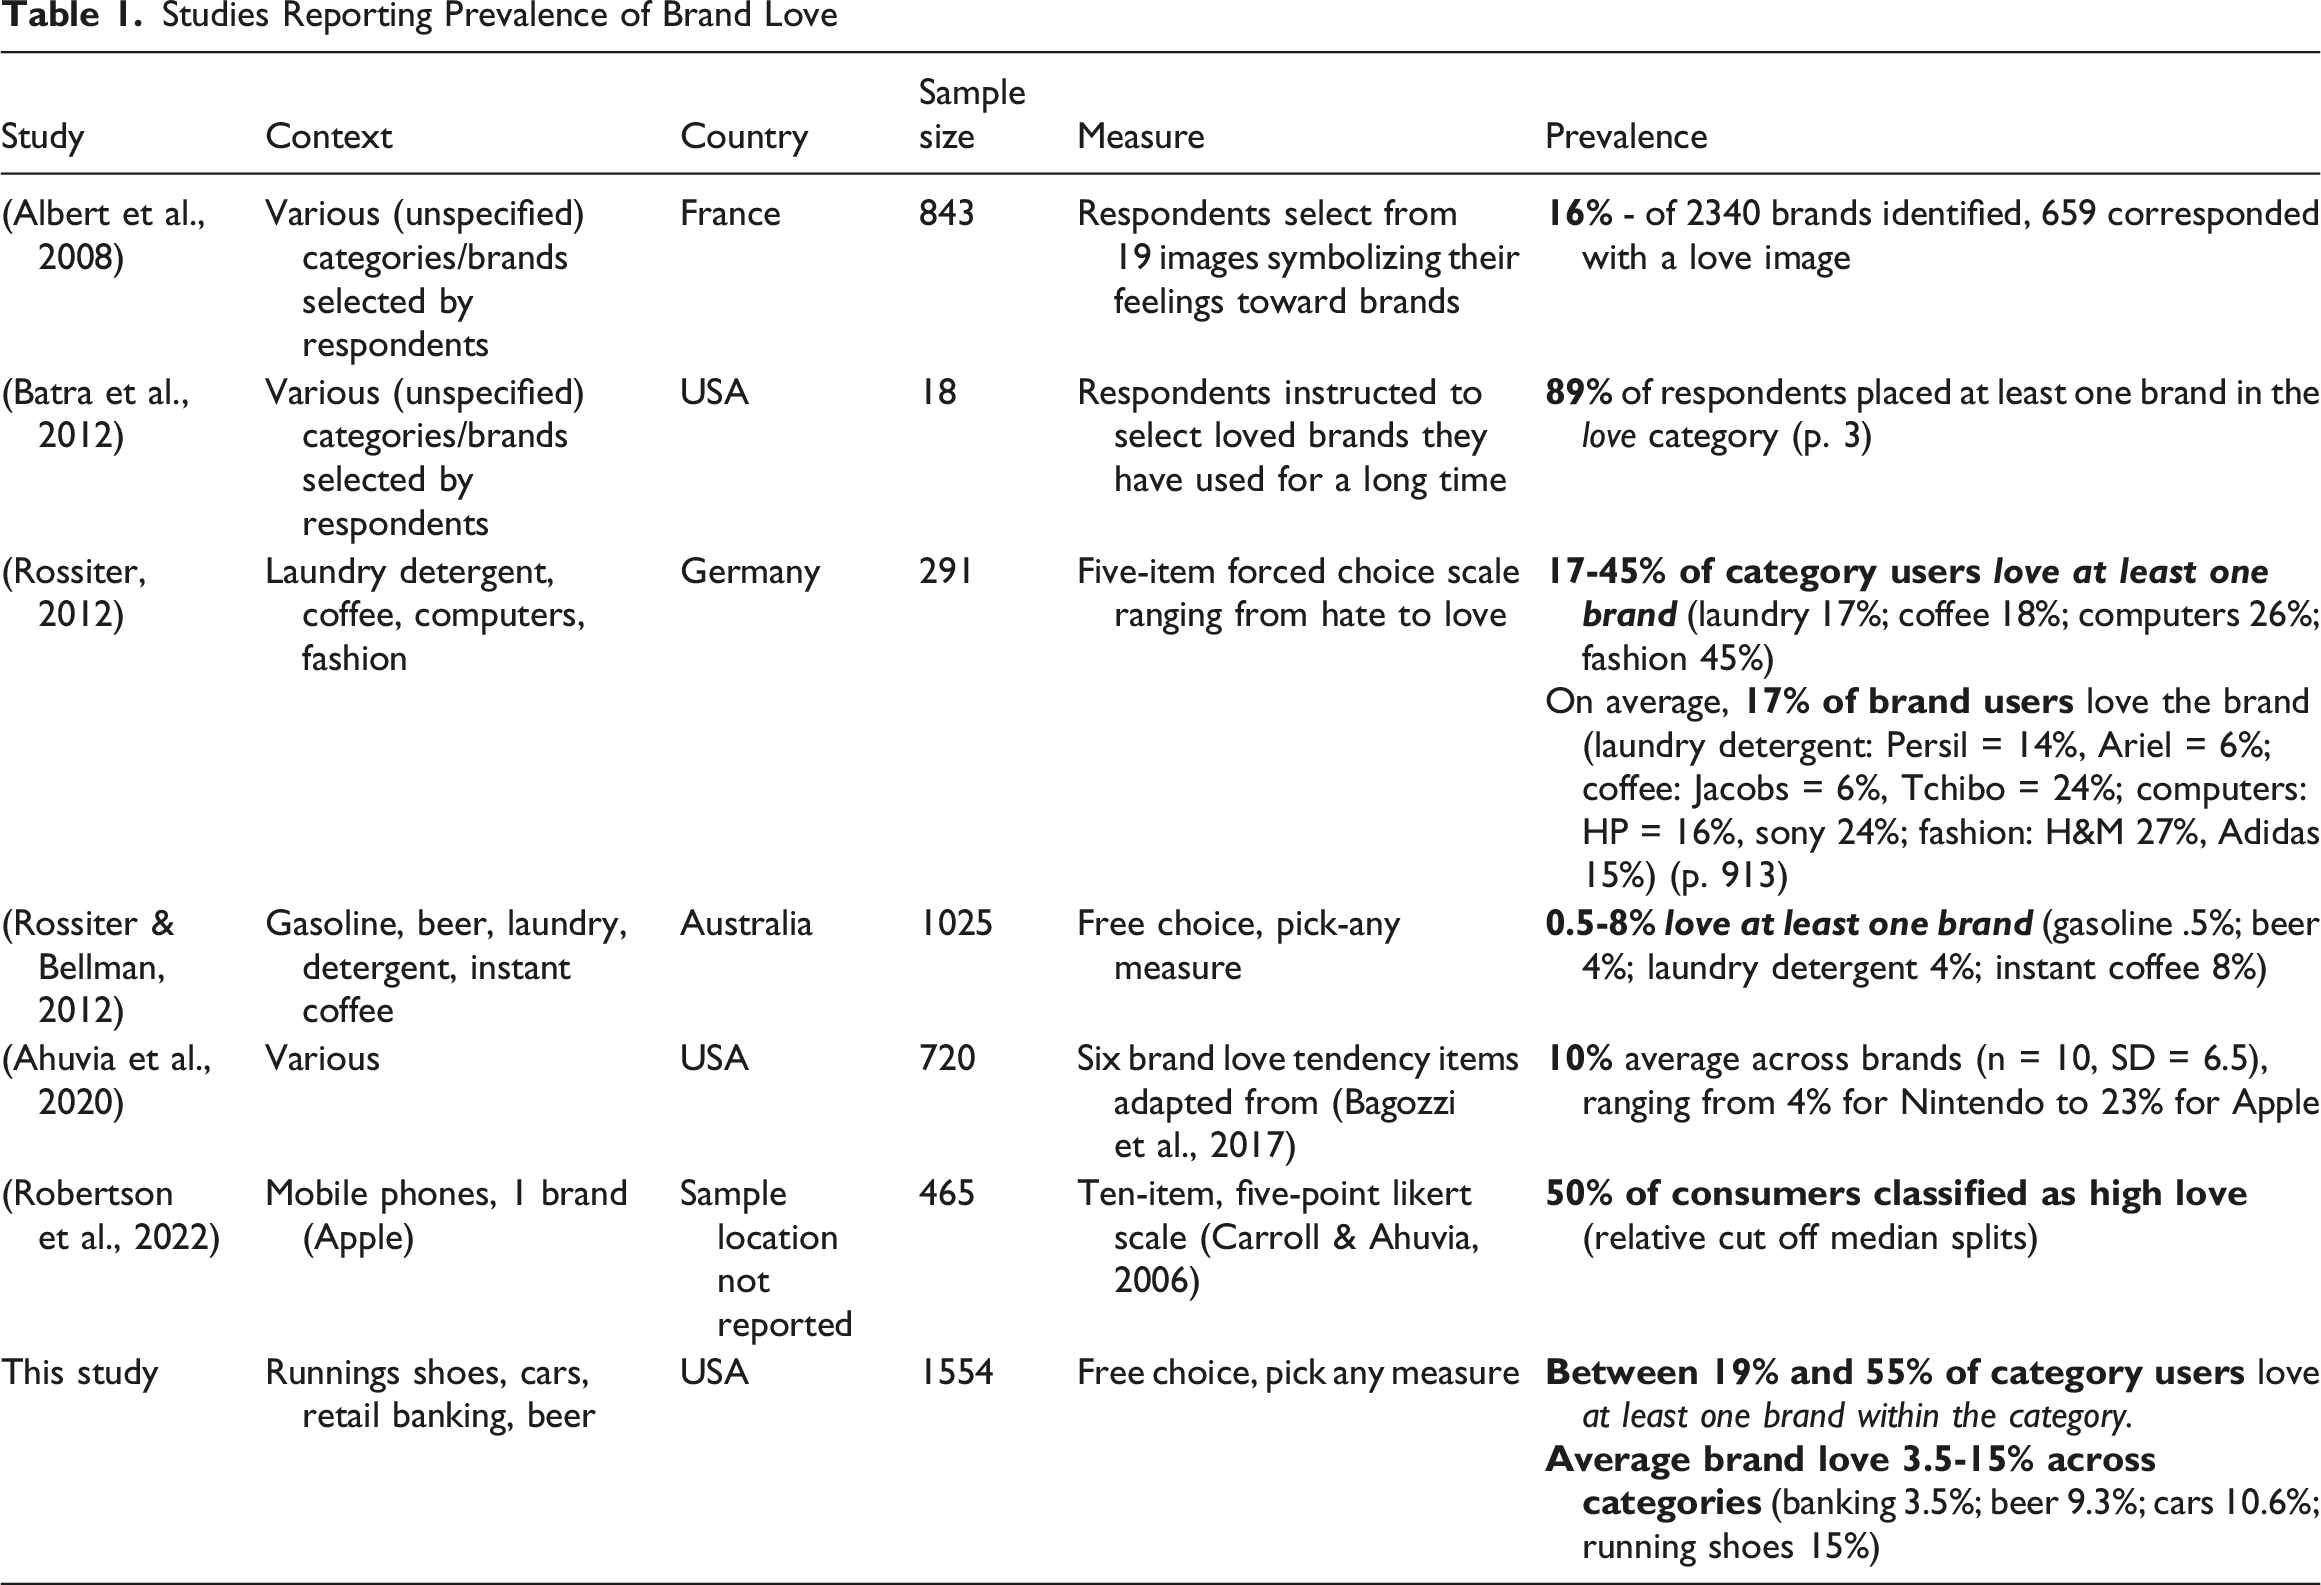
Existing research documenting brand love’s prevalence (Table 1) offers mixed results (Robertson et al., 2022; Rossiter, 2012; Rossiter & Bellman, 2012). It seems most consumers can love at least one brand in any category, but most brand buyers are not brand lovers. First, Albert et al. (2008) found that 16% of 2,340 brands were ‘loved’. Furthermore, Batra and colleagues (2012) reported that 89% of consumers love at least one brand. Indeed, the work by Albert et al., and Batra et al. sought to explore the nature and dimensions of brand love, not its prevalence. They therefore discuss brand love generally (e.g., the percentage of consumers who love brands), rather than its prevalence at the category or brand level.
In contrast, Rossiter (2012) and Rossiter and Bellman (2012) report brand love prevalence for specific categories, ranging from 0.5% to 45%. Like Batra and colleagues, these two studies report the proportion of consumers who love at least one brand. Rossiter (2012) found similar levels across two low-involvement categories, laundry detergent (17%) and instant coffee (18%), and higher levels in two high-involvement categories, personal computers (26%) and fashion (45%). Meanwhile, Rossiter and Bellman (2012) report love for the low-involvement categories gasoline (0.5%), beer (4%), laundry detergent (4%), and instant coffee (8%). However, both these studies are rather limited in sampling. Rossiter (2012) interviewed surveyed 291 German university students, while Rossiter and Bellman (2012) allocated 1025 Australian respondents to categories based on gender ‘representative buying’ (women – coffee, n = 468; laundry detergent, n = 606; men – beer n = 244; gasoline, n = 338). The latter study may over-represent ‘heavy’ category buyers as it relies on selective, rather than random, sampling (Sharp, 2012).
Next, research by Ahuvia and colleagues (2020), Rossiter (2012), and Robertson (2022) found brand love at the brand level is between 4% and 47%. In Ahuvia et al.’s (2020) study, 720 consumers identified 716 different ‘loved’ brands. The percentage of brand lovers, reported among the ten most popular brands, ranged from 4% (Nintendo) to 23% (Apple). Also, Rossiter (2012) reports the percent of users who love brands (n = 8 brands) was between 6 and 27%. Hence, it appears a majority of brands achieve brand love among a small portion of customers, and none achieve it among more than a quarter (Ahuvia et al., 2020). Providing a more optimistic outlook, Robertson and colleagues (2022) report 47% of consumers exhibit high loyalty (i.e., a composite determined by positive love and loyalty) toward Apple (the only brand studied). Their findings are based on median splits, where the remaining 53% of consumers are placed in the ‘low loyalty’ category. Apple is the world’s most valuable brand, with an estimated value of $575 billion in 2025 (Statista, 2025b), and is frequently reported as a ‘loved’ brand in research e.g., (Ahuvia et al., 2020; Palusuk et al., 2019). If brand love for one of the world’s largest brands is 23–50%, what can other brands expect to achieve?
Given the inconsistencies in prior research and the strategic importance of brand love, greater clarity around its prevalence is required. Establishing how many consumers love brands will provide more realistic benchmarks against which to base emotional branding strategies. It will also help determine whether achieving brand love is the norm or the exception for firms.
Importantly, the direct comparison of brand love prevalence at the category- and brand-level remains limited given studies operationalise and measure brand love differently (see Palusuk et al., 2019). Generally, when conceptualised as an emotion, measurement items are more ‘affect’ driven (e.g., Carroll & Ahuvia, 2006), whereas the relationship perspective may incorporate dimensions relating to behaviour or cognitions (e.g.,Batra et al., 2010). To date, psychometric-based measurements such as Carroll and Ahuvia’s (2006) 10-item measure have been among the most widely used in the literature. However, as Table 1 shows, few studies have consistently reported the explicit prevalence of brand love. An exception is the single-item brand love measures used by Rossiter (2012) and Rossiter and Bellman (2012). Notably, the former study used a ‘forced choice’ approach, in which respondents must choose between binary options, whereas the latter was ‘pick-any’. Each offers advantages and disadvantages. For instance, the pick-any approach is argued to be more parsimonious for respondents (Driesener & Romaniuk, 2006; Romaniuk, 2023), but less stable in longitudinal studies (Dolnicar et al., 2012; Rossiter, 2016). However, we use a free-choice, pick-any measure, consistent with Rossiter and Bellman (2012), to allow comparison across established benchmarks.
In the present study, we report the prevalence of category brand love (based on the proportion of consumers who love at least one brand within the category) (Rossiter & Bellman, 2012). This measure has been favoured by previous researchers (Table 1), and gauges how ‘loveable’ a category is. Although, it is arguably limited from a brand perspective given it does not show how brand love varies across brands. The measure is also sensitive to the number of brands in the category, as each additional brand increases the likelihood a consumer will ‘love’ at least one brand. Therefore, we additionally report the percent of category buyers who express love for each brand individually (Rossiter, 2012). This latter figure is averaged across brands within the categories tested to report the ‘average’ brand love for each category. Reporting both measures replicates Rossiter and Bellman’s (2012) measure of category love, and adds understanding to the average ‘brand’ love within each category.
Brand Love and Product Category Involvement
Involvement, a consumer’s degree of interest in and engagement with a product class, varies across product categories (Howard & Sheth, 1969; Martin, 1988; Sharp, 2017). Some product categories, such as durables, cars, financial products and services, are inherently high-involvement due to their financial risk (i.e., high price) (Dawes et al., 2009). Whereas low-involvement categories such as fast-moving consumer goods are relatively inconsequential, as making the wrong choice poses limited financial risk to a consumer (Sharp et al., 2002). The length and intensity of a consumer’s relationship with a brand also differs between these categories. While low-involvement categories are characterised by low loyalty (multi-brand buying) and repeat-buying, high-involvement products typically occupy more of a consumer’s attention, time and resources, but are bought very few times, and often consumers buy the same brand again (Li et al., 2022).
High- and low-involvement product categories should differ in their ability to elicit consumer emotions, including love (Albert et al., 2008; Dwayne Ball & Tasaki, 1992; Fetscherin et al., 2014). However, prior findings on how high- and low-involvement product categories impact consumer relationships are mixed. For instance, several studies suggest a positive influence of high product involvement on brand relationships (Christy et al., 1996; Kressmann et al., 2006; Veloutsou, 2007; Wilson, 2011). In contrast, Valta (2013) argued that ‘product category involvement does not significantly impact brand relationship quality’ (p. 101). One of the few studies to explicitly investigate the effect of product category on brand love found brand relationships exist in all categories, but the intensity of these relationships differs across categories (Fetscherin et al., 2014). Specifically, the relationship between love and loyalty was strongest for cars, followed by soft drinks, then shoes, and weakest for mobile phones (Fetscherin et al., 2014). Moreover, Voorn and Pruyn (2015) found high-involvement products (i.e., shoes, clothing, insurance, and laptops) do not necessarily have higher love scores than low-involvement products, although they call for further research into the generalisability of these findings (Voorn et al., 2015, p. 102). In summary, evidence suggests brand love is more likely to occur in higher-involvement product categories, leading to the first hypothesis:
Brand love is higher among high-involvement categories than low-involvement product categories
Answering a call from Rossiter and Bellman (2012) to investigate brand love in high-involvement, positively-motivated product categories, we investigate three high-involvement categories (cars, retail banking and running shoes). We also compare the incidence of brand love for these high-involvement categories with beer, a low-involvement, category reported by Rossiter and Bellman (2012).
Cars are considered a high-involvement product category, on account of high consumer interest, symbolic and hedonic value, and high financial risk (Dawes et al., 2009; Lapersonne et al., 1995). Brands such as Toyota and Ford frequently top industry brand love lists, ranking among the most ‘powerful’ and ‘loved’ brands in the world (Statista, 2025b). Next, the running shoes category includes fashion brands such as Nike and Adidas. Such sports apparel brands often employ branding strategies with the goal of building strong emotional bonds with consumers (Pourazad et al., 2020). They are regarded as aspirational and appeal to consumers’ ideal and actual selves (Dawes, 2009; Kim et al., 2011; Pourazad et al., 2019). Hence, this high level of brand identification may translate into high levels of brand love.
Finally, we also include retail banks as a high-involvement category due to the financial risk involved. However, we anticipate a lower prevalence of brand love in this category. For example, in 2024, 69 million Americans considered themselves ‘car enthusiasts’ while over 51 million engaged in running or jogging (Statista, 2025c). While we do not doubt there may be some bank lovers, we expect it to be a less ‘loved’ category than cars and running shoes, despite its high involvement. Supporting this distinction, Rossiter and Bellman’s (2012) study found that ‘hedonic’ low-involvement products (beer and coffee), which provide positive experiences and opportunities for self-expression (Voss et al., 2003), were more loved than the ‘utilitarian’ low-involvement products (gasoline and detergent).
Hedonic goods can be purchased to satisfy ‘sensory gratification’, one of three transformational or positive-ending motives (along with intellectual stimulation and social approval) influencing product and brand decisions (Rossiter et al., 1991; Rossiter & Percy, 2017). Transformational motivations are positive-ending, helping enhance a consumer’s sensory, mental, or social state (Rossiter et al., 1991). However, purchase motivations can differ at the product and brand level. For example, Rossiter (1991) observe the decision to buy from ‘cars’ as a category may arise due to negative-originating, informational motivations (such as ‘normal depletion’, to replace an old car for means of transportation). However, at the brand level, the motivation to purchase a car is likely to be transformational (e.g., social approval, to impress others). The same distinction between category and brand-purchase motivation is likely to apply to running shoes (like the ‘fashion clothing’ category, which Rossiter et al. (1991) place on the transformational side of their grid).
Therefore, we conceptualise cars and running shoes in this study as ‘transformational’ categories, investigating whether their positively motivated nature yields more brand love. Here, ‘transformational’ categories are positively motivated, with brands being consumed for the benefits they provide, including fun and self-expressiveness (Rossiter et al., 1991). In contrast, banks are a ‘utilitarian’ (or ‘informational’) product category, fulfilling functional and practical benefits, satisfying necessities more so than desire. Indeed, some consumers may be influenced by transformational motivations when selecting bank brands (and vice versa, for cars or running shoes). However, the majority of bank purchasing or brand selection is likely driven by informational rather than transformational reasons. Following this, we contend that banks are relatively less transformational than the other high-involvement categories tested, and hypothesise that:
The prevalence of brand love is higher among ‘transformational’ and self-expressive high-involvement categories (cars and running shoes) compared to a utilitarian high-involvement category (banks).
Outcomes of Brand Love
Existing research linked brand love to several desirable firm outcomes, most notably brand loyalty (Bergkvist & Bech-Larsen, 2010; Bıçakcıoğlu et al., 2018; Carroll & Ahuvia, 2006; Drennan et al., 2015). Brand attachment and other related relationship theories suggest that consumers interact more often with brands if they provide emotional value rather than mere utility satisfaction (Fournier, 1998; Pogorzelski, 2018). Accordingly, it is assumed that consumers buy brands they ‘love’ more than alternatives they have no feelings toward (Romaniuk, 2023). Similarly, the ‘Lovemarks’ theory posits that brand love can result in ‘loyalty beyond reason’ (Pawle & Cooper, 2006; Roberts, 2004).
Empirical findings support a link between brand love and positive outcomes for the brand. For example, Carroll and Ahuvia’s (2006) seminal study empirically linked brand love to positive word of mouth and brand loyalty. Subsequent studies also report word of mouth and loyalty are linked to brand love (Bairrada et al., 2018; Carroll & Ahuvia, 2006; Palusuk et al., 2019). Additional outcomes include higher purchase intentions for ‘loved’ brands (Batra et al., 2012; Ferreira et al., 2019; Fetscherin, 2014); reduced price sensitivity and, therefore, willingness to pay a price premium (Albert & Merunka, 2013; Guru et al., 2024; Thomson, MacInnis, & Park, 2005). Finally, brand love has been associated with forgiveness of brand failures or transgressions (i.e., a ‘violation’ of consumer expectations) (Fetscherin & Sampedro, 2019; Tolunay & Veloutsou, 2025).
Loyalty Operationalisation in Brand Love Research
A caveat of existing brand love research lies in how one of its desirable outcomes, loyalty, is conceptualised and measured (e.g., Le, 2021; Pontinha & Coelho do Vale, 2020; Sajtos et al., 2021). Loyalty, a consumer’s biased response toward a brand, can be attitudinal, behavioural, or a composite of both (Bandyopadhyay & Martell, 2007; Jacoby & Chestnut, 1978). Existing brand love research relies primarily on attitudinal or composite loyalty measures incorporating feelings toward buying (proxies for loyalty), rather than actual buying behaviour. For example, Carroll (2006) measured loyalty based on four, five-point Likert-type items such as ‘When I go shopping, I don’t even notice competing brands.’ One advantage of such measures is their ability to distinguish intentional purchasing from spurious loyalty (i.e., loyalty driven by purchase availability or happenstance rather than true preference) (Bandyopadhyay & Martell, 2007; Dick & Basu, 1994). However, attitudes and purchase intentions do not always correlate with actual behaviour (Ajzen & Cote, 2008; Kraus, 1995). In contrast, behavioural loyalty is derived from recorded purchase behaviour, unlike attitudes, which are latent constructs (East et al., 2005). From a managerial perspective, behavioural loyalty is arguably a more parsimonious and relevant measure compared to attitudinal equivalents (Dawes, 2023).
Yet, few studies specifically measure the impact of brand love on behavioural loyalty, with two exceptions. First, Zarantonello and colleagues (2016) combined brand love survey data with panel purchase data (i.e., different data sources) to examine brand love’s relationship with actual brand performance. Using regression, they found brand love positively related to share of requirements (SoR) growth (a two-year, incremental aggregate loyalty measure), but not to current SoR. The authors suggest that brand love may be predictive of loyalty growth rather than reflective of a brands’ current performance (Zarantonello, Formisano, et al., 2016). In contrast, Rossiter and Bellman (2012) found that the share of category requirements among brand lovers is, on average, 20 percentage points higher than among non-lovers. However, this finding was based on descriptive comparisons rather than statistical tests of difference. Taken together, these studies provide mixed evidence on whether love correlates with behavioural loyalty cross-sectionally. This ambiguity underscores the need for further testing. If brand love is influential, we should observe meaningful differences in behaviour between those who love a brand and those who do not. We therefore propose H3:
Brand lovers have greater behavioural loyalty (Share of Category Requirements), than non-lovers of the brand.
Once again, our expectation (tested by H1 and H3) is that brand love, and therefore brand loyalty, will be higher for high-involvement categories compared with low-involvement categories. In our experiment, we measure brand love (at the category and brand level) and behavioural loyalty (H2) for three high-involvement categories (cars, running shoes, and banks). We compare their love levels with a low-involvement category (beer), which was also measured previously by Rossiter and Bellman (2012), to situate our findings among their benchmarks for four low-involvement categories.
Data and Method
Data Collection
Data were collected in April 2025 through an online panel provider, with ethics permission (IRB approval number 207036), via an online survey of 1,554 US consumers aged 18–80 (21+ for the beer category). Non-probability quota sampling was used to ensure the sample was demographically balanced in terms of location, age and gender. Respondents were 50.5% Male and 49.5% Female. The mean age was 48 years old (Median = 47, SD = 17.9). Demographic profiles of the data can be found in Appendix A. The final sample size for each product category was: cars n = 603, retail banking n = 740, shoes n = 626, beer n = 622.
Respondents were allocated to answer questions for up to two product categories based on screener eligibility. Specifically, if respondents self-selected as buyers of the category, they were then randomly allocated to answer questions about a maximum of two of the categories. Category buying was based on whether they bought beer in the past three months, running shoes in the past twelve months, or had at least one personal banking product. Lastly, those who bought or leased a vehicle in the past three years—or are likely to buy or lease (>6/10 likelihood) in the next three years—were allocated to the car category.
In the survey, consumers were asked about brand awareness, brand emotions, buying behaviour and demographic questions such as household size and income. They were then asked about their feelings only toward familiar brands (i.e., the brands respondents rated as ‘somewhat familiar’ or ‘very familiar’). Each brand’s logo was displayed alongside the brand’s name to aid recognition, in the same manner used by Rossiter and Bellman (2012). Lastly, respondents had to pass an attention check (whereby respondents were instructed to check ‘strongly agree’ on one 7-point Likert scale) to ensure data quality.
Key Survey Measures
To measure brand love, five emotional attributes were adapted from Rossiter and Bellman (2012): (1) Trust – ‘I trust this brand’; (2) Bonding – ‘I regard it as my brand’; (3) Resonance - ‘I use this brand because it fits my self-image’; (4) Companionship – ‘It is like a companion to me’; and (5) Love – ‘I would say that I feel deep affection, like ‘love’, for this brand and would be really upset if I couldn’t have it’). The “double-barreled” brand love measure (consumers must agree with both clauses) was originally developed by Rossiter (2012) and has since been empirically validated in subsequent studies (Langner et al., 2016; Rossiter & Bellman, 2012). As such, the measure is kept consistent in our study to allow direct comparability between the present study and Rossiter and Bellman (2012). Responses were collected via a free choice pick any method where participants are presented with a brand and asked which, if any, attributes they associate with that brand (Driesener & Romaniuk, 2006). This method accounts for the possibility of consumers not having any feelings toward some brands, unlike alternative forced-choice measures. The appendix provides further details of these measurement approach.
Next, the survey included a constant-sum share of category requirements (SCR) scale to measure behavioural loyalty (Baldinger & Rubinson, 1996; Rossiter & Bellman, 2012). SCR is a widely used metric that measures the proportion of a consumer’s category buying going to a particular brand (Farris et al., 2016; Singh & Uncles, 2016). Accordingly, respondents were asked to estimate their SCR by indicating what percentage of category purchases (or ‘usage’ for banking) typically go to each brand in the category over a specified period, whereby answers summed to 100%. For cars, respondents were also asked to estimate their purchase likelihood for car brands on a Juster scale. This measure is an alternative to SCR, given the low purchase frequency and limited variation in car ownership. The Juster scale is an 11-point scale where each point includes a number and verbal statement, ranging from 0 ‘No chance, or almost no chance (1 in 100)’ to 10 ‘Certain, practically certain (99 in 100)’ (Juster, 1966, p. 672). It has been empirically demonstrated to reflect purchasing behaviour, particularly for durables and services (Wright et al., 2002).
Replication Studies in Marketing Science
If academia is a marketplace of ideas, replication should be the market regulator. The scientific method involves systematically re-testing findings to identify the boundary conditions under which they remain valid (Armstrong & Green, 2022). Scientific replication, in turn, entails re-testing past studies to test the validity and generalisability of findings (Lehmann & Bengart, 2016). Together, these two outcomes of replication help determine the scope and boundary conditions of scientific findings, including in marketing science (Uncles, 2011).
Replication can be direct, indirect or differentiated. Direct replications repeat studies in conditions as close to the original study as possible to assess the reproducibility of results (Simons, 2014). Alternatively, indirect (close) replications test whether findings and theories are generalisable to new contexts, often with different methodologies (Easley et al., 2000). Lastly, differentiated replications retain core parts of the methodology but alter study conditions to validate and extend existing findings (Uncles & Kwok, 2013). There have been recent calls for more replications in marketing science to ensure the reliability of empirical findings (Bergkvist et al., 2024; Phua et al., 2023; Royne, 2018). To this end, this paper addresses these calls with a differentiated replication of Rossiter and Bellman (2012), including an extension to high-involvement categories.
Results
Prevalence of Brand Love Across High- Versus Low-Involvement Categories
H1 proposed brand love is higher among high-involvement categories than low-involvement categories. This hypothesis was tested by measuring brand love for 84 brands from four categories: three high-involvement (cars, running shoes, and banks), and one low-involvement category (beer). The prevalence of brand love was calculated in two ways. First, we report the proportion of consumers who love at least one brand in the same manner as Rossiter and Bellman (Rossiter & Bellman, 2012) and other researchers (Batra et al., 2012; Rossiter, 2012). Additionally, we report the average brand-level love for each category. This was calculated by determining the percentage of consumers who love each brand and then averaging these percentages across all brands in the category.
Overall Incidence of Brand Love Across Categories
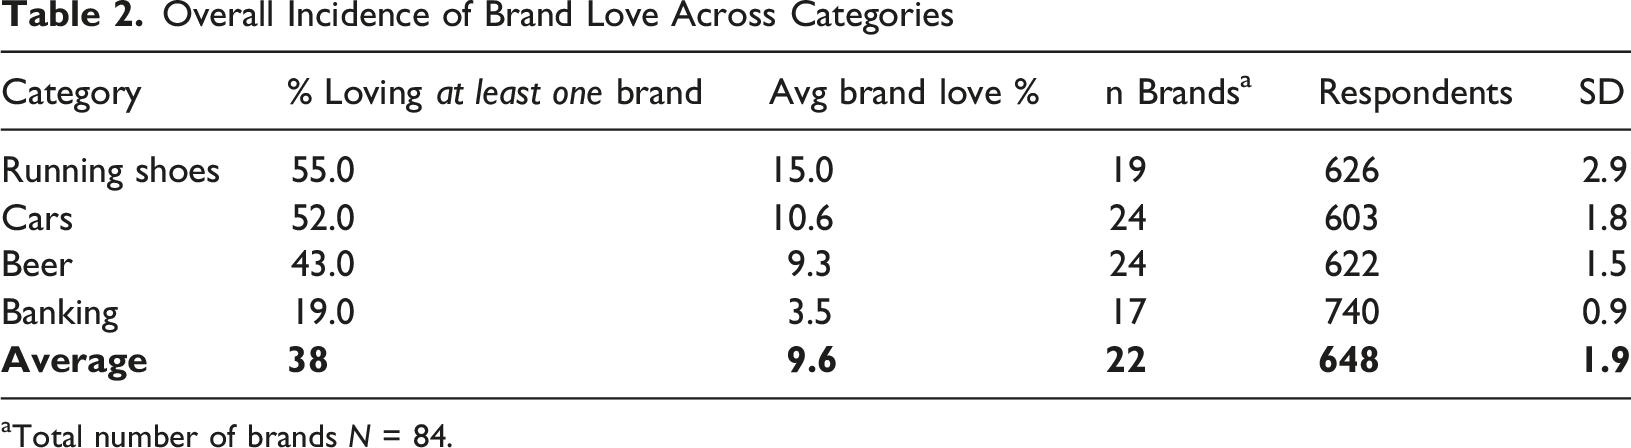
aTotal number of brands N = 84.
Next, the average brand love level was 9.6% across the four categories. This varied by category; the highest average was in running shoes (15%), a high-involvement, transformational category while the lowest was in retail banking (3.5%), a high-involvement, informational category. For cars and beers, the incidence was 10.6% and 9.3%, respectively. As such, the average incidence of brand love for the three high-involvement categories (9.7%) was higher, but not significantly, than the rate for the low-involvement category (9.3%, ꭓ2 (1, N = 2,591) = 0.00, p = .98). Consequently, H1 (love is higher among high-involvement categories) was not supported (whether measured by category- or brand-level love).
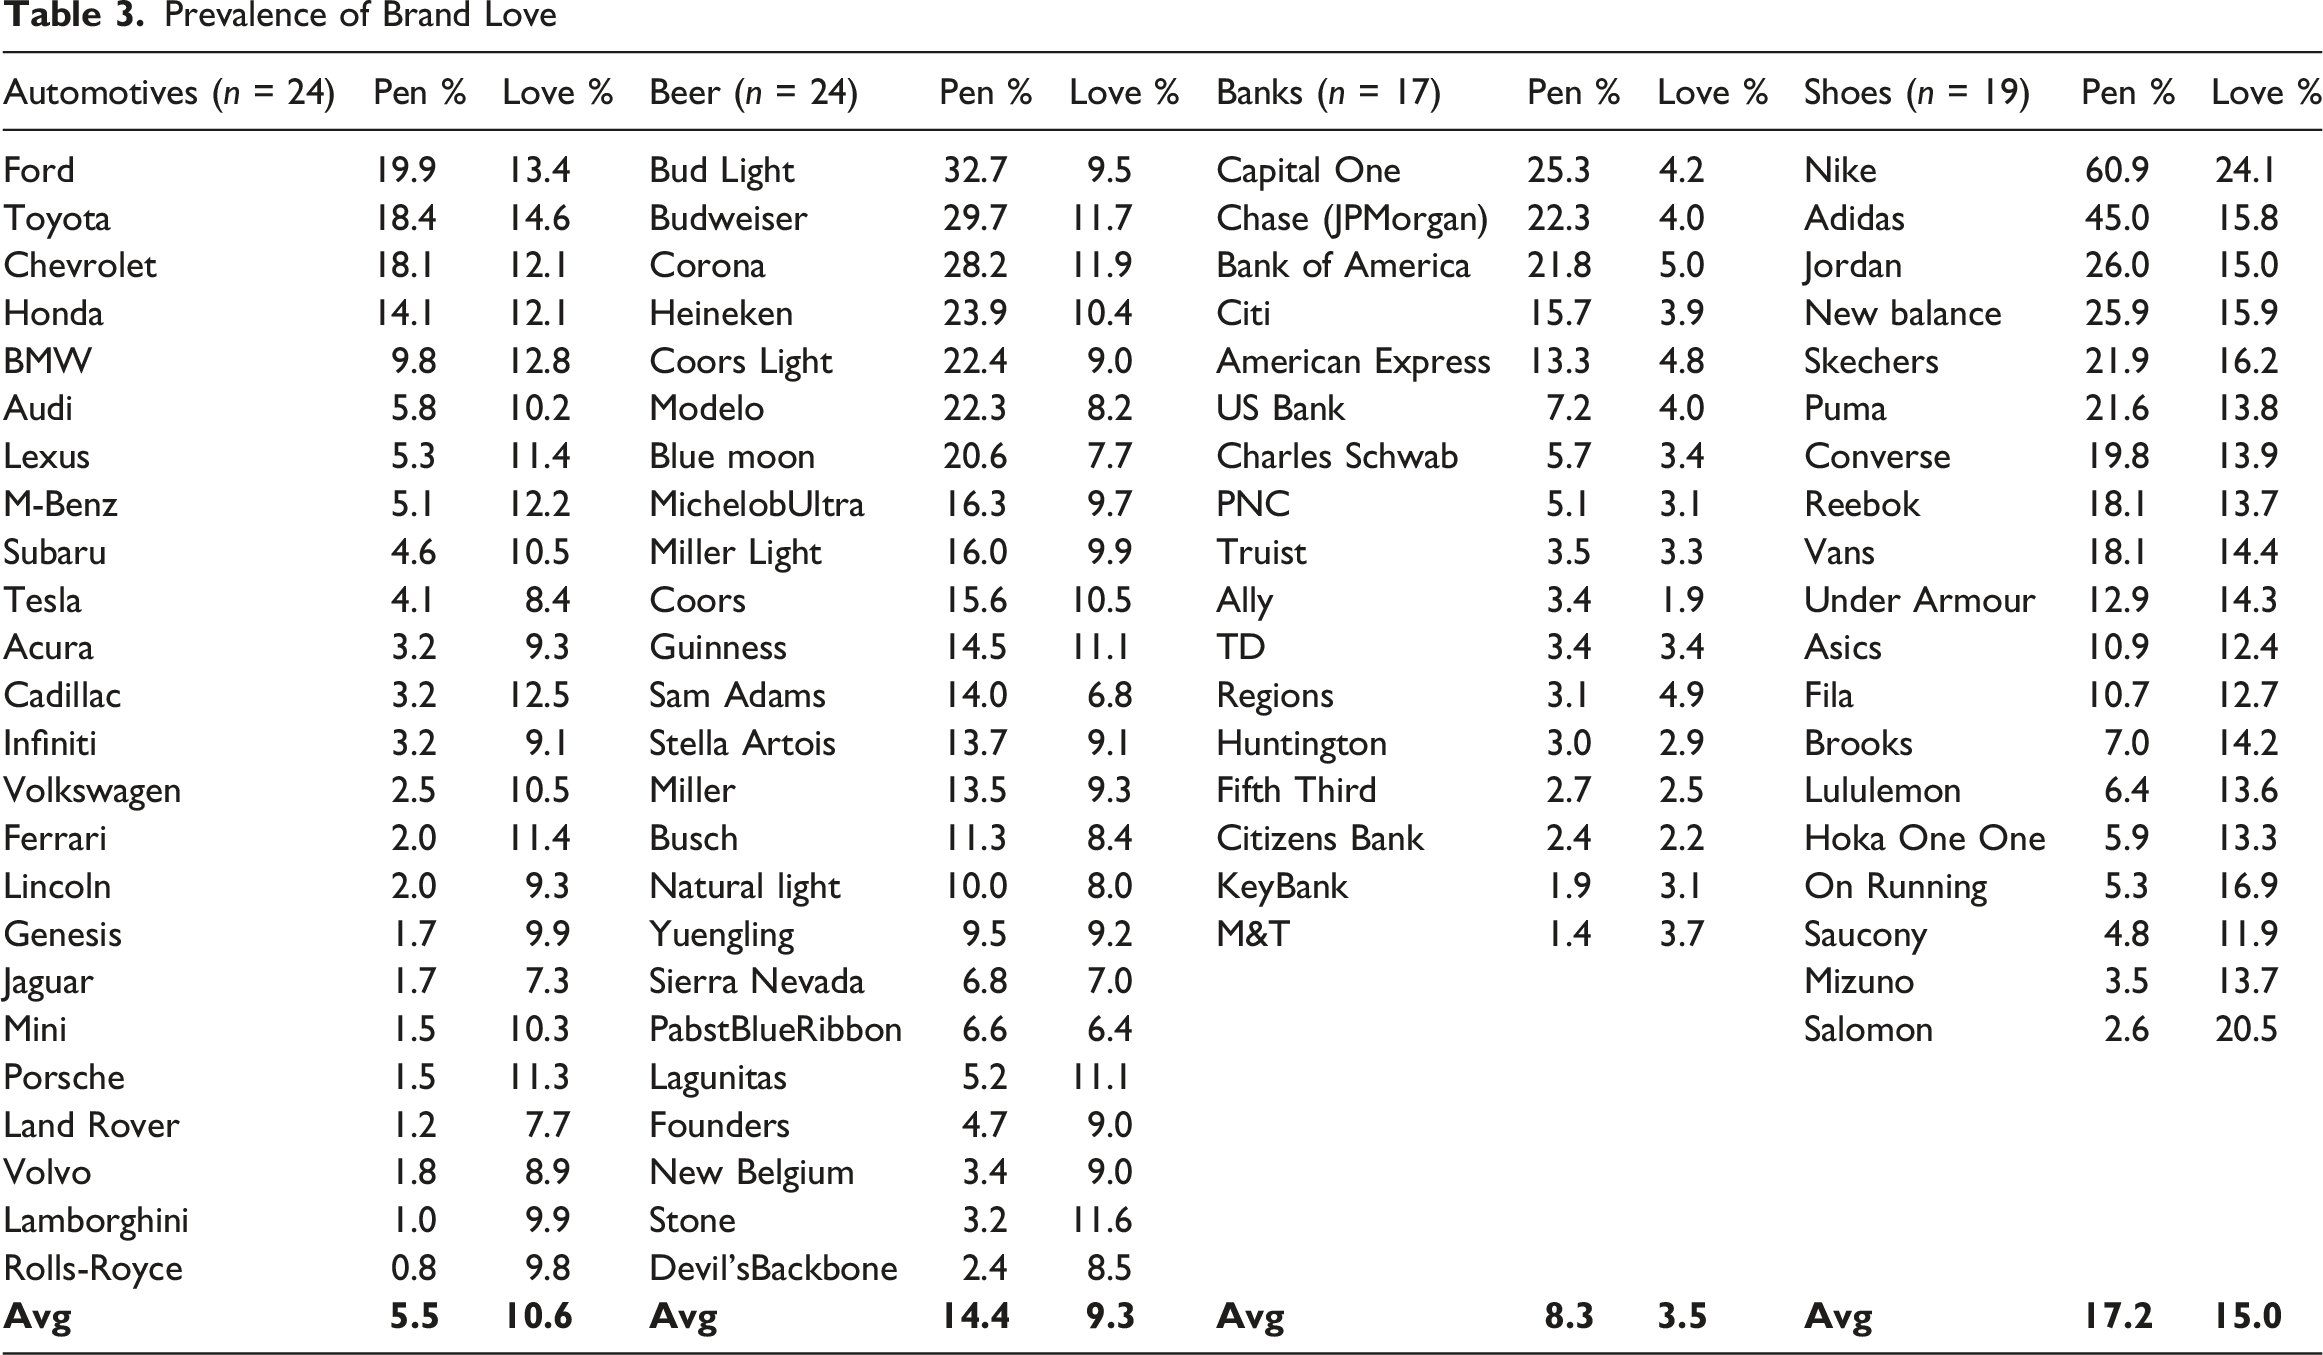
Prevalence of Brand Love
Prevalence of Brand Love Across Transformational Versus Informational High Involvement Categories
H2 tested whether the prevalence of brand love is higher among ‘transformational’ high-involvement categories (cars and running shoes) compared to an informational high-involvement category (banks). Chi-square tests revealed the proportion of category users loving at least one brand was significantly higher in the two transformational high-involvement categories (53.5%) than in the informational high-involvement category (19.0%), ꭓ2 (1, N = 1,969) = 228.42, p < .001. This also holds for the average brand love level (12.8%) vs (3.5%, ꭓ2 (1, N = 1,969) = 46.64, p < .001). Therefore, H2 was supported.
Brand Love and Behavioural Loyalty
Next, H3 proposed that brand lovers have greater behavioural loyalty (Share of Category Requirements), than non-lovers of the brand. Behavioural loyalty was operationalised as share of category requirements for banks, shoes, and beer, at the brand level in each category. In the car category, purchase intentions (subjective probabilities measured on an 11-point Juster scale) was the dependent variable to account for low purchase frequency.
Prior to comparisons, we assessed data normality of dependent variables using the Shapiro-Wilk test for small samples (n < 50) and the Kolmogorov-Smirnov test for larger samples. All tests were significant (p < .05), indicating the data were not normally distributed. Accordingly, the non-parametric Mann-Whitney U Test was used to compare behavioural loyalty between lovers and non-lovers for each brand.
SCR Among Non-lovers and Lovers, Banks and Shoes
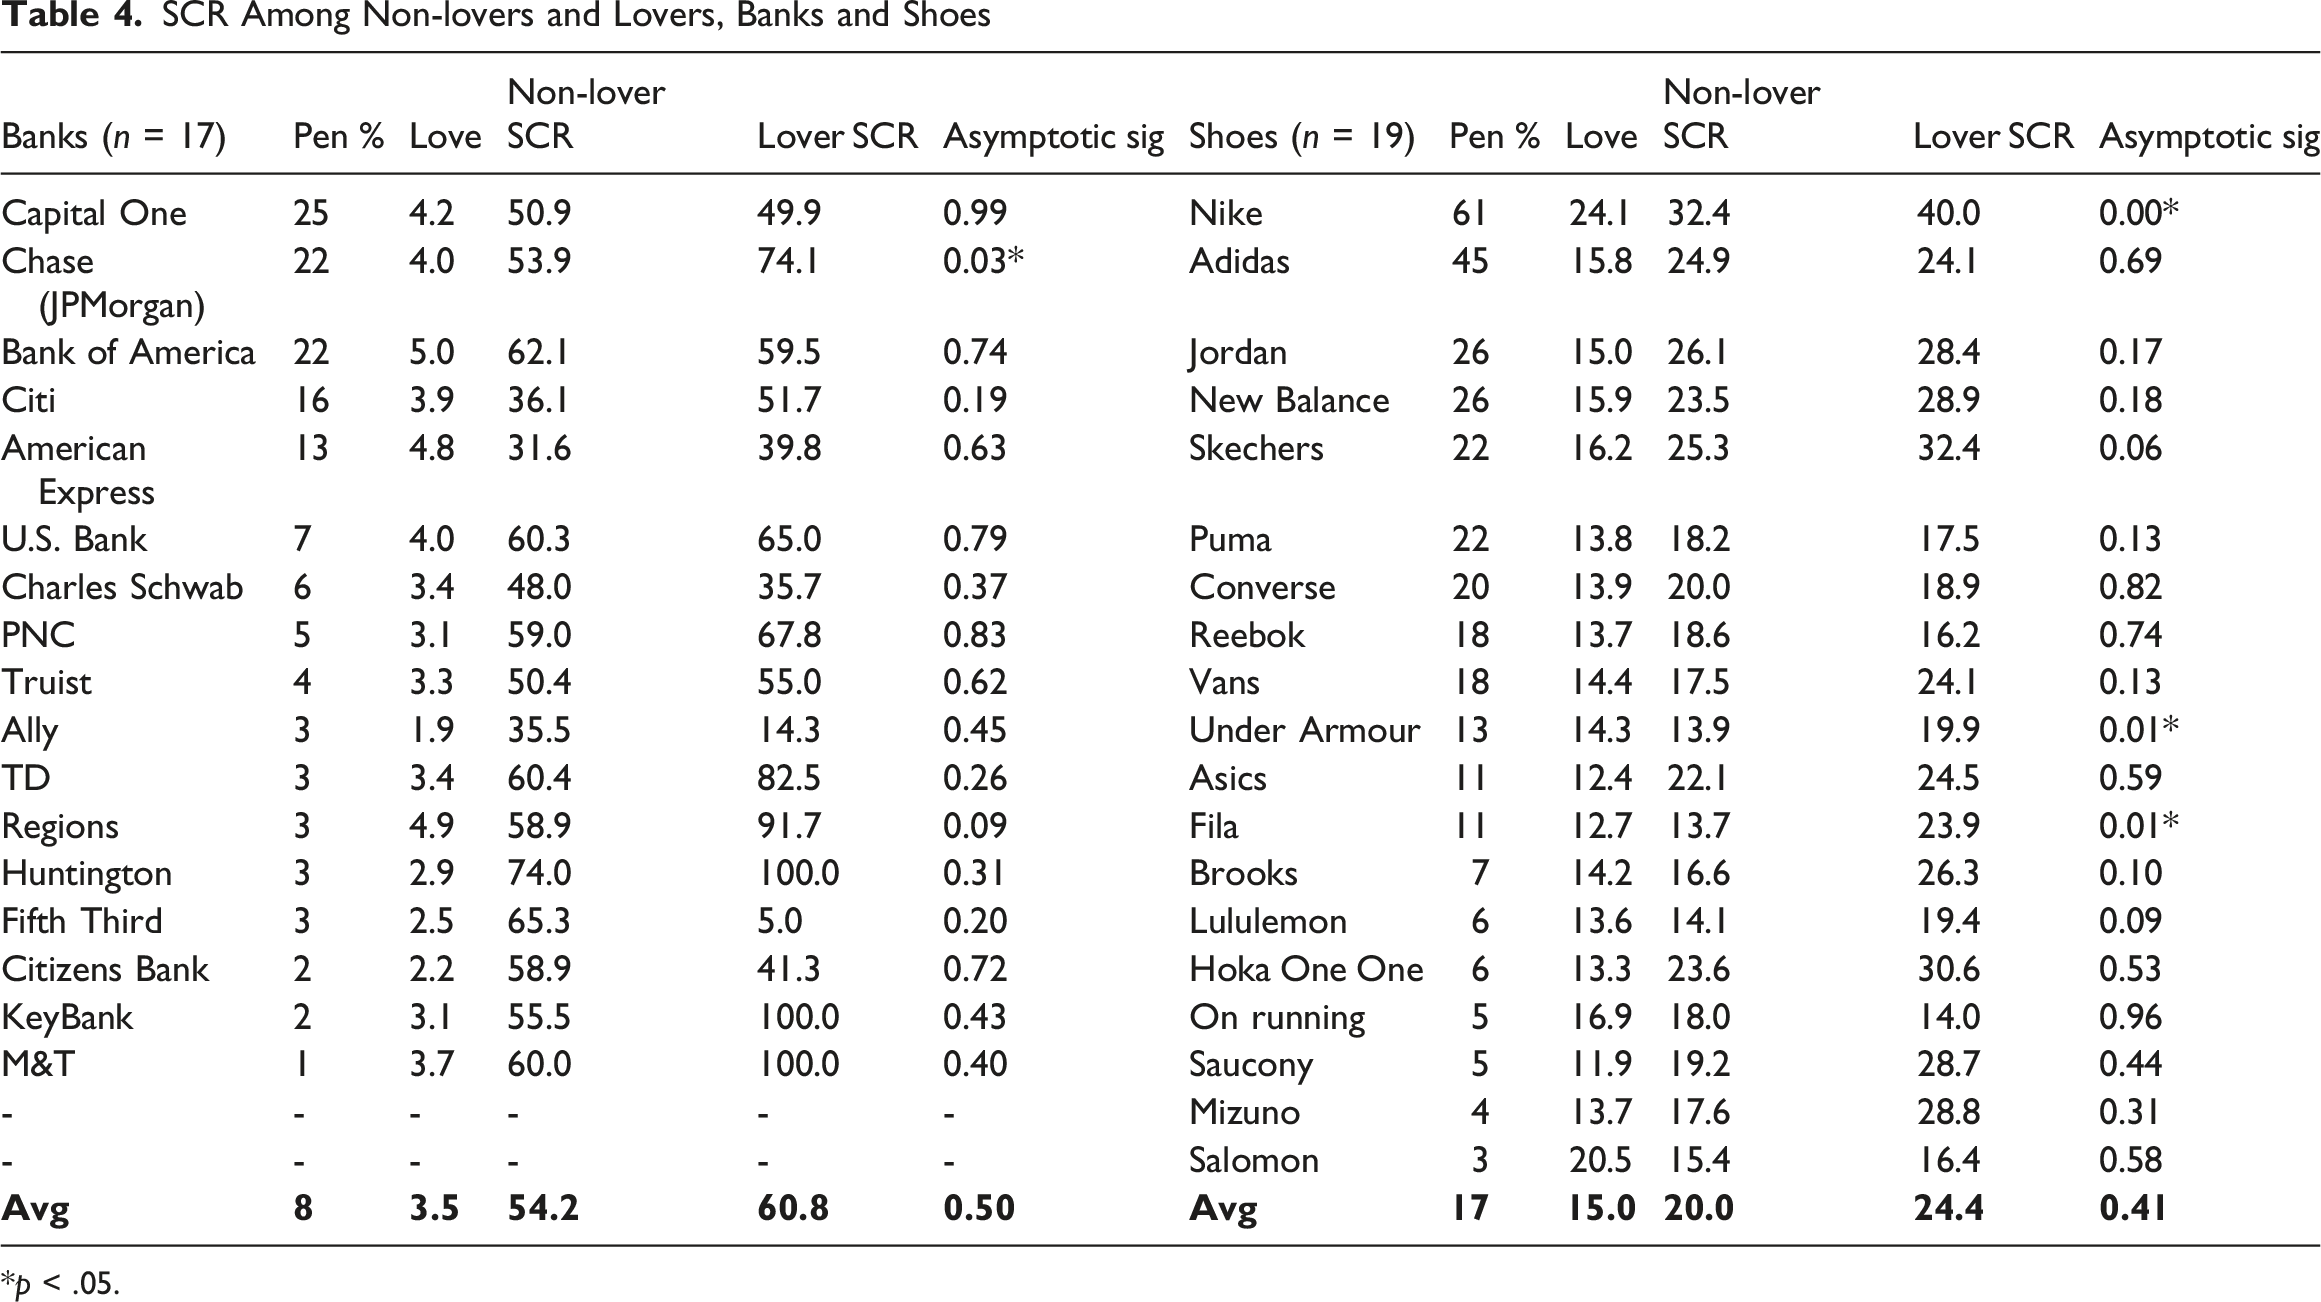
*p < .05.
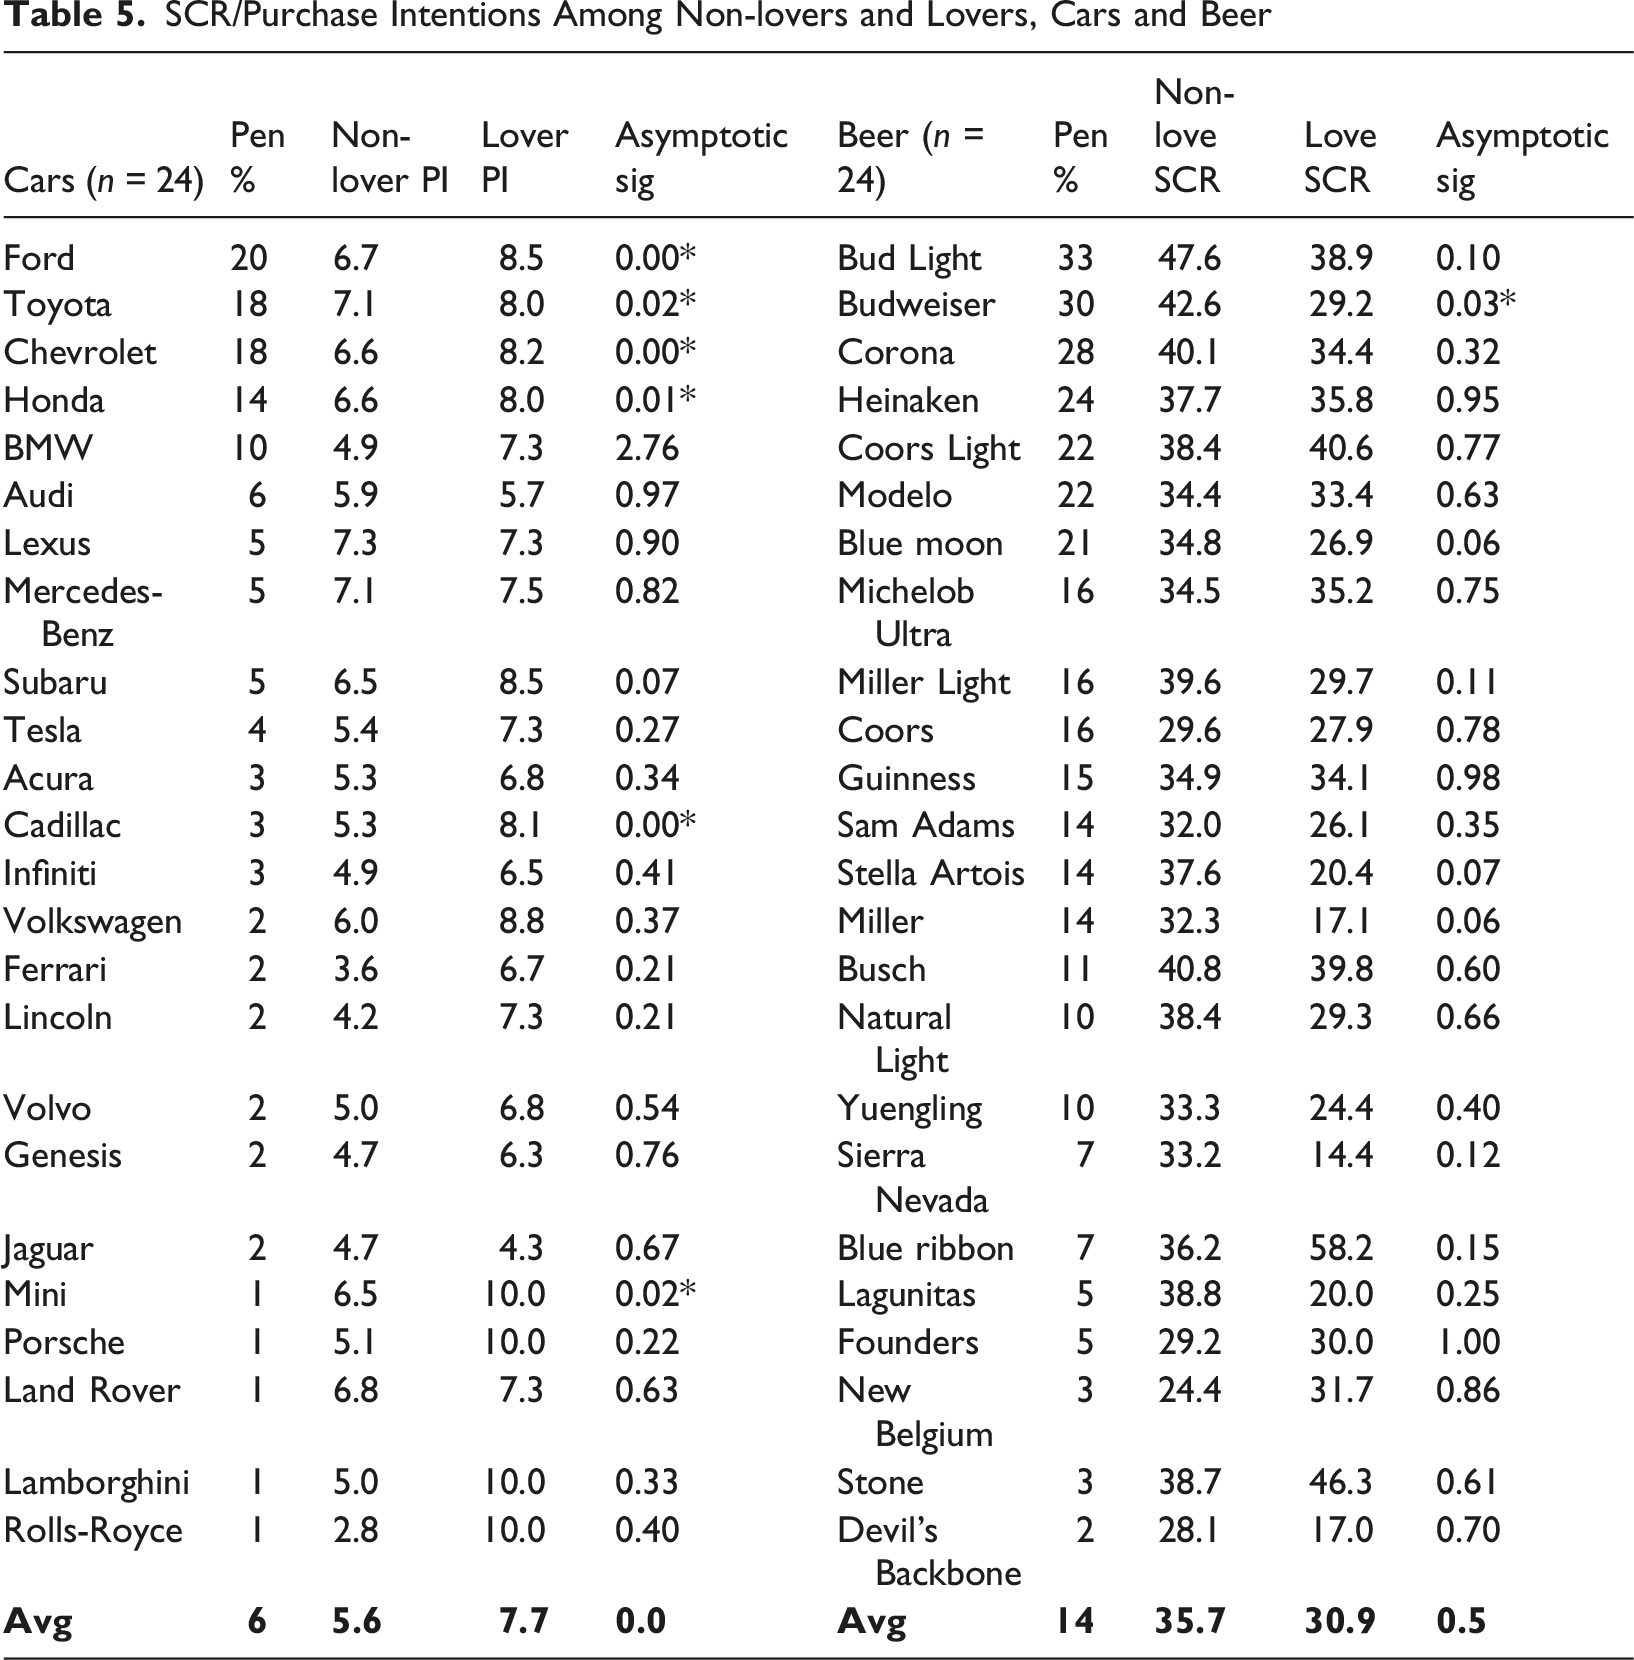
SCR/Purchase Intentions Among Non-lovers and Lovers, Cars and Beer
A Critical Reflection on the Relevance of Brand Love
Despite its prominence in marketing theory and practice, this study’s findings may invite a critical reassessment of the managerial relevance and scientific utility of the brand love construct. Brand love emerged amid broader interest in emotional branding and humanlike metaphors of consumer-brand relationships. Within this paradigm, the notion that consumers could ‘love’ brands has undoubtedly provided an intuitively appealing and rhetorically powerful way to describe intensive affective bonds. To this end, brand love has promised managers a utopia in which their consumers fall in love with and buy only their brands. But, more than two decades on, mounting evidence should lead researchers to consider whether this rose-tinted view of consumer behaviour is a managerially useful construct or a romantic metaphor which overstates the reality of most consumer-brand relationships.
There has been a spirited debate over the theoretical utility of brand love (Romaniuk, 2013, 2015). At best, its conceptualisations and theoretical base are broad, with several influential contributions such as that from Batra and colleagues (2012). At worst, the theoretical debate remains too fragmented for managers to meaningfully operationalise and understand (Moussa, 2019a, 2019b; Romaniuk, 2023). But mounting empirical evidence, including that from the present study, highlights a potential lack of widespread managerial value for brand love.
First, brand love does not appear to be ubiquitous. In analysing how consumers define their relationships with brands, Schrueder and colleagues (2024) conclude ‘the typical relationship is not a love affair, but a relationship of trust’. That is, brand love does not appear to be an overly salient construct, given that only a minority of consumers report loving brands (around 10% in our study). Second, even when in love with them, consumers do not appear ‘married’ to brands, given the apparent lack of a link between brand love and behavioural loyalty, although it should be noted that for lower-penetration brands, small brand lover samples may constrain statistical power to detect such differences. Nonetheless, it has long been acknowledged that consumers may exhibit loyalty without feelings toward brands (Day, 1969), including attachment resembling ‘love’. More recently, empirical evidence demonstrated consumers can ‘love’ a brand without buying it (Robertson et al., 2022) or still buy other brands, even when in love with a brand (Rossiter & Bellman, 2012).
Taken together, brand love is a theoretically rich and intuitively appealing construct. Yet, for most brands, it may be a nicety rather than a necessity: brands are seldom loved, and are often bought without being loved. Indeed, a small number of consumers love some brands. We encourage future research to acknowledge that ‘lovers’ constitute a small subset of consumers. Additionally, we invite further empirical investigation into whether the minority of lovers offer disproportionate returns, for example, through long-term brand growth, as suggested by Zaranontello and colleagues (2016). But until then, the present research suggests brand love is limited in both its prevalence and managerial utility, as it may not meaningfully link to behaviour.
Discussion and Implications
While brand love has emerged as a key marketing concept (Batra et al., 2012; Palusuk et al., 2019), its prevalence across brands and categories remains relatively unexplored. Reinvigorating arguments from Rossiter and Bellman (2012), this study documents brand love’s prevalence and behavioural outcomes across four categories (three high-involvement and one low-involvement). The findings reveal around 40% of category buyers love at least one brand. However, love was less common at the brand level, with around 10% of category users on average saying they love a brand (across those tested). This varied from a low of 2%, to 24% for Nike, the most ‘loved’ brand.
This aligns with industry narratives which position Nike as a loved brand; Kevin Roberts (2004) identified it as a ‘Lovemark’, while Marc Gobe, author of Emotional Branding, described it as ‘…a good example of an emotional brand’ (Bouwman, 2008). Several of Nike’s advertising campaigns have also won awards for its emotional storytelling and creativity (Diaz, 2019, 2021; Shaw, 2025, p. 94363). Empirically, however, we found the SCR of Nike’s lovers was slightly higher than non-lovers (40% vs 33%, p < .01). This suggests brand lovers still buy from other brands rather than exhibiting sole loyalty. Marketers should hence consider that brand love, even for highly loved brands, may yield ‘typical’ behavioural loyalty outcomes overall as lovers constitute a small fraction of the buyer base. Indeed, Dawes (2009) found Nike does not have excess behavioural loyalty compared to other sportswear brands in the category. It is therefore important to consider the proportion of lovers; while they may display slightly higher loyalty, their behaviour remains polygamous, and most a brand’s sales still come from non-lovers.
Next, brand love is evidently not uniform across categories. Consistent with Voorn and Pruyn (2015), high-involvement product categories do not appear more loved than low-involvement ones. Instead, transformational and self-expressive high-involvement categories (cars, running shoes) show significantly higher levels of brand love than the informational one (banks), supporting prior findings that hedonic brands and categories are more loveable than utilitarian ones (Carroll & Ahuvia, 2006; Rossiter & Bellman, 2012; Voorn et al., 2015).
Furthermore, we found a higher incidence of category love toward beer (43%) than the 4% reported by Rossiter and Bellman (2012), despite suggestions selective (i.e., gendered) sampling could have inflated the incidence in Rossiter and Bellman’s work (Sharp, 2012). It is therefore possible love for beer has increased since 2012 (though it remains uncommon in absolute terms) or that Americans love beer brands more than Australians. Another explanation could be due to temporal changes, including the category itself. For instance, the share of craft beer – variants which are made in smaller production volumes and emphasise a greater array of unusual flavours (Brewers Association, 2025) – rose from 10% in 2012 to 25% in 2024 (Statista, 2025a). Perhaps increased variety has given consumers more options to love, and marketers more opportunities to build brand love. We encourage brand love researchers to disclose brand love levels in future studies so comparisons can be made across contexts.
Lastly, brand love was associated with higher purchase intentions in the car category, and behavioural loyalty (operationalised as SCR) for the running shoes category, but no link appeared for the banking and beer categories. Specifically, the average SCR of lovers versus non-lovers appeared around five percentage points higher for bank and shoe brand users. However, these results were significant only for running shoes (1/19 tests) and insignificant for banks. For beer, brand lovers exhibited lower SCR than non-lovers (30.9% vs 35.7%), although none of the 24 tests was significant after correction for multiple tests. In contrast to past findings suggesting that SCR was approximately 20 percentage points higher than the category average among lovers (Rossiter & Bellman, 2012), our results indicate brand love may not consistently coincide with behavioural loyalty. Given love correlates with higher intentions, but not behavioural loyalty, a possible explanation is that love is predictive of future growth rather than reflective of present behaviour, as suggested by Zarantonello and colleagues (2016).
Research linking love with loyalty typically relies on composite or attitudinal loyalty measures which include feelings or intentions toward buying (Bergkvist & Bech-Larsen, 2010; Bıçakcıoğlu et al., 2018; Carroll & Ahuvia, 2006; Drennan et al., 2015). Such measures are argued to predict change when behavioural measures are unreliable (i.e., for durable goods wherein there is limited purchase frequency), and distinguish intentional and spurious loyalty (Bennett & Rundle-Thiele, 2002; Dick & Basu, 1994). However, it is possible the affective and attitudinal dimensions of such measures confound with brand love (i.e., if you love a brand, you are likely to claim to buy it) and therefore overstate loyalty claims. We encourage more researchers to explore whether brand love influences observable differences in behaviour – a metric which is arguably more meaningful to managers given brands grow and decline largely in terms of sales (Farris et al., 2016).
Academic Contributions
This study makes three key contributions to the brand love literature. First, it explicitly measures the prevalence of brand love, helping establish empirical benchmarks. Although a widely studied concept, few studies quantify how prevalent brand love is (Table 1). This study addresses this knowledge void, finding 38% of category buyers love at least one brand at the category level. It also reports brand love incidence from a brand perspective, with an average brand love of 9.6% across the categories tested. Second, this study extends prior research on brand love prevalence from low-involvement categories (Rossiter & Bellman, 2012) to a broader range of high-involvement categories, beyond personal computers and fashion (Rossiter, 2012). By doing so, it contributes to the generalisability of existing studies suggesting high-involvement categories alone are not inherently more loved than low-involvement ones (Voorn et al., 2015). A third contribution is answering Rossiter and Bellman’s (2012) call to study brand love in ‘highly involved, positively motivated’ products (by examining cars and running shoes, labelled ‘transformational’ in this study). These categories show higher levels of brand love, supporting prior findings that hedonic brands and categories are more loveable than utilitarian ones (Carroll & Ahuvia, 2006; Rossiter & Bellman, 2012; Voorn et al., 2015). Hence, this study also indirectly contributes to marketing science by representing a differentiated replication and extension of Rossiter and Bellman’s (2012) work.
Industry Implications
Practically, this research sets realistic benchmarks, helping firms evaluate whether brand love is obtainable at scale. The findings show brand love is uncommon overall, with brands, on average, having fewer than 10% of consumers expressing love for them. The findings also clarify that brand love prevalence is category-dependent and cannot be explained by high product involvement alone. Rather, transformational categories appear to be more loved regardless of involvement. This equips brand managers with a better understanding of which categories emotional branding strategies may be more suited to. Bank managers seeking to build brand love, for example, could evaluate their efforts against the low incidence found in this study (3.5% on average). An alternative managerial view might be banks do not necessarily require brand love given most brands in the category compete without it. Turning to cars and running shoes, these categories are slightly more loved (10.6% and 15% across brand tested, respectively). Hence, such categories where there could be more ‘transformational’ brands may be more fertile ground for brand love building efforts. Lastly, we show that while brand love is associated with higher purchase intentions, such intentions may not consistently translate into behavioural loyalty. This provides practitioners with a better understanding of the behavioural outcomes of brand love.
Limitations and Future Research
As with any research, this study has limitations which present future avenues of inquiry. First, it is one of the few brand love studies to explicitly measure the prevalence of brand love, across categories at the brand level. While high-involvement categories are researched here, these are limited to running shoes, banks, cars, and beer. The number of categories limits some comparisons. For example, we only investigated one low-involvement category (beer) and one utilitarian, high-involvement category (banks). We also report a higher incidence of brand love in the beer category in the USA compared to Rossiter and Bellman (2012) in Australia. It would therefore be interesting to investigate whether love’s prevalence has changed for the other categories (i.e., instant coffee, gasoline, and laundry detergent) studied by Rossiter and Bellman (2012), or if there is a difference between these two countries (e.g., higher love across all categories in the USA). Similarly, while high-involvement categories are researched here, there is scope for extension to other categories and contexts. Establishing where brand love is most and least common will help scholars and practitioners gauge conditions under which the concept may be most significant.
A further limitation is the statistical power of brand-level comparisons, particularly among lower-penetration brands. At the brand level, the present study found few statistically significant differences in behavioural loyalty (SCR) among lovers and non-lovers. However, this lack of significant differences could be due to small sample sizes within the brand lover sub-sample. In the shoe category, for instance, significant differences were detected for Nike, which had 61% penetration (n = 381 respondents), 24% of whom were lovers (n = 91). By contrast, lower-penetration brands such as Converse and Puma had around 20% penetration (∼125 respondents) and 14% lovers (∼18 respondents). As such, the lack of significant findings could be explained by a small sample of ‘lovers’ at the brand level and should be interpreted cautiously.
Notably, a small sample of lovers may be an inherent feature of brand love research, given a minority of consumers appear to love brands (Ahuvia et al., 2020; Rossiter & Bellman, 2012). This presents a broader challenge for researchers and practitioners seeking to detect differences between lovers and non-lovers at the brand level. Future research could address this challenge by adopting a within-subjects approach, comparing each consumer’s SCR toward loved brands against non-loved brands within the same category. This could increase the effective lover subsample by leveraging consumers who love multiple brands.
Second, the present research is geographically limited to the USA, where much brand love research has been conducted (Ahuvia, 2005; Batra et al., 2012; Carroll & Ahuvia, 2006). The United States is one of the world’s largest advertising markets; however, some scholars have called for research in other countries given love and consumption are culturally relative activities (Moussa, 2019b). Albert and colleagues, for example, found French consumers speak about ‘love’ toward brands selectively, opting for declarations of affect such as ‘adore’ or ‘like’, compared with American consumers who appeared more willing to explicitly ‘love’ brands (Albert et al., 2008). Similarly, Sajtos et al. (2021) observed that brand love manifests differently across cultures—including France, the USA, Australia, and China—suggesting its commonality may vary depending on cultural norms.
Future research might therefore consider whether the prevalence of brand love differs between emerging and established markets or collectivist vs individualistic cultures (i.e., where the needs and goals of the social groups or individual are prioritised, respectively) (Hofstede, 1980). For instance, Pontinha and Coelho do Vale (2020) found, compared to Portuguese consumers, American consumers were more affectionate toward brands and willing to use them as self-expressive tools. Through a similar lens, future research might investigate whether consumers from collectivist cultures love brands which are included in the collective in-group.
Third, this study is cross-sectional, which increases the difficulty in diagnosing the ‘predictability’ or causal direction between concepts (Ajzen, 2002). For example, the direction of the relationship between brand love and purchase intentions can be questioned in the present study. Existing longitudinal brand love research is limited, with scholars investigating consumers’ individual love trajectories (Langner et al., 2016) and the firm-level financial benefits of brand love (Nguyen & Feng, 2021). Potential research could consider whether the prevalence of brand love changes over time, especially during times of corporate crises or controversies.
Lastly, brand hate is emerging as a relational concept in the literature (Fetscherin, 2019; Tolunay & Veloutsou, 2025; Zarantonello, Romani, et al., 2016). Future research could document the prevalence of brand hate to see whether this is a common phenomenon experienced by consumers, warranting firm attention. Existing brand image research suggests negative beliefs about brands are less common than positive ones (Thelen & Woodside, 1997; Winchester et al., 2008). In a similar light, research might see whether brand hate is less common than brand love.
Footnotes
Funding
The authors disclosed receipt of the following financial support for the research, authorship, and/or publication of this article: This research was supported by University of South Australia Enterprise Research Scholarship (ERS) [Application number: 110255525 (240403)]. This sponsorship did not have a role in study design, the collection, analysis or interpretation of data, writing of the report, or the decision to submit the article for publication.
Declaration of Conflicting Interests
The authors declared no potential conflicts of interest with respect to the research, authorship, and/or publication of this article.
Appendix
Sample Demographics, Overall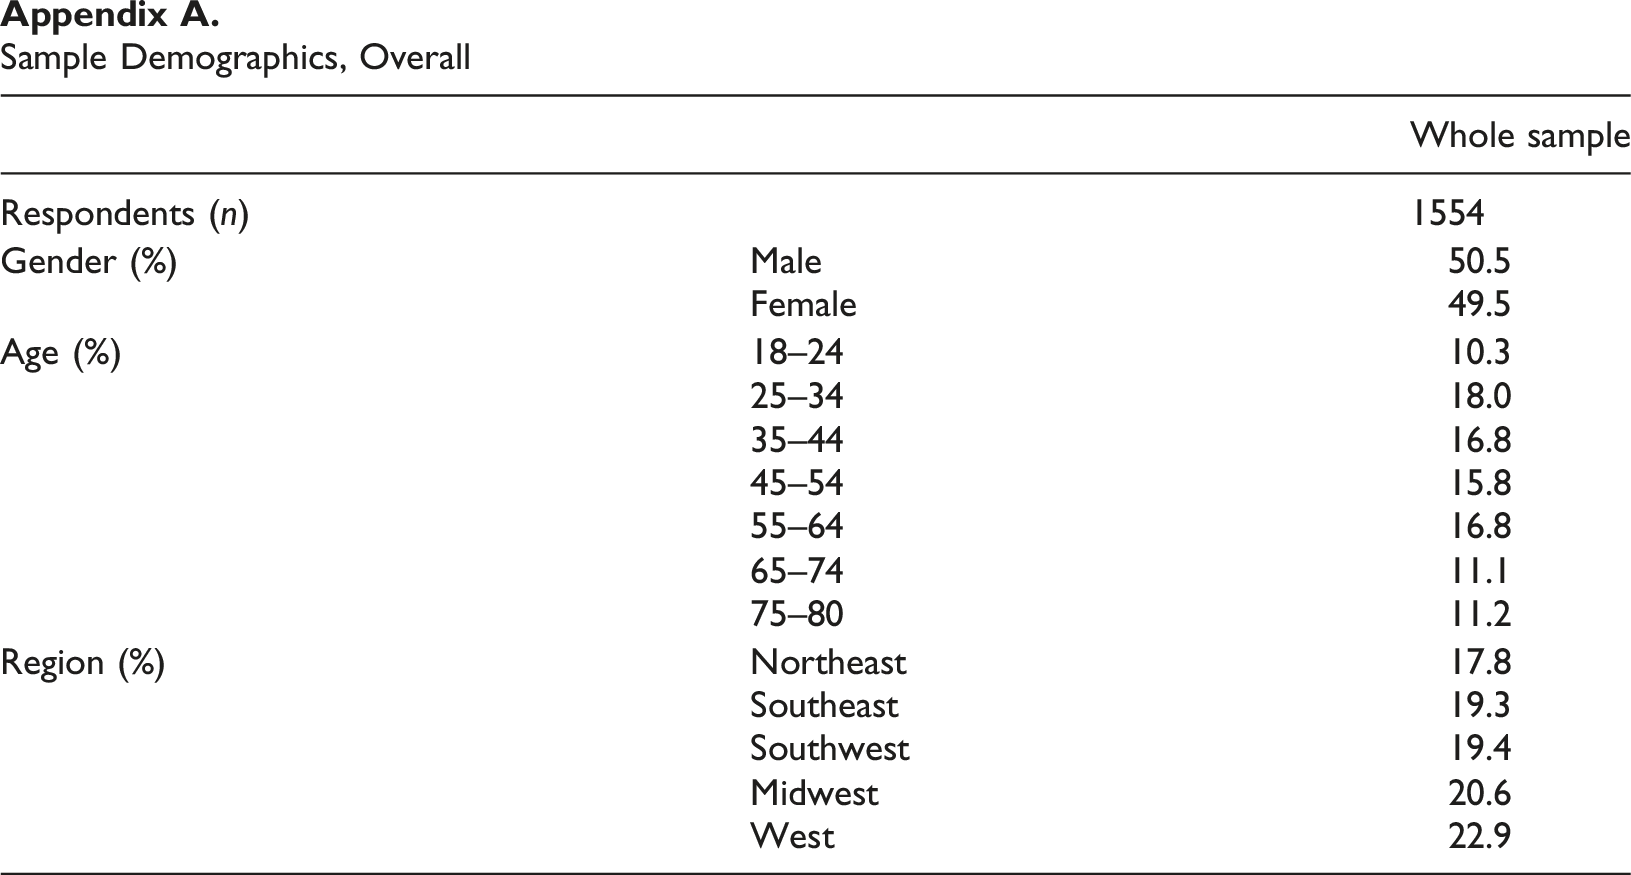
Whole sample
Respondents (n)
1554
Gender (%)
Male
50.5
Female
49.5
Age (%)
18–24
10.3
25–34
18.0
35–44
16.8
45–54
15.8
55–64
16.8
65–74
11.1
75–80
11.2
Region (%)
Northeast
17.8
Southeast
19.3
Southwest
19.4
Midwest
20.6
West
22.9
Demographics Across Categories Survey completion time, minutes: mean = 12.7, median = 10.9, SD = 7.5. aNote respondents age 21+ only.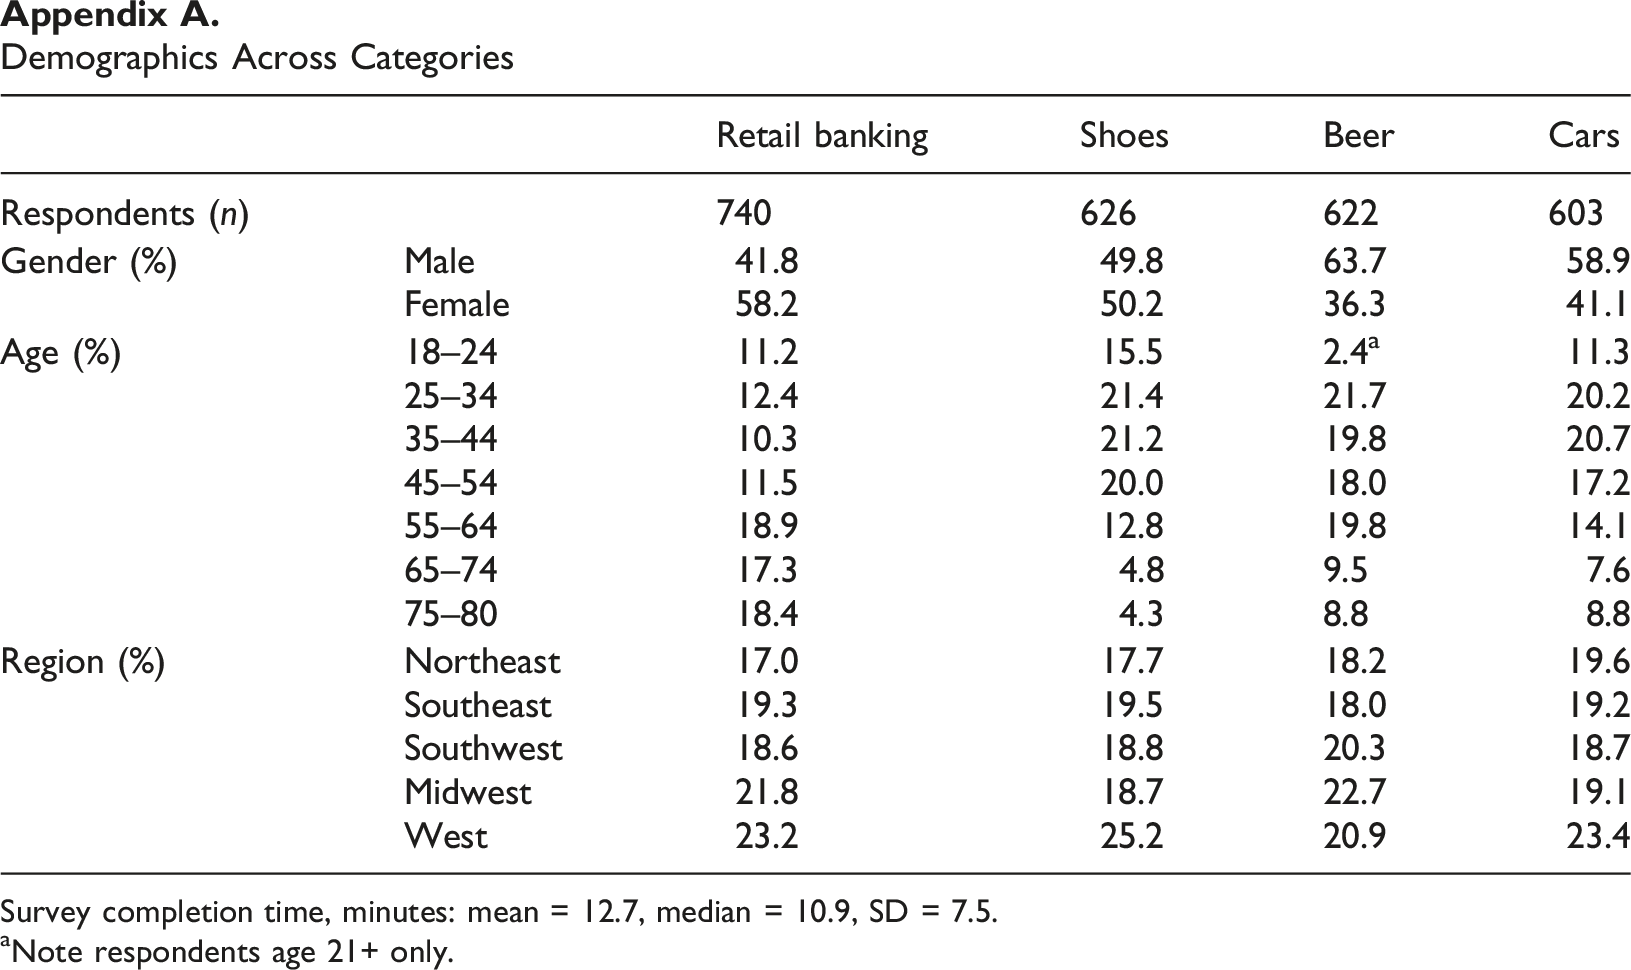
Retail banking
Shoes
Beer
Cars
Respondents (n)
740
626
622
603
Gender (%)
Male
41.8
49.8
63.7
58.9
Female
58.2
50.2
36.3
41.1
Age (%)
18–24
11.2
15.5
2.4
a
11.3
25–34
12.4
21.4
21.7
20.2
35–44
10.3
21.2
19.8
20.7
45–54
11.5
20.0
18.0
17.2
55–64
18.9
12.8
19.8
14.1
65–74
17.3
4.8
9.5
7.6
75–80
18.4
4.3
8.8
8.8
Region (%)
Northeast
17.0
17.7
18.2
19.6
Southeast
19.3
19.5
18.0
19.2
Southwest
18.6
18.8
20.3
18.7
Midwest
21.8
18.7
22.7
19.1
West
23.2
25.2
20.9
23.4