
Abstract
The thermoacoustic effect provides a means to convert acoustic energy to heat and vice versa without the need for moving parts. This makes thermoacoustic devices of interest for multifunctional applications in harsh or remote service environments. Embedding thermoacoustic stacks within the framework of acoustic liners could provide opportunities to simultaneously optimize both acoustic absorption and thermal output as well as to integrate energy harvesting and sensing and monitoring functionalities. In this study, the influence of sound pressure level and frequency as well as stack length and position on the performance of a thermoacoustic liner is investigated using normal incidence impedance tube tests and DeltaEC simulations. Using Rott’s approximation, the stack’s pore width and wall thickness are optimized for additively manufactured thermoacoustic liner test articles. A peak steady-state temperature gradient of 9.5°C is obtained at 790 Hz for 140 dB tonal dwells. It is found that the temperature gradient correlates directly with the acoustic power available at the leading stack-face, which is highest when the stack is near the center of the resonator. In contrast, acoustic absorption diminishes when the stack is nearer to the closed-end of the resonator. At higher excitation pressure levels, the contribution of viscous heating to the deviation in the thermoacoustic gradient becomes significant. Further, the relationship between the acoustic absorption and the thermoacoustic temperature gradient was examined. In application scenarios requiring multifunctional optimization, a tradeoff may be required in terms of the absorption in order to maximize the temperature gradient. With current additive and hybrid fabrication processes and materials reaching commercial maturity, opportunities exist to realize thermoacoustic liners with enriched functionalities.
Keywords
Introduction
Acoustic liners are widely used for noise control in various applications, such as in aircraft jet engines, civil or transportation infrastructures, and turbomachinery.1–5 These liners are usually constructed from lightweight and porous materials such as perforate over honeycomb or foam structures, which reduce sound energy through various absorptive mechanisms.6,7 Despite their widespread use, conventional acoustic liners have their limitations, including narrow and higher frequency bandwidths of effectiveness, lack of adaptivity to varying source characteristics, 8 and unexploited potential for integration in multifunctional applications such as energy harvesting and sensing and monitoring. With new materials and manufacturing processes being adopted for the next generation of engineered structures, noise source characteristics evolving due to technological developments and regulations becoming more stringent, it is an opportune time to explore new liner concepts9–12 that could deliver improved solutions. The incorporation of thermoacoustic phenomena opens new avenues for acoustic liner advancements. In this study, a thermoacoustic liner is studied, examining the relationship between acoustic absorption and thermoacoustic performance, exploring its potential for multifunctional applications beyond the scope of conventional liner.
Recent innovations in acoustic liners include a variety of novel designs and materials. Liu et al. 13 devised a piezoelectric panel, which could be used to control the size and shape of the resonant chambers in a liner so that the absorption bandwidth could be actively controlled. Rego et al. 14 investigated the use of curved cavity Helmholtz resonators for noise reduction for a flat plate and a subsonic jet arrangement. Simulations showed a noise reduction of up to 7 dB in a broader frequency range in the vicinity of resonance. Guo et al. 15 investigated the noise attenuation properties of an acoustic liner consisting of Helmholtz resonators with extended necks and found them to be a promising solution for wide-band noise attenuation in both static and flow conditions while retaining a compact form-factor. Lam et al. 16 demonstrated numerically that broadband noise reduction can be achieved using a liner with an elastic panel with a cavity beneath under low Mach number grazing flow.
Fan et al. 17 examined the structural-acoustic interaction of an elastic panel liner backed by a cavity under subsonic ducted boundary layer flow and reported to be more effective when the noise source radiates against the flow. Xu et al. 18 examined the importance of bias flow and its temperature in improving absorption and considered the modal effects on thermoacoustic instabilities in the design of acoustic liners. Neubauer et al. 19 recently explored a novel liner concept utilizing flexible Helmholtz and plate resonators to demonstrate enhanced noise mitigation. Simultaneously, the need to reduce broadband fan noise in high bypass ratio turbofan engines has attracted interest with advancement in fan design and manufacturing techniques.20,21 As mission requirements become more multifarious and stringent, acoustic liners of the future could be expected to be more actively or passively adaptive, multifunctional, and certainly better performing.
In this context, it is of interest to explore the incorporation of multi-physical sub-structures within the framework of the acoustic liner. Inspired by metamaterials,
22
thermoacoustic liners that have a porous stack embedded in the liner cavity are a promising configuration. In a true multifunctional environment as in the case of core liners in turbofan engines, a confluence of innovative design approaches, interactive multiphysical mechanisms, as well as novel implementations of structural materials can lead to a synergistic enrichment in performance. Given the availability of a steep thermal gradient across the core walls of the engine, embedding a thermoacoustic functionality into the liner’s resonators provides a natural means to engineer additional tunability for performance enhancement in core liners. The thermoacoustic phenomenon is manifested due to an instability caused by pressure waves propagating in an acoustic waveguide inducing oscillations in a porous stack, the ends of which manifest a thermal gradient, thereby creating fluctuations in the rate of heat transfer. This in turn generates further pressure oscillations, leading to an instability that can be harnessed without the need for any moving parts. Thus, in comparison to conventional perforate-over-honeycomb acoustic liners, such thermoacoustic liners that combine multiple functionalities can offer many benefits such as adaptive control, transduction and energy harvesting in many applications especially in modern turbofan jet engines. Figure 1 illustrates a comparison between a conventional acoustic liner and a thermoacoustic liner for a potential application scenario in jet engines. Conventional perforate-over-honeycomb, double-degree-of-freedom liner
44
and the thermoacoustic liner for a potential application scenario in jet engines.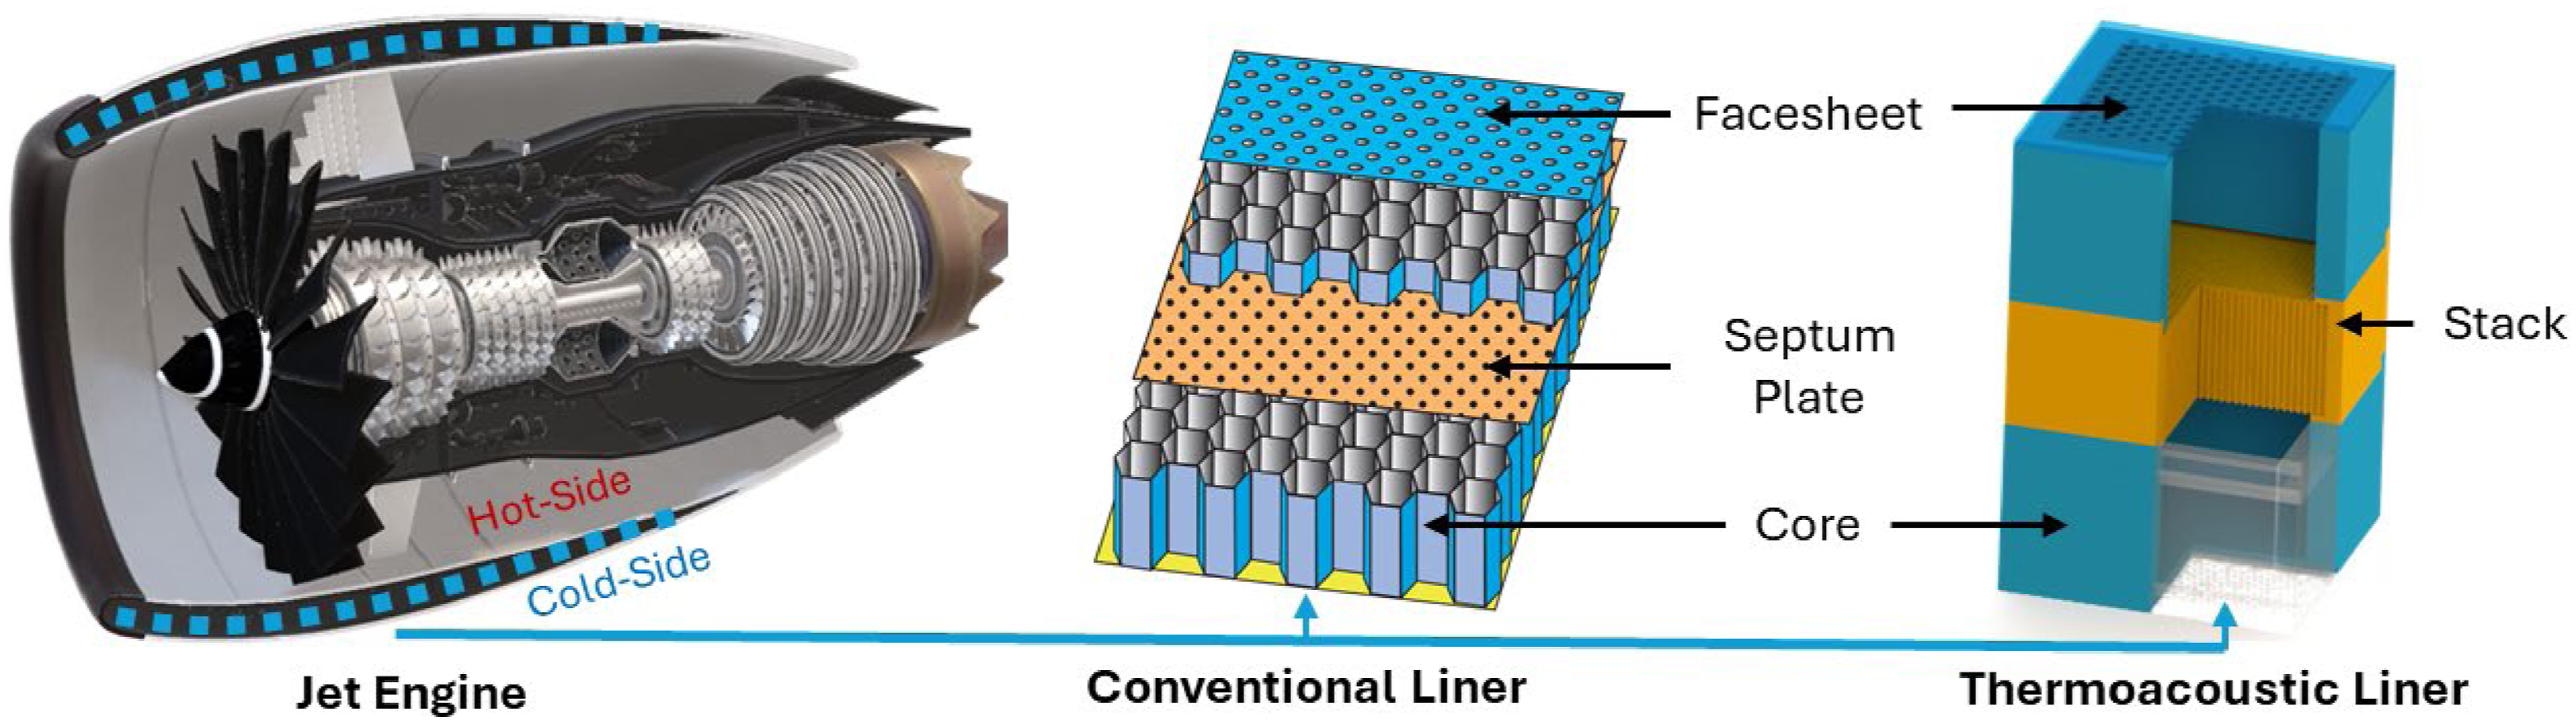
In the past, the development of thermoacoustic devices has been facilitated by advancements in materials, modeling and manufacturing techniques.23–26 Thermoacoustic devices have potential applications in various fields,27–31 including refrigeration, 32 power generation, 33 and noise control 34 and mitigation. 22 Recent research has enhanced their performance and efficiency. Watanabe et al. 35 explored the rotational dynamics of a looped-tube thermoacoustic engine with a flywheel, improving engine stability and efficiency. Huang et al. 36 reviewed thermoacoustic engines with unconventional working substances, highlighting the importance of selecting the right working fluids to maximize efficiency. Chen et al. 37 conducted numerical simulations on standing-wave thermoacoustic engines, showing that pin-array stacks outperform circular-pore stacks in power generation and thermal efficiency. Recent advancements in thermoacoustic systems have shown promise in utilizing waste heat for refrigeration and cooling. Ding et al. 38 explored a thermoacoustic refrigeration system that uses waste heat from industrial buildings to regulate indoor temperatures. The system employs a traveling-standing wave acoustic field and demonstrated a cooling temperature as low as −12°C with a maximum cooling capacity of 0.95 kW, highlighting its potential to enhance energy utilization in industrial settings. Xiao et al. 39 reported on a highly efficient heat-driven thermoacoustic refrigerator (HDTR) using a bypass configuration that synergizes acoustic and energy-flow fields.
In this study, a prototypical thermoacoustic liner test article was designed and fabricated using additive manufacturing techniques. Experiments conducted in the normal incidence impedance tube at NASA Langley and correlated with DeltaEC simulations were used to characterize the liner’s acoustic and thermoacoustic performance. A key aspect studied was the relationship between acoustic absorption and the thermoacoustic temperature gradient. Understanding this relationship is essential for optimizing thermoacoustic liner designs and facilitates the development of a new class of multifunctional acoustic liners.
Thermoacoustic liner
Test articles
The test articles used in this study were designed to be compatible with the normal incidence impedance tube at NASA Langley.
40
They consist of two subcomponents: the modular resonator sections and the stack. The CAD model and photographs of the test article are shown in Figure 2. Modular resonator sections were 3D-printed using polylactic acid (PLA) using the fused deposition modeling (FDM) method. On the other hand, stack blocks were 3D-printed using Formlabs® standard resin and the stereolithography (SLA) method. Both the stack and resonator sections have a nominal cross-sectional dimension of 0.06 m × 0.06 m. The resonator sections have different lengths to build up the total length of the resonator. The stack pore geometry is an important consideration for optimal thermoacoustic performance. A square pore geometry is chosen for simplicity and ease of manufacturing, although there could be other geometries that may improve performance. Within the realm of thermoacoustic linearity, the recommended pore width is 2–4 times the thermal (or viscous) penetration depth for the choice of working fluid and ambient conditions.
41
Using this guideline, a pore width of 1.0 × 10⁻³ m is determined for air as the working fluid under room temperature and pressure in the frequency range of interest (<∼1000 Hz). It is also necessary to consider how the pore wall thickness affects areal porosity, which is the ratio of the total pore area to the overall area of the stack. As pore wall thickness increases, areal porosity decreases, given a constant pore size. (a) CAD drawing and (b) photographs of the test article.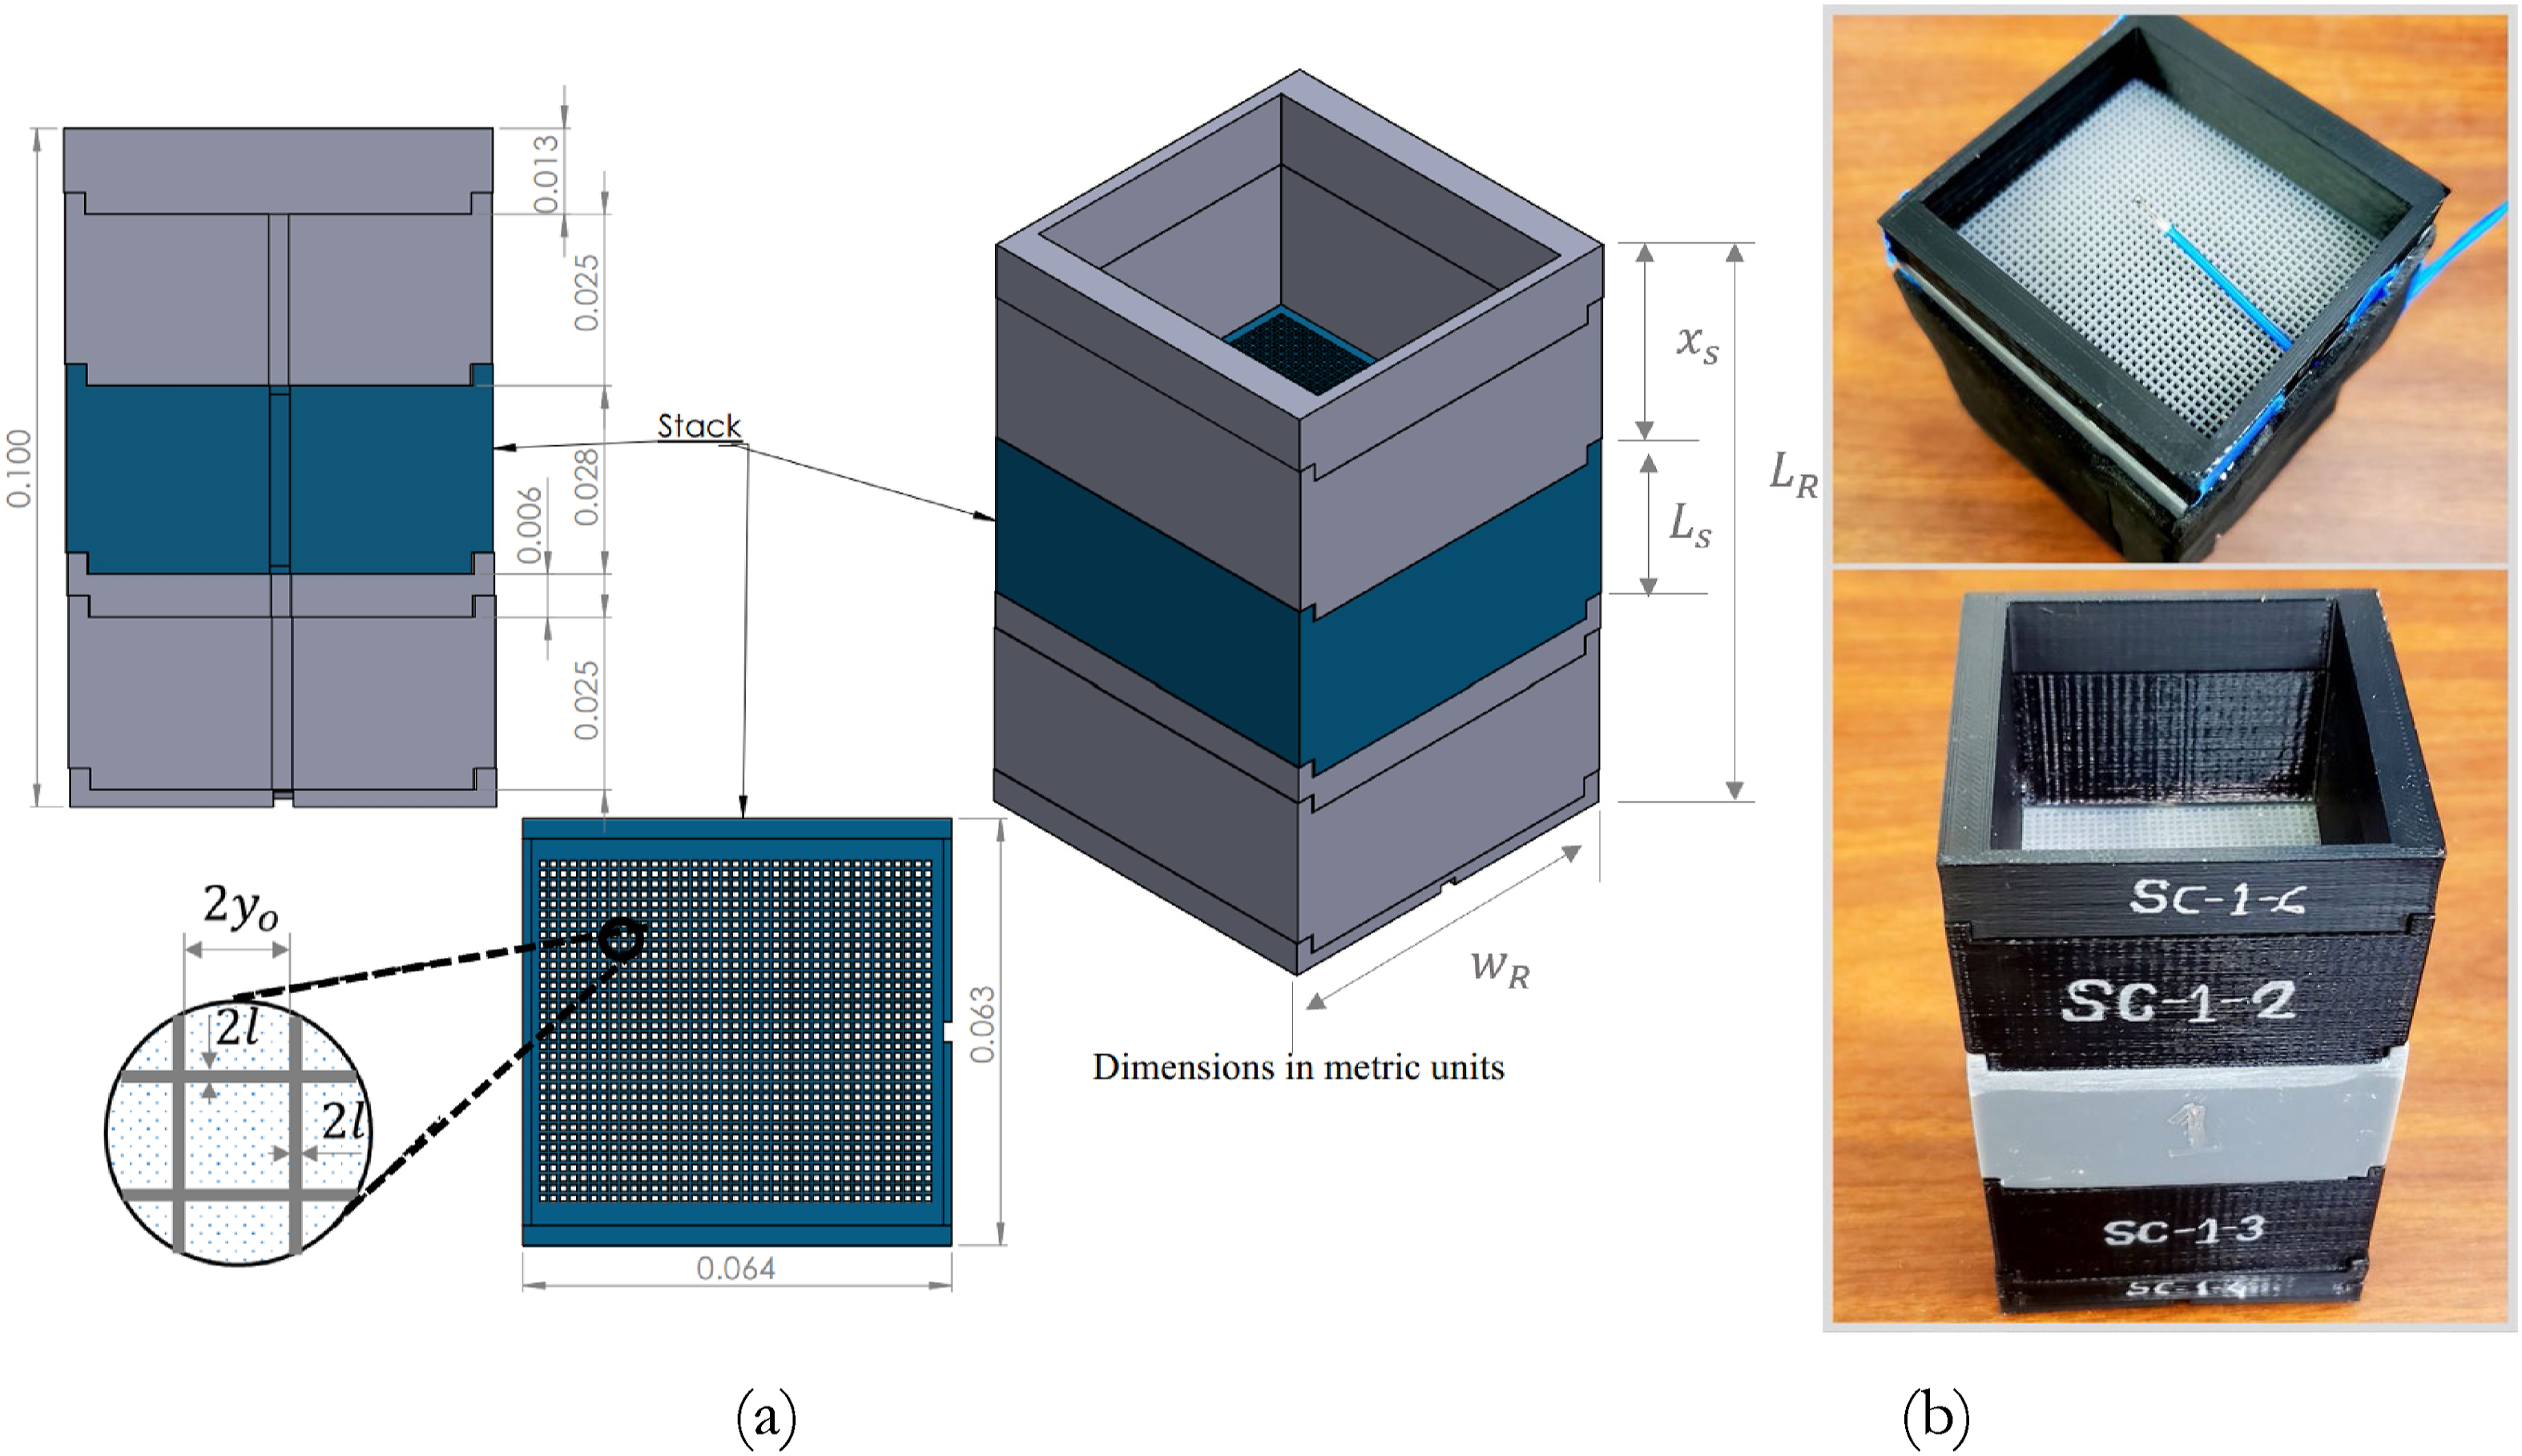
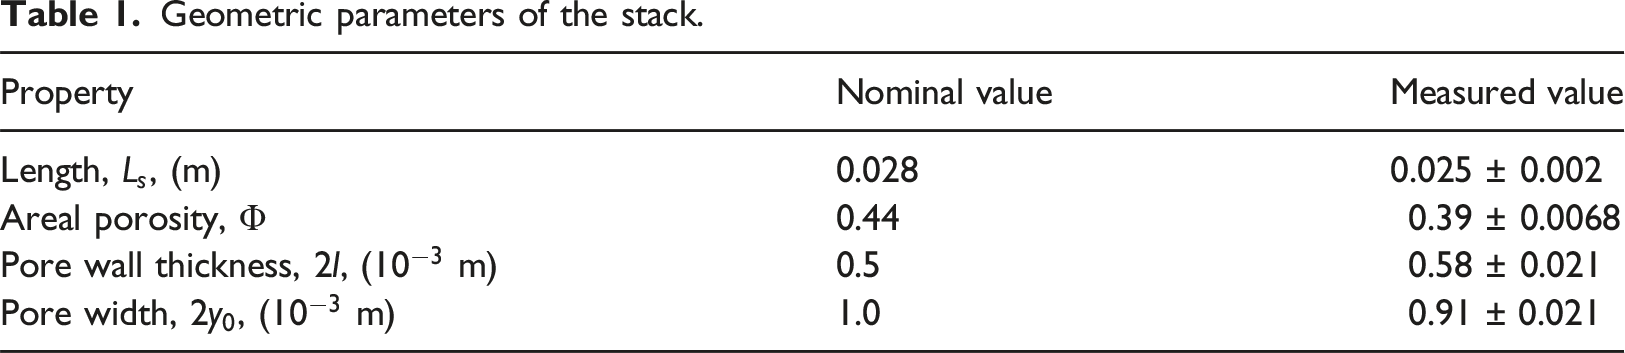
Geometric parameters of the stack.
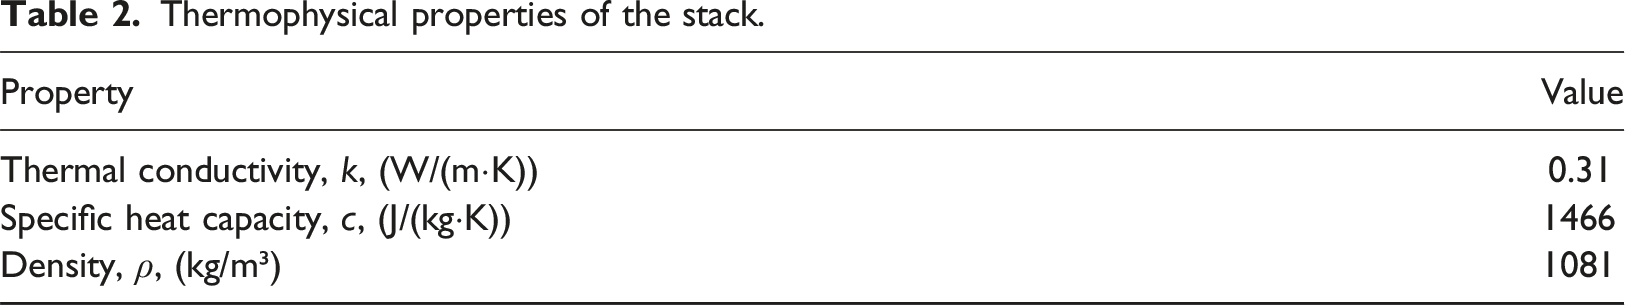
Thermophysical properties of the stack.
Experiments
All experiments were conducted in the NASA Langley normal incidence tube (NIT) shown in Figure 3, which has a 0.051 m × 0.051 m cross-section waveguide. The tube is equipped with six 120 W compression drivers that generate a plane-wave sound field for frequencies up to about 3300 Hz. This sound field impinges on the surface of the liner and combines with reflections from the liner to create a standing wave pattern.
40
Acoustic pressures at two prescribed locations 0.064 m and 0.095 m from the liner-waveguide interface were measured using two microphones mounted in a rotating plug. The two-microphone method (ASTM E1050)
42
is used to determine the frequency dependence of the no-flow acoustic impedance of the liner. The liner test article is mounted on a movable platen at the open-end of the waveguide. Two K-type thermocouples are provided, one each on the leading and trailing stack faces within the resonator. Further, a third thermocouple is placed on the frame of the rig outside the test article to measure the ambient temperature. The temperature and acoustic data were collected using a time synchronized NI DAQ and LabView interface. Normal Incidence Tube (NIT) at NASA Langley with schematic details of the test article.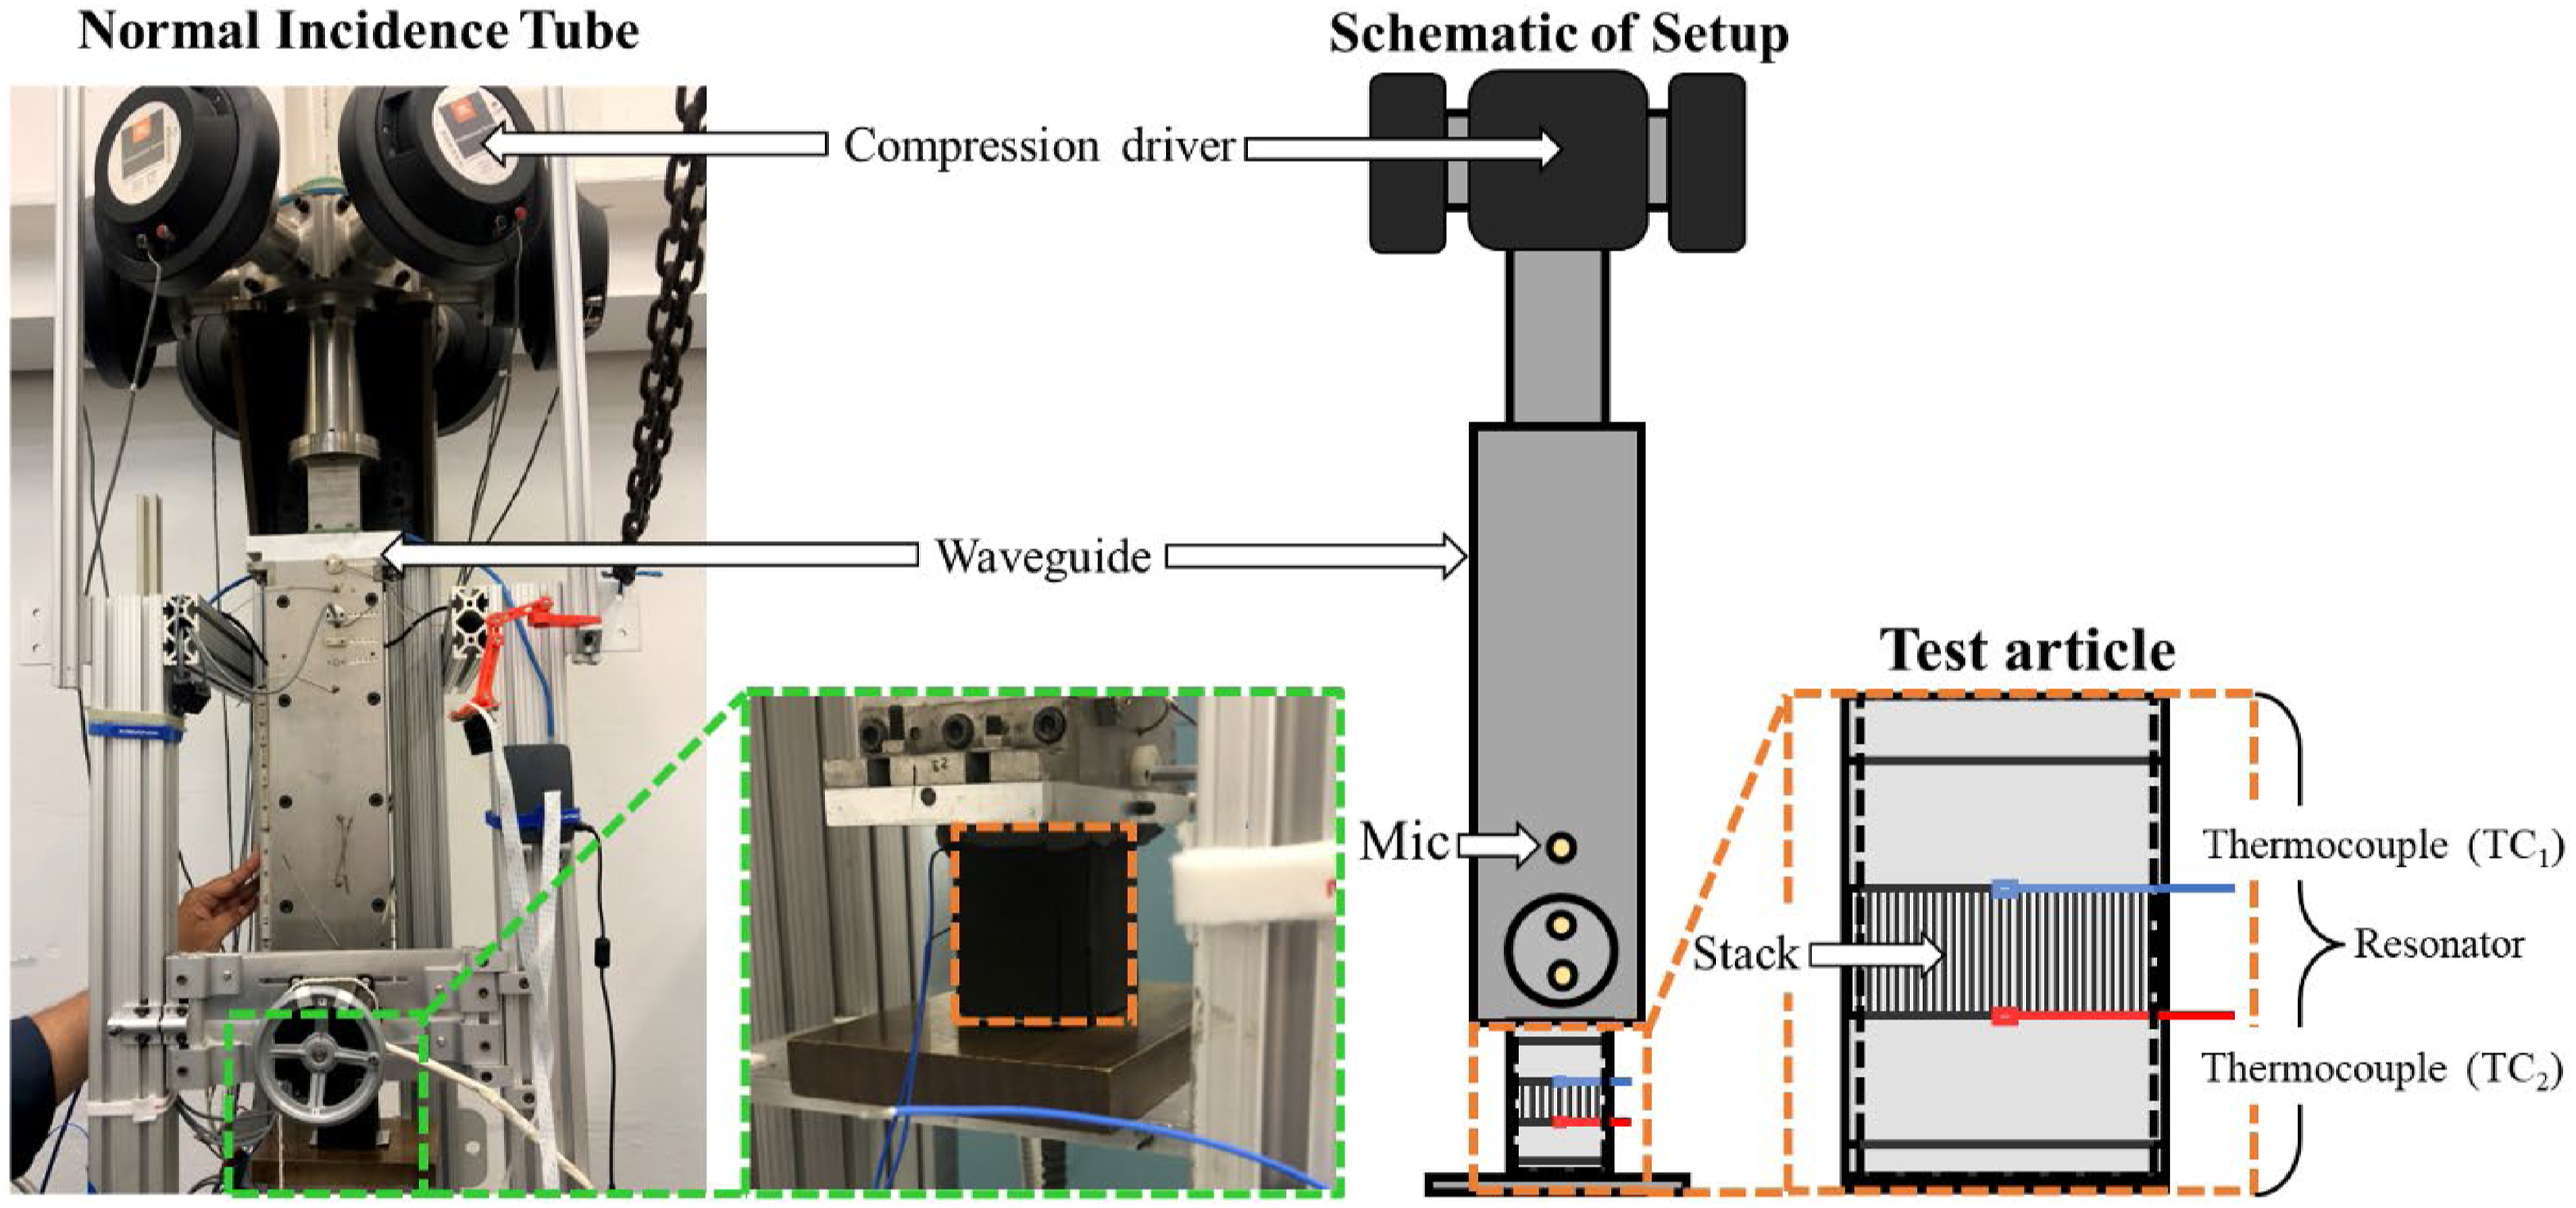
The frequency range of interest spans from 100 to 1400 Hz. Unless otherwise specified, the excitation sound pressure level was set at 140 dB OASPL. Tonal dwells were also conducted at SPLs between 130 and 150 dB. However, variation of stack position, stack length, and resonator length was considered. For the purposes of extracting the thermoacoustic temperature gradient across the stack, the steady-state criterion was defined as less than 0.1°C change in temperature gradient over 1 minute. The repeatability of the tests was ascertained using multiple trials for key cases demonstrating error bounds less than +/−5%. The baseline parameters for the experiments, including stack position at 0.04 m from the resonator’s top surface, stack length of 0.025 m, resonator length of 0.097 m, resonance frequency of 790 Hz, and driving pressure of 140 dB, were consistently applied across various test setups.
Modeling
The thermoacoustic liner consists of two types of sections: the duct and the stack. The modeling approach for each of these sections is different based on the thermal characteristics they exhibit. While the duct section does not exhibit a temperature gradient, the stack section does, and this distinction dictates the use of different mathematical models for accurate representation of their behaviors. For the duct section where there is no temperature gradient, the wave equation, which is expressed as the second-order Helmholtz differential equation for the complex pressure amplitude 
This second-order equation can be reduced to two coupled first-order equations in terms of the pressure, 
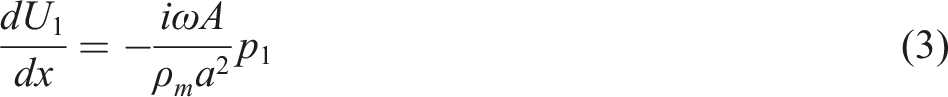
In this form, the equations can be numerically integrated simultaneously in the axial direction,
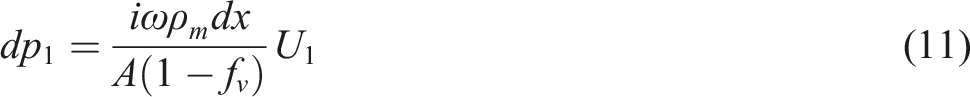
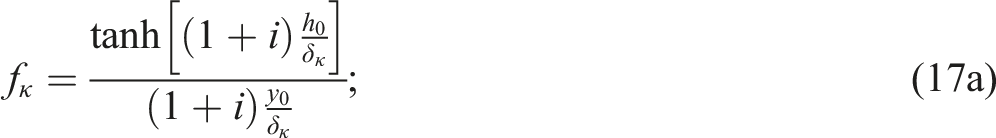
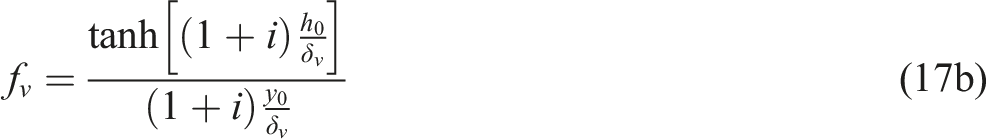
In the stack section, the presence of a temperature gradient due to thermoacoustic effects is modeled using Rott’s linear approximation, which utilizes boundary layer approximations, neglects any transverse gradients for acoustic pressure, average temperature and viscosity, as well as heat conduction in the axial direction in the acoustic medium and frictional effects due to axial gradients. With these assumptions, continuity, energy, and momentum considerations are used to derive the axial temperature gradient.
The steady-state sinusoidal oscillations of pressure, temperature, and density can be expressed using the following complex notation
43
:


The continuity equation for a microscopic control volume in the stack can be expressed as
Noting that the existence of a non-zero axial spatial gradient for the mean temperature, (
The solution to the momentum equation can be written as:

Now, using a similar process as before, the solution of the energy equation can be written as:

Substituting equations (13) and (14) in (8) yields:
Combining equations (11) and (15), Rott’s thermoacoustic equation can be derived as:
Finally, introducing the correction factor for finite solid capacity 
In addition to the aforementioned Rott’s thermoacoustic equation (equation (16a), (16b)), it is of interest to predict the acoustic and total powers in the thermoacoustic system. In the absence of any thermal inputs to the system, the power carried in the axial direction by second-order thermoacoustic effects can be represented by the acoustic power, 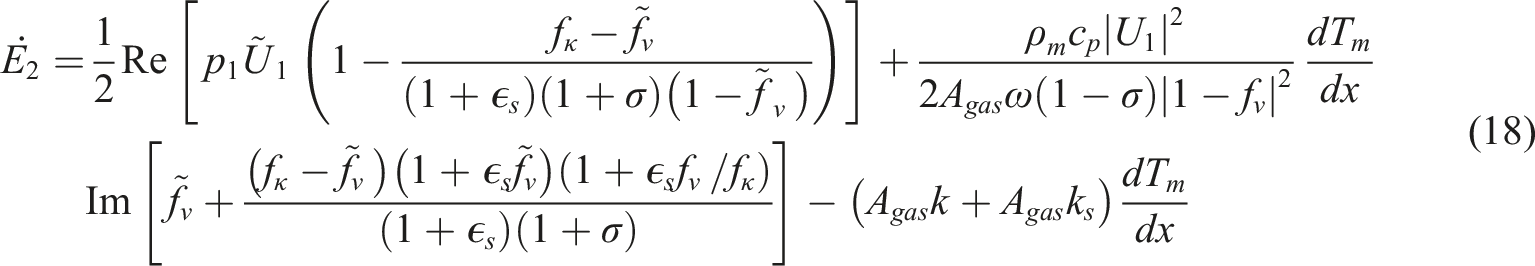
The thermoacoustic liner configurations are simulated using DeltaEC (Design Environment for Low-amplitude Thermoacoustic Energy Conversion).
45
This tool uses continuity of oscillating pressure, oscillating volumetric velocity, and mean temperature to match the solutions of adjacent geometric segments. Within each segment, it integrates the one-dimensional wave equation appropriate to the geometry of that segment. For instance, it uses the lossy Webster horn equation
46
in conical segments, and Rott’s
47
wave equation (as extended by Swift
44
) in thermoacoustic stacks, to determine pressure and volumetric velocity. In isothermal segments such as ducts, the wave equation is sufficient to determine the solution, however in thermoacoustic stacks, Rott’s enthalpy equation45,47 must also be used to compute the mean temperature. To solve the governing equations, at least four boundary conditions are required, such as the magnitude and phase of acoustic pressure (
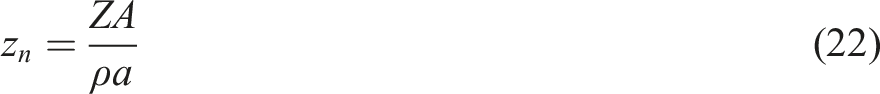
Further, extracting the acoustic parameters from DeltaEC, one can compute the absorption coefficient using the following relationships. The complex pressure and volume flow rate in a duct can be represented in terms of the real part (

The corresponding acoustic power can be expressed as the product of the magnitudes of the pressure, volume flow rate, and the cosine of the phase angle between them:

Substituting the expression for 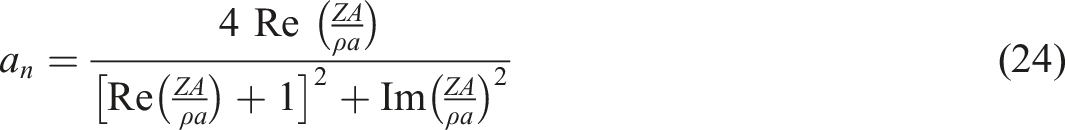
Further, expressed in terms of the pressure, volume flow rate, and acoustic power, the absorption coefficient becomes: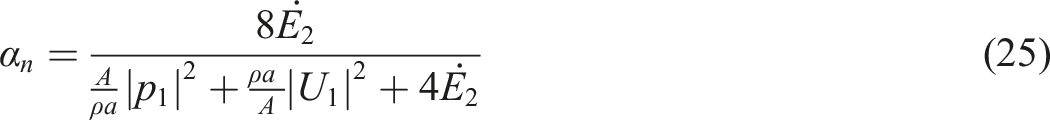
Discussion of results
Frequency response
The response of the thermoacoustic liner in the frequency range of interest is identified from sine sweep tests as shown in Figure 4. Each sweep covered a 200 Hz window with an overlap of 25 Hz with the previous sweep window and a sweep time of 400 seconds. The intention of these measurements using sine sweeps was to conduct a diagnostic check to identify frequency ranges where the slope of the temperature gradient is high and has a reversal, indicating thermoacoustic resonance. At low frequencies, the absorption increases, tending towards the overall tube resonance of the apparatus which is below a 100 Hz. The absorption coefficient ranges from 0.51 to 0.66 in the frequency range of 400 – 1000 Hz. The educed normalized resistance and reactance, and the absorption coefficient are plotted. The absolute values of the normalized resistance and reactance values decrease with excitation frequency in this range. Inspecting the temperature measurements that accompany the absorption measurements under sine sweep, the slope of the temperature gradient with respect to the frequency is found to peak significantly in the vicinity of 790 Hz, indicating thermoacoustic resonance corresponding to the quarter wavelength response for the built height of the test article. Consequently, the focus of further interrogation using tonal dwells to steady state was restricted to the frequency range that encompasses this resonance frequency. It must be noted that under sine sweep excitation, absorption reaches steady-state very quickly, although the temperature difference or gradient takes much longer to get established. These results suggest that notwithstanding the narrowband spike in thermoacoustic performance around 800 Hz, sustained acoustic absorption is indicated under sine sweep excitation in a broadband frequency range that encompasses the frequency of peak thermoacoustic performance. Frequency response of the thermoacoustic liner from sine sweep excitation: (a) normalized resistance and reactance, (b) absorption coefficient, (c) temperature gradient and (d) slope of the temperature gradient curve.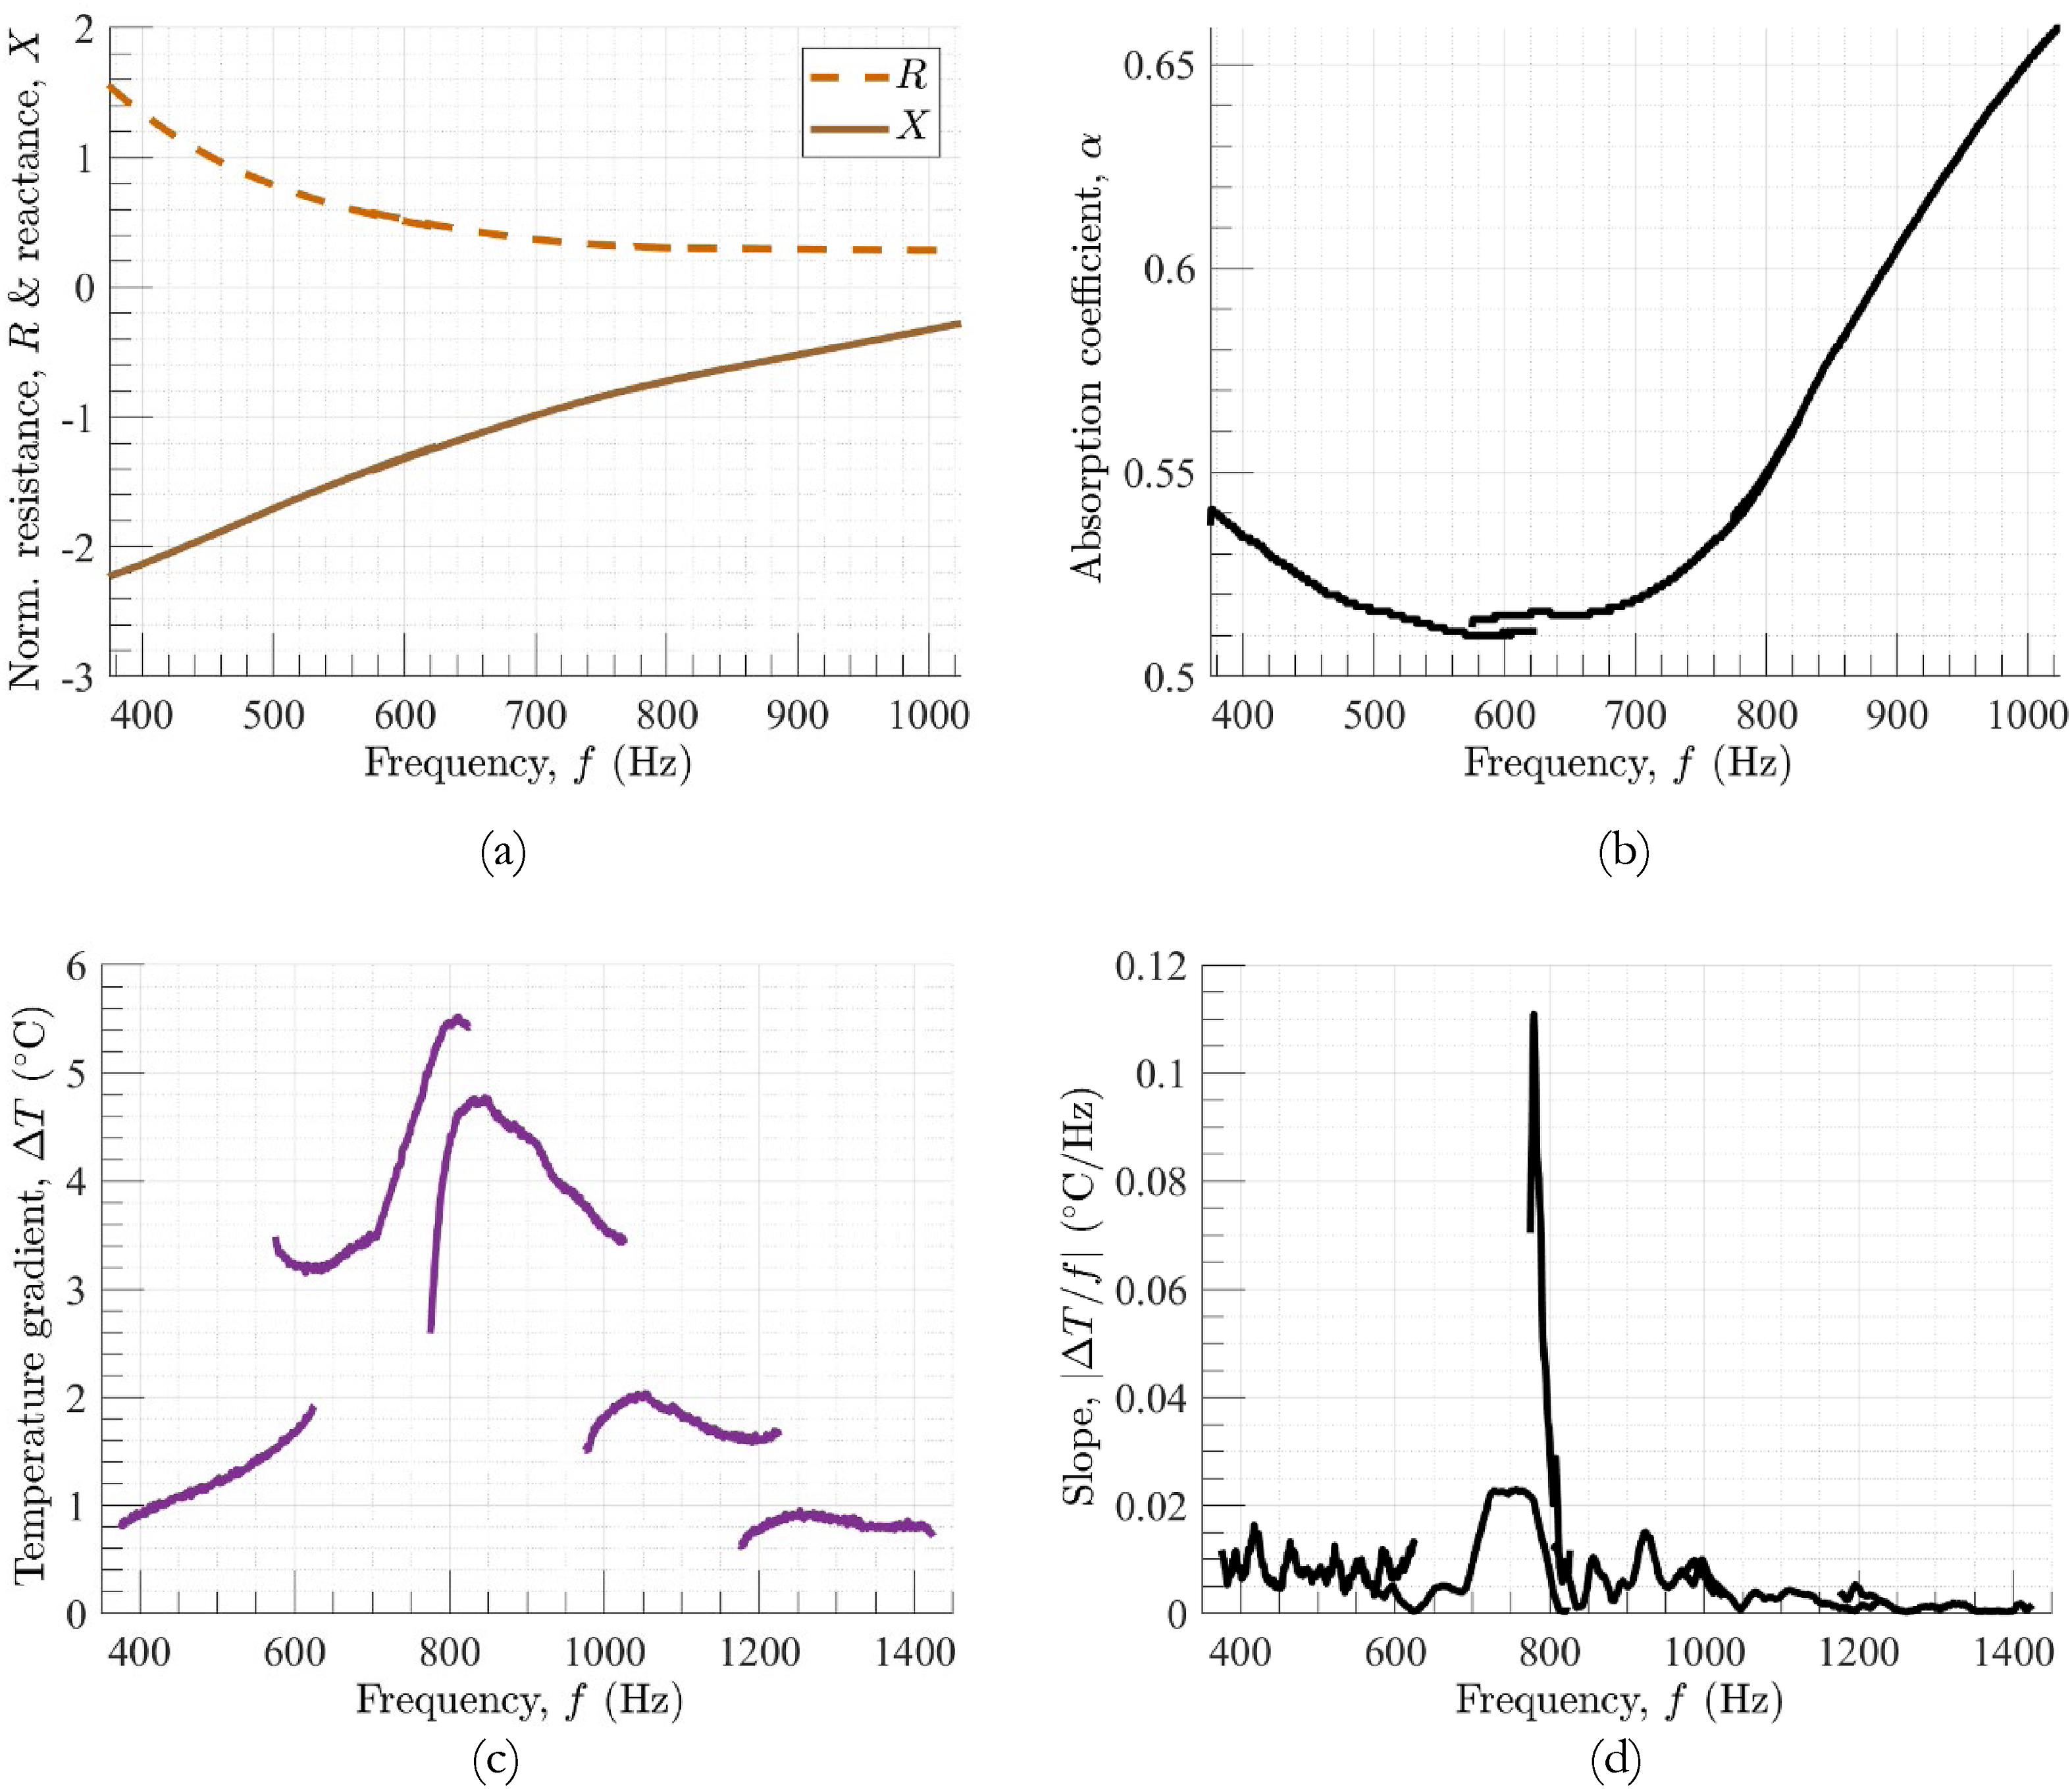
To gain further insights, tonal dwells (held frequency of sound source constant) to steady-state were conducted in the 600 – 900 Hz range using the same liner configuration. As shown in Figure 5, a pronounced peak in the temperature gradient is observed at 790 Hz. This peak suggests a thermoacoustic resonance in our system. The time to steady-state (amount of time for which the temperature continues to change) was about 15 minutes for most excitation frequencies, and the cold-side occurred at the top end of the stack while the hot-side occurred at the bottom end. Frequency response of thermoacoustic parameters for tonal dwells: (a) top and bottom thermocouple outputs and (b) temperature gradient.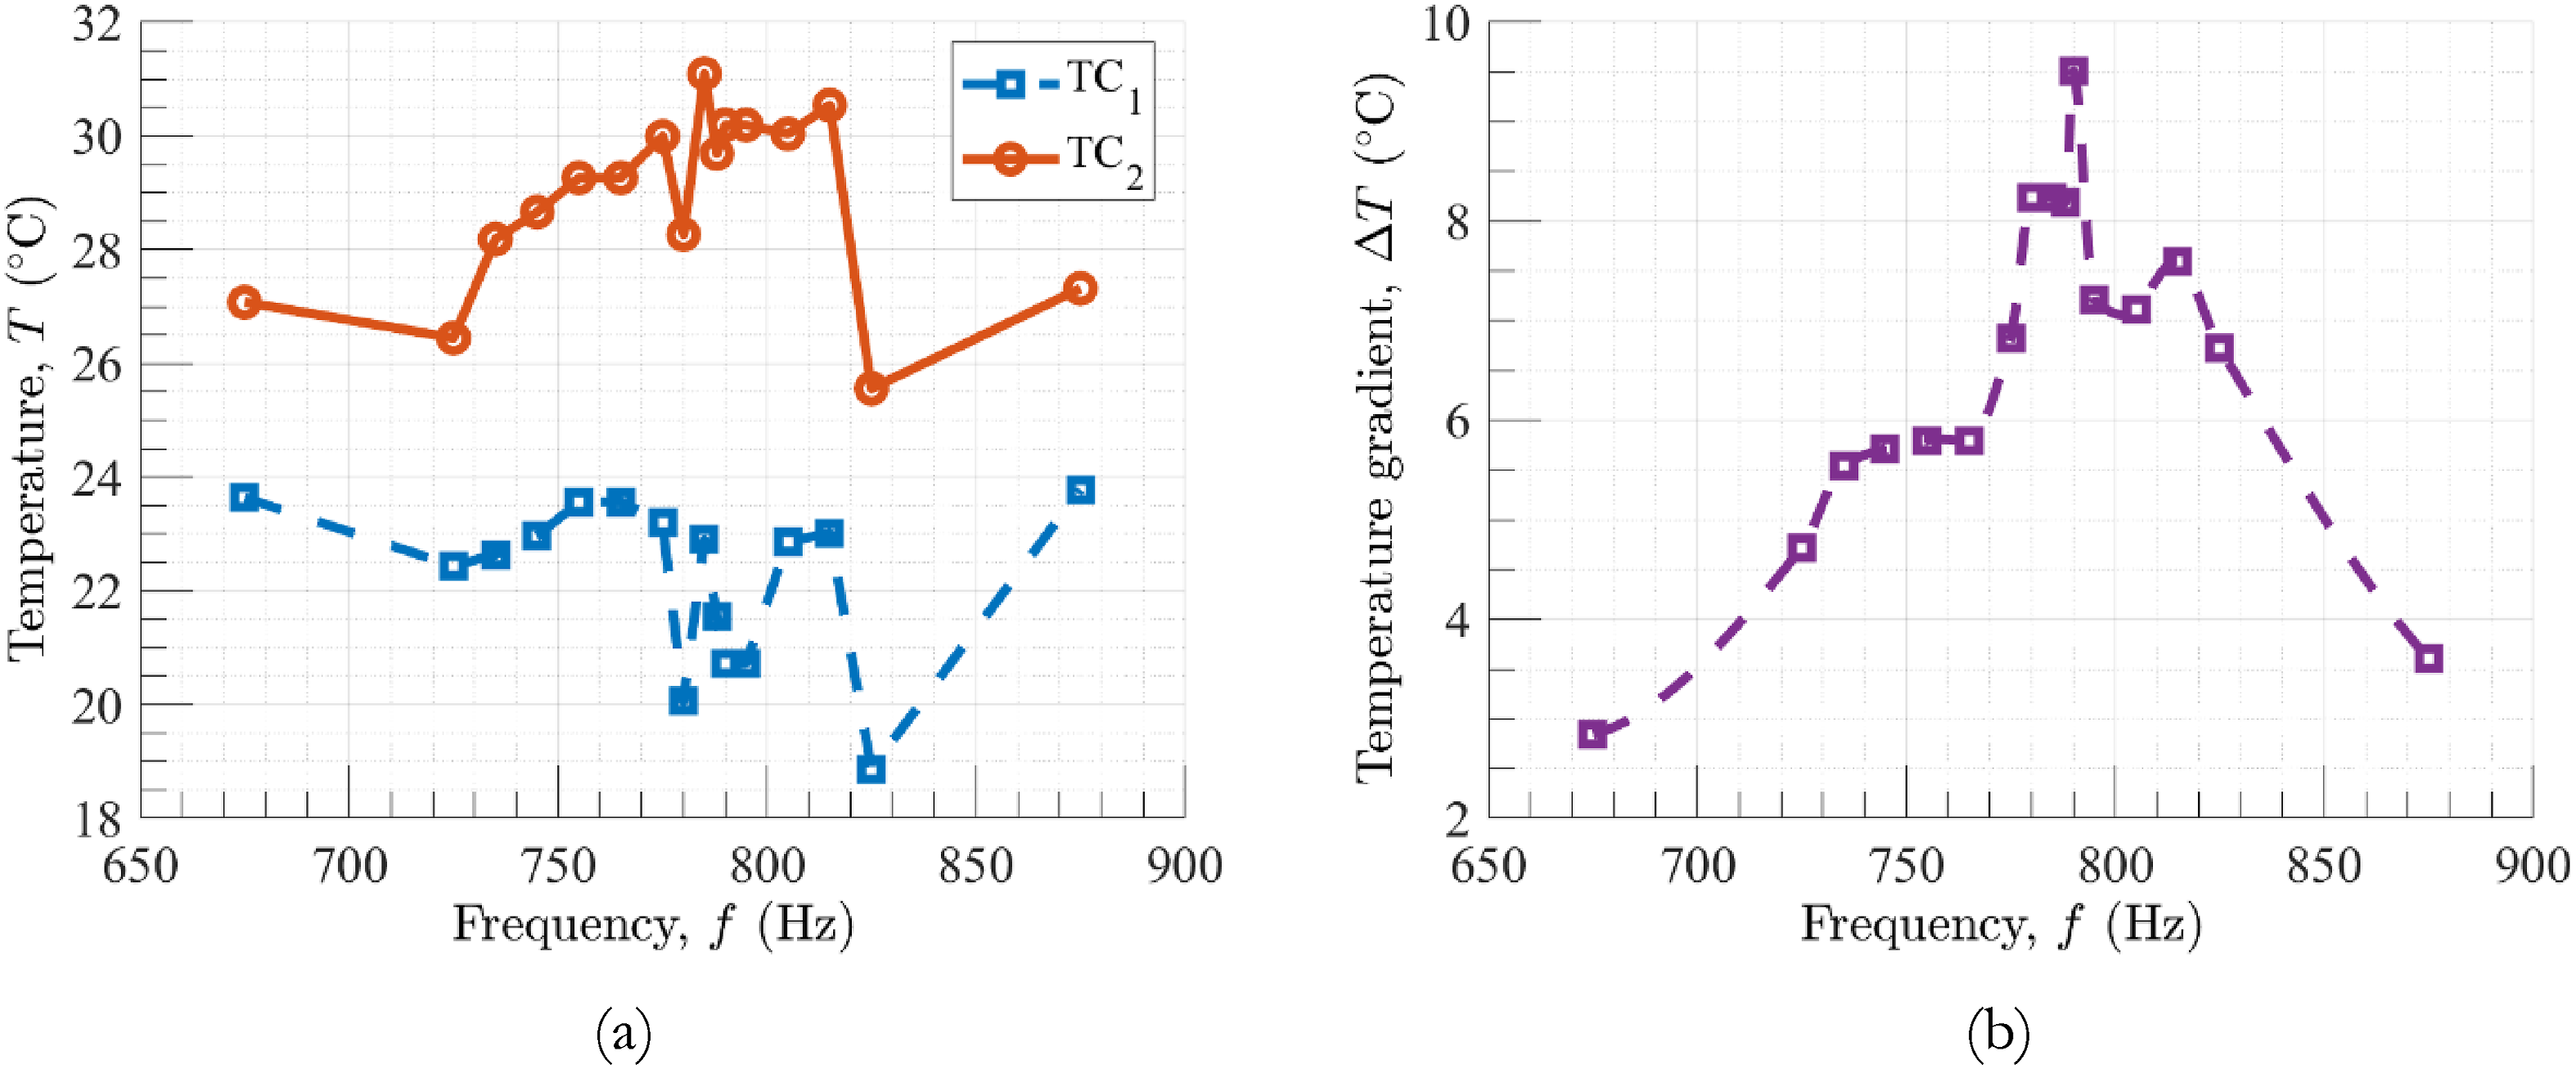
The acoustic performance under tonal dwells to steady-state is depicted in Figure 6. Unlike thermoacoustic transients, which require more time to subside, the acoustic transients are quite compact in time. Therefore, the acoustic responses from tonal dwells correlate well with those from the sine sweeps. This also indicates a relatively weak transient coupling between the thermoacoustic and acoustic absorption responses. Frequency response of acoustic parameters for tonal dwells: (a) normalized resistance and reactance, and (b) absorption coefficient.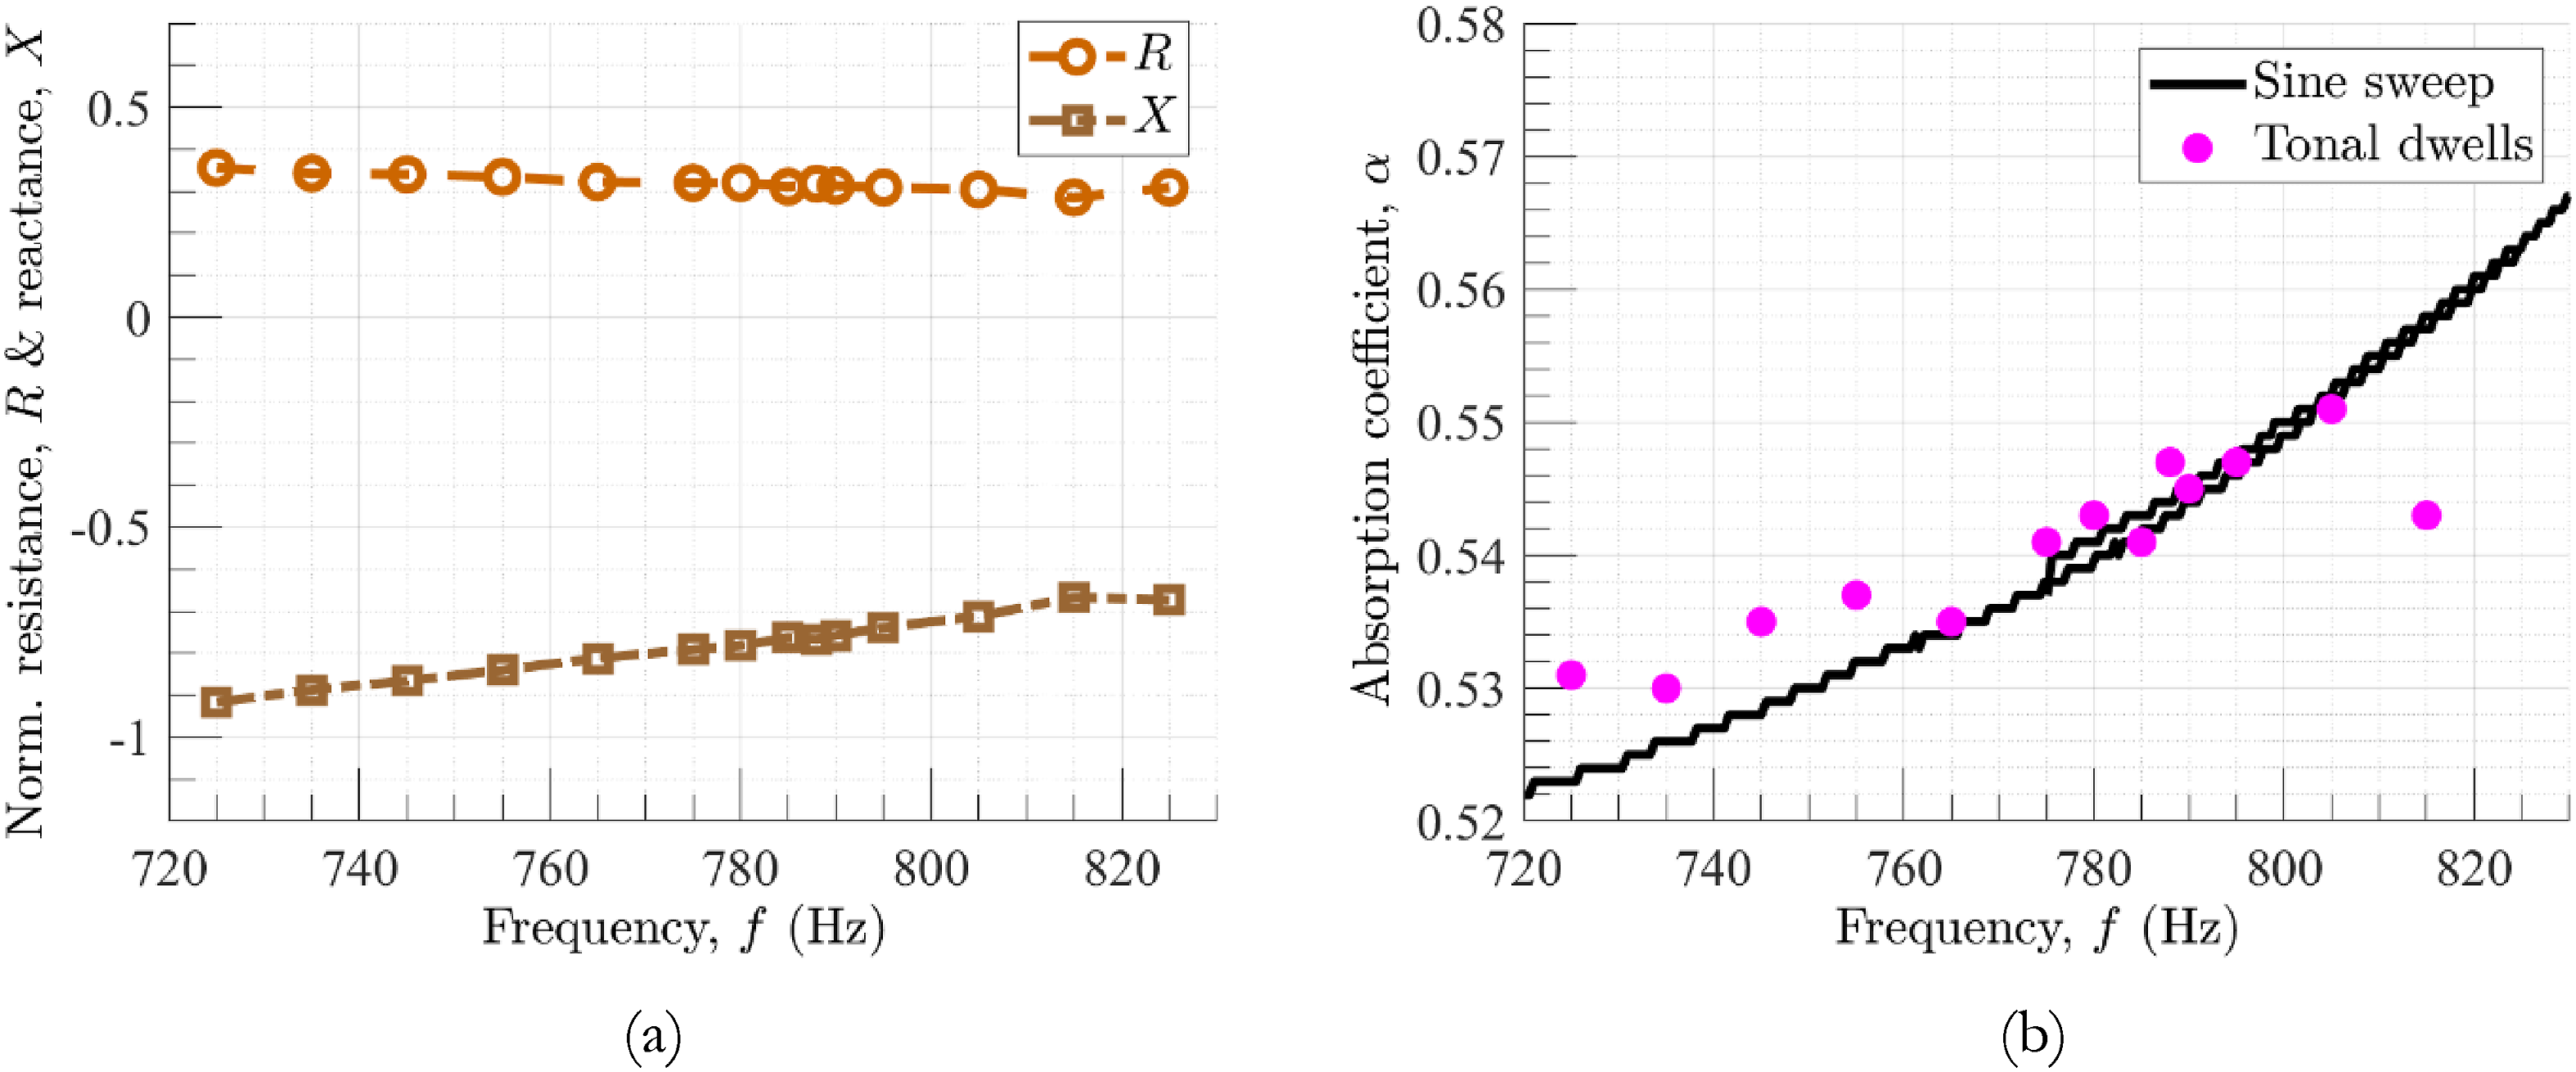
Stack configuration
Given the predetermined optimum stack geometry tailored to the specific frequency range of interest and the constraints of physical durability and our 3D printing capabilities, this section focuses on the significant roles of stack location and length within the thermoacoustic liner. The location of the stack within the resonator controls the pressure differential across the stack which impacts how well heat is transferred between the working fluid to the stack ends. The length of the stack plays a role in determining the magnitude of the pressure oscillations and thermal transients in the working fluid, which can influence the stability and efficiency of the liner. In general, optimizing the position and length of the stack can lead to improved acoustic and thermoacoustic performance of the thermoacoustic liner.
Figure 7 depicts the thermoacoustic and acoustic performance for different stack positions. The stack position is the position of the leading stack-face as measured from the top surface of the test liner. In these cases, the overall resonator length was kept constant at 0.097 m (3.9”). The findings indicate that the system operates at its best when the leading stack-face is placed just short of the midpoint of the resonator. The highest steady-state temperature gradient at resonance (790 Hz) of nearly 9.5°C was measured when the stack was positioned at this location. It is noted that as the stack is moved away from this mid-position either towards the top surface of the liner or the rigid termination at the bottom, the thermoacoustic performance diminishes, while the acoustic performance diminishes as the stack is moved closer to the rigid termination. It is therefore of interest to investigate the underlying mechanisms that relate the thermoacoustic and acoustic performances using modeling. Variation of stack position: (a) temperature histories from top (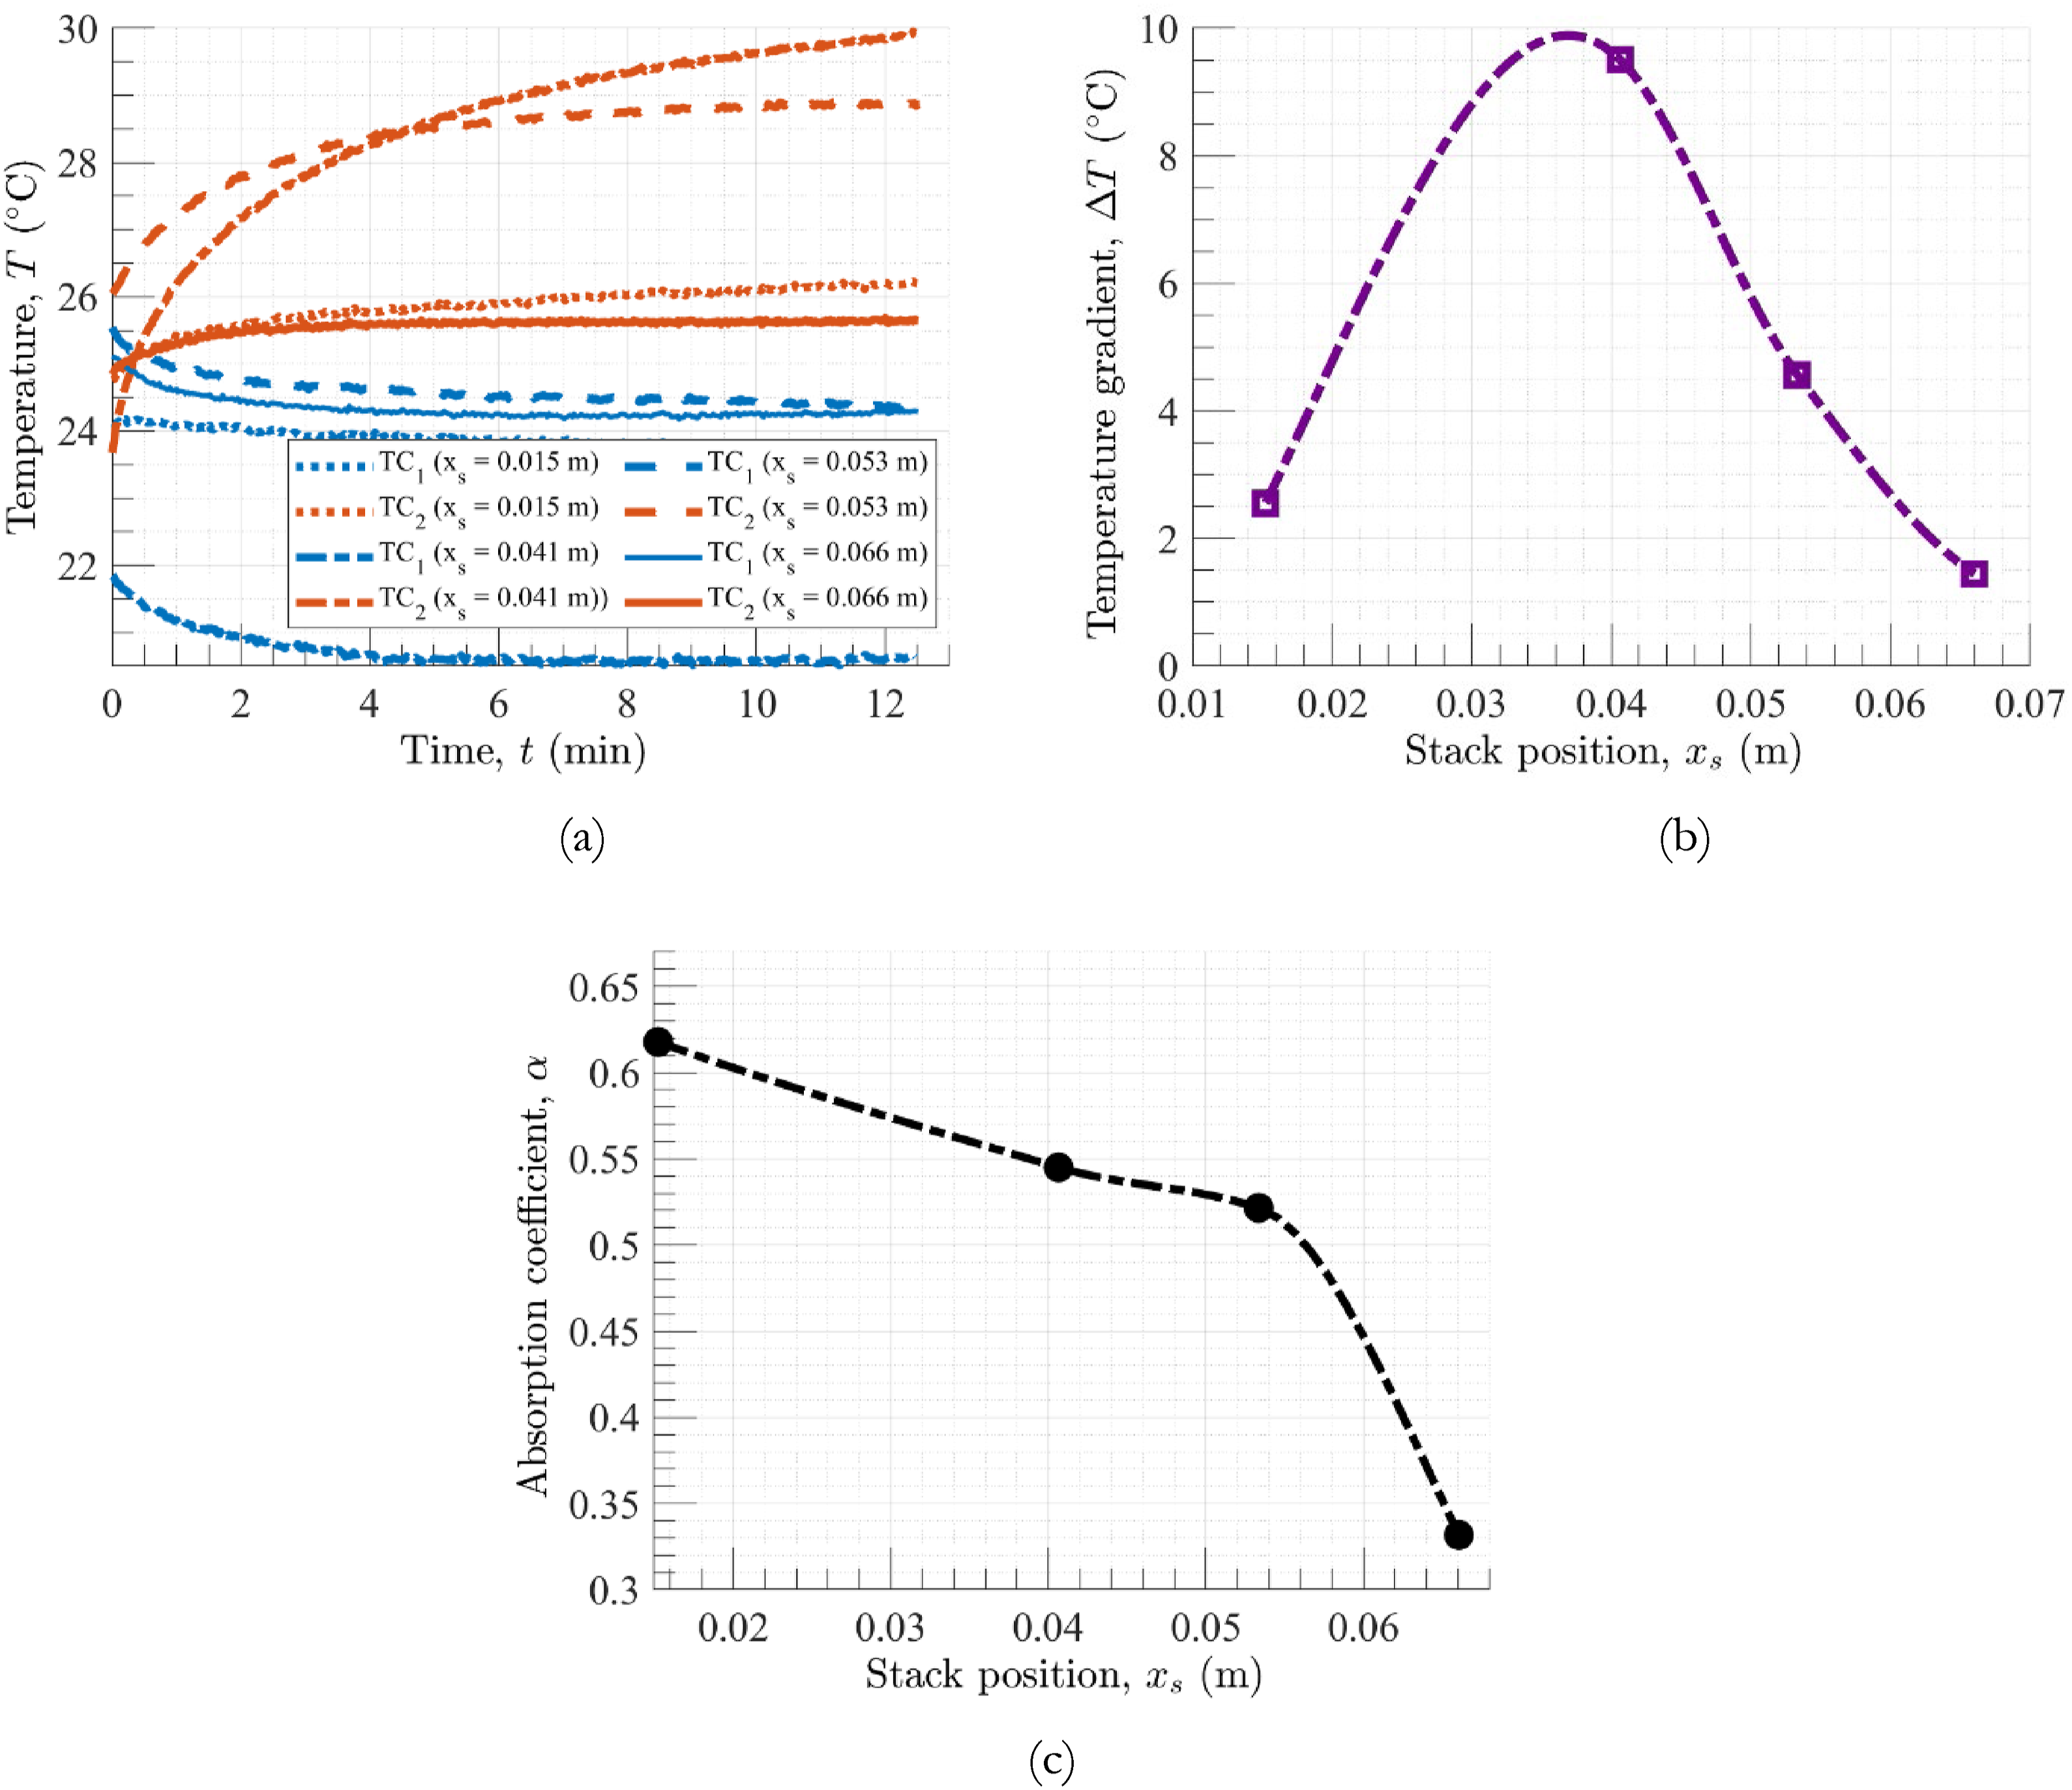
Similarly, the stack length was varied under the same testing conditions. The thermoacoustic and acoustic performance of the liner, varying by stack length, is depicted in Figure 8. The shorter stack, with a length of 0.025 m, displays a distinct temperature profile compared to the longer stack of 0.076 m. The absorption coefficient increases sharply with a slight increase in stack length and then gradually levels off, suggesting that longer stacks do not significantly increase absorption beyond a certain point. Variation of stack length: (a) temperature histories from top (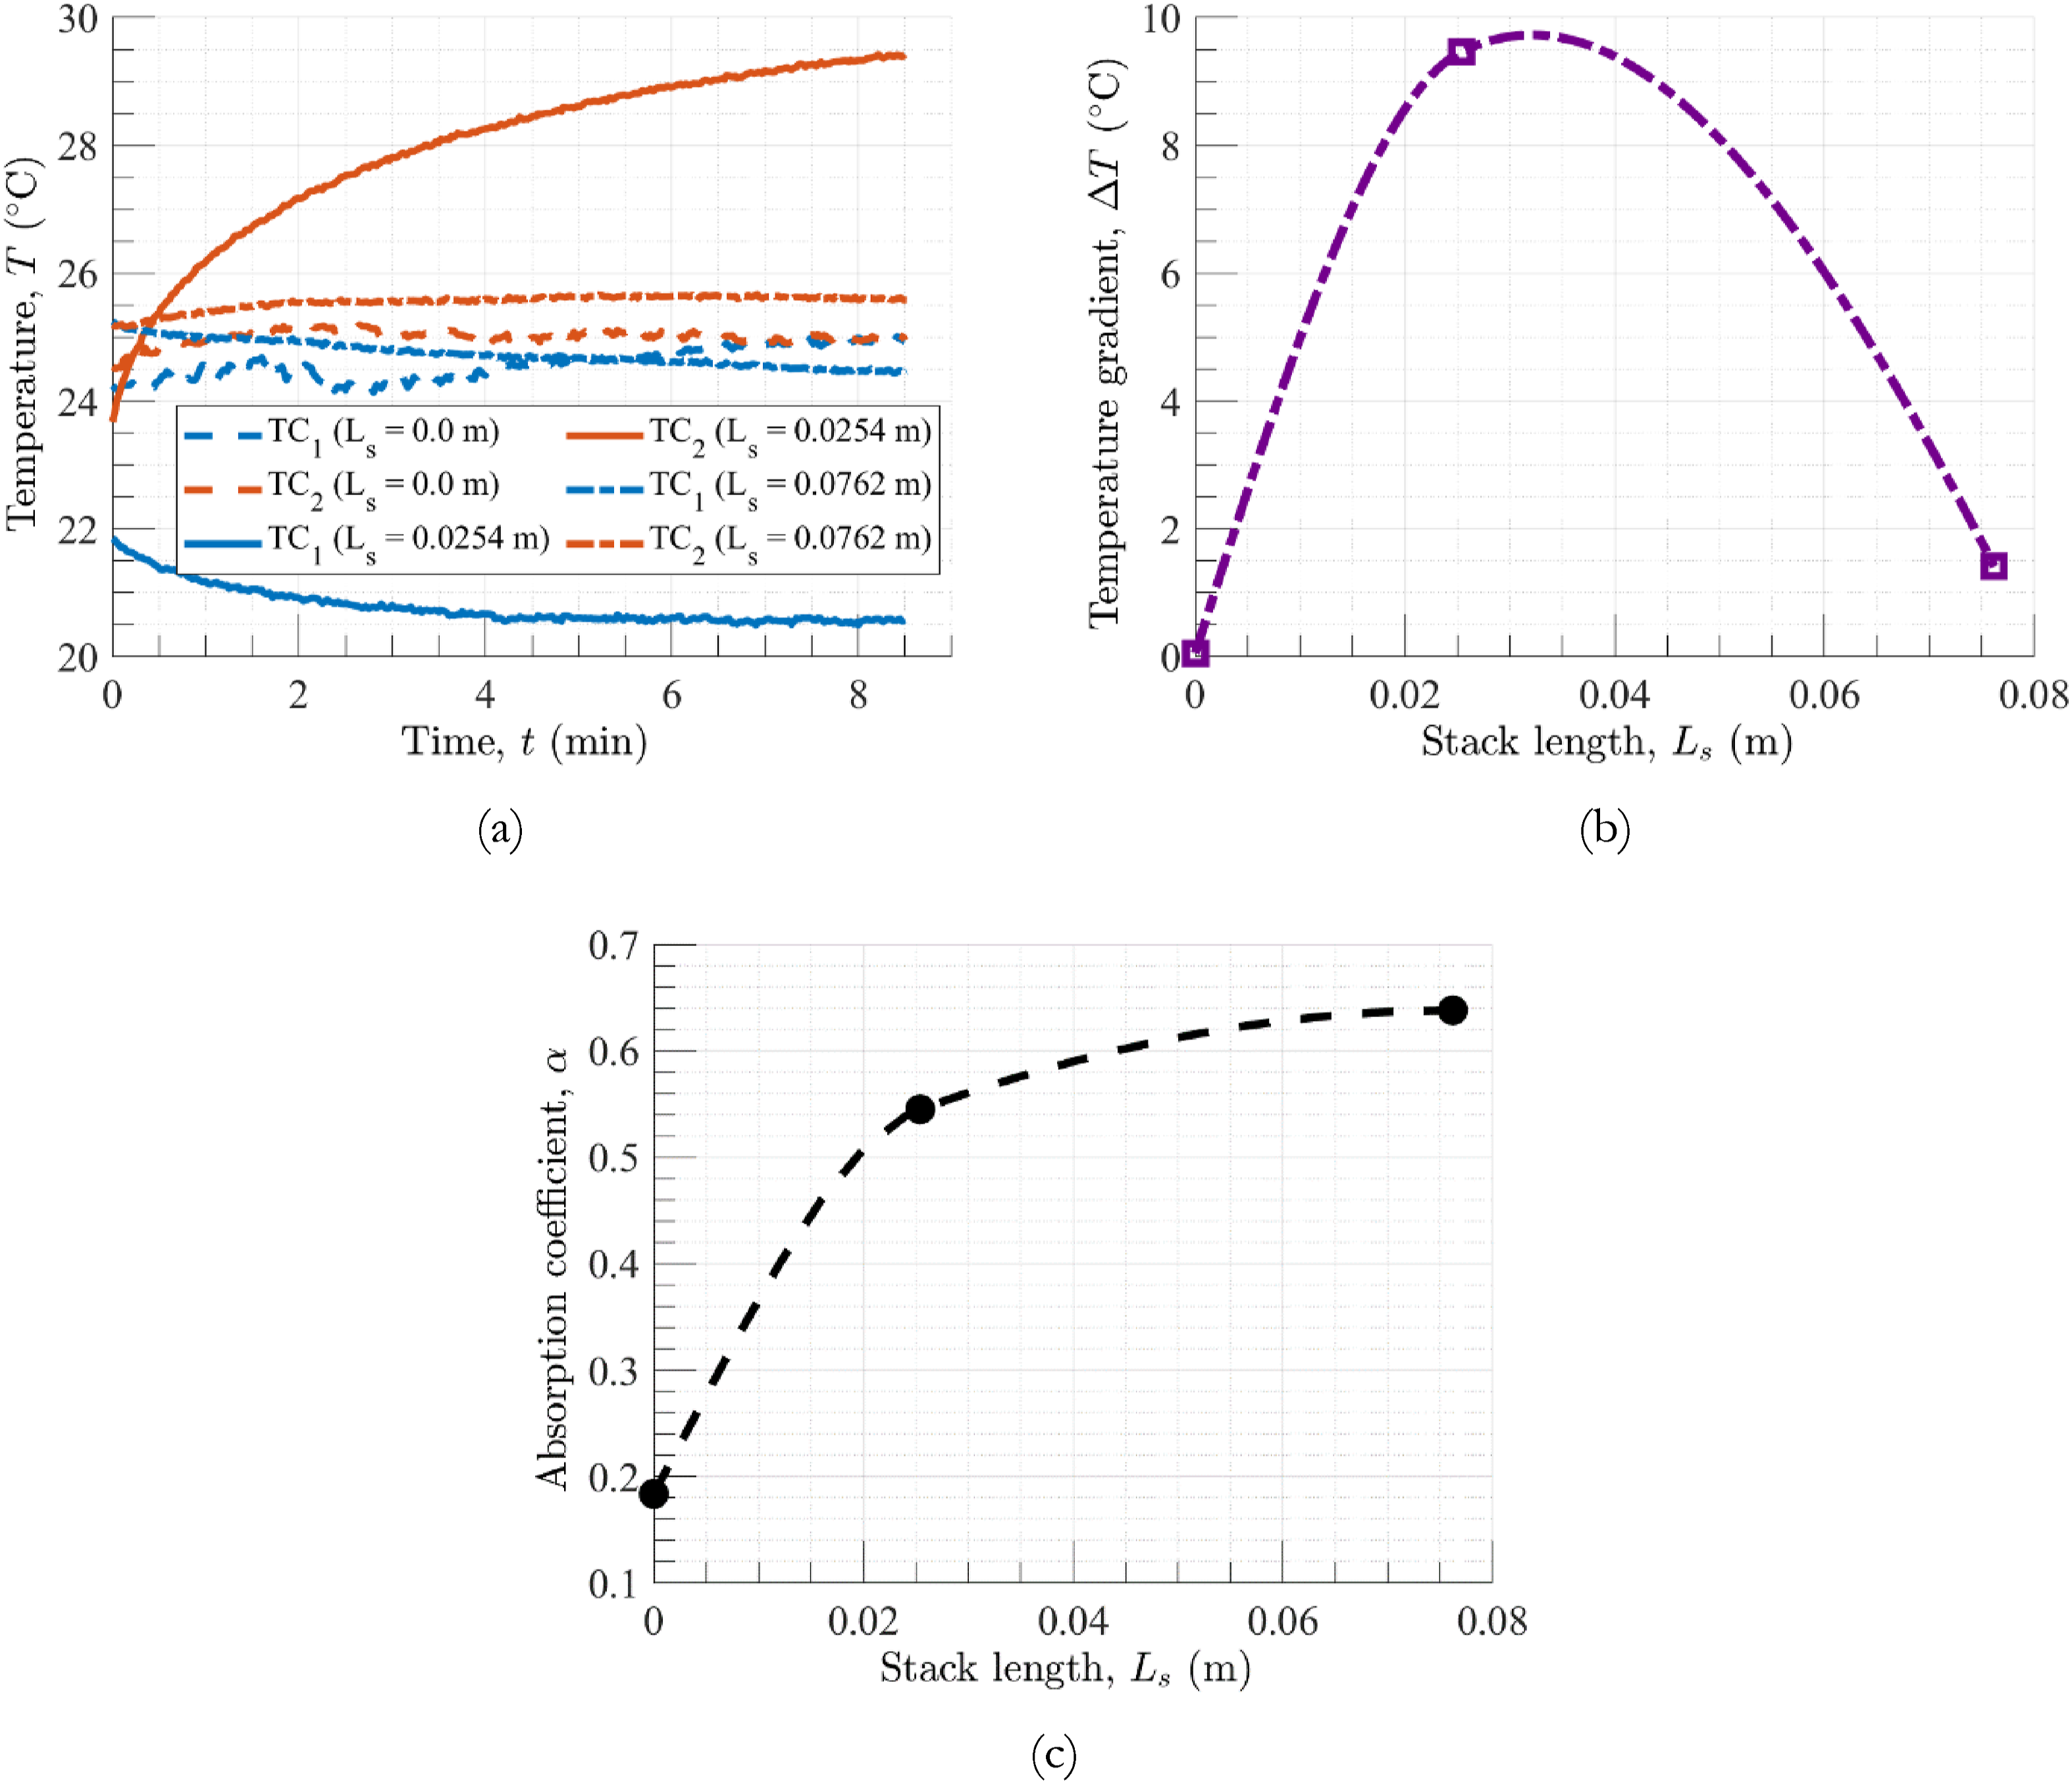
Sound pressure level
The linearity of the thermoacoustic liner’s response is worth inspecting by varying the excitation sound pressure level (SPL) using tonal dwells to steady-state at resonance (790 Hz). The hot- and cold-side temperature time histories, temperature gradient and absorption coefficient as a function of the excitation SPL are shown in Figure 9. Several interesting features are evident. It is true that at higher SPLs the steady-state temperature gradient is significantly enhanced while the absorption only varies slightly (<+/−10%). However, the time histories reveal a transition in the dominant heating mechanism involved. At lower excitation SPL (130 and 140 dB) the hot- and cold-side temperatures display the typical evolution seen from the thermoacoustic effect, wherein the hot- and cold-side temperatures straddle the ambient temperature (24.3°C) as they asymptote to their steady-state values. As the excitation SPL is raised to 145 and 150 dB, this trend is seen to be overridden by a monotonically increasing superposed heating contribution that increases the temperatures on both sides above the ambient temperature. This effect is quite drastic for the 150 dB case for which the hot-side temperature was about 54°C and the temperature gradient was nearly 27°C. It is a strong possibility that as the excitation SPL and consequently the acoustic energy available is increased, frictional (or viscous) heating within the stack pores become more dominant and therefore the thermoacoustic trends are overwhelmed. These mechanisms and their calibration could have implications for transduction of SPLs using ruggedized thermoacoustic devices. Response at different driving pressures for tonal dwell at the resonance (790 Hz): (a) temperature histories from top (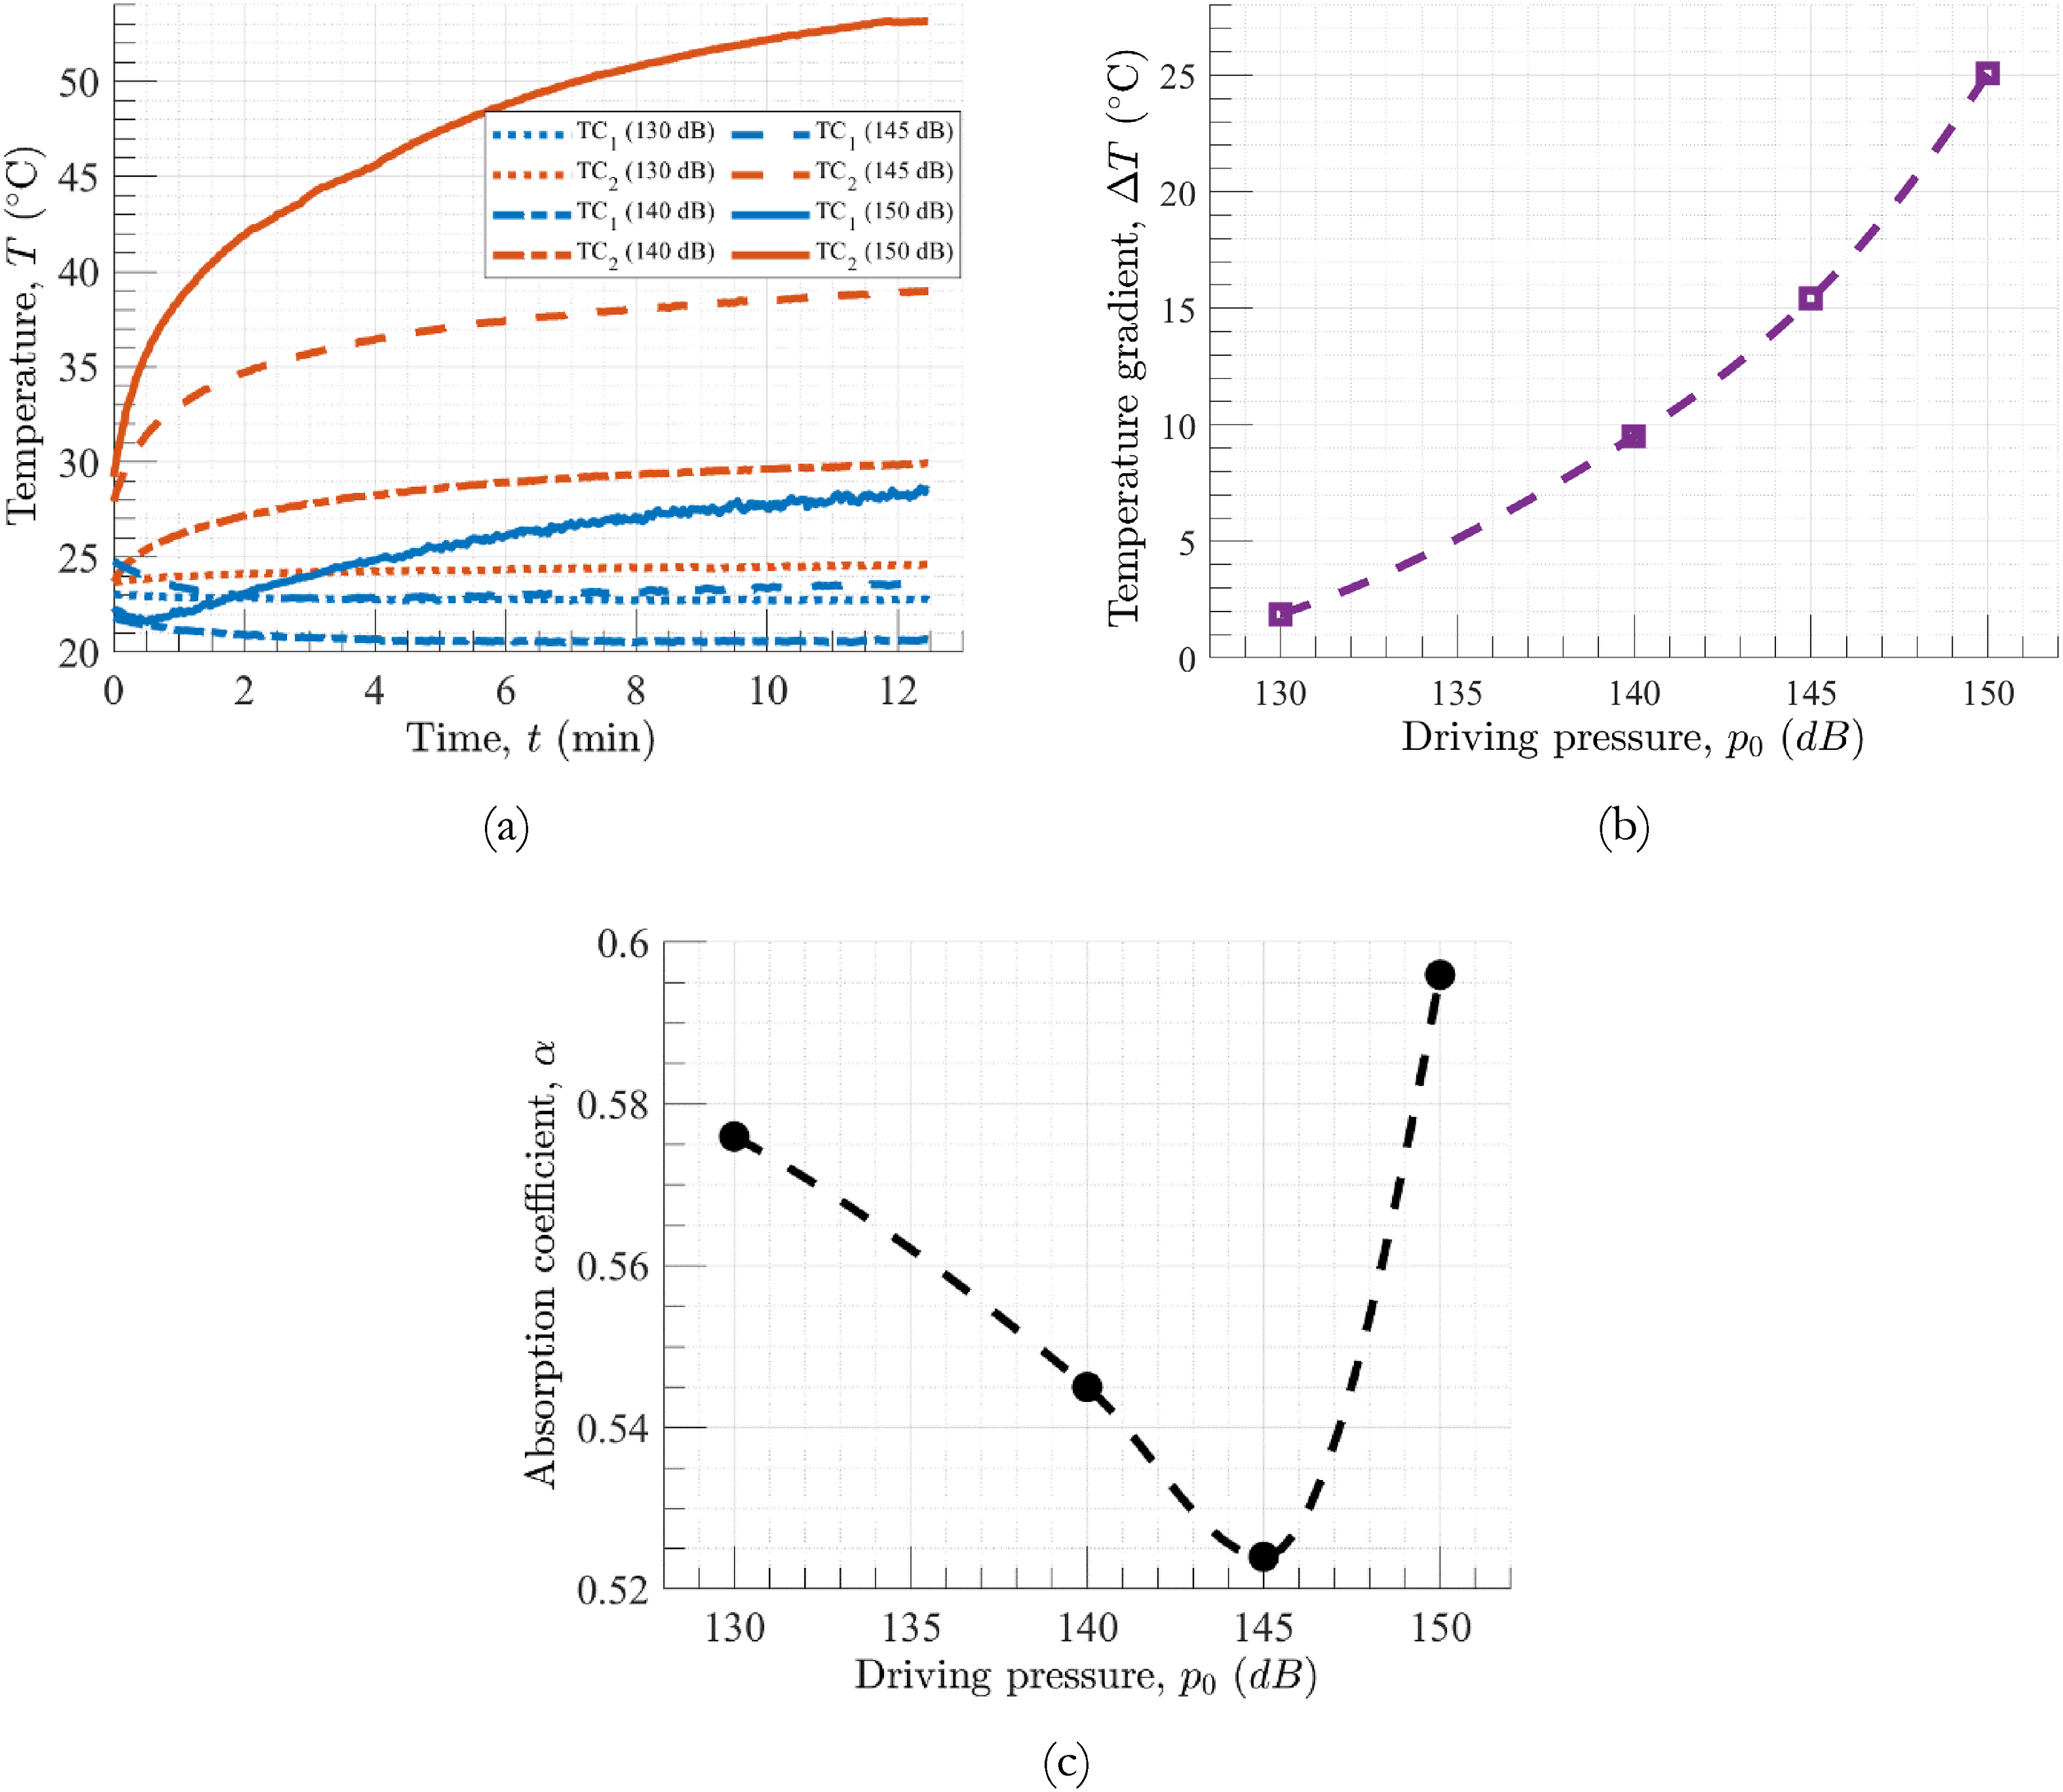
Comparison with simulations
The experimental datasets were compared to numerical simulations conducted using DeltaEC. Stack configuration parameters such as length and position are examined through simulations. The predicted thermoacoustic parameters are presented as a function of the distance along the resonator for different stack positions in Figure 10. Simulated (a) pressure amplitude, (b) volumetric flow rate, (c) phase angle, and (d) acoustic power as a function of resonator length for various stack positions at an excitation frequency of 790 Hz. The shaded boxes indicate the stack position where the width of the box is the stack length (0.0254 m) and the height is proportional.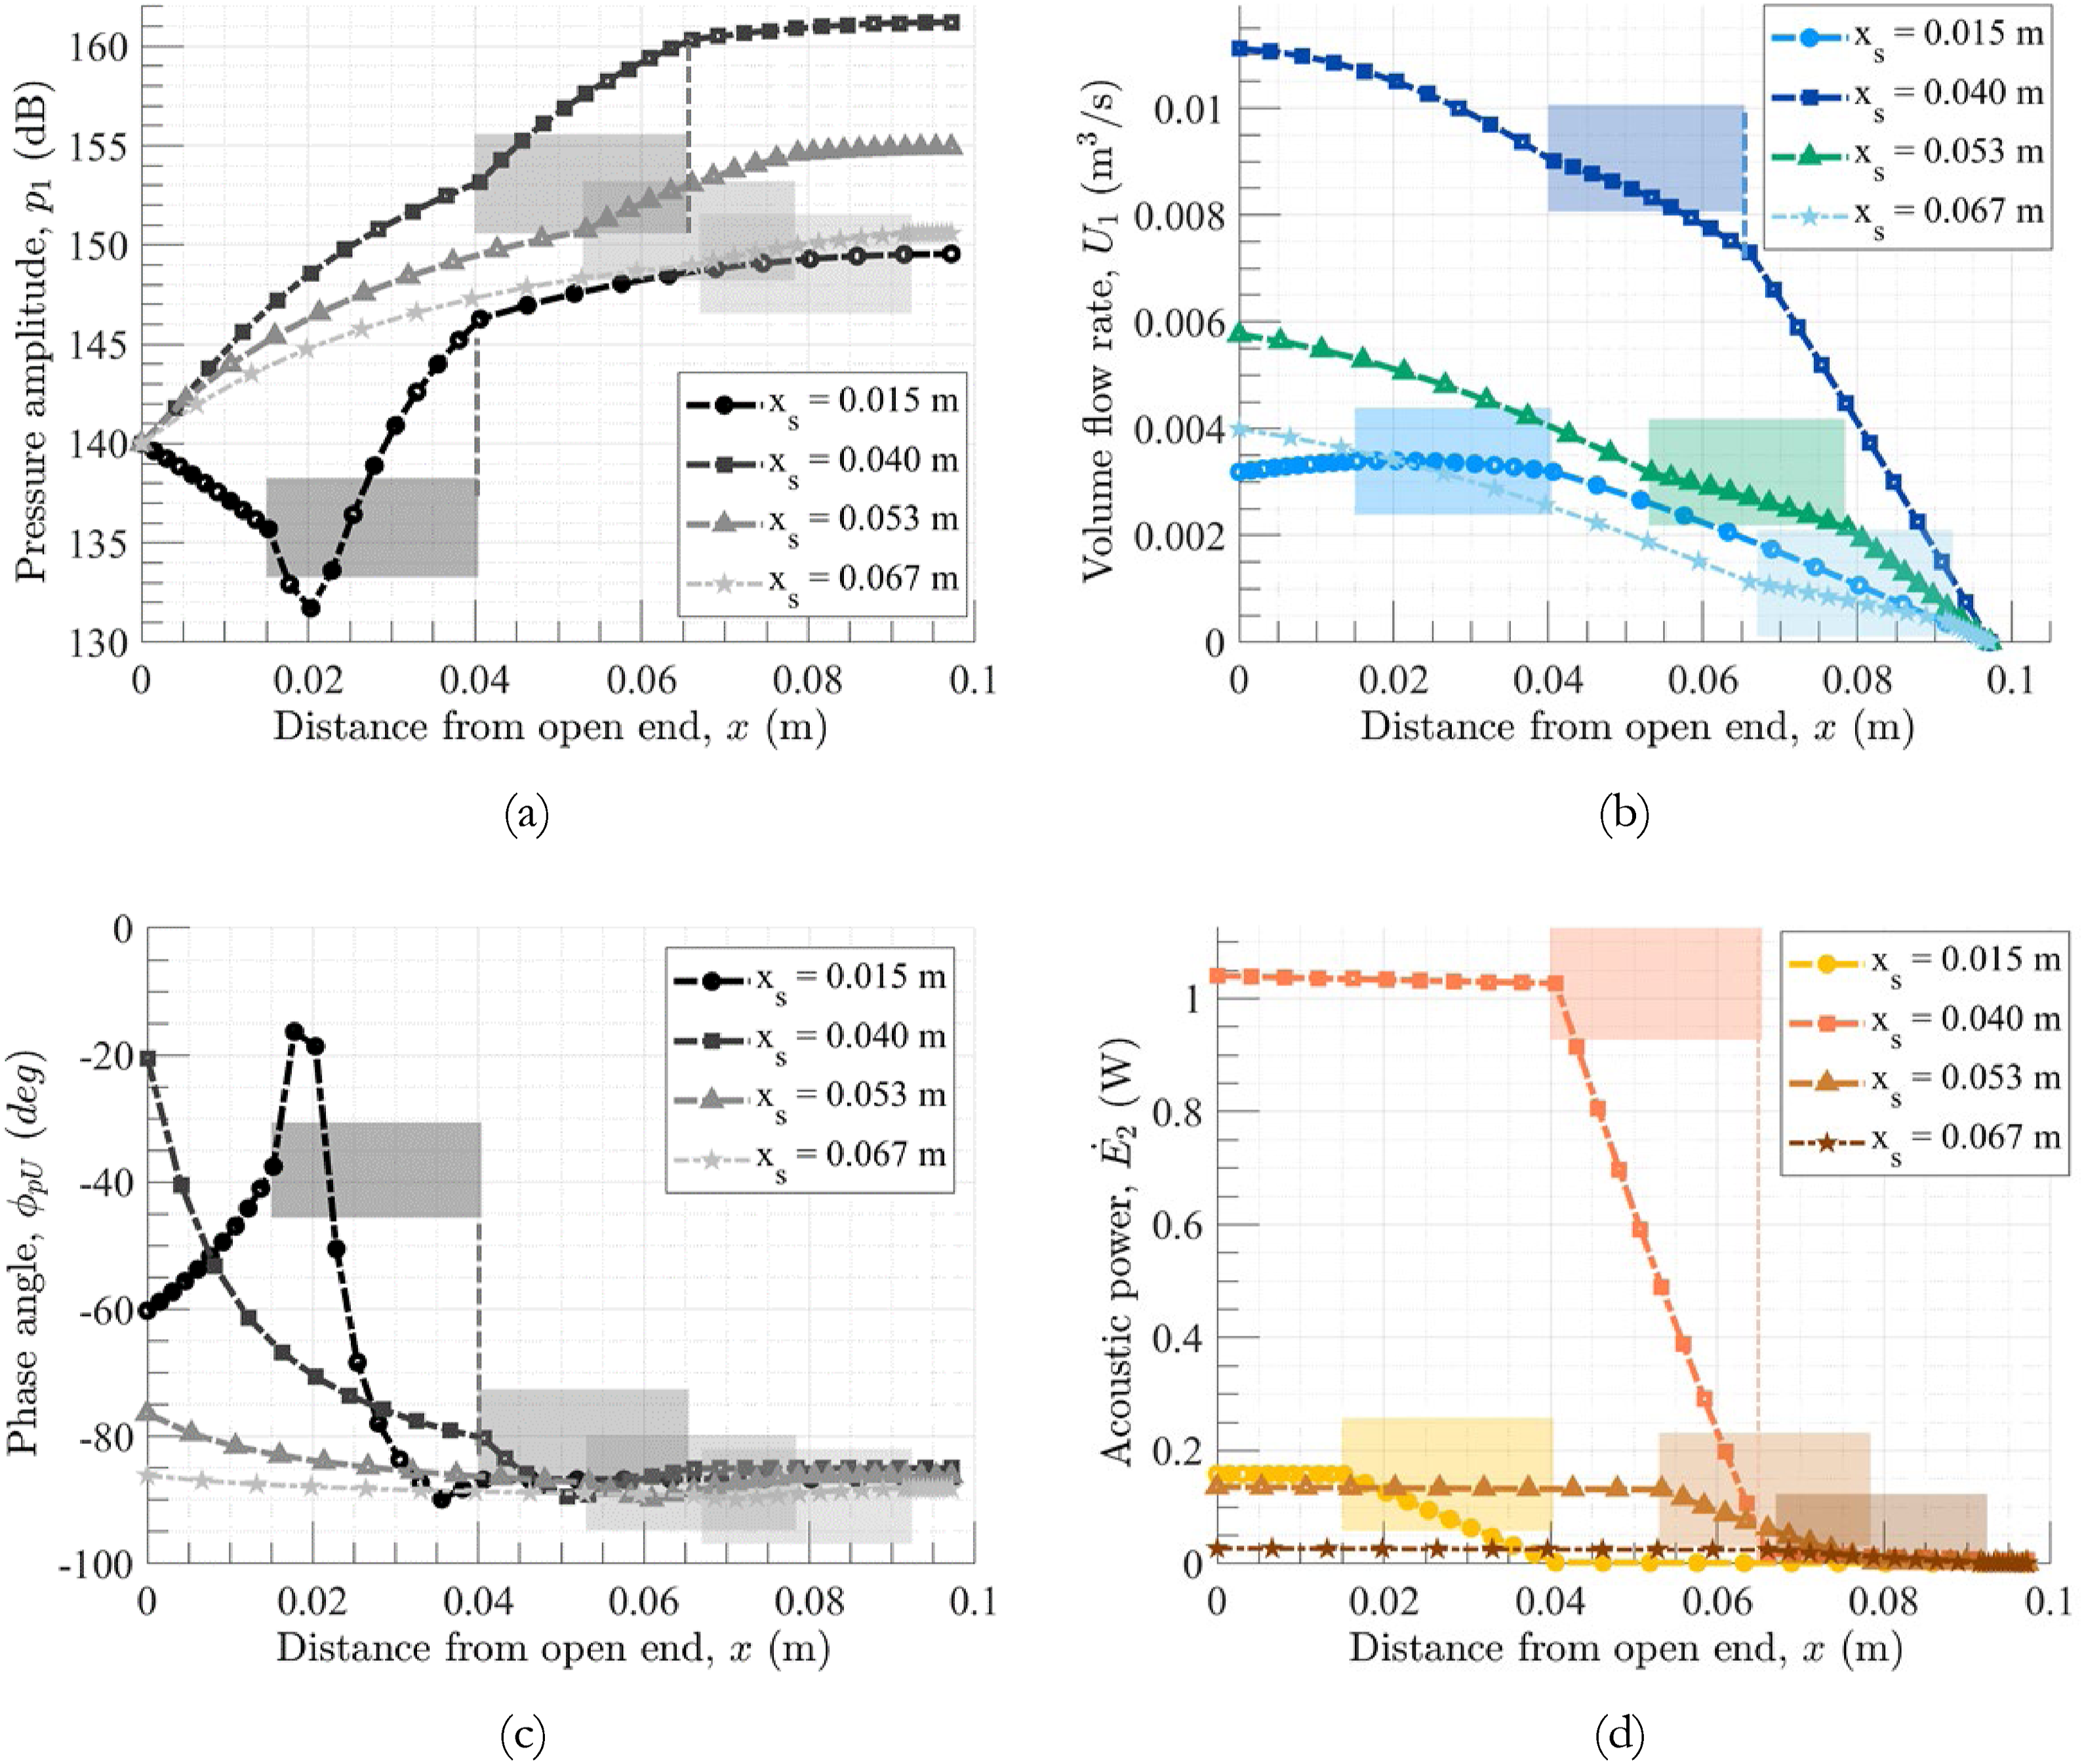
Note that the pressure amplitude envelopes in Figure 10(a) result from standing wave formation from multiple reflections at steady state due to the impedance mismatch that occurs at the stack-duct interfaces within the resonator. For Simulated (a) pressure amplitude and volume flow rate, (b) phase angle, (c) acoustic power before and after the stack, and (d) comparison of simulated and experimental temperature gradient as a function of stack position.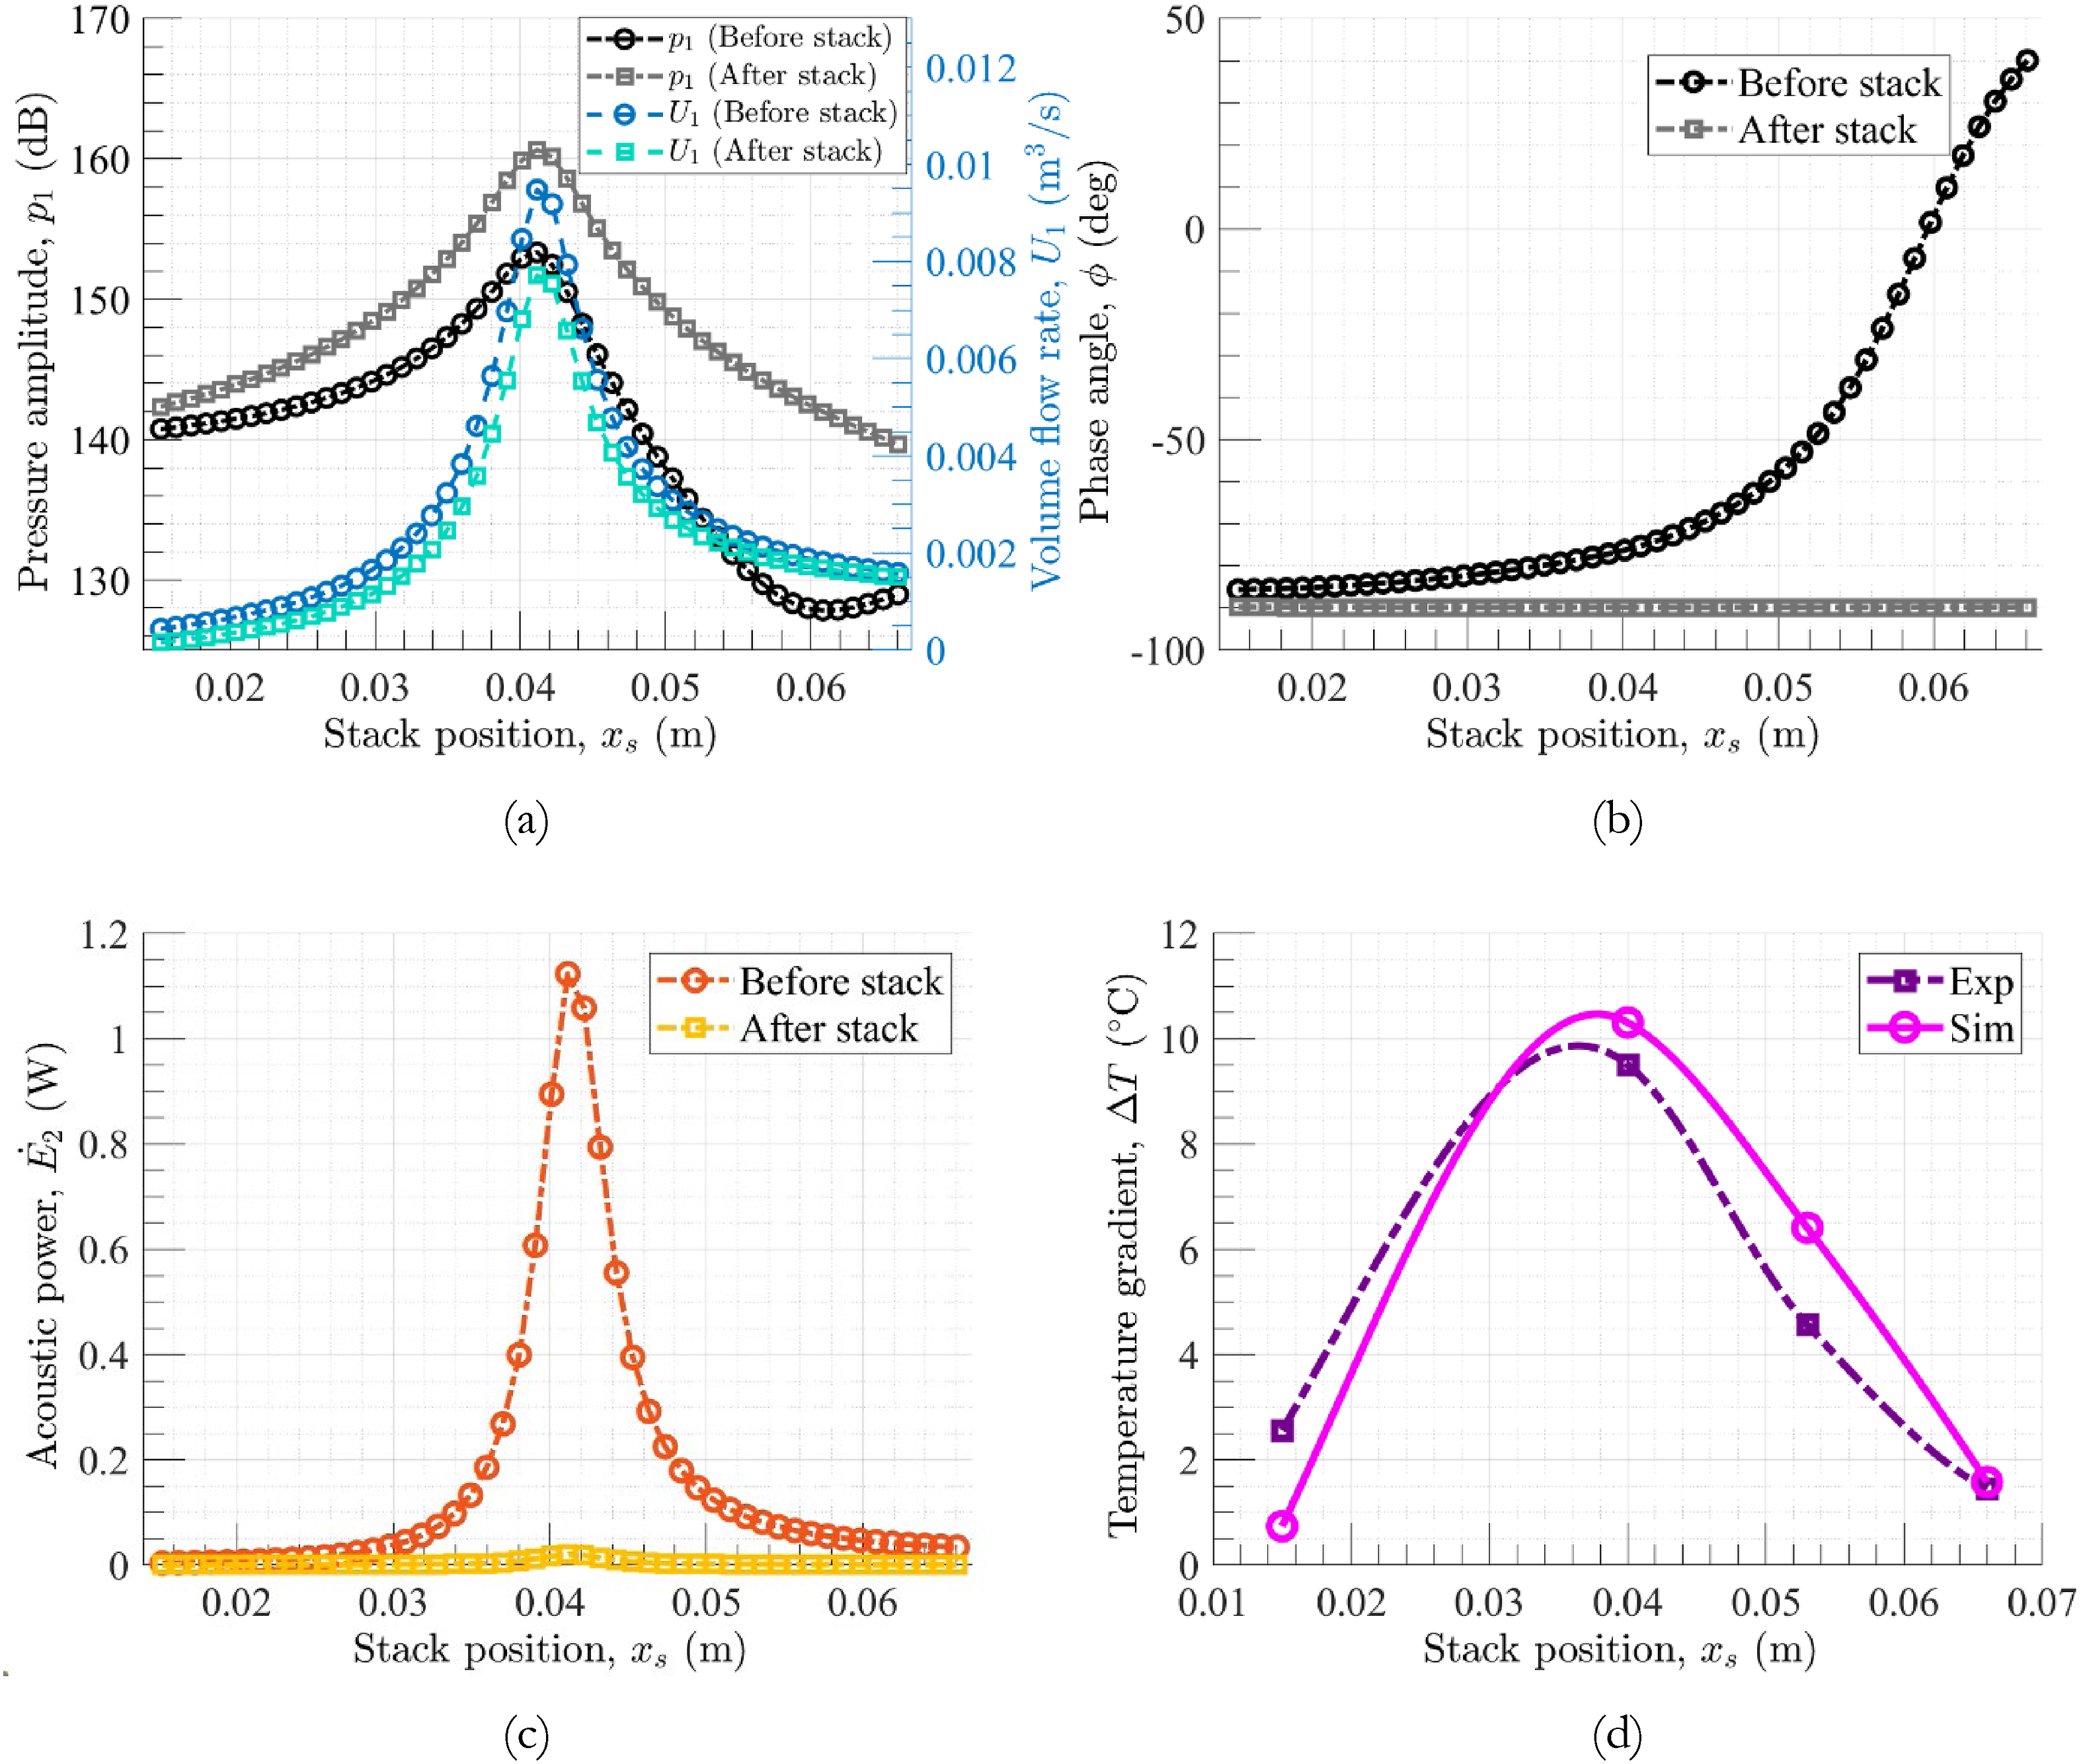
From Figure 11, it is evident that at a stack position slightly above 0.04 m, there is a pronounced peak in the pressure amplitude, volume flow rate, and acoustic power. This peak signifies that the acoustic power available at the stack face closely aligns with the achieved thermoacoustic gradient. Comparison of the predicted and measured temperature gradients as a function of stack position shows very good agreement. The stack position (0.04 m) that corresponds to the maximum temperature gradient also agrees well between simulations and experiments. These results could be used to optimize the design and performance of thermoacoustic liners.
The results for the influence of stack length are presented in Figure 12. Note that for all other test settings, the stack is placed at 0.04 m, but for this test, the stack is placed at 0.015 m to accommodate the additional stack length while keeping other settings the same (as detailed in experiments section). In general, a longer stack length provides more pore surface area, which can lead to more significant temperature drops. However, as the stack length increases, the dissipative losses within the pores tend to mount up as well, degrading performance. For this specific configuration, the phase angle reverses as the stack length is increased beyond ∼0.04 m. This means that the location of the hot and cold sides of the stack switch between top or bottom, significantly impacting thermoacoustic output. Changing the stack length also shifts the locations of impedance mismatch due to the duct-stack-duct interfaces within the resonator leading to differences in the formation of nodes and antinodes of the standing wave patterns, which affects the pressure amplitude at the leading stack face. The sudden change in pressure amplitude at certain stack lengths (∼0.04 m) can be attributed to the interaction between the stack length and the standing wave pattern within the resonator. Therefore, optimal stack length is important to ensure that the acoustic power available at the leading stack face is maximized. Simulated (a) pressure amplitude and volume flow rate, (b) phase angle, (c) acoustic power, and (d) comparison of simulated and experimental temperature gradient, as a function of stack length.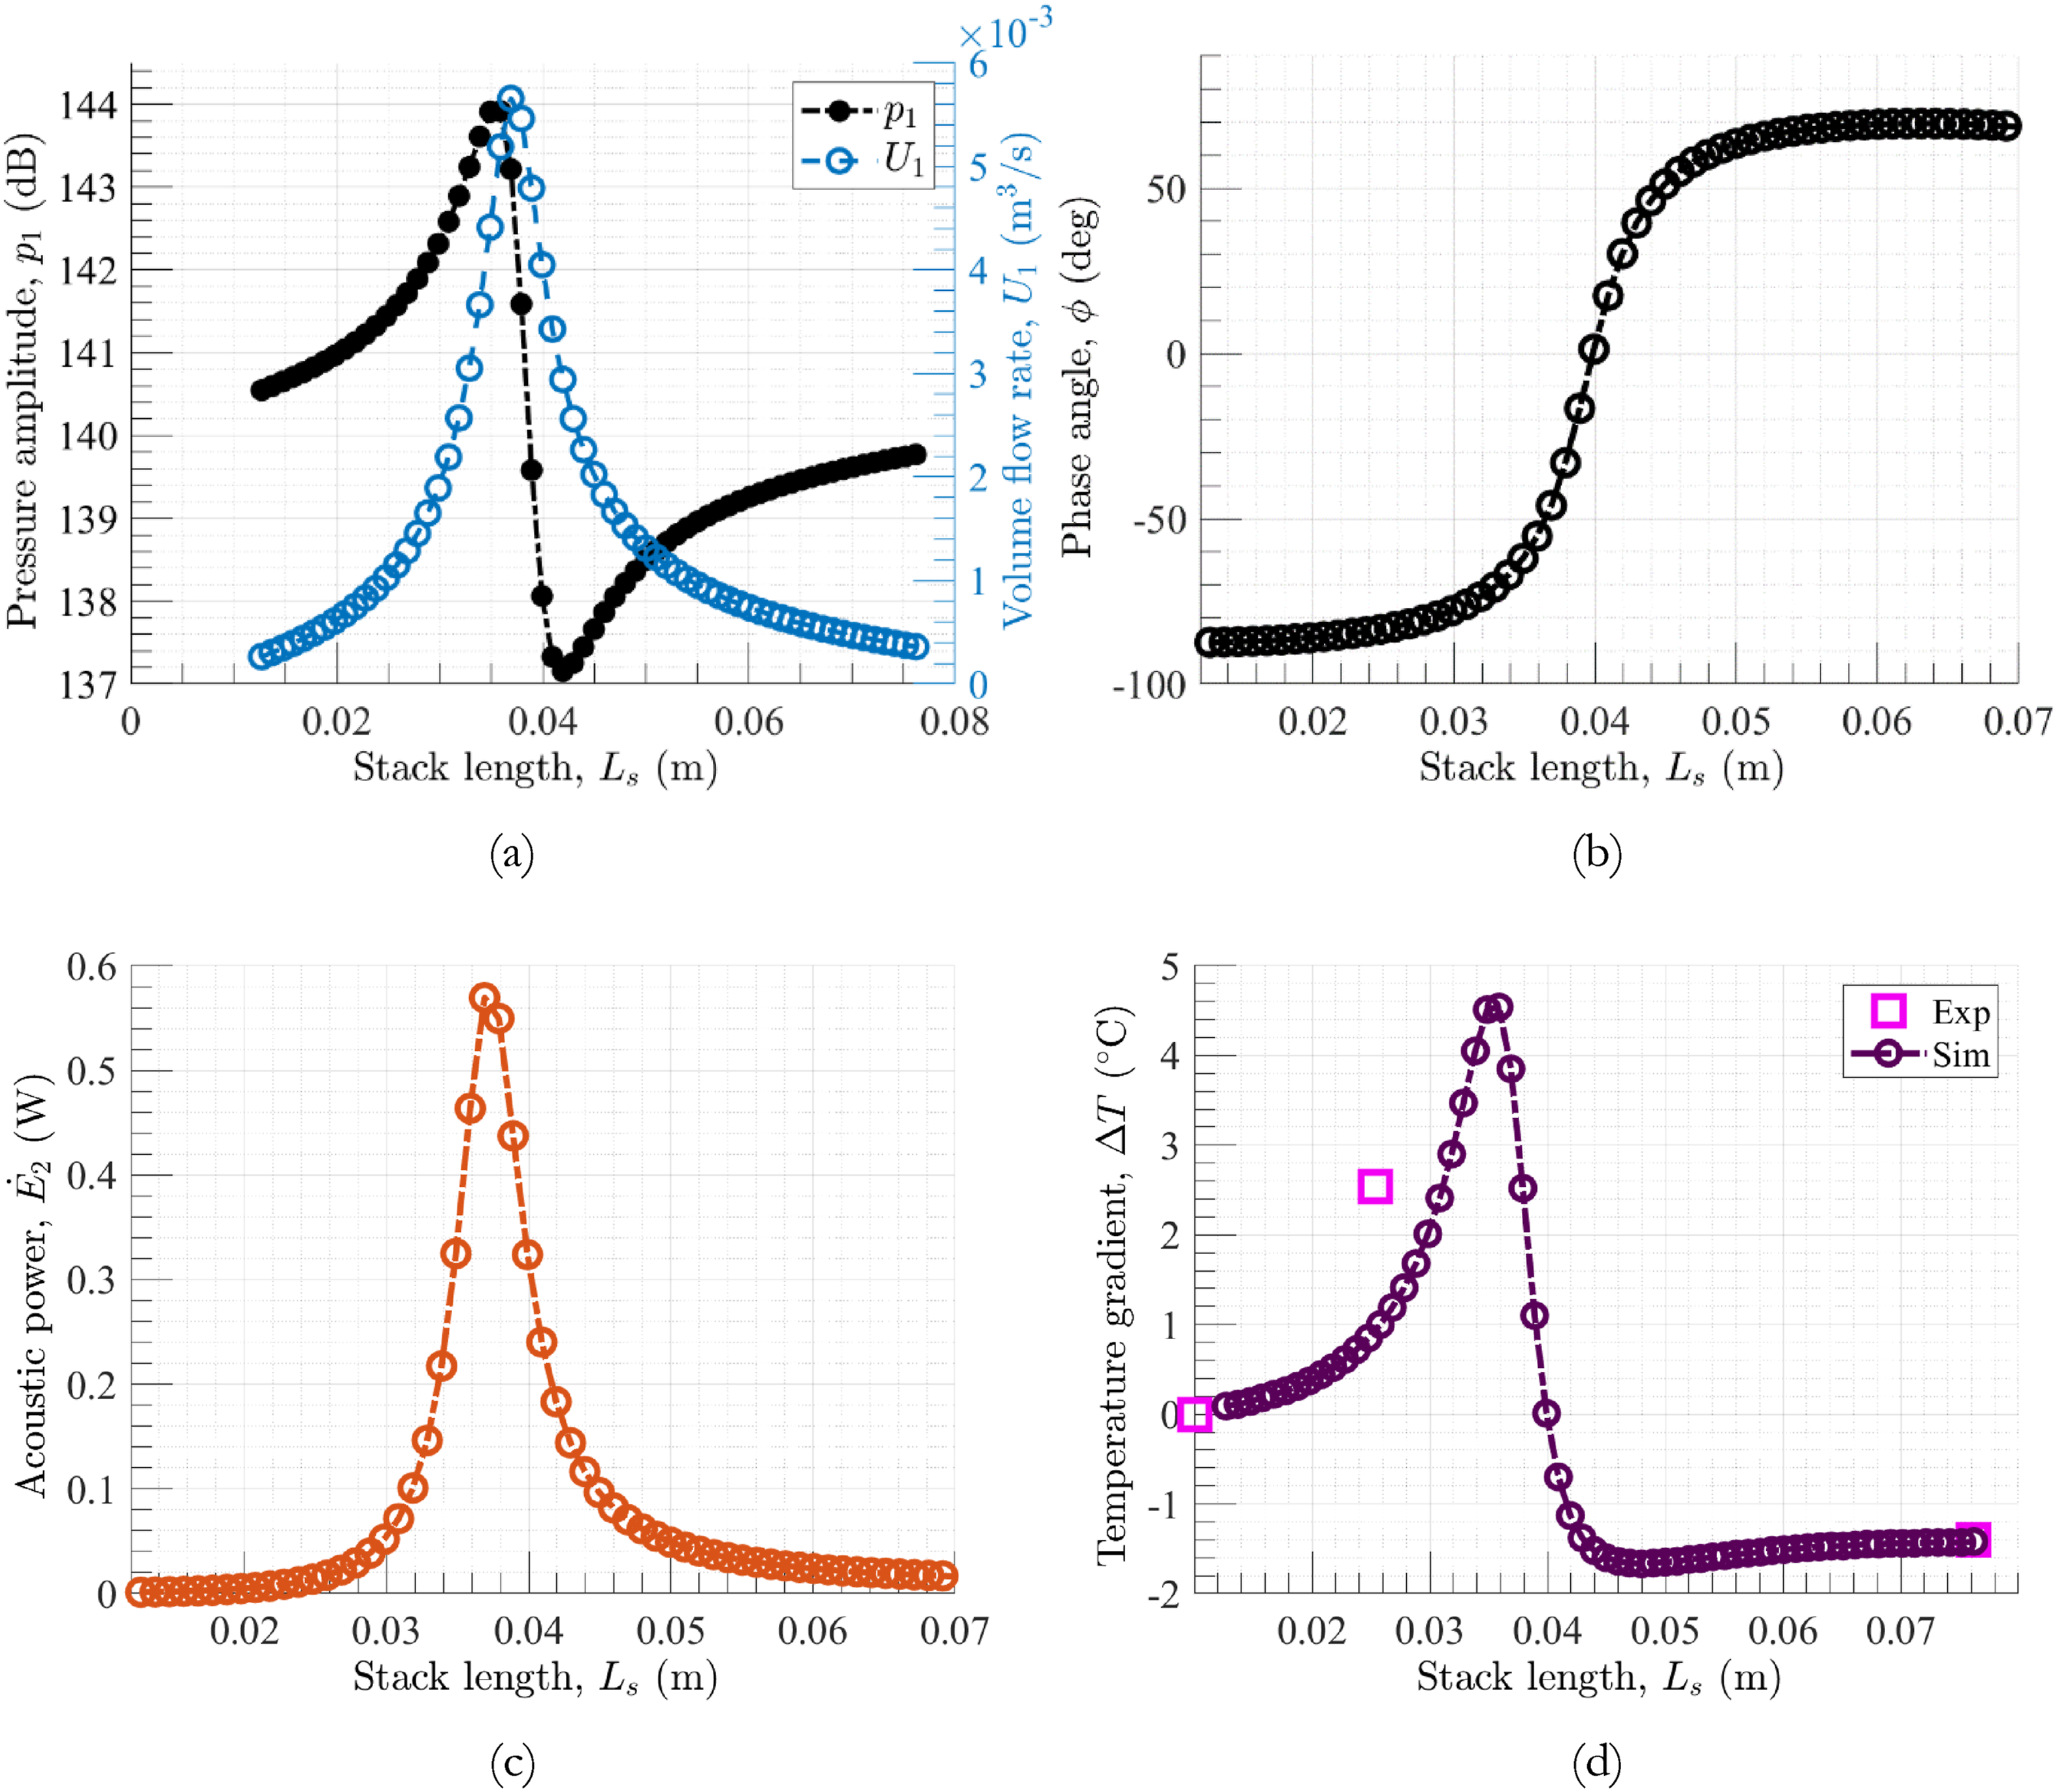
The comparison with simulations for the influence of excitation or driving pressure on the thermoacoustic performance is presented in Figure 13. A nearly linear increase in both pressure amplitude and volume flow rate is seen with increasing driving pressure. At the same time, the phase angle is nearly constant, and therefore the acoustic power sees a nonlinear rise with driving pressure, which contributes towards achieving a higher temperature gradient at high driving pressure. Simulated (a) pressure amplitude and volume flow rate, (b) phase angle, and (c) acoustic power at the leading stack face and (d) comparison of simulated and experimental temperature gradients as a function of driving pressure.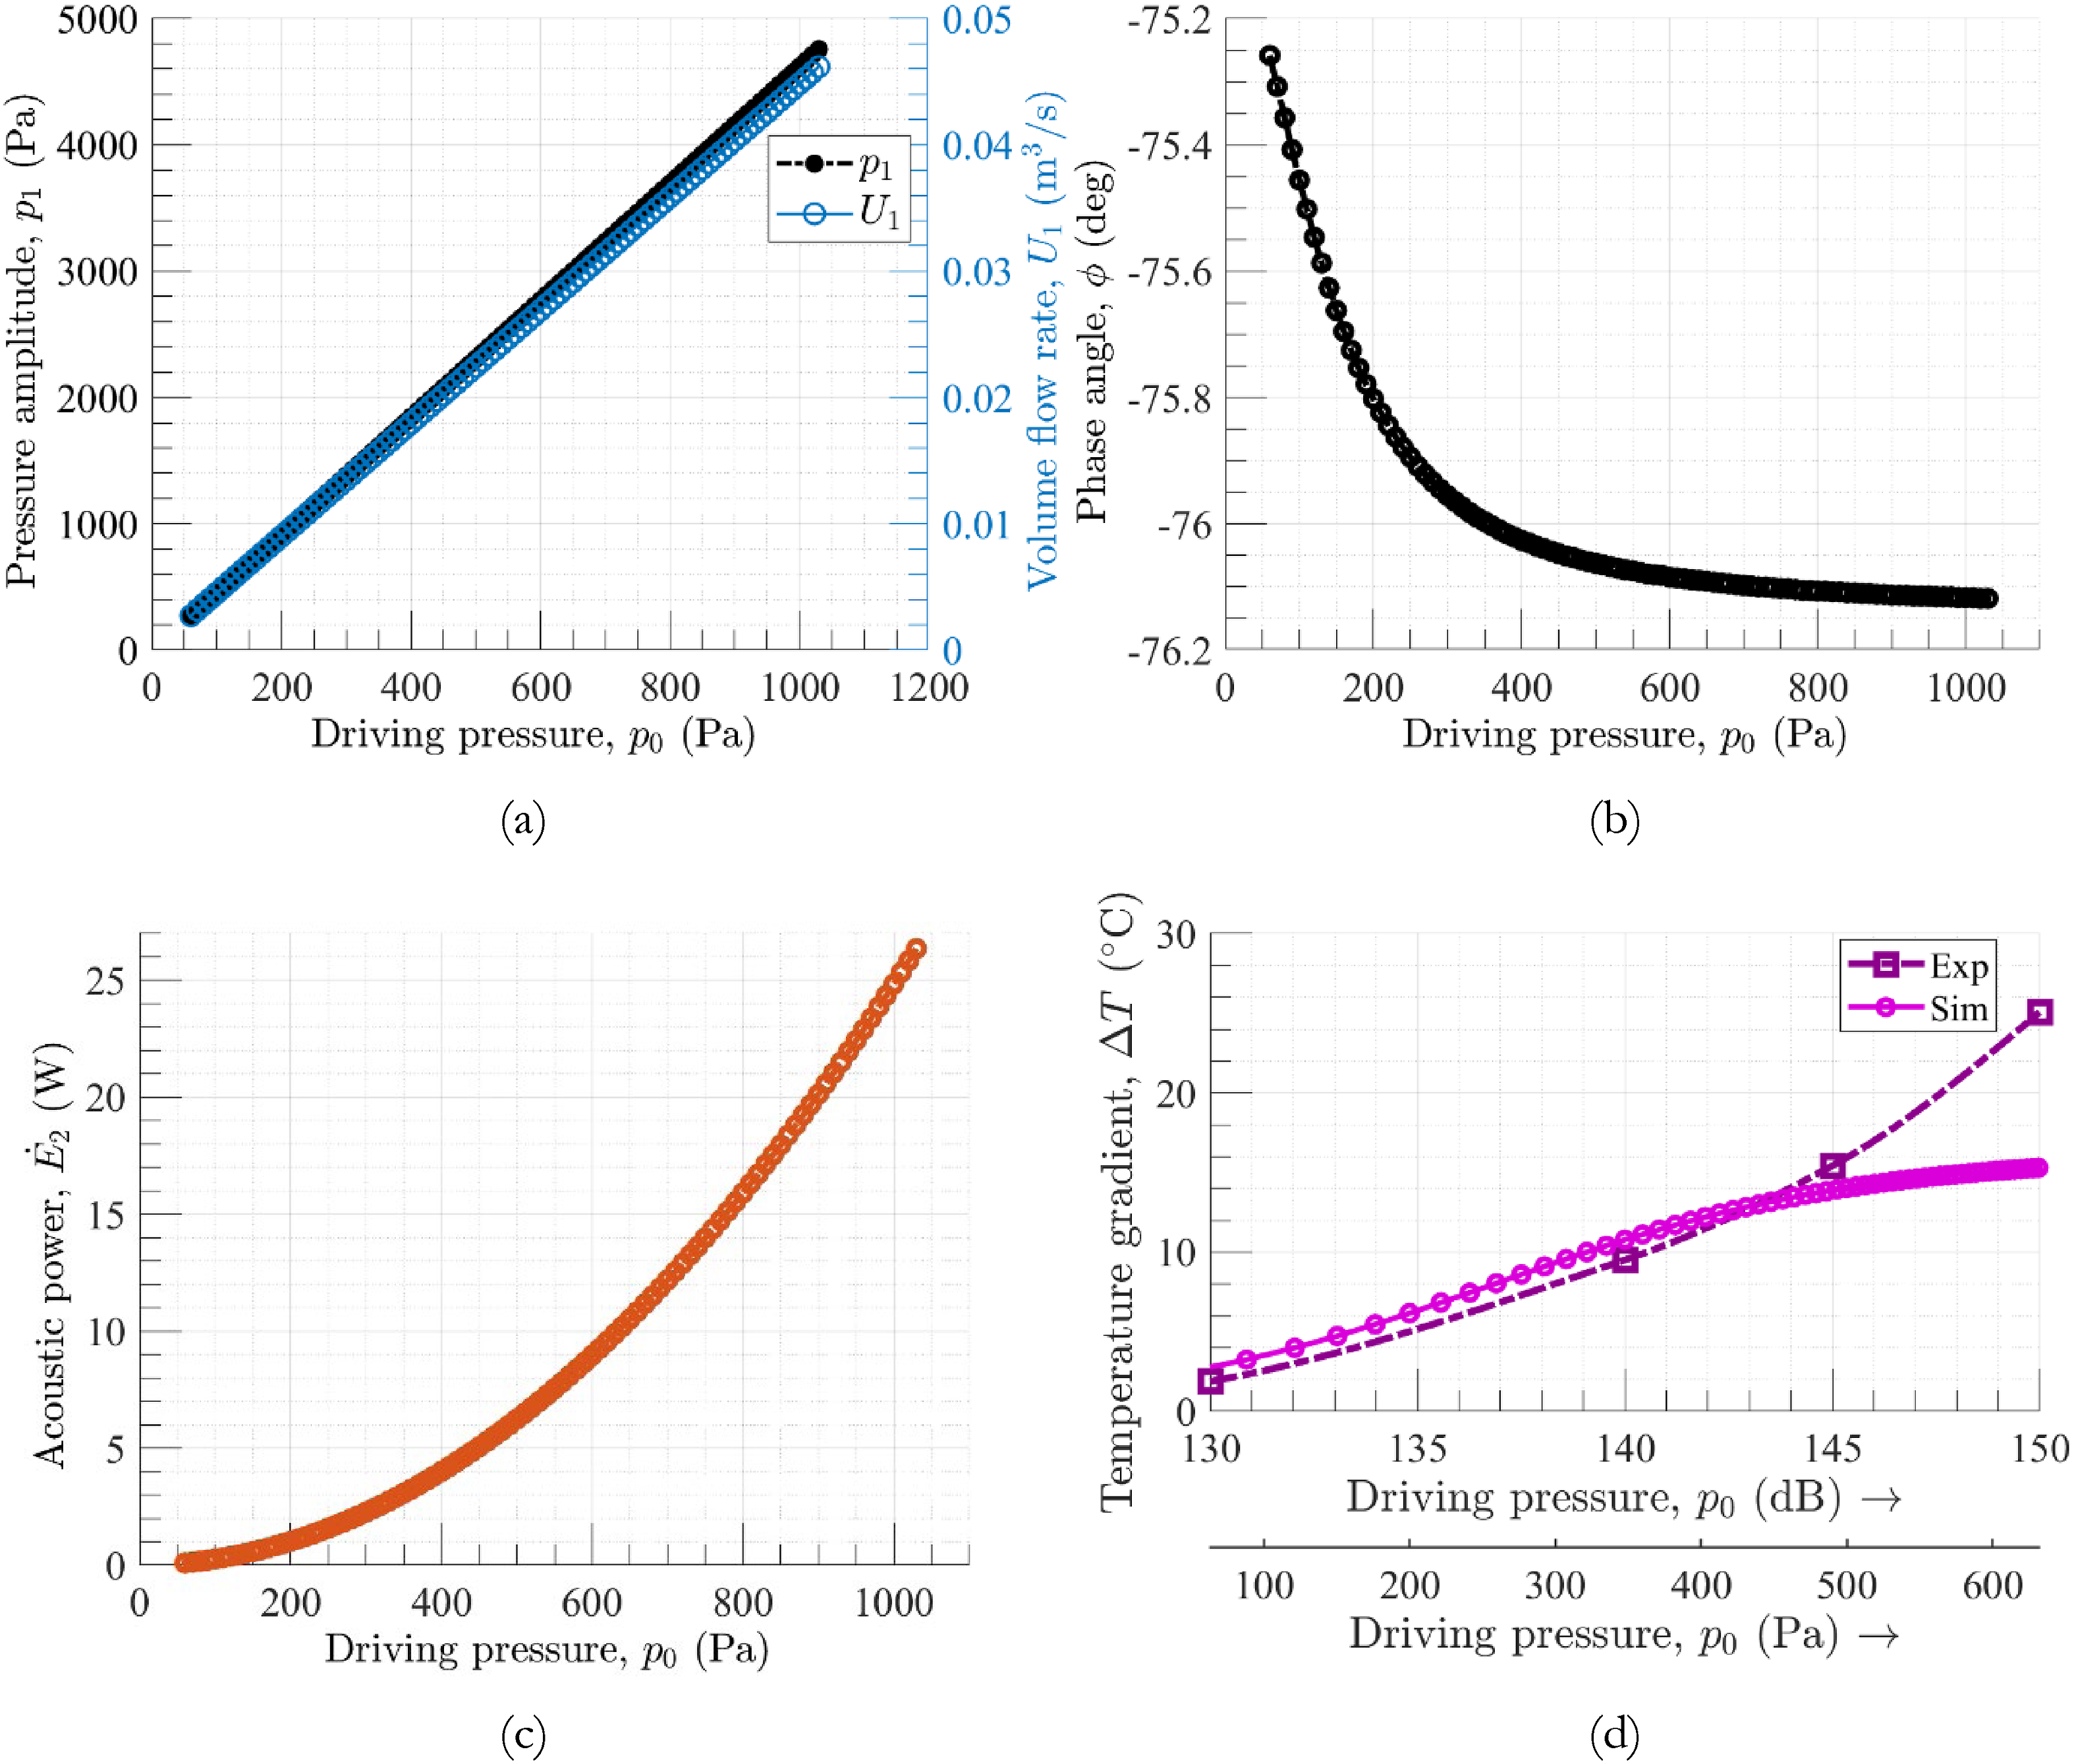
However, the experimental temperature gradient exceeds the predictions at higher driving pressures (145 and 150 dB). This deviation reinforces the possibility that viscous heating and nonlinear effects, which are not captured in the simulations, contribute significantly to the temperature gradient at higher driving pressures. This provides an opportunity to add a simple viscous heating model in conjunction with DeltaEC to capture the temperature gradient predictions at higher driving pressures more accurately.
It is also to be noted that for Rott’s linear approximation, thermoacoustic parameters are accurately predicted for acoustic Mach numbers (particle velocities) up to 0.1. Figure 14 displays the predicted thermoacoustic parameters as a function of the drive ratio, which is the ratio of the peak pressure amplitude at the leading stack-face to the mean pressure. To fit with the assumption of linearity in DeltaEC, it is recommended that the drive ratio be less than 3%, which can be achieved by having an acoustic Mach number (M) less than 0.1 and a Reynolds number (Ry) less than 500.
49
As shown in Figure 14, the simulation correlates well with experiment up to 3% drive ratio but deviates above this value indicating the influence of nonlinear effects. (a) Simulated acoustic power at leading stack face and (b) comparison of simulated and experimental temperature gradient, as a function of drive ratio.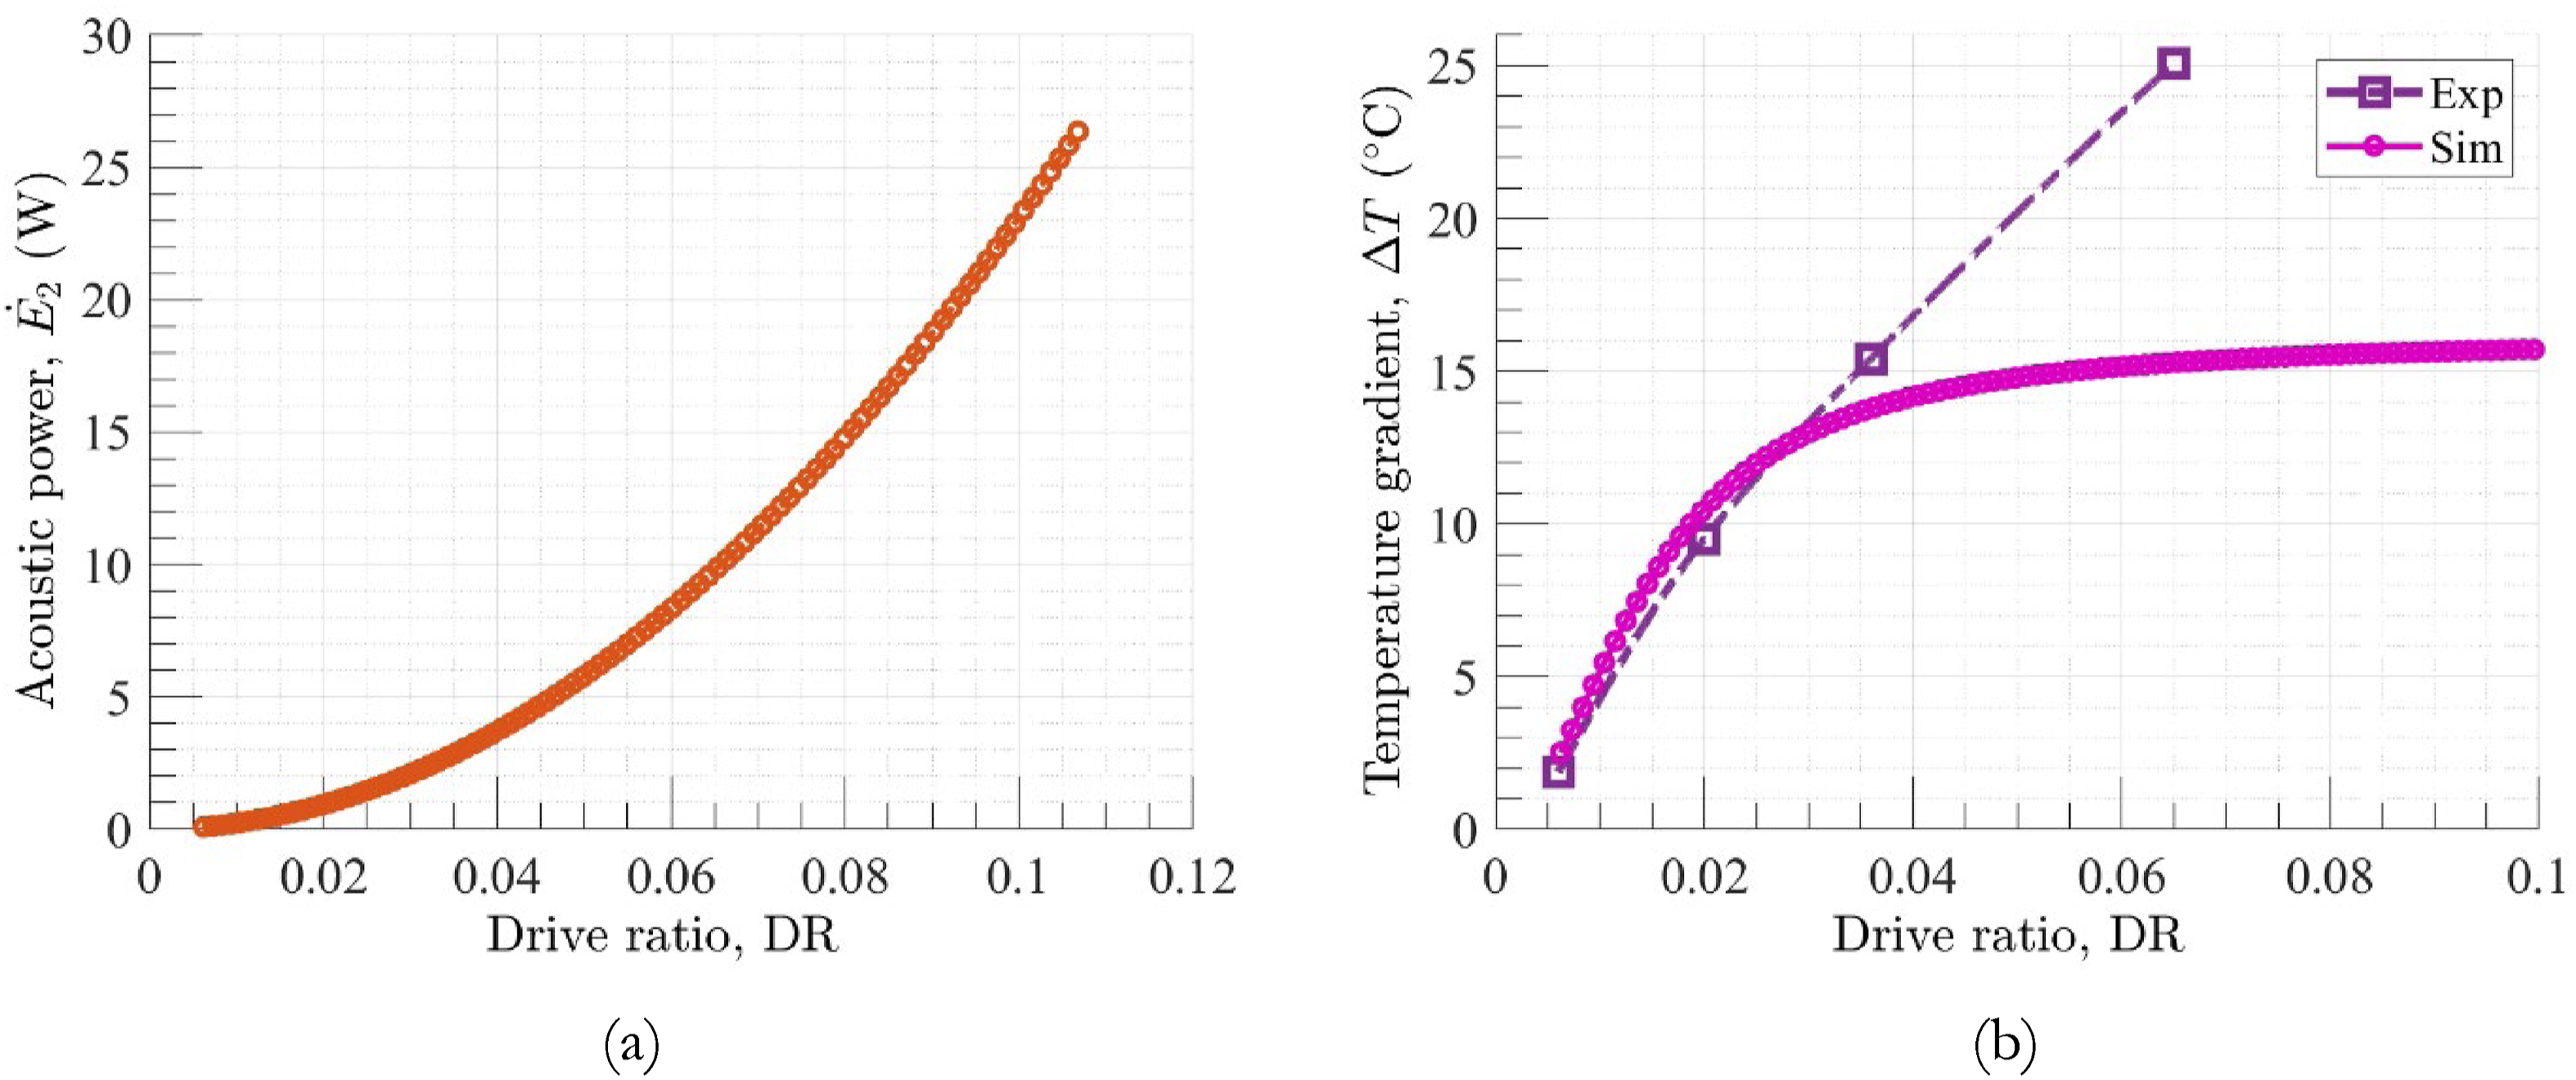
Absorption and thermal gradient
Figure 15 shows the comparison of the simulated and experimental temperature gradient and acoustic parameters as a function of frequency for the thermoacoustic performance liner. The trend for the temperature gradient aligns well with the simulations, although they tend to overpredict the gradient, likely due to unaccounted experimental losses. In the same frequency range, the resistance shows a slight drop and the reactance increases, while the absorption coefficient has an increasing trend. Simulations capture the trends favorably. Clearly, multiple reflections for the stack faces within the resonator could contribute to the primary absorption peak being associated with a shorter liner thickness and therefore resulting in the peak occurring at a higher frequency than this range. Comparison of simulated and experimental (a) temperature gradient, (b) normalized resistance and reactance and (c) absorption coefficient, as a function of excitation frequency.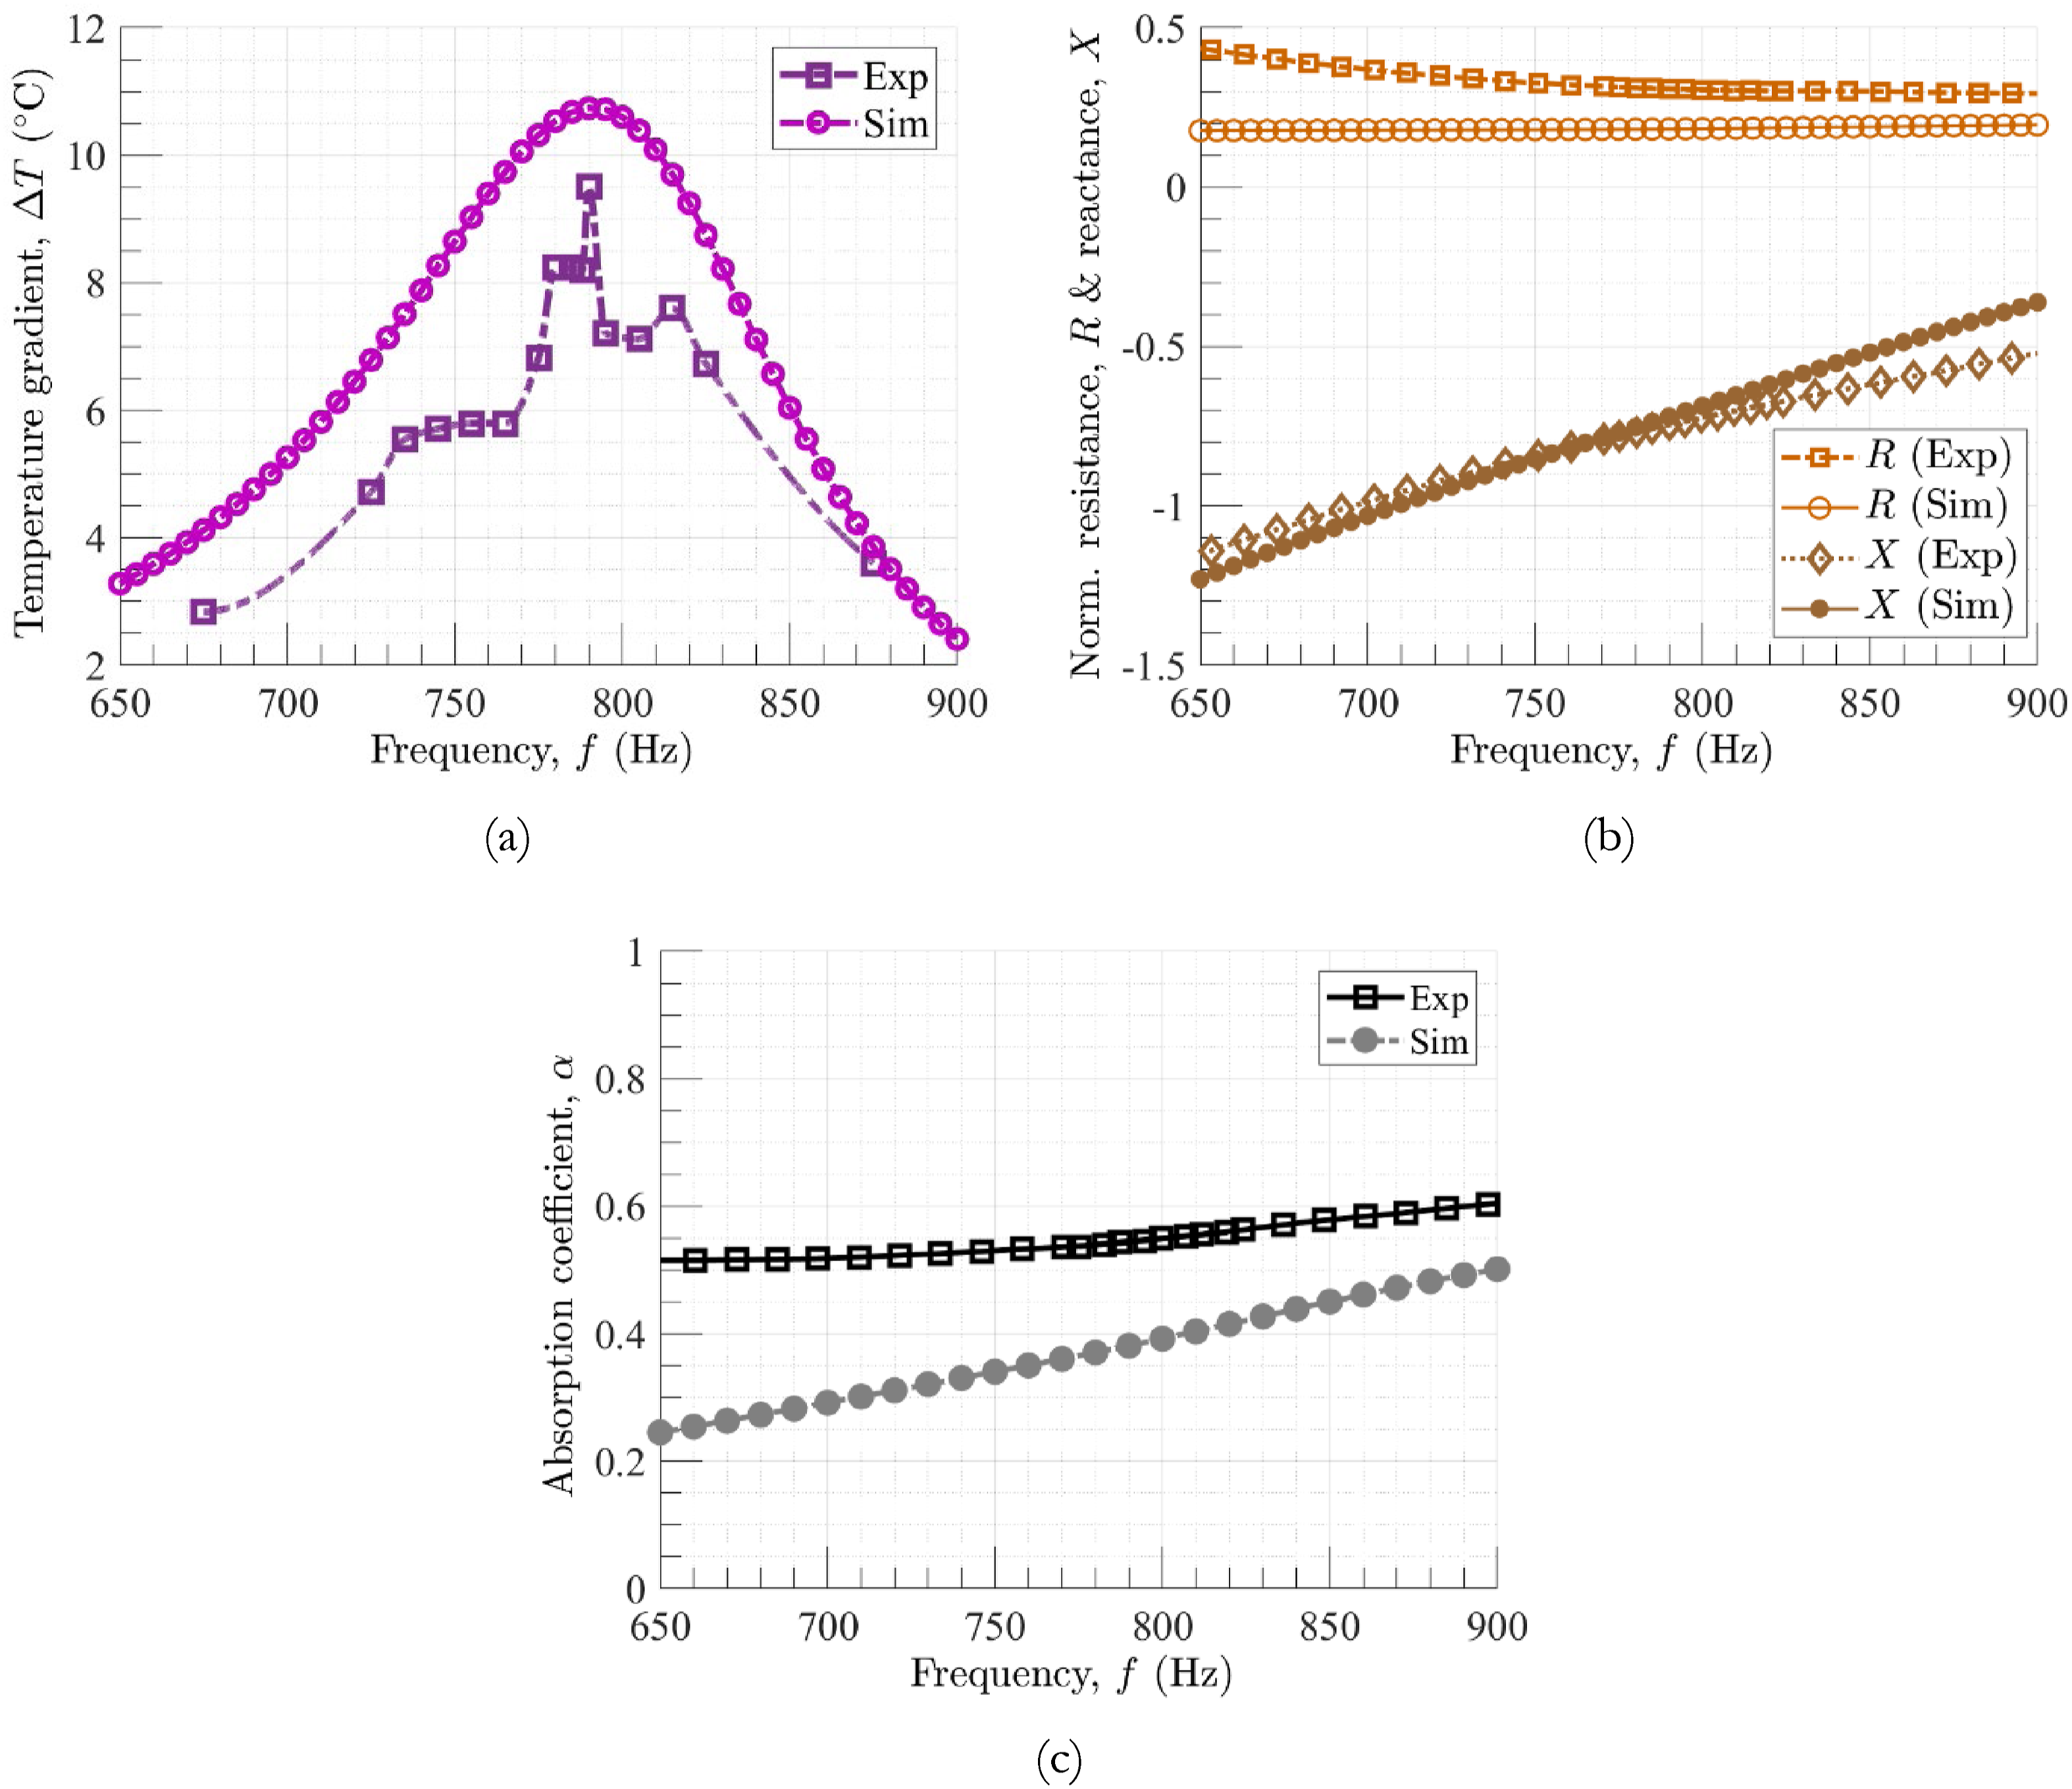
As a measure of the influence of stack position within the resonator on the absorption, comparison of simulated and experimental acoustic parameters for varying stack positions is shown in Figure 16. They generally agree well but the experimental absorption is markedly higher than the predictions, likely due to losses that contribute to the absorption. From an acoustic perspective, it seems preferable to position the additional impedance due to the stack to be closer to the driver end in order to obtain slightly better absorption. However, a balance would need to be struck with the ideal position of the stack for thermoacoustic performance (∼0.04 m) in order to extract the best combination for a specific device implementation. Relationship between acoustic absorption and stack position: Comparison of simulated and experimental results for (a) normalized resistance and reactance, and (b) absorption coefficient for different stack positions.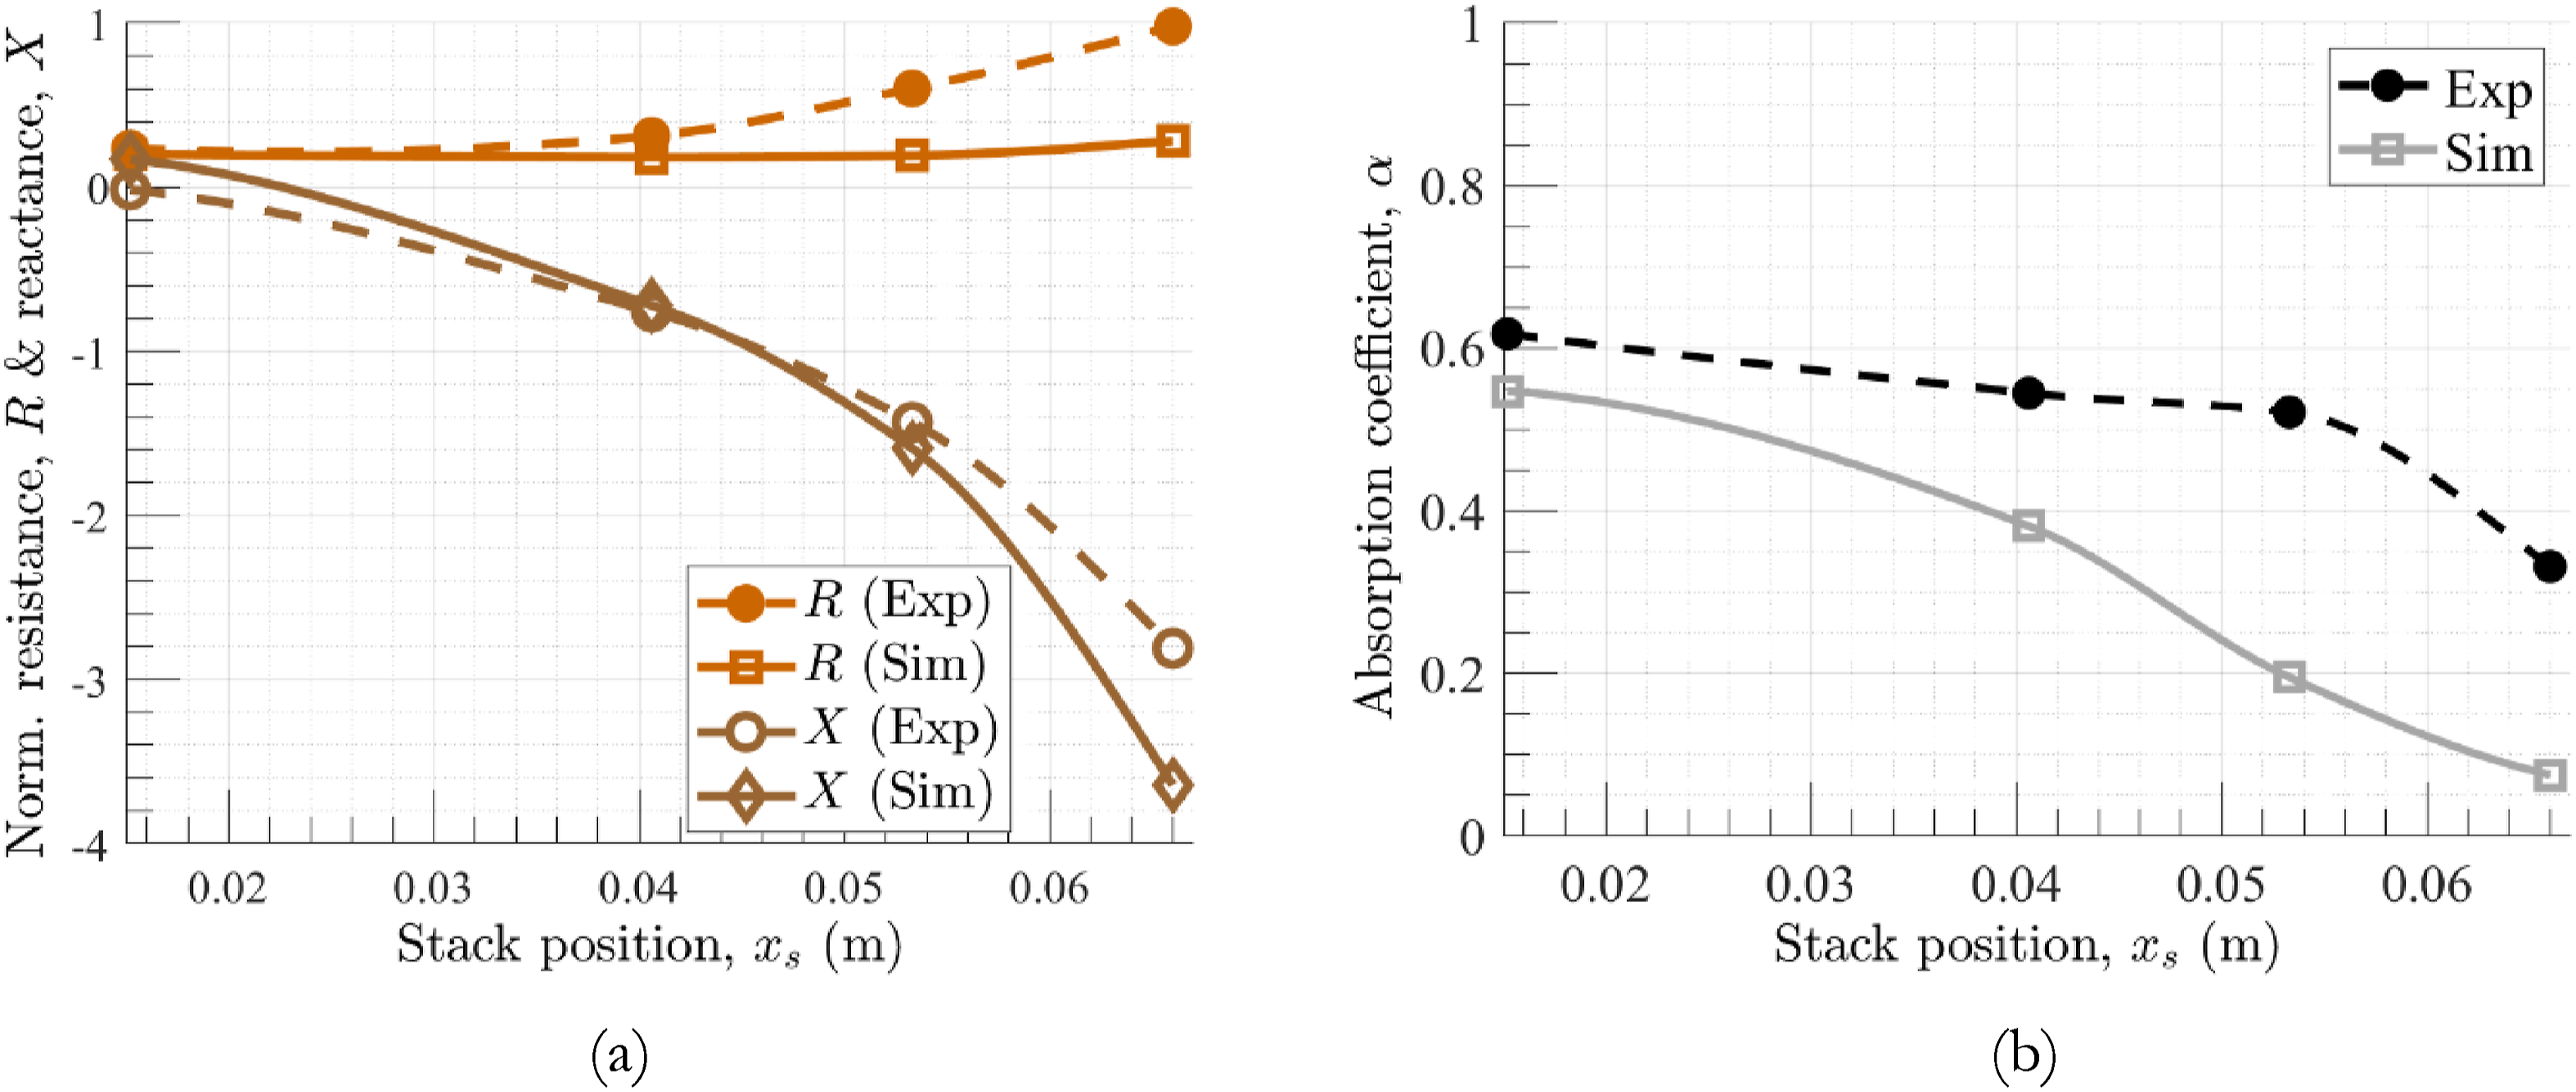
Finally, Figure 17(a) and (b) illustrate the relationship between the absorption coefficient (α) and the acoustic power ( Relationship between acoustic absorption and (a) acoustic power (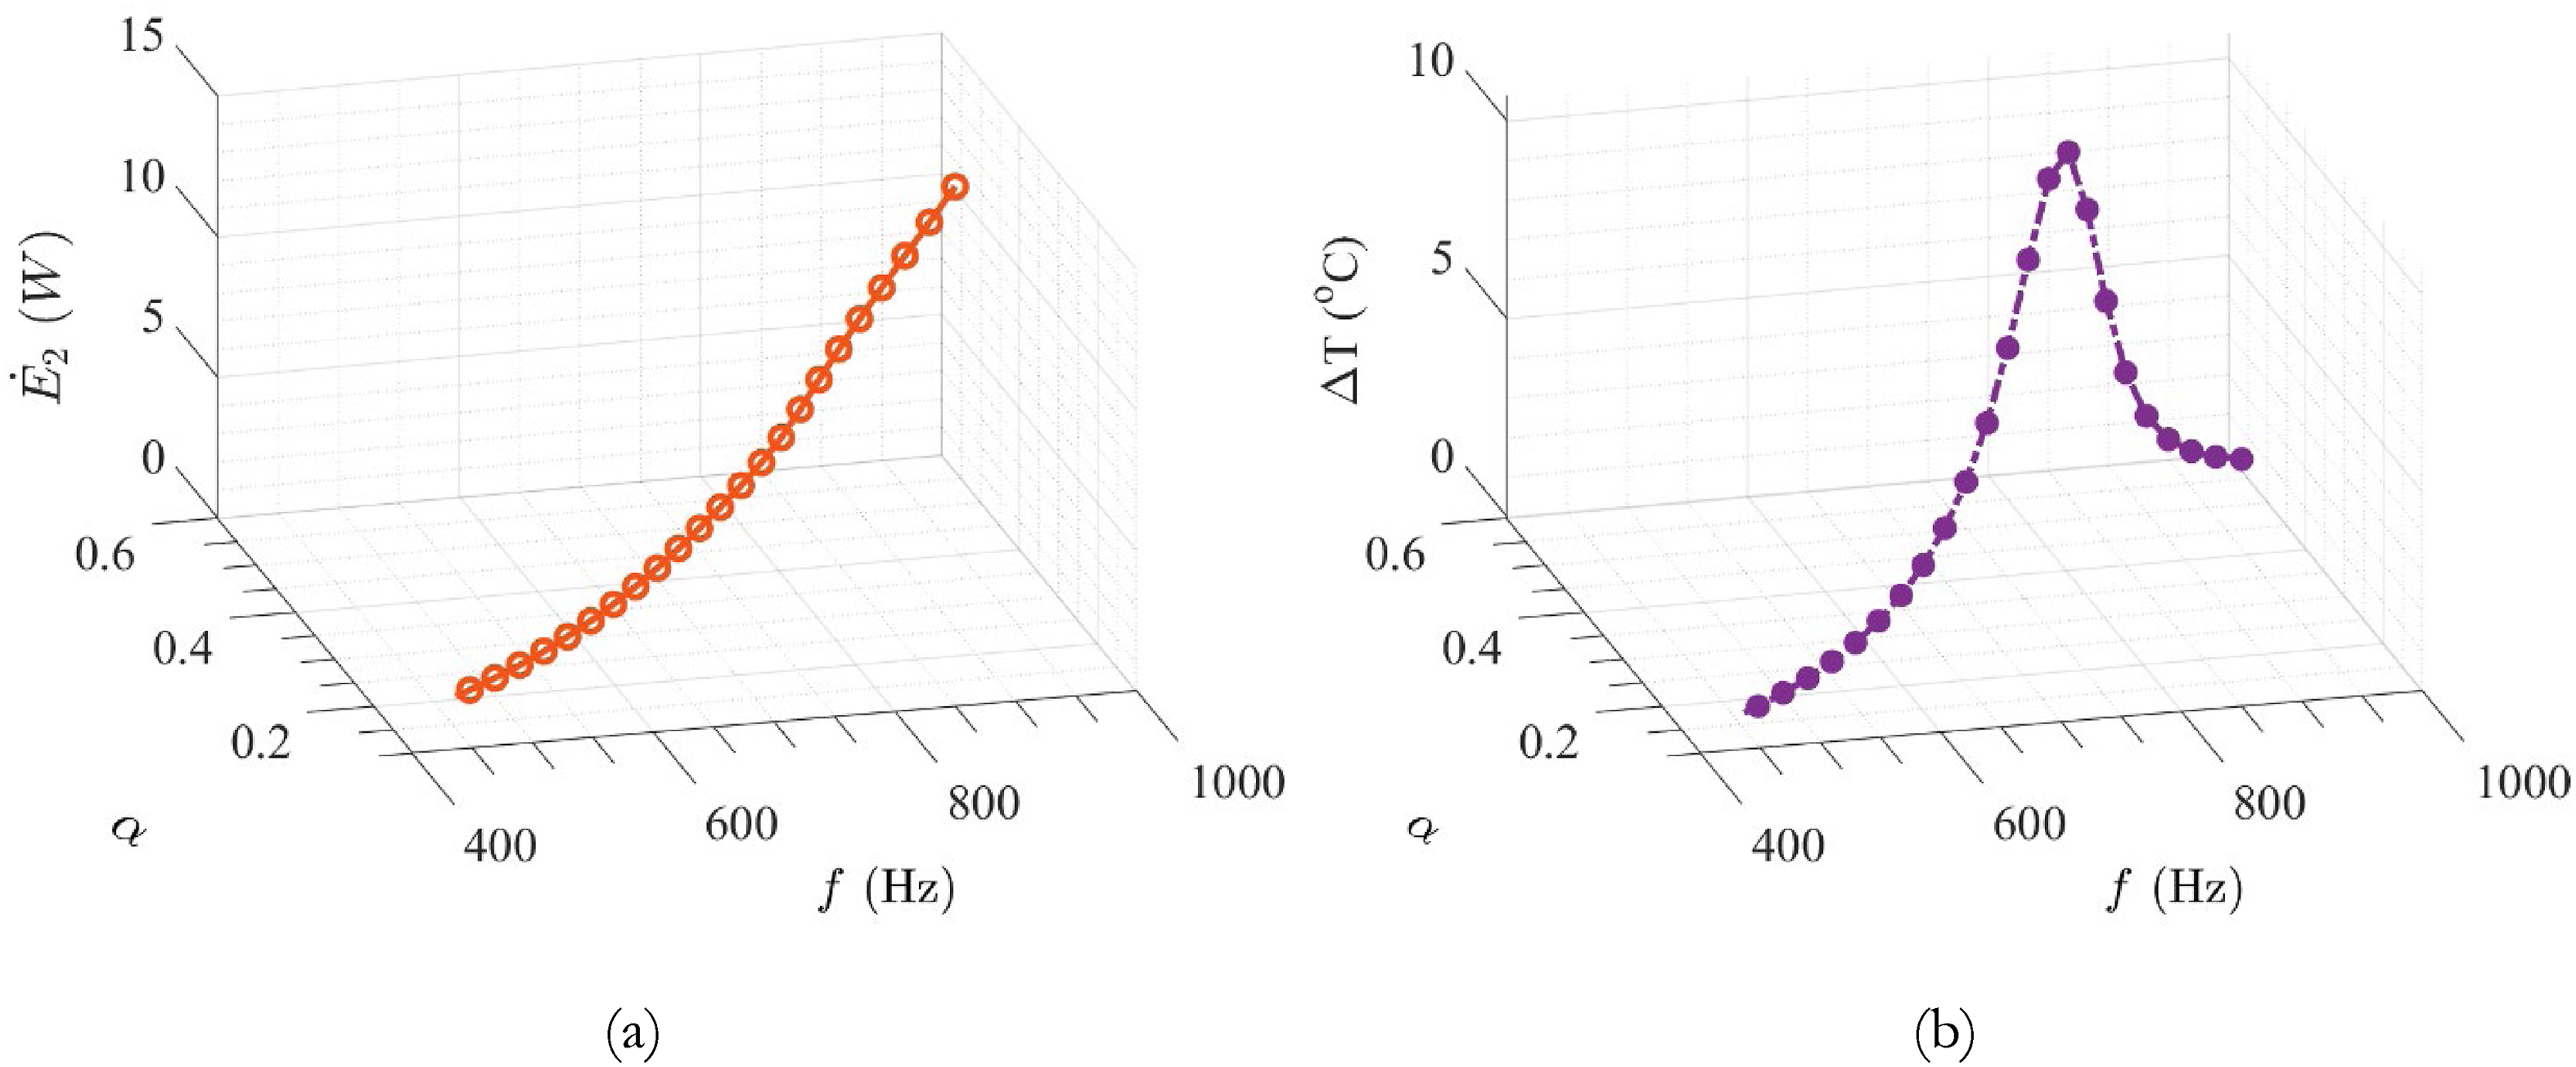
Conclusion
This study presents the characterization of a thermoacoustic liner, exploring both its acoustic and thermoacoustic response through experiments and simulations. A compact, additively-manufactured thermoacoustic liner test article was designed and fabricated by embedding a porous stack within modular waveguide sections that make up the liner. The influence of factors such as frequency, sound pressure level as well as stack length and position on the acoustic and thermoacoustic performance was considered. Experimental evaluation of the test article was conducted using the normal incidence impedance tube as per the two-microphone method. Tonal dwells to steady state confirm that the peak temperature gradient (∼9.5°C) coincided with thermoacoustic resonance (790 Hz) for the liner. For the liner configuration studied, a stack position close to the middle of the resonator was found to have the best efficiency. Simulations using DeltaEC were found to correlate well with the experimental trends, although unmodeled losses contributed to deviations. At higher excitation pressure levels, the contribution of viscous heating to the deviation in the thermoacoustic gradient was observed to be significant and needs to be modeled in conjunction with Rott’s linear approximation in order to be captured. In all cases, the acoustic power available at the leading stack-face was found to correlate positively with the thermoacoustic temperature gradient achieved. Further, the relationship between the acoustic absorption and the thermoacoustic temperature gradient was examined. It was found that in application scenarios requiring multifunctional optimization, a tradeoff may be required in terms of the absorption in order to maximize the temperature gradient.
Footnotes
Acknowledgments
Thanks are also due to the members of the staff at the Liner Technology Facility at NASA Langley for their assistance in conducting the experiments.
Declaration of conflicting interests
The author(s) declared no potential conflicts of interest with respect to the research, authorship, and/or publication of this article.
Funding
The author(s) disclosed receipt of the following financial support for the research, authorship, and/or publication of this article: This work was supported by the National Science Foundation (2033399).