
Abstract
Vibro-acoustic nonlinear wave modulations are investigated experimentally in a cracked aluminum plate. The focus is on the effect of low-frequency vibration excitation on modulation intensity and associated nonlinear wave interaction mechanisms. The study reveals that energy dissipation – not opening–closing crack action – is the major mechanism behind nonlinear modulations. The consequence is that relatively weak strain fields can be used for crack detection in metallic structures. A clear link between modulations and thermo-elastic coupling is also demonstrated, providing experimental evidence for the recently proposed non-classical, nonlinear vibro-acoustic wave interaction mechanism.
Keywords
Introduction
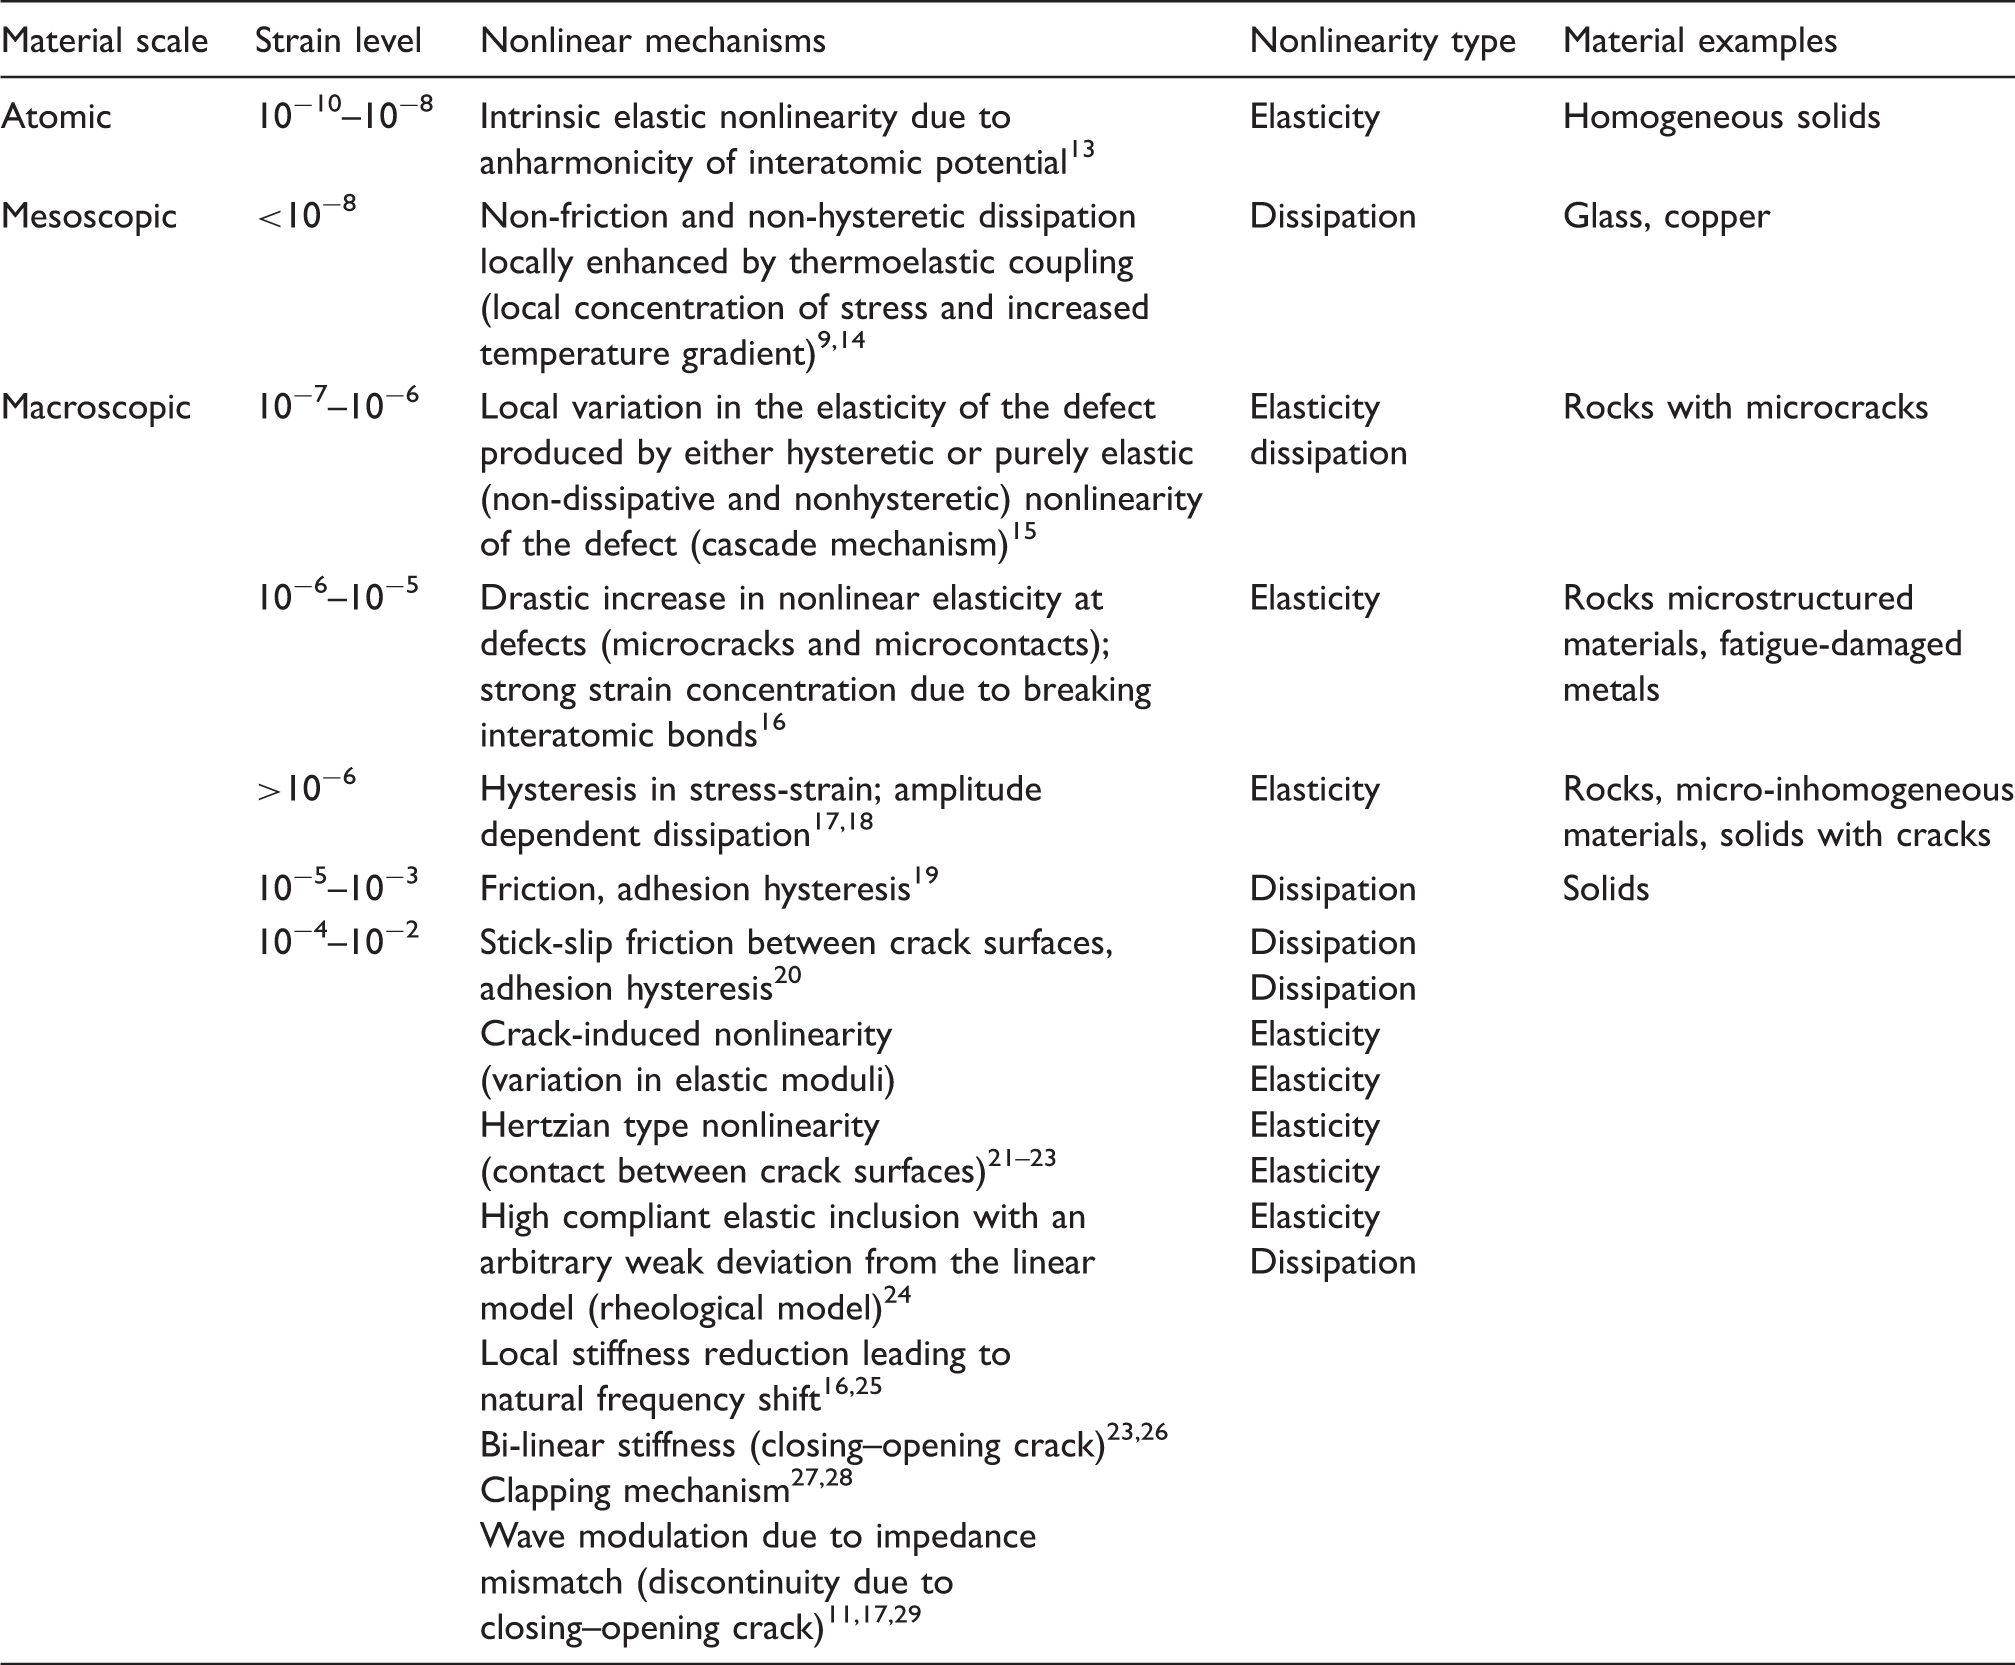
Recent years have shown interest in nonlinear vibration and acoustic phenomena for damage detection. Nonlinear acoustical phenomena can be related to various imperfections of atomic lattices (intrinsic or material nonlinearity) and/or non-symmetric thermo-elastic behavior of interfaces (e.g. cracks, contacts, rubbing surfaces). The former – a well-known intrinsic or material global nonlinearity – is investigated since early 1960s1,2 and has been used to detect material imperfections (e.g. micro-cracks in materials3,4). The latter is a local nonlinearity and has demonstrated a great interest of theoretical and applied research for the last 15 years.
Various symptoms related to nonlinear effects have been investigated. This includes time-domain signal distortions, generation of higher harmonics, frequency shifts and signal modulations. The last mentioned utilize the combined vibro-acoustic interaction of high-frequency ultrasonic wave and low-frequency vibration excitation. The general consensus from all these investigations is that nonlinear effects exhibited by cracks are stronger than crack-induced variations observed in classical linear characteristics (e.g. analysis of wave amplitude). Previous experimental work5–10 demonstrates that nonlinear phenomena are generally more sensitive to small damage severities than classical linear approaches. However, some experimental evidence shows that this is not necessarily the case.11,12
Crack-induced nonlinear mechanisms in solids
The major objective of the article is to investigate the effect of low-frequency vibration on nonlinear vibro-acoustic modulations. The article also attempts to analyze various nonlinear phenomena associated with these modulations.
The structure of the article is as follows. Section ‘Vibration and crack divergence analysis’ selects vibration modes leading to different crack perturbation actions. Modal and crack divergence analyses are performed to achieve this. Section ‘Nonlinear vibro-acoustic experiments’ presents the aluminum specimen used in experimental investigations. Nonlinear acoustic tests are reported in section ‘Experimental results and discussion’. This includes the analysis of modulation intensity. Section ‘Vibrothermographic experimental tests’ analyzes and discusses various nonlinear phenomena associated with nonlinear modulations. Finally, the article is concluded in section ‘Conclusions’.
Vibration and crack divergence analysis
In common understanding, nonlinear vibro-acoustic modulations are due to interactions between acoustic waves and crack faces caused by low-frequency vibration excitation. Modal analysis is used in this section to analyze the effect of low-frequency excitation on crack mode behavior.
Modal analysis – numerical simulations
Finite element modeling was used to analyze vibration of the rectangular 150 × 400 × 2 mm plate. The commonly used in aircraft structures Al-2024 aluminum (density – 2780 kg/m3; Young’s modulus – 72,400 MPa, Poisson’s ratio – 0.33) was selected for material of the plate. Finite element analysis was performed using ABAQUS software package. The plate was discretized into 42,300 quadrilateral 3D continuum shell SC8R elements. These 8-node hexahedron elements offer transfer shear deformation – needed in the current investigations – and are commonly used for general purpose analysis to model finite membranes. Once the element was selected and the plate discretized, modal analysis was performed up to the maximum frequency of 1000 Hz. The standard Lanczos method 30 was applied to extract natural frequencies and mode shapes of the plate.
Crack edge divergence – numerical simulations
A 73 mm crack was modeled in the center of the aluminum plate. A relatively large size of crack was selected intentionally for easy closing/opening crack action in experimental nonlinear acoustic tests. Overlapping duplicated nodes along crack lines, were used to model opening of crack faces.
31
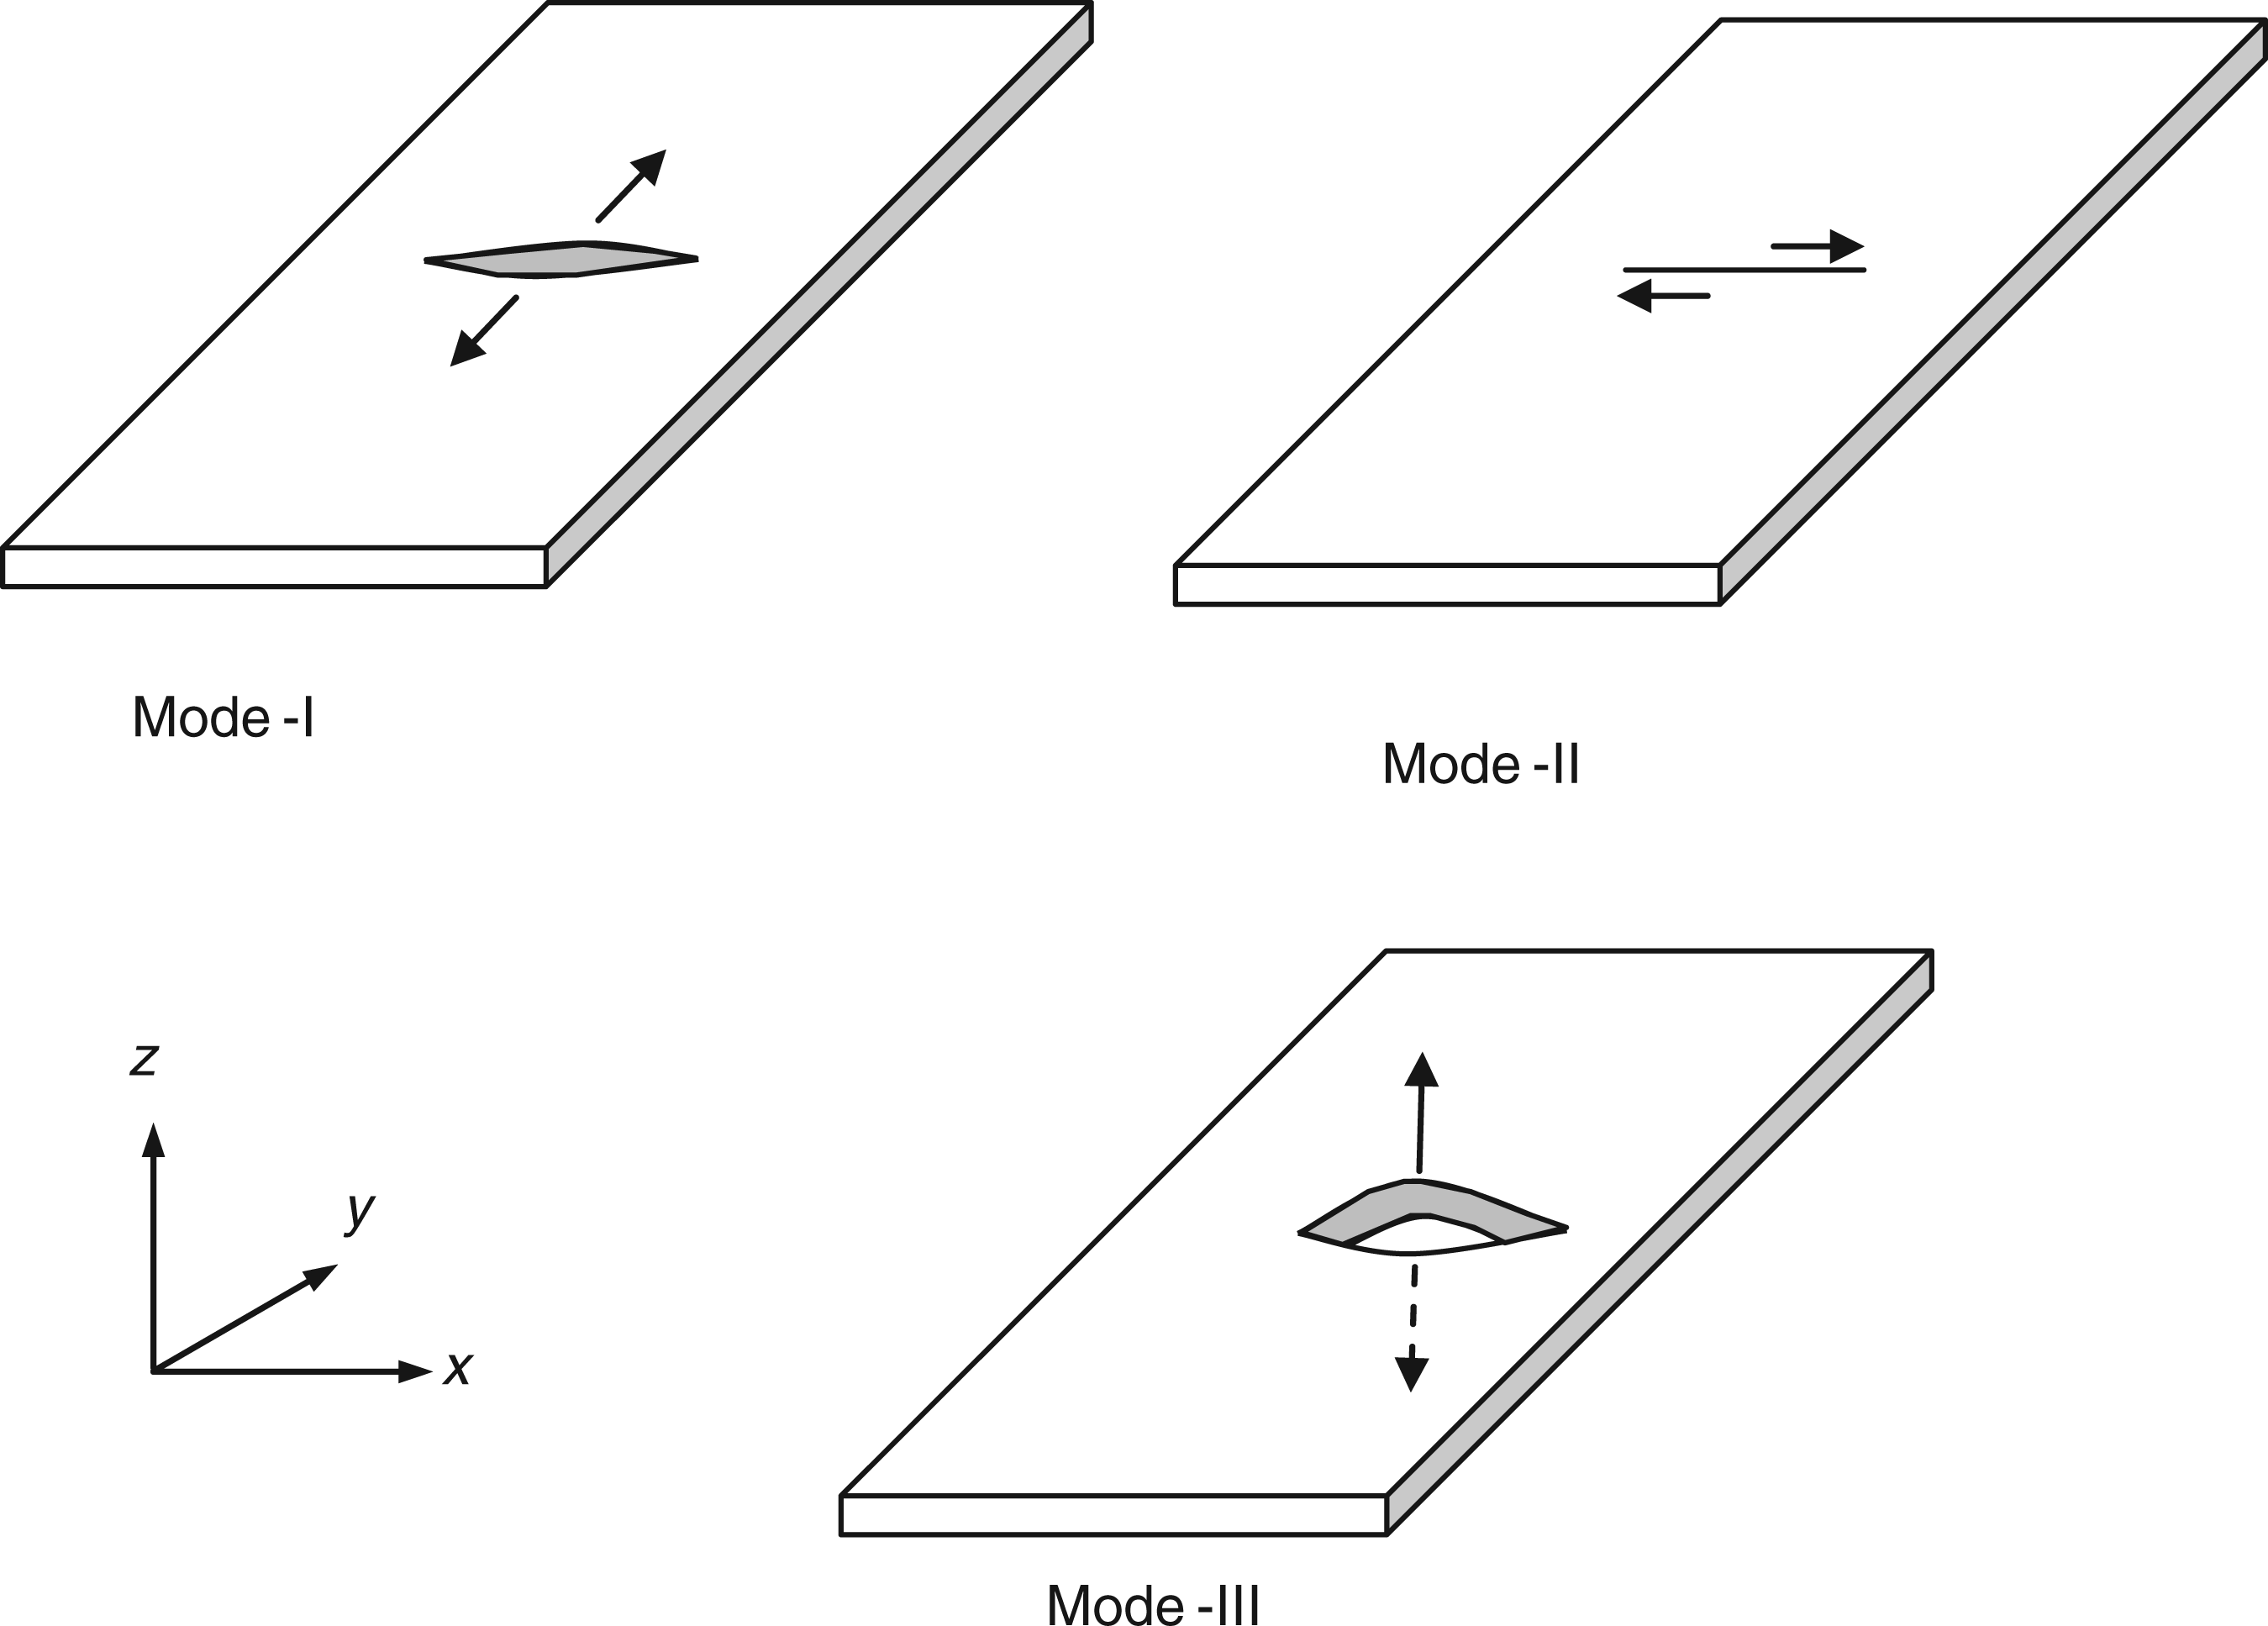
The mesh around crack tips was condensed to enable proper modeling of stress and strain fields around the crack area. Modal analysis was also performed for the cracked plate. Extracted natural frequencies were then used to excite the plate to analyze crack movement. The moving crack could exhibit three different crack modes, as illustrated in Figure 1:
Crack mode-I – crack faces move directly apart from each other (opening–closing mode); Crack mode-II – crack faces slide on each other in the direction perpendicular to the leading edge of the crack (sliding mode); Crack mode-III – crack faces move relative to each other and parallel to the leading edge of the crack (tearing mode). Three basic crack modes in plates.
Crack edge divergence (CED) was modeled using two nodal points located in the middle of opposite crack edges. The CED was analyzed for vibration excitation corresponding to all extracted mode shapes. Three different crack modes were then observed with different CED amplitude levels. However, for a given vibration mode only one dominant crack mode could be observed (i.e. a crack mode with divergence amplitude at least 10 times larger than for other modes). The largest CED amplitude for crack mode-I was obtained when the plate was excited with the frequency corresponding to the 5th, 1st and 11th. Similarly, the largest CED amplitude for crack mode-II was observed when the plate was excited with the 6th, 12th and 2nd vibration mode and crack mode-III was obtained when the plate was excited with the 10th, 13th, and 3rd vibration modes. It is important to note that the order of CED amplitude level for crack mode-II was 10 times lesser than the CED amplitude level for crack mode-I and mode-III.
Experimental modal analysis
Finite element-based modal analysis results were validated using modal testing. The rectangular 150 × 400 × 2 mm aluminum plate was used in all experimental tests. A small notch was introduced in the middle of the plate for crack initiation. The plate was instrumented with two low-profile PI Ceramic PIC 155 piezoceramic transducers of 10 mm diameter and 1 mm thickness. These transducers were attached 30 mm above and below the notch line. A PI Ceramic PL055 piezoceramic stack actuator was positioned in the anti-nodal corner area of the plate. All piezoceramic transducers were surface-bonded using the X60 fast-curing, two-component adhesive glue and wired using additionally bonded connectors. The stack actuator was used to excite the plate and the transducer was used to obtain vibration responses. A sweep sine chirps signal starting at 1 Hz and crossing 2800 Hz in 2 s was used to excite the plate. The excitation signal was generated using a two-channel TTi-TGA 1242, 40 MHz arbitrary waveform generator and amplified to the maximum level of 20 V with the PI E-505 LVPZT piezo-amplifier. Vibration response was acquired using a four-channel LeCroy Waverunner LT264, 350 MHz, 1 GS/s digital oscilloscope.
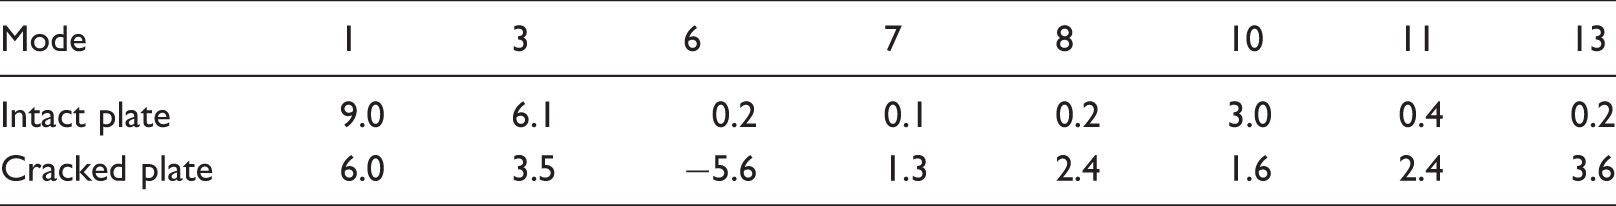
Frequency response functions (FRFs) were calculated from the experimental input and output data using MATLAB. Figure 2 shows the comparison between the experimental and simulated FRF function. The natural frequencies found experimentally for the uncracked plate are all slightly bigger than the natural frequencies calculated in simulation. This might be because of the piezoelectric transducer surface-bonded to the plate (locally stiffen plate). Nevertheless, the result shows relatively good agreement with respect to the excited and identified natural frequencies. Fatigue testing was used to initiate a crack in the middle of the plate. The test was performed until the crack reached 73 mm. The plate was then modally tested. Table 2 gives the percentage error between experimentally excited and finite element-identified natural frequencies for uncracked and cracked aluminum plate and the FRF bandwidth analyzed. The maximum 9% and 6% errors were obtained for the 1st vibration mode when the uncracked and cracked aluminum were analyzed, respectively.
Frequency response function for the uncracked plate. Percentage error between experimental and finite element-simulated natural frequencies for the undamaged and cracked plate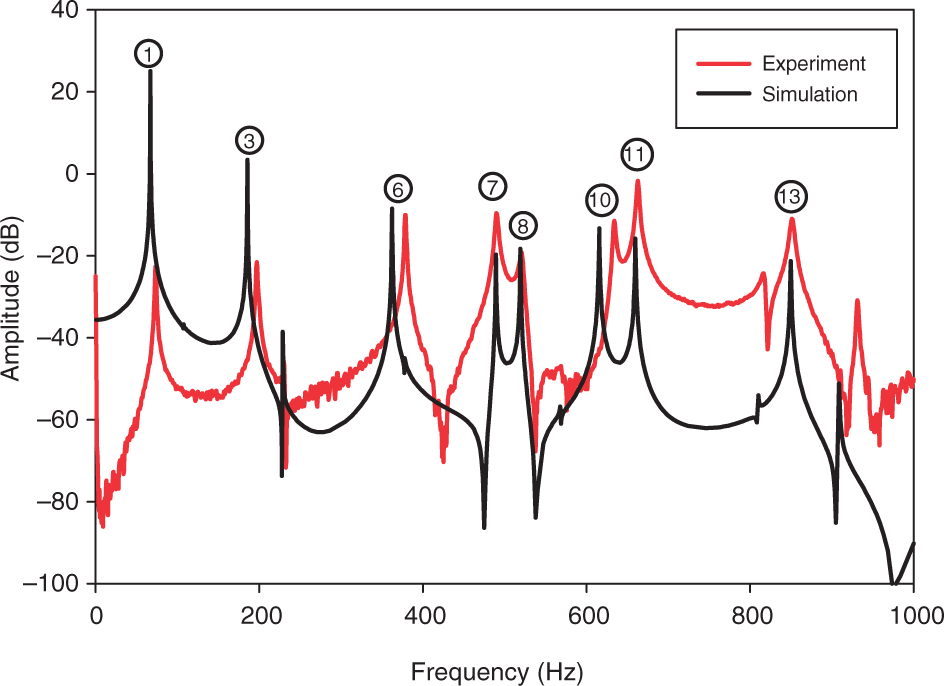
Selection of vibration excitation frequencies for nonlinear acoustics
Following the analysis performed in sections ‘Modal analysis – numerical simulations’ to ‘Experimental modal analysis’, the frequencies corresponding to the 1st, 3rd and 6th vibration modes (illustrated in Figure 3) of the cracked plate were selected for low-frequency modal excitation in nonlinear acoustic tests performed in section 3. The criteria for selection were very clear. Firstly, the selected frequencies corresponded to the first three vibration modes excited experimentally and correctly identified using numerical simulations. Secondly, the selected vibration modes produced three different crack modes. The 1st, 3rd and 6th vibration modes introduced CED corresponding to crack mode-I, mode-III and mode-II, respectively. It is clear that various crack modes produce different crack edge behavior with respect to closing/opening action, friction, stiffness and thermo-elasticity. This in turn could have an important effect on the interaction between the crack and acoustic wave, i.e. vibro-acoustic wave modulation investigated in the next sections.
Three vibration modes selected for experimental analysis of vibro-acoustic modulations.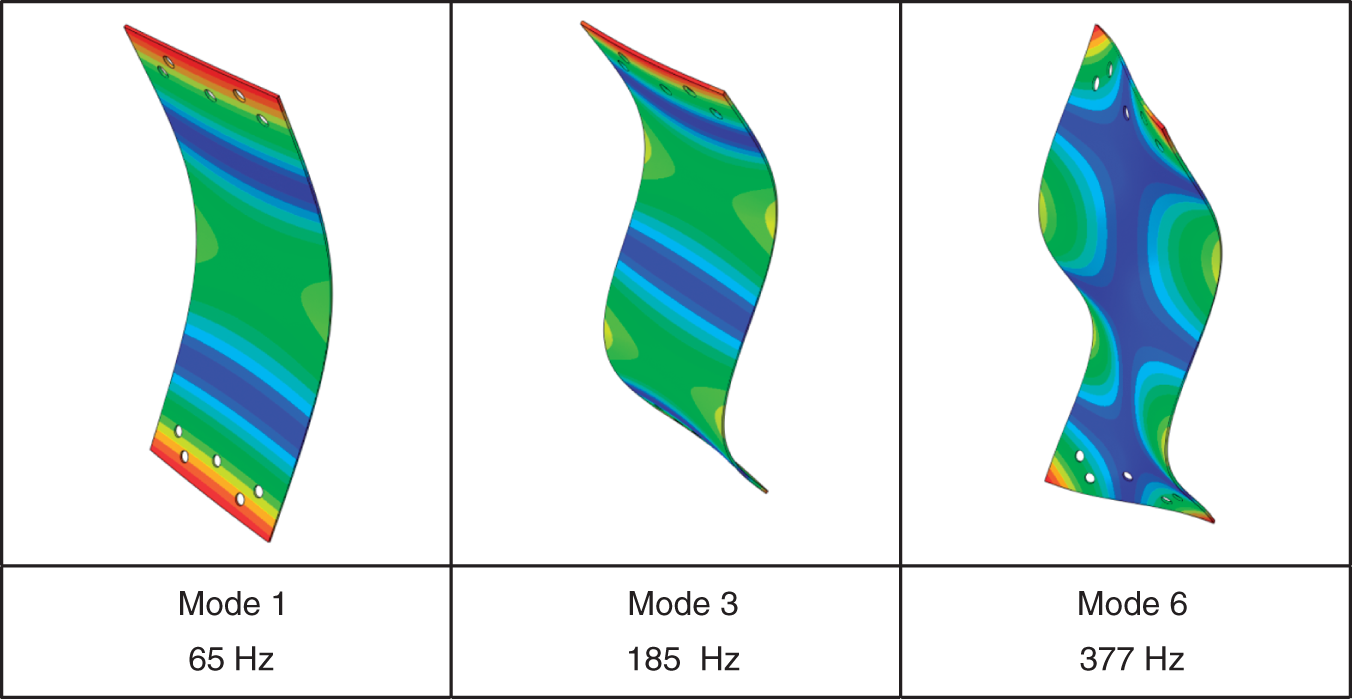
Nonlinear vibro-acoustic experiments
This section reports a series of experimental tests performed to analyze vibro-acoustic nonlinear modulations. Experimental arrangements, procedures and the analysis of strain field – associated with low-frequency vibration and high-frequency acoustic excitations – are described.
Experimental arrangements
The cracked aluminum plate was freely suspended using elastic cords to avoid nonlinearities from boundaries. Low-frequency vibration and high-frequency ultrasound signals were used for excitation. The plate was modally excited (low-frequency excitation) using a Robotron electromagnetic shaker. Single harmonic excitation was applied using one of the frequencies corresponding to the 1st (65 Hz), 3rd (185 Hz) and 6th (377 Hz) vibration modes. Different amplitude constant levels of low-frequency excitation were used ranging from 0.25 to 10 V. Once the plate was modally excited, one of the PI Ceramics PIC155 transducers was used to introduce simultaneously a 60 kHz sine wave (high-frequency excitation). The amplitude of high-frequency excitation was also constant and varied from 10 to 200 V for different tests. Both, i.e. low-frequency and high-frequency excitation signals were generated using an EC Electronics PAQ 16000D signal generator. A Polytec PSV laser was used for non-contact measurements of acoustical responses. Figure 4 shows the entire experimental arrangement.
Experimental set-up for the nonlinear vibro-acoustic tests.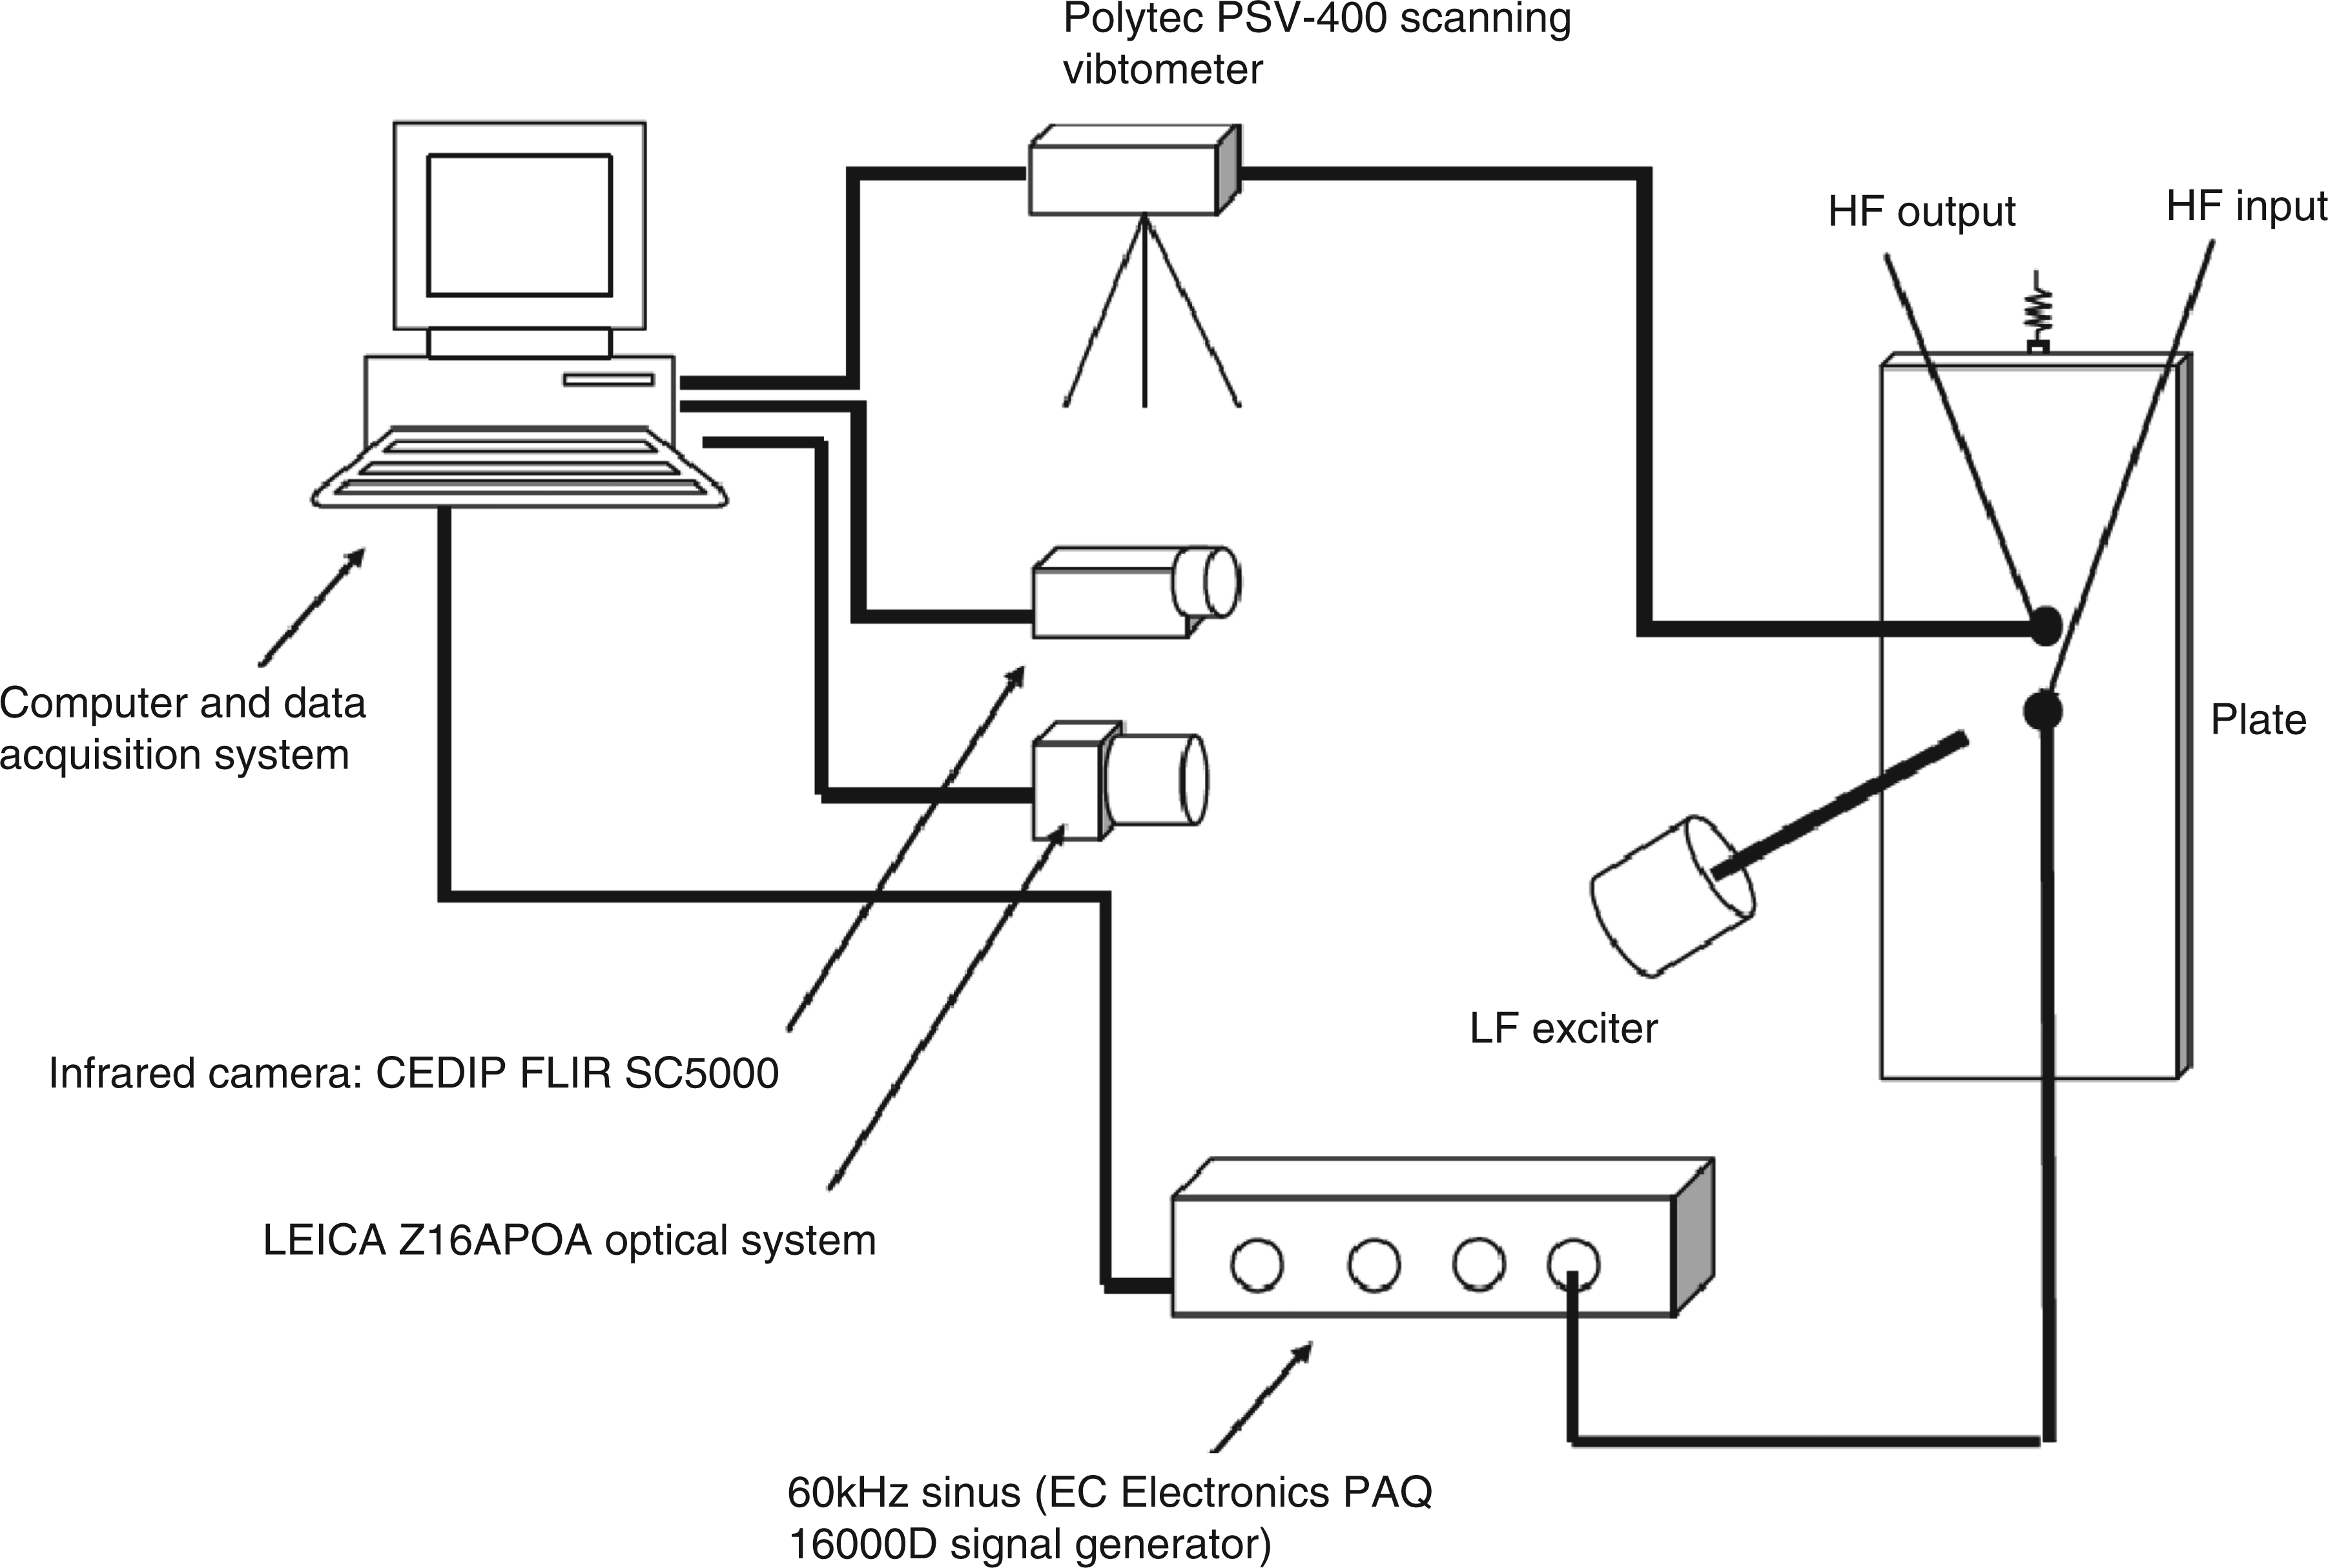
Harmonic distortion analysis was performed for the low-frequency and high-frequency excitation to avoid nonlinearities associated with the instrument chain used. The total harmonic distortion coefficient for all tested configurations and frequency/amplitude ranges was much less than 1%.
Strain field analysis
A series of tests was performed to estimate the strain field associated with low-frequency and high-frequency excitations in the vicinity of the crack. A Dynamic ICP piezoelectric strain gauge was used to monitor the strain field associated with the modal low-frequency excitation. The minimum and maximum levels of strain – equivalent to 0.25 and 10 V amplitudes – were of 10−6 and 10−4 order, respectively, in the vicinity of the crack. The strain level associated with the high-frequency excitation was estimated using two approaches, i.e. a Kirchhoff model of the plate with a bonded PZT 10 and far-field strain estimation based on velocity measurements 32 with a Polytec PSV laser. The experimental approach (velocity measurements) resulted in strain values approximately 40% larger than the model-based approach, as expected (the work presented in Ref. 32 shows that the experimental method overestimates strain levels). Nevertheless, the minimum and maximum levels of strain – equivalent to 10 and 100 V amplitudes – were of 10−9 and 10−8 order, respectively, in the vicinity of the crack.
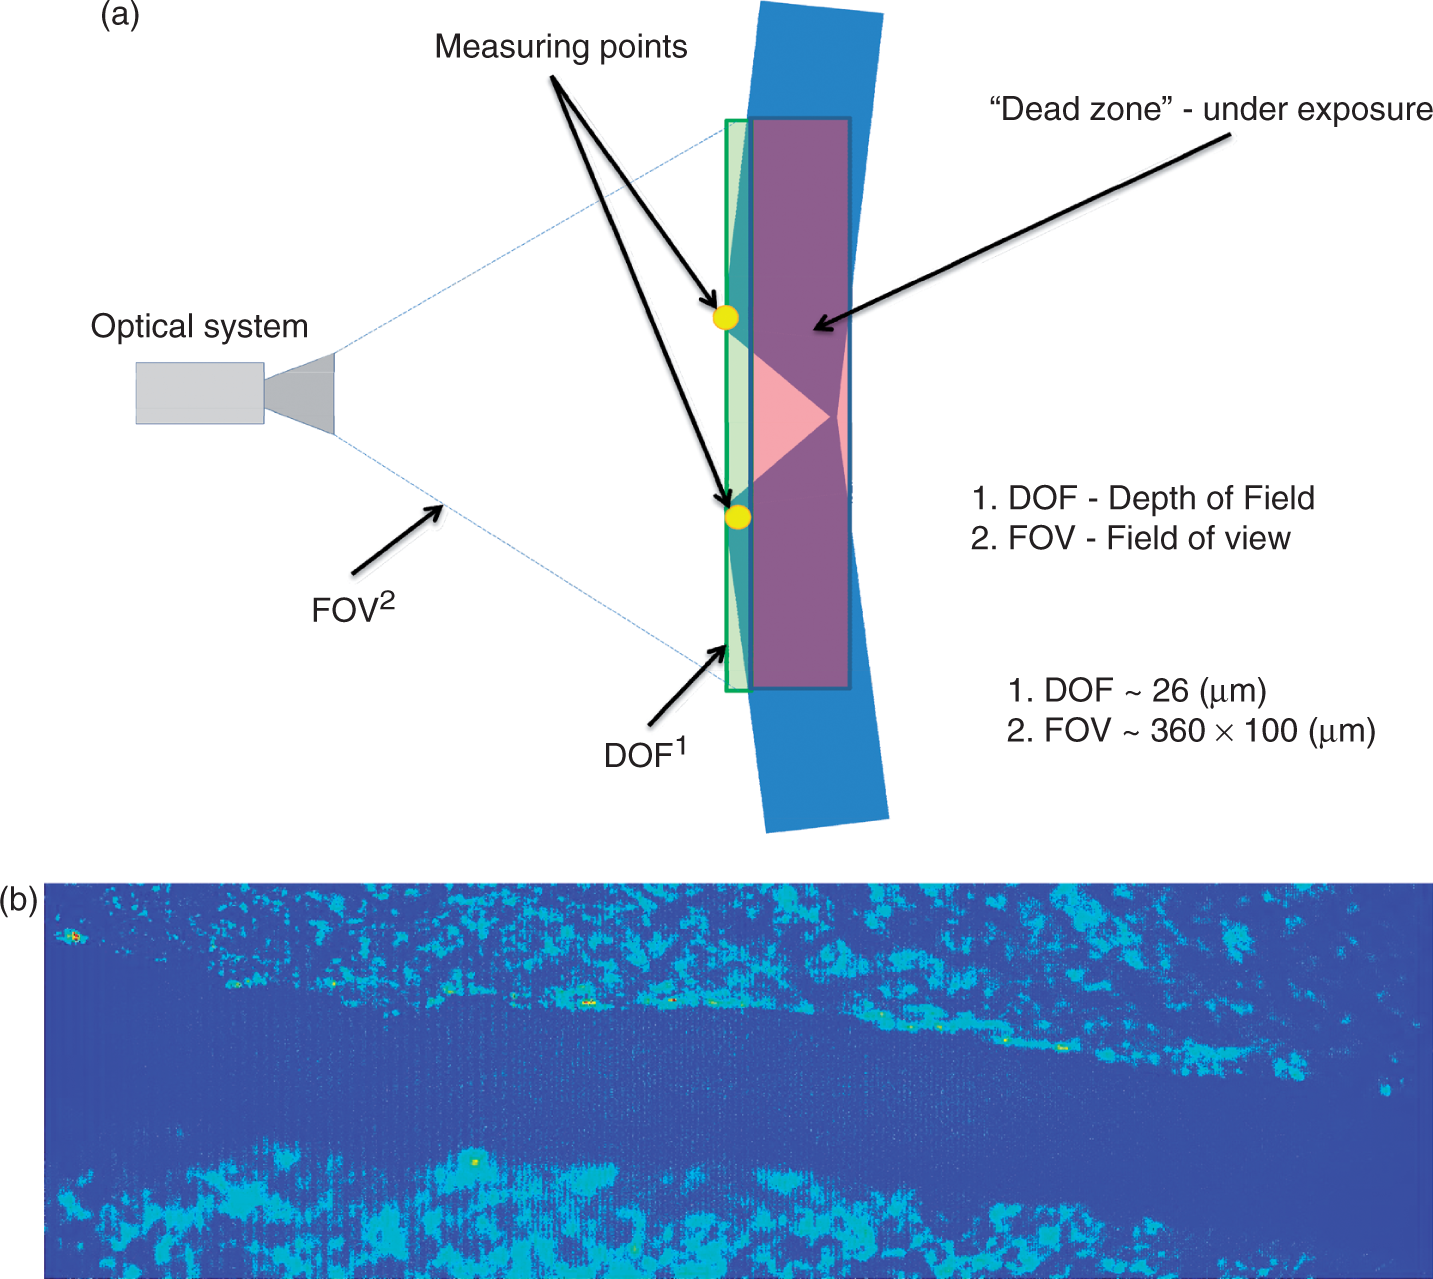
A classical compliance test was performed to monitor the crack opening–closing action for different levels of low-frequency excitation. Two dynamic ICP piezoelectric strain gauges, one across the crack and one away from the crack, were used in this test. The opening action of the crack started for the 6 ÷ 7 V low-frequency excitation level (equivalent to 1.2 ÷ 1.4 · 10−6 strain level), as shown in Figure 5. A Leica MVD1024E-40-CL camera was used additionally in a ‘lock-in’ mode to monitor crack opening action. The maximum crack opening was equal to 5 µm. However, the crack was never fully open, as illustrated in Figure 6.
Compliance test results – strain level for different amplitudes of low-frequency excitation. Crack opening analysis using camera imaging: (a) experimental arrangements illustrating crack opening and optical measurement; (b) photograph of the open crack.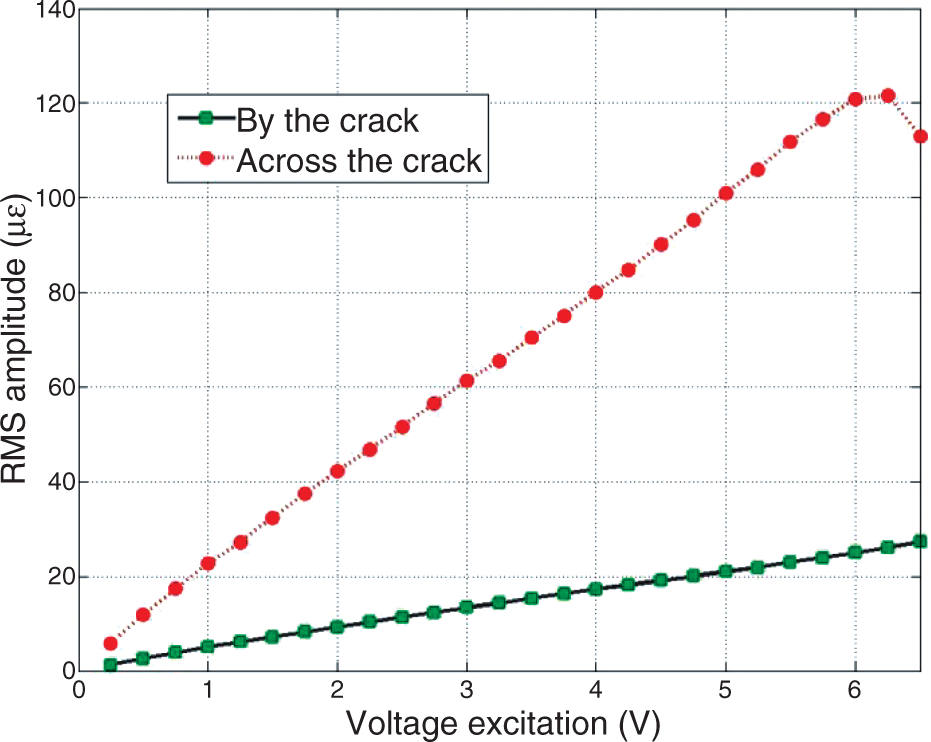
Nonlinear acoustic test
Nonlinear acoustics tests were performed following the arrangements described in the previous section. Firstly, the 60 kHz ultrasonic signal (high-frequency excitation) was introduced to the plate. The amplitude of this signal was equal to 200 V. The plate was simultaneously modally excited (low-frequency excitation) using various amplitude levels. Modulated responses were acquired and the Fourier analysis was applied to obtain power spectra. Figure 7 gives an example of the power spectrum for the 6 V low-frequency excitation amplitude.
Example of power spectrum example illustrating vibro-acoustic modulations.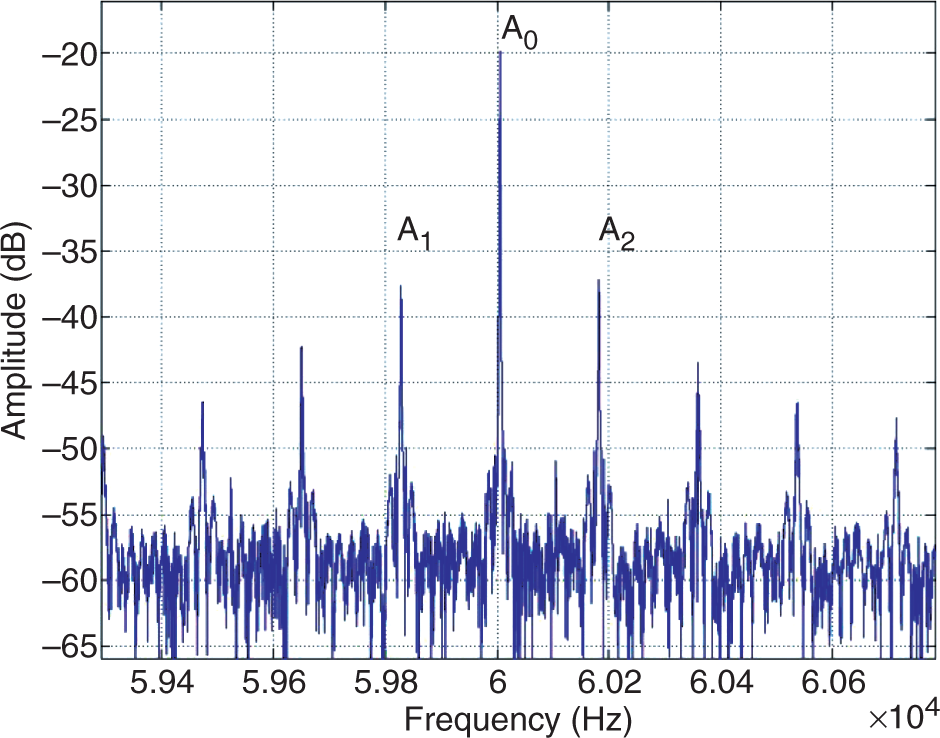
Experimental results and discussion
The experimental results from nonlinear acoustic tests are presented in this section. Firstly, the intensity of modulation is analyzed for various levels of low-frequency excitation. Then higher harmonics and modulation sidebands are investigated to reveal possible nonlinear mechanisms behind these modulations.
Vibro-acoustic modulation intensity
The intensity of modulation was monitored using the parameter R defined as
Modulations intensity for different levels of low-frequency excitation.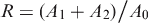
It is important to note here that modulation sidebands were also observed for the uncracked plate probably due to intrinsic (often called inherent or parasitic nonlinearities), as previously observed in many investigations. However, the number of sidebands and their amplitude level were much lower than for the cracked plate. This problem is not investigated in the current article.
Analysis of higher harmonics and modulation sidebands
It is well known that generation of harmonics and modulation sidebands in power spectra are sign of nonlinearity. Therefore, response spectra obtained from vibro-acoustic nonlinear tests were used to reveal possible mechanisms associated with crack-induced nonlinearities. The results from these investigations are presented in Figures 9 and 10.
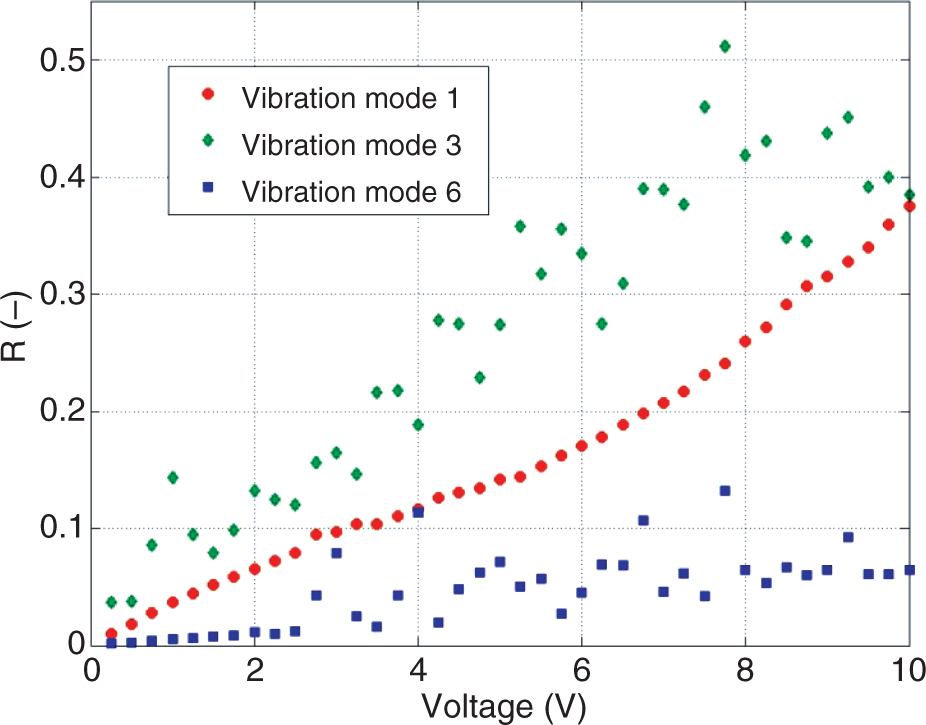
Analysis of low-frequency harmonics amplitude: (a) 1st vibration mode; (b) 3rd vibration mode; (c) 6th vibration mode. Vertical dashed lines indicate the area crack opening. Analysis of modulation sidebands amplitude: (a) 1st vibration mode; (b) 3rd vibration mode; (c) 6th vibration mode. Vertical dashed lines indicate the area crack opening.
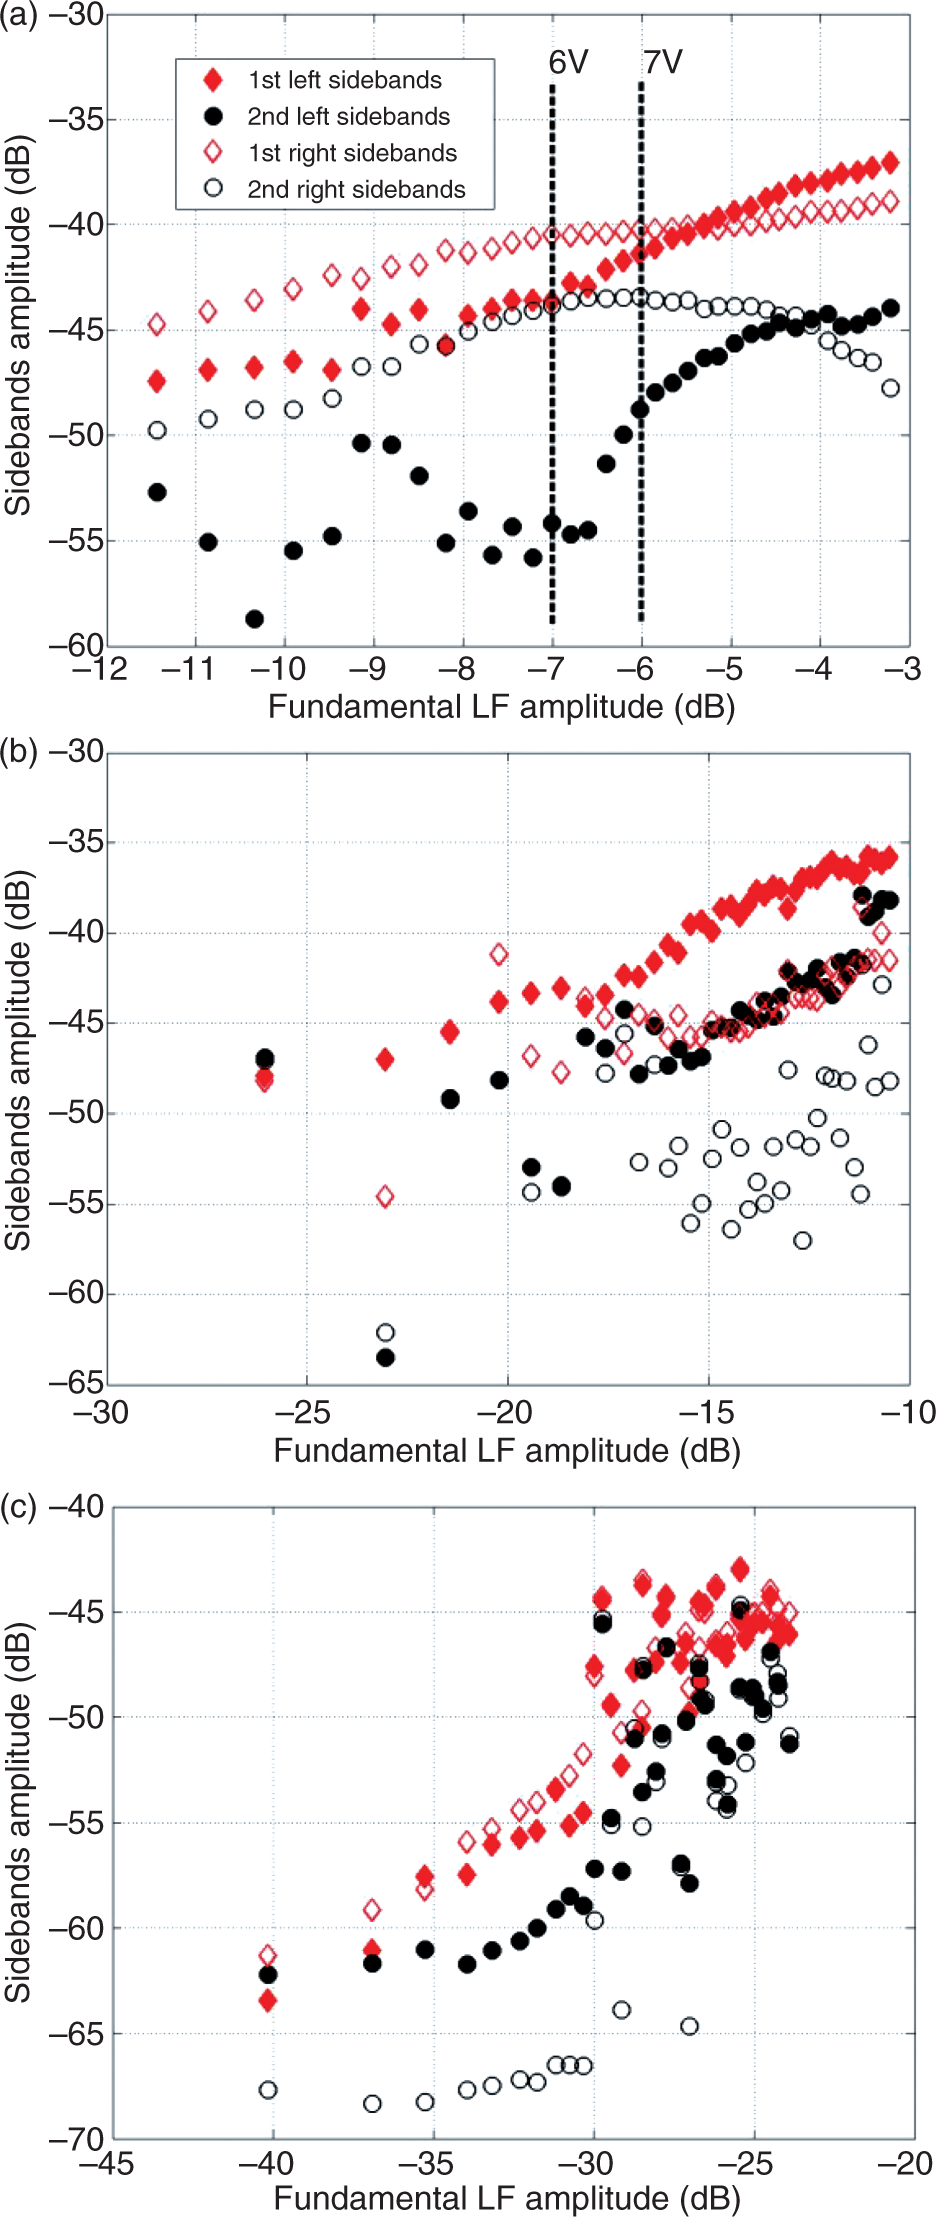
Figure 9 gives the amplitude of the second and third low-frequency harmonics against the amplitude of the fundamental low-frequency harmonic for the three analyzed vibration modes. The analysis for the 1st vibration mode (crack mode-I) is presented in Figure 9(a).When the test was performed, the crack started to open when the low-frequency excitation amplitude reached the 6 ÷ 7 V level, as indicated in section ‘Nonlinear acoustic test’. This is indicated by two vertical dashed lines. The second harmonic displays quadratic amplitude dependence (slope equal to 2) for all analyzed levels of low-frequency excitation. The amplitude values for the third harmonics are scattered until the crack starts opening. Then a bi-linear characteristic can be observed when large (above −6.5 dB) low-frequency excitation levels are used. A slope between 2 and 3 for the −6.5 ÷ −5.5 dB low-frequency excitation changes to the value between 1 and 2 for excitation levels above −5.5 dB. The harmonic analysis for the 3rd vibration mode (crack mode-III) is presented in Figure 9(b). A slope between 1 and 2 can be observed for the second harmonics. More interestingly, the amplitude of the third harmonics exhibits quadratic dependence for the low-frequency excitation level larger than −16 dB. Figure 9(c) gives the harmonic amplitude results for the 6th vibration mode excitation (crack mode-II). Quadratic amplitude dependence can be observed for the second harmonic. The third harmonics also displays quadratic dependence between −30 and −23 dB low-frequency excitation amplitude level. However, the data for this harmonic are more scattered.
Figure 10 gives the amplitude of the first- and second-order sidebands against the amplitude of the fundamental low-frequency harmonic for the vibro-acoustic nonlinear test performed using three different vibration mode excitations. The analysis for the 1st vibration mode (crack mode-I) is presented in Figure 10(a). The slope for the first-order sidebands is linear for low-frequency excitation levels smaller than −6.5 dB. Then the slope for the left sideband changes approximately to quadratic and the slope for the right sideband changes to the value between 0 and 1. The right second-order sideband displays approximately a linear slope below −7 dB amplitude level of low-frequency excitation. The amplitude values for the left second-order sideband are scattered for the same level of low-frequency excitation. When the crack is open, the slope for the right second-order sideband decreases to become negative and for the left second-order sideband becomes approximately quadratic. The results clearly show that sideband characteristics change when the crack is open. The sidebands amplitude results for the 3rd vibration mode excitation (crack mode-III) are presented in Figure 10(b). The amplitude of the left first-order sideband displays linear trend. The amplitudes of the right first-order and the left second-order sidebands exhibit linear trend for the low-frequency excitation levels larger than −16 dB. The sideband amplitude results for the 6th vibration mode excitation (crack mode-II) are very scattered in Figure 10(c).
Vibro-acoustic modulations versus nonlinear mechanisms
The analysis of harmonics and sidebands – presented in section ‘Analysis of higher harmonics and modulation sidebands’ – demonstrates a possible twofold nonlinear mechanism for the analyzed large crack and low-frequency excitation levels. Some evidence of the classical nonlinear elasticity (first-order perturbation due to quadratic second harmonic, cubic third harmonic, quadratic second-order sideband dependence and linear first-order sideband dependence) can be observed for all three vibration modes analyzed. Some evidence of hysteretic behavior can be observed in the pattern of generated harmonics (quadratic third harmonic) and sidebands (linear second-order sideband dependence) when the plate is excited by the 3rd vibration mode (crack mode-III). The pattern of harmonics and sidebands is clearly affected by the opening crack and the classical perturbation nonlinearity is probably related to the elastic behavior associated with the crack. However, the analysis in section ‘Vibro-acoustic modulation intensity’ clearly shows that this mechanism is not dominant when nonlinear modulations are analyzed. Firstly, a strong pattern of modulation sidebands was observed for the 3rd and 6th vibration mode excitations when the crack was always closed. Secondly, the largest intensity of modulations was achieved for the 3rd vibration mode despite the fact that the strain level associated with this excitation was much smaller than the strain level for the 1st vibration mode. The 3rd vibration mode exhibited some evidence of hysteretic elasticity. Further experimental work was performed to find more evidence related to this behavior. The study involved the analysis of the resonance frequency. The cracked aluminum plate was swept over at a sequence of fixed drive low-frequency amplitudes. As the low-frequency amplitude was increased, the 3rd mode resonant frequency shifted to a lower frequency and – what is more interesting – the attenuation increased. This can be clearly observed in Figure 11, where the attenuation – estimated by the parameter 1/Q = F/Ar (F – excitation amplitude; Ar – amplitude at resonance) – not only provides the measurement of thermal diffusivity but also indicates the nonlinear contribution.
26
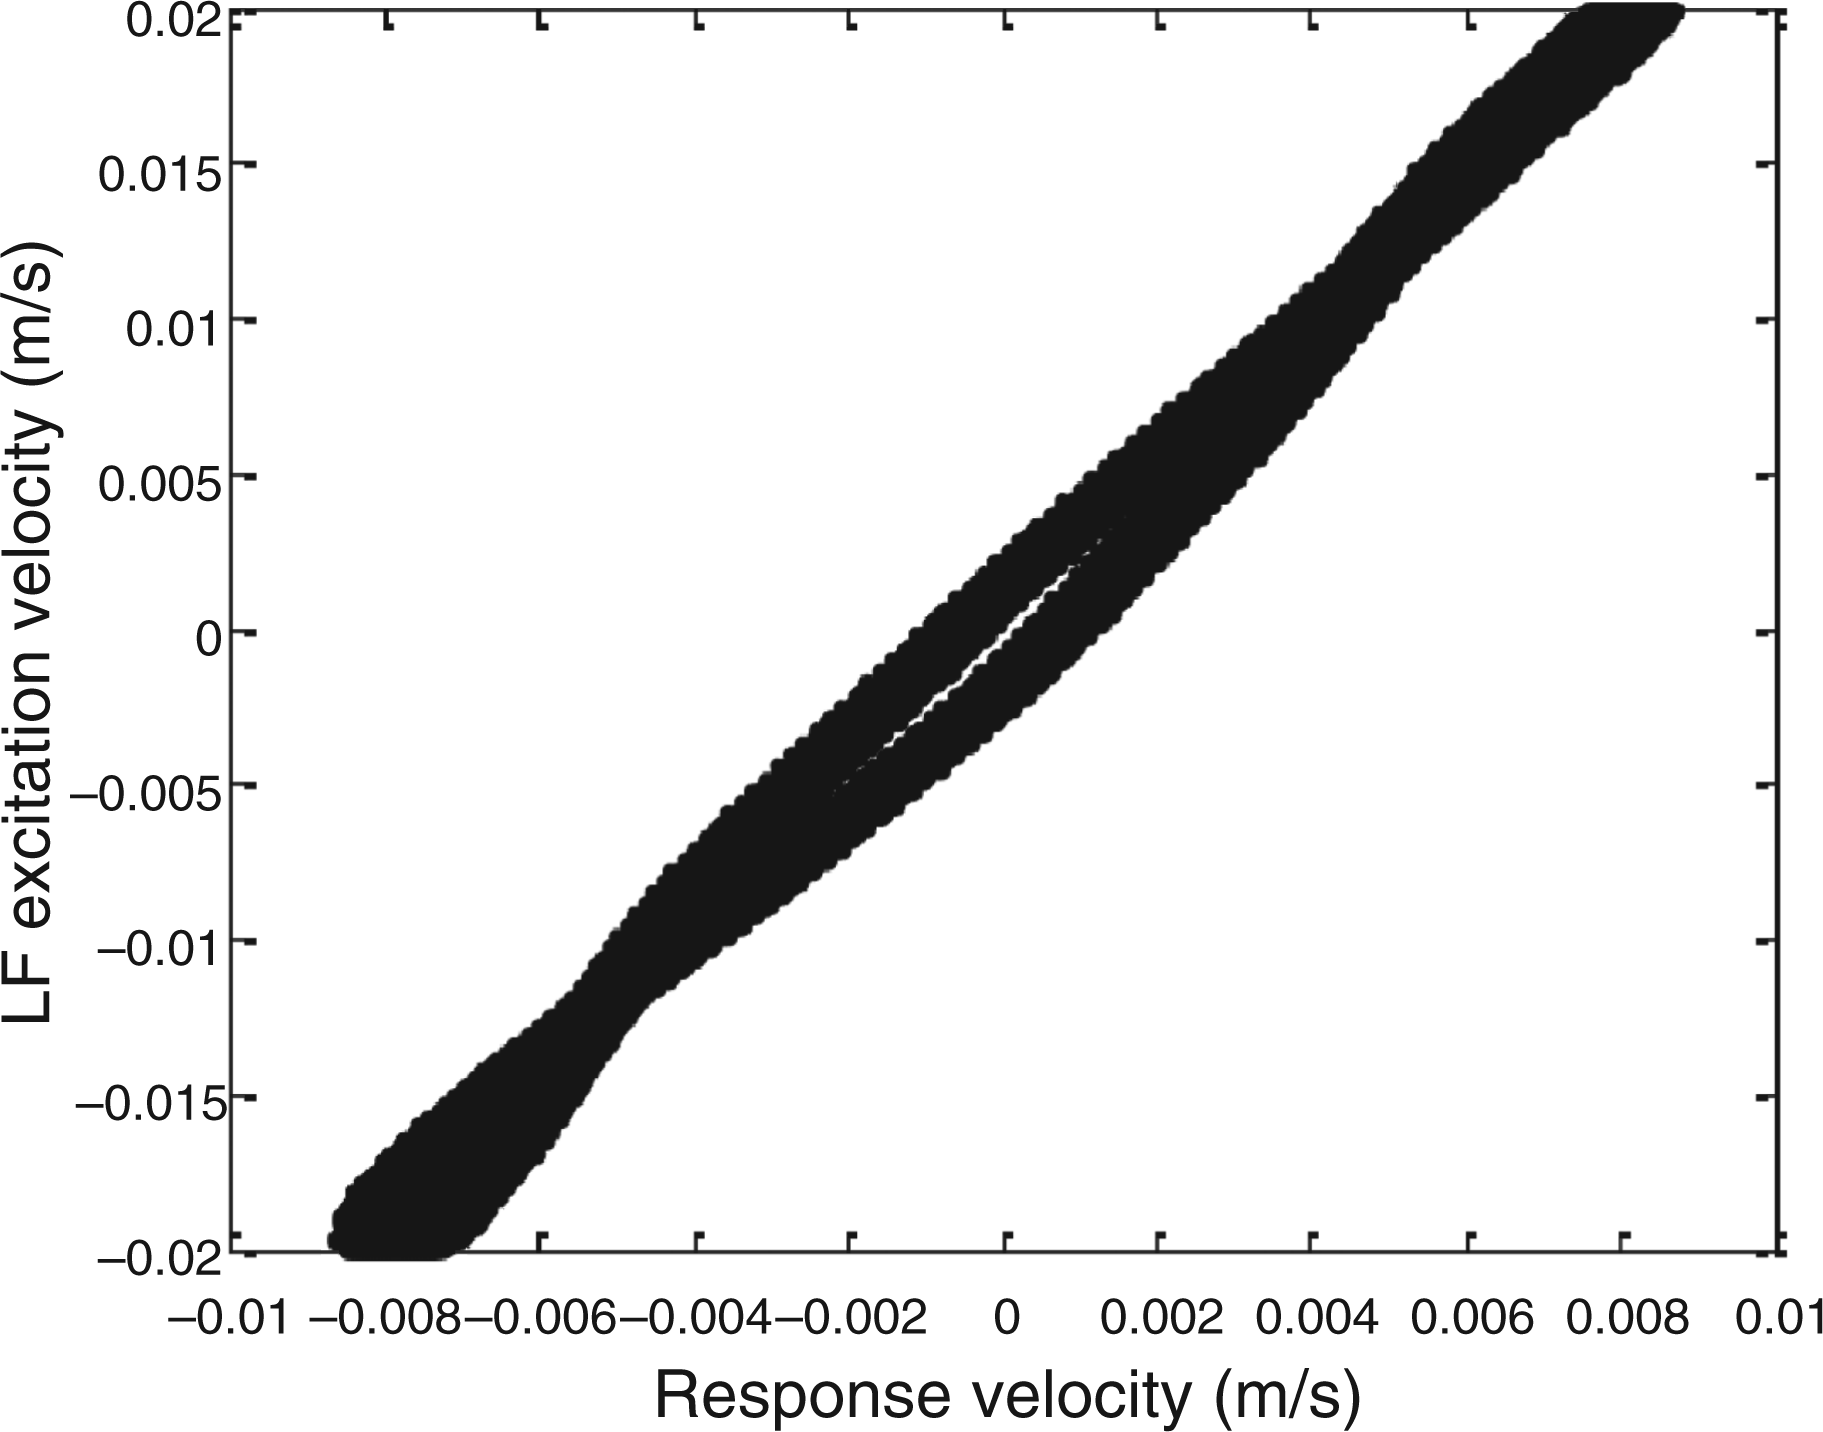
This nonlinear hysteretic elastic behavior – often named as the nonlinear mesoscopic elasticity (NME)33,34 – has been mostly observed for different types of micro-inhomogeneous materials such as sandstone, cement or ceramics.33,34 It is important to note that no frequency shift and attenuation was observed when the uncracked plate was tested or when the crack aluminum plate was excited with the 1st or 6th vibration modes. The excitation and response signals for the 3rd vibration mode were analyzed further to reveal a complex nonlinear hysteresis shown in Figure 12. The complexity of this phase portrait corresponds very well with the scattered trend of modulation intensity in Figure 8 for this vibration mode. In contrast, the behavior of harmonics and particularly sidebands for the 6th vibration mode in Figures 9 and 10 indicate that the relevant scattered trend of modulation intensity for this mode in Figure 8 results rather from low strain levels.
Nonlinear mesoscopic elasticity exhibited by the 3rd vibration mode: (a) frequency shift of the resonance curve toward lower frequencies (b) amplitude attenuation demonstrated by 1/Q. Nonlinear hysteresis for the 3rd vibration mode excitation.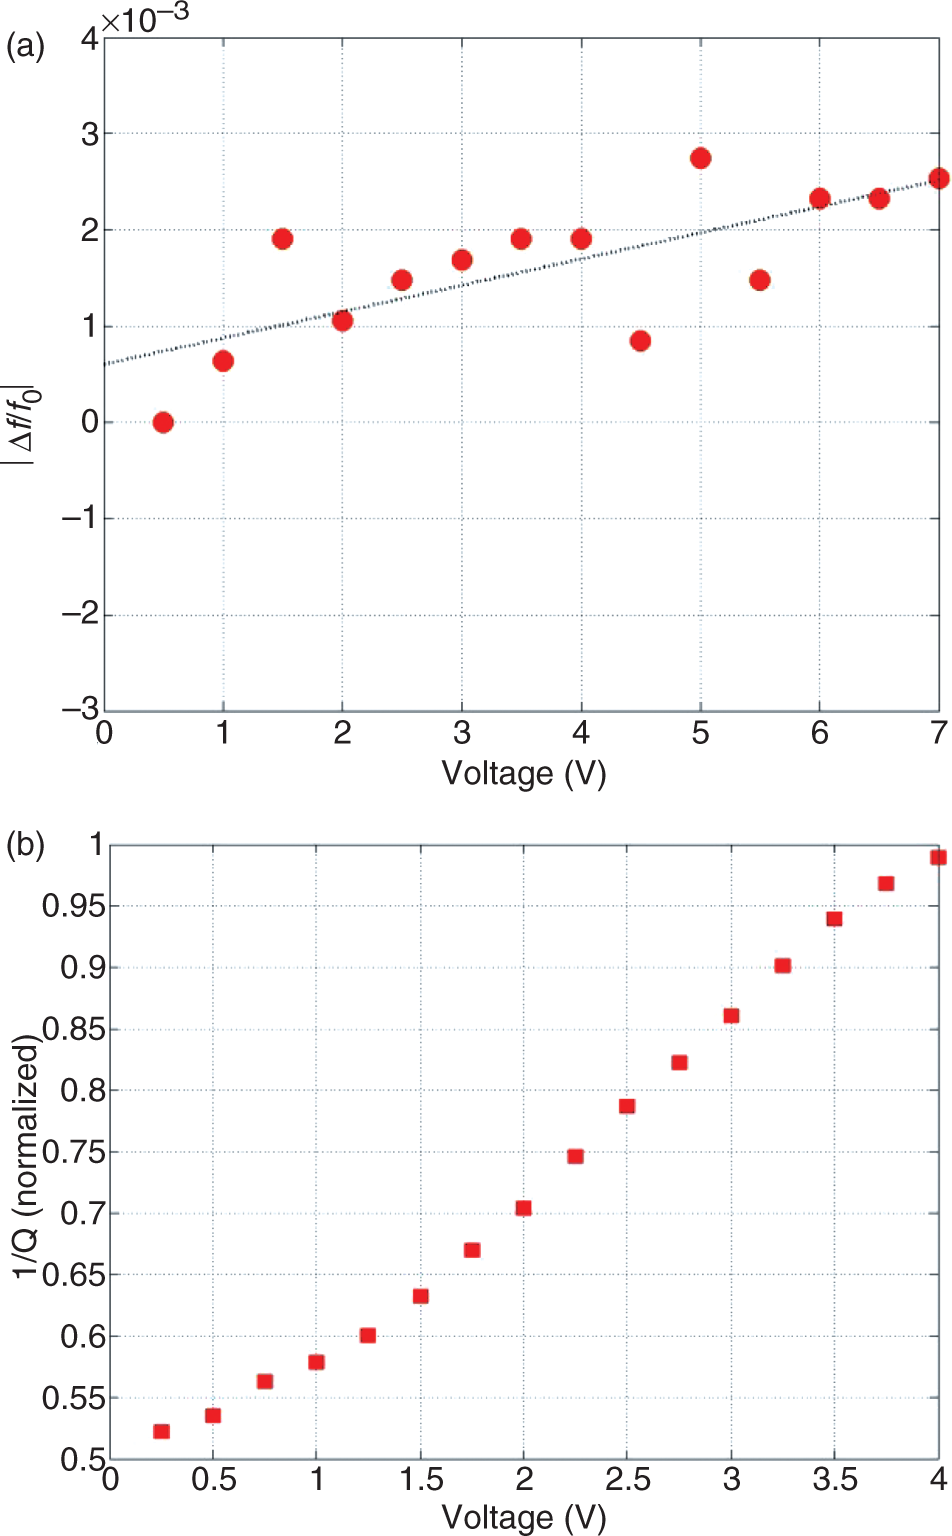
The theoretical analysis and numerical simulations of the NME model based on hysteretic elastic elements 34 and the interaction box formalism 35 predict wave modulations and hysteretic behavior for a wave mixing scenario. However, similar modulations scenarios were demonstrated when a breathing crack (opening–closing) action was modeled 11 and when the nonlinear coupling between various fields was analyzed theoretically. 34 The former has been already investigated experimentally in the previous sections. The latter needs further experiments.
The amplitude dependence of the ultrasonic wave was analyzed for different levels of the low-frequency modal excitation. When a constant-amplitude 60 kHz ultrasonic wave (high-frequency excitation) was introduced to the cracked plate and the plate was excited simultaneously with different vibration modes (low-frequency excitation), the 60 kHz component in the power spectrum of the ultrasonic response did not show any frequency shift for all analyzed vibration modes and low-frequency levels of excitation. The amplitude of this 60 kHz ultrasonic component was also constant when the plate was excited with increased amplitude levels of the 3rd and 6th vibration modes. However, the 1st vibration mode excitation resulted in the amplitude change of the 60 kHz ultrasonic response. This is demonstrated in Figure 13, where the amplitude of the high-frequency response increases initially and then starts decreasing before the crack opening–closing action is initiated (after 6 ÷ 7 V). The former can be explained by the analysis of the phenomenological theory of nonlinear elasticity for two coupled strain fields. Theoretical studies in Ref. 34 demonstrate that a nonlinear contribution to the elasticity does not need to produce an addition to the attenuation. The latter can be explained using two possible mechanisms (1) wave attenuation due to opening–closing action of the crack for larger strain levels; (2) nonlinear coupling between the strain field and an auxiliary field for smaller strain levels that are not sufficient to open the crack but sufficient enough to perturb crack surfaces. The strain levels of both strain fields involved (i.e. low-frequency vibration and high-frequency ultrasound) were very similar to the amplitude-dependent second dissipation mechanism due to elastic–wave–crack interaction observed in glass.8,9
Experimental evidence of the elastic wave Luxembourg–Gorki effect demonstrating high-frequency amplitude attenuation.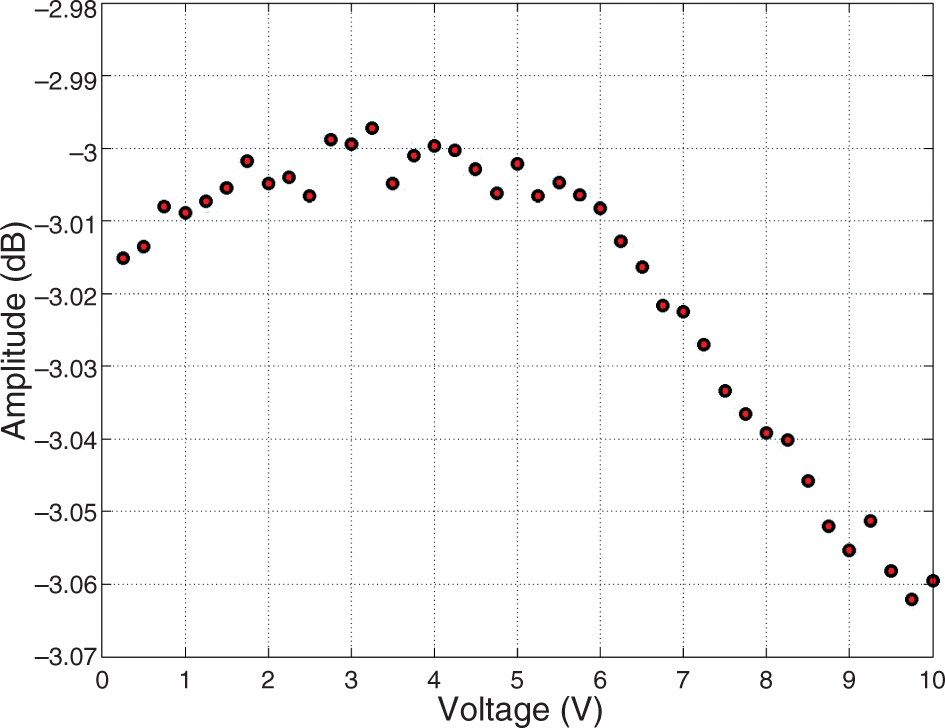
The second non-classical effect is difficult to explain. A mechanism based on non-linear coupling between strain and temperature fields was proposed in Ref. 9 and suggested as the analog of the Luxembourg–Gorki effect. 36 Two theoretical explanations related to wave scattering and temperature were proposed to explain this non-linear coupling mechanism 34 : (1) ‘elastic wave creates a temperature disturbance from which there is a further elastic-wave scattering’ (2) ‘the temperature carries aspects of the elastic waves that created it and transfers these to the scattered wave’.
Vibrothermographic experimental tests
The experimental evidence and both theoretical explanations behind the Luxembourg–Gorki effect demonstrated in section ‘Vibro-acoustic modulations versus nonlinear mechanisms’ show that temperature effect could play an important role in vibro-acoustic nonlinear modulations. Therefore, a local temperature field associated with the crack was further analyzed experimentally.
The temperature field around the fatigue crack was monitored when the nonlinear vibro-acoustic test was performed. A high-performance Cedip Silver 420M thermographic camera was used. Infrared thermographic images were captured 10 s after the 6 V low-frequency and 200 V high-frequency excitations were introduced to the plate. The results are presented in Figure 14. Heat generation can be clearly observed at crack tips in Figure 14(a) when the 1st vibration mode excitation was used. This is mainly due to plasticity, as expected. No significant temperature change was observed in Figure 14(b) when the 3rd vibration mode excitation was used. The infrared image in Figure 14(c) for the 6th mode vibration excitation exhibits some heat generation at crack tips and alongside crack edges.
Infrared thermographic images: (a) 1st vibration mode (b) 3rd vibration mode (c) 6th vibration mode.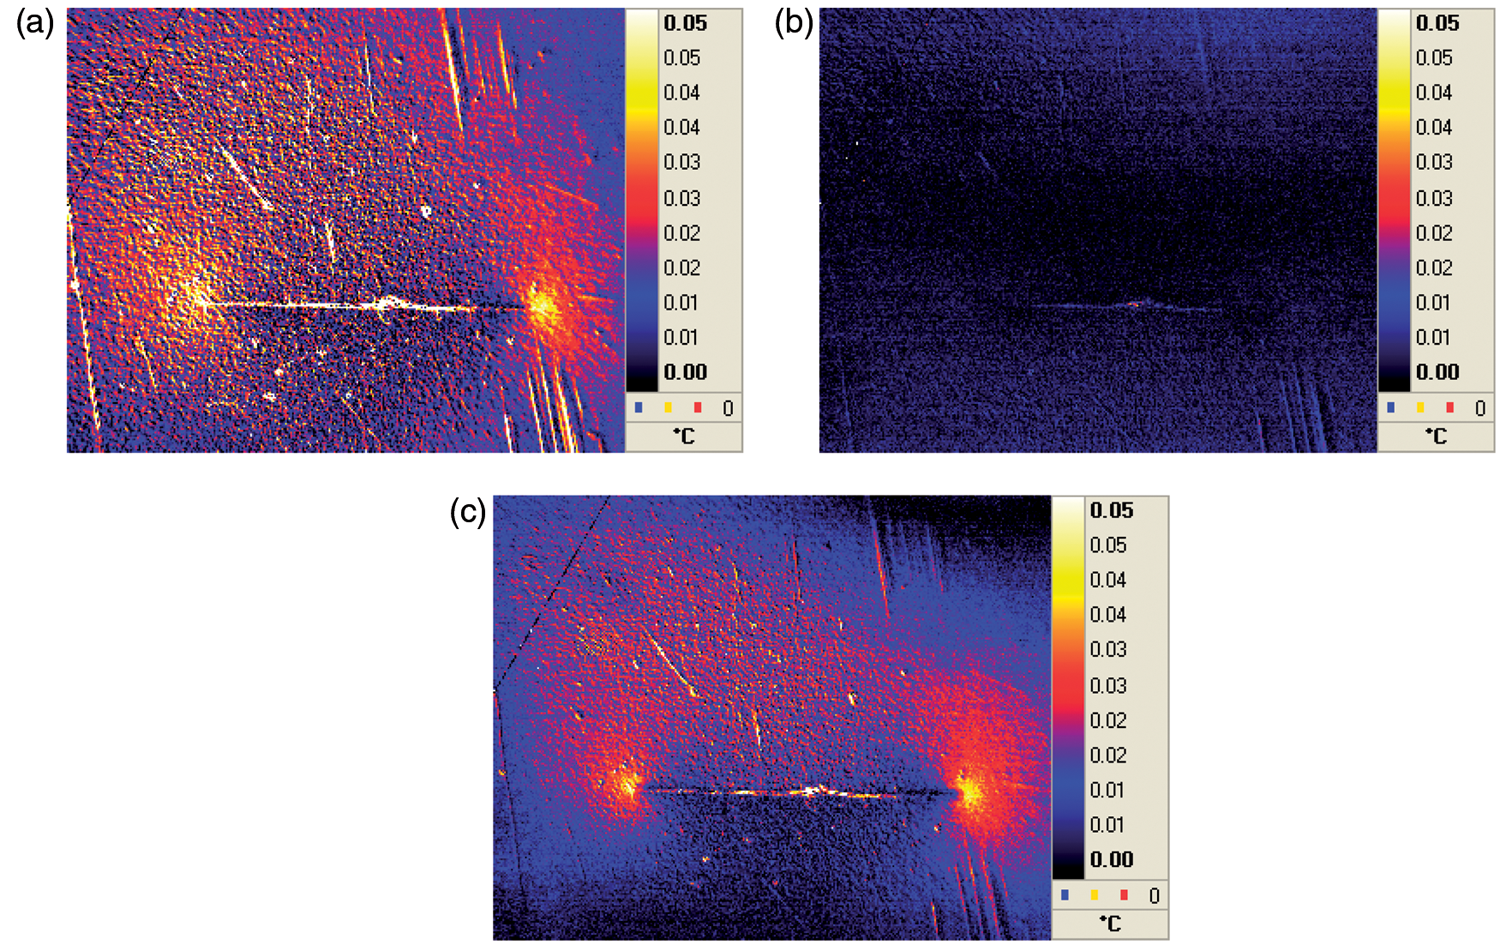
The temperature was measured in four points in the vicinity of the crack (two crack tips, crack edge – middle of the crack; background of the plate – far away from the crack) for the constant 200 V high-frequency excitation amplitude and various levels of low-frequency excitation amplitude. The temperature was measured 10 s after both excitations were introduced. The plate was cooled down for at least 1 h between temperature subsequent measurements for different low-frequency excitation levels. The results presented in Figure 15 confirm the heat generation observed in infrared images giving at the same time quantitative information about temperature change. The largest temperature change of 0.195°C was observed at crack tips for the 1st vibration mode excitation. The temperature change at crack edges was observed for the 1st and 6th vibration modes and reached the maximum level of approximately 0.020 ÷ 0.025°C.
Temperature measured in the vicinity of the crack for various low-frequency excitation amplitude (a) 1st vibration mode; (b) 3rd vibration mode; (c) 6th vibration mode.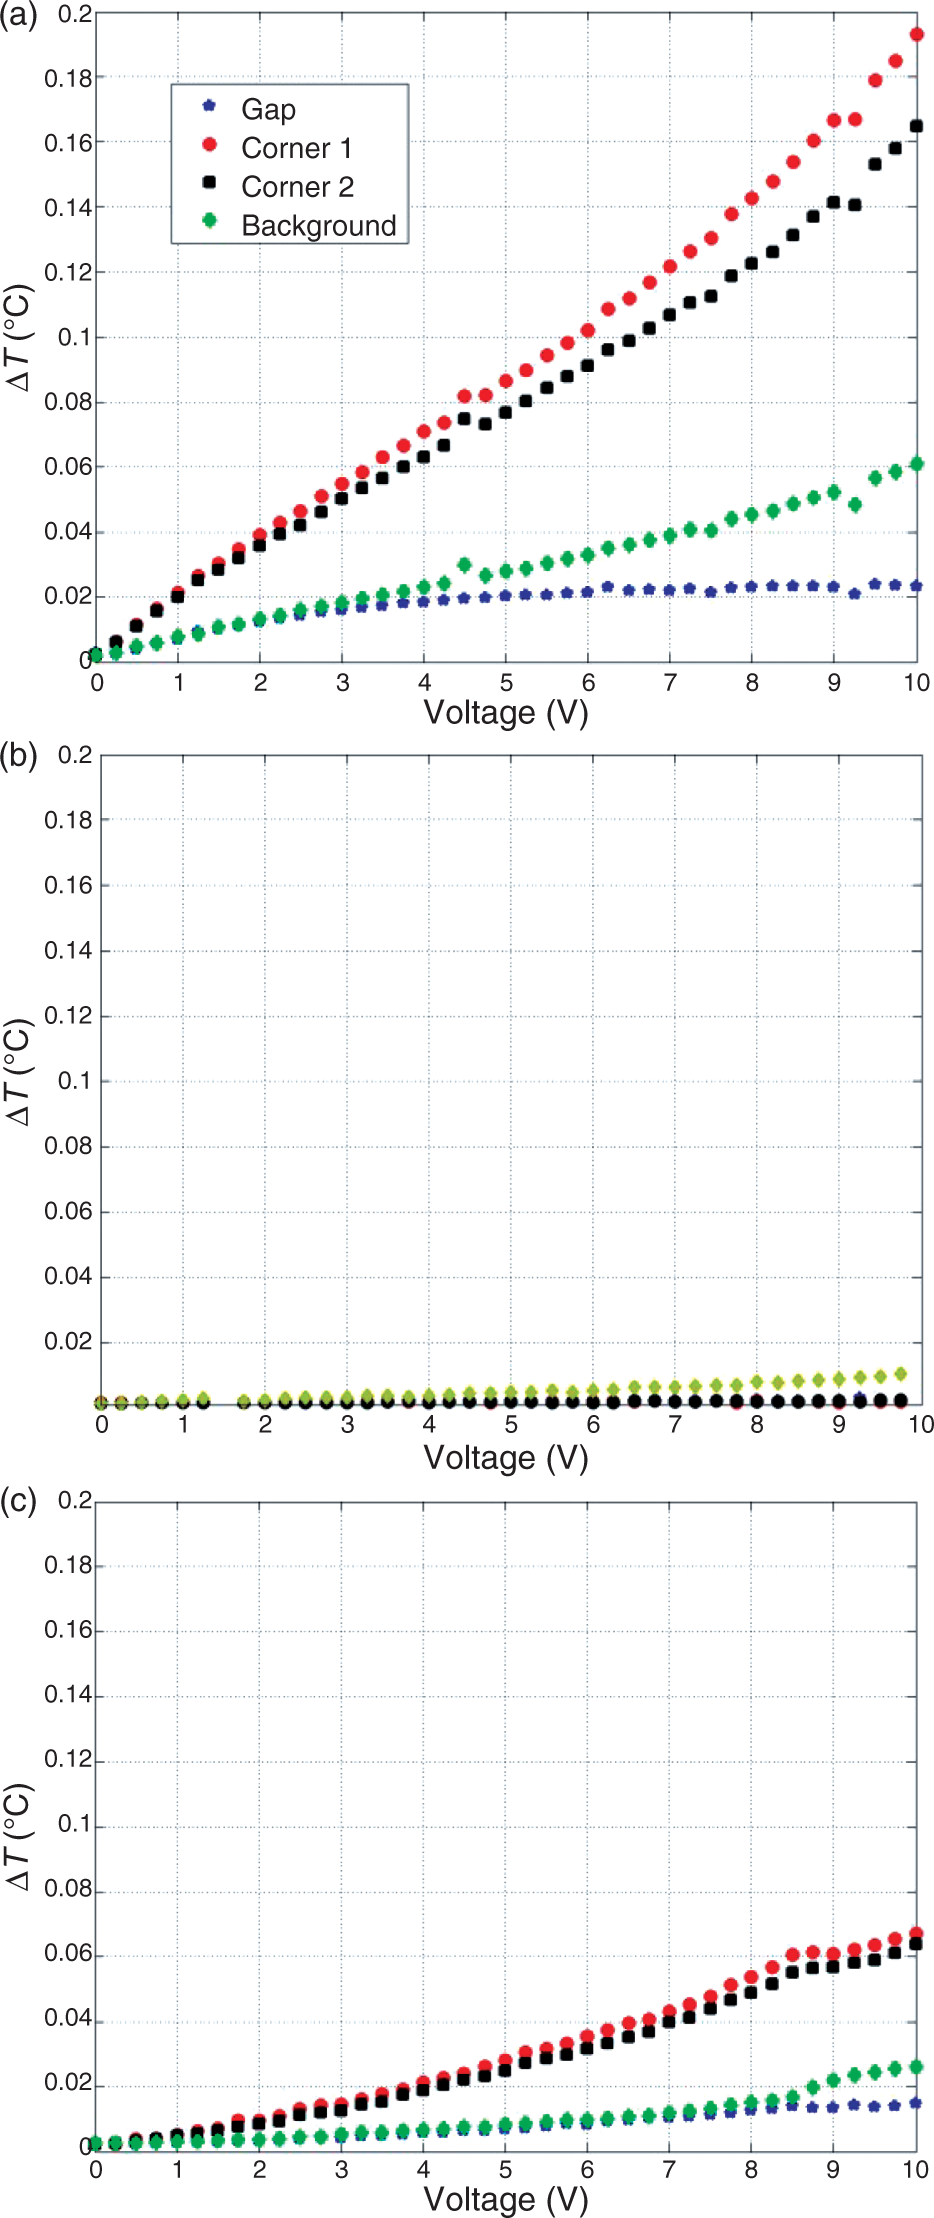
One more experiment was performed to reveal the possible link between temperature change and vibro-acoustic modulations. The cracked aluminum plate was excited with constant-amplitude 6 V low-frequency vibration and 200 V high-frequency ultrasonic signals for 600 s. It is important to note that the crack did not get open for the excitation levels used. The temperature was then measured in the vicinity of the crack. Vibro-acoustic responses were captured simultaneously with temperature measurements to estimate the intensity of modulation (R parameter). The results are presented in Figure 16. Again, the temperature has not changed when the plate was excited with the 3rd mode excitations and increased by approximately 0.12 and 0.05°C when the plate was excited by the 1st and 6th vibration modes, respectively (Figure 16(a)). At the same time, the intensity of modulation – presented in Figure 16(b) – increased by 20% but only for the 1st vibration mode excitation.
Experimental evidence of vibro-acoustic modulation dependence on coupled strain-temperature field: (a) modulation intensity vs time (b) temperature vs time.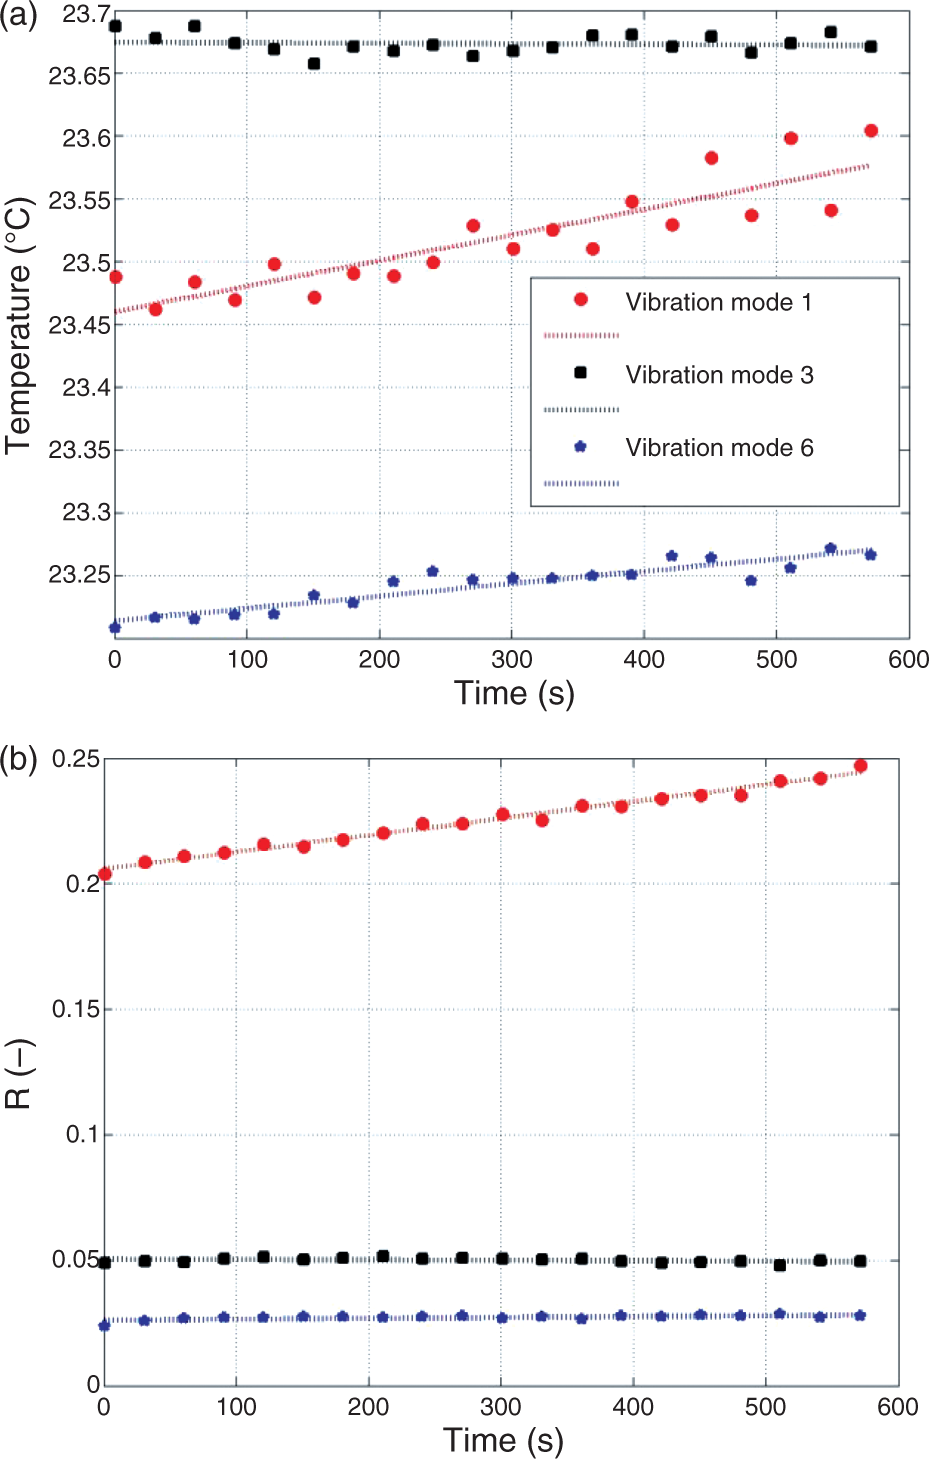
There are three main conclusions from the temperature analysis. Firstly, the link between temperature and vibro-acoustic modulations have been found only for the 1st vibration mode (crack mode-I – opening–closing) for strain levels that did not open the crack but were sufficient to perturb crack surfaces. Interestingly, this mode exhibited some evidence of the non-classical amplitude attenuation (the Luxembourg–Gorki effect) for the same strain level in section ‘Vibro-acoustic modulations versus nonlinear mechanisms’. Secondly, no heat generation (temperature change) has been observed for the 3rd vibration mode excitation (crack mode-III – tearing) that produced the largest intensity modulation in section ‘Experimental arrangements’ and strong evidence of hysteretic behavior in section ‘Vibro-acoustic modulations versus nonlinear mechanisms’. Thirdly, some heat generation (probably due to friction) has been observed for the 6th vibration mode excitation that produced the smallest level of modulation intensity in section ‘Experimental arrangements’. However, the temperature change did not produce any changes in vibro-acoustic modulations.
Conclusions
Vibro-acoustic wave interactions in cracked aluminum plate have been investigated. The focus was on the effect of low-frequency excitation on wave modulations. Various nonlinear phenomena associated with these modulations have been also investigated with respect to different crack modes. The experimental results presented lead to interesting conclusions that can be summarized as follows.
The selection of low-frequency modal excitation is very important when vibro-acoustic modulations are used for structural damage detection. The results show that modulation intensity, often used for damage detection, strongly depends on crack modes investigated (or, in other words, frequency of the modal excitation associated with the three crack modes I, II and III) and the amplitude level of the low-frequency excitation.
The experimental work presented demonstrates that cracks do not need to be open when nonlinear vibro-acoustic modulation technique is used for damage detection. In fact, the study provides evidence that opening–closing action of the crack is not a major contributor to modulations. The consequence is that relatively weak strain fields can be used for damage detection. However, when the crack is open, modulation intensity is enhanced.
The experimental study shows that energy dissipation – either by nonlinear elastic hysteresis or by non-classical thermo-elastic coupling (non-hysteretic and non-frictional) – is the major mechanism associated with vibro-acoustic modulations. A clear link between temperature change in the vicinity of the crack and vibro-acoustic modulations have been demonstrated. The results presented provide experimental evidence to the theoretical models, i.e. NME33,34 and the Luxembourg–Gorki effect based on thermo-elastic coupling,8,9 for fatigue cracks in metals.
Multi-fold crack-induced nonlinearities were observed in vibro-acoustic responses. The crack mode-I excitation contributed to the classical elastic perturbation of the first-order (nonlinear elasticity) that was enhanced when the crack opening–closing action was observed. This crack mode excitation demonstrated also some evidence of the non-classical Luxembourg–Gorki type dissipation (non-hysteretic, non-frictional dissipation due to nonlinear coupling between strain and temperature fields) for large strain levels that were not sufficient to open the crack but strong enough to perturb crack surfaces. The crack mode-III contributed to very strong evidence of non-classical, NME (nonlinear damping – hysteretic elasticity).
Further work is required to confirm these findings since it is anticipated that better understanding of nonlinear vibro-acoustic wave modulation effects in crack solids will lead to improved crack detection methodology in non-destructive testing of materials.
Footnotes
Acknowledgment
The authors would like to acknowledge the partial research funding from the project MONIT (No. POIG.01.01.02-00-013/08-00) for the work presented.