
Abstract
Fatigue cracks caused by repetitive loads are one of the major threats to the structural integrity of civil infrastructure. Human inspection is the most common method for detecting fatigue cracks, but it is time-consuming, labor-intensive, and unreliable. In this paper, we propose a new vision-based fatigue crack detection and localization method that can detect the fatigue crack with marker-free and high precision using a consumer-grade digital camera. A motion tracking technology called optical flow algorithm is applied to the video for tracking the surface motion of the monitored structure under repetitive load. Then, a crack detection and localization algorithm based on optical flow information entropy are developed to search differential features at different video frames caused by the crack opening and closing. The proposed method’s precision is first validated by doing two experiments and then comparing its precision and efficiency to the existing crack detection methods, including image processing and digital image correlation. The results show that, when compared to the existing vision-based methods, the proposed method can accurately and efficiently identify the fatigue crack even when the crack is surrounded by other crack-like edges, covered by complex surface textures, or invisible to human eyes. In addition, based on the proposed methods, a practical application for calculating the stress intensity factor is given to track crack development.
Introduction
Civil infrastructure supports basic social and economic functions and is the lifeline of the country’s industrial development. Fatigue cracks are a critical structural concern for many civil infrastructures, such as bridges. Caused by repetitive traffic loads, the structures are prone to develop cracks during long-term service process.1–3 Fatigue cracks are usually small when initiated, making them challenging to detect at an early stage. However, depending on the structural boundary conditions and bridge layouts, fatigue cracks may develop rapidly and significantly impair structural integrity, resulting in catastrophic structural failures.4,5 As a result, developing high precision crack detecting technologies is extremely important. To date, many methods have been developed for crack detection, mainly including manual-based methods, sensor-based methods, and vision-based methods. Among these methods, the vision-based methods can be further classified into color-based methods, model-based methods, and motion-based methods.6–8
The manual-based methods usually involve visually checking the structure by either certified inspectors or structural engineers but are time-consuming and labor-intensive. More importantly, the reliability of these methods depends on the experience and feelings of the inspector. 9 To address these shortcomings, sensor-based methods for crack detection were developed, and testing equipment including acoustic emission Sensors (AE), ultrasonic testing sensors (UT), strain sensors, scanning laser Doppler vibrometer (SLDV), and light detection and ranging (LiDAR) Scanning were always used to evaluate the structure. Of all the sensor-based methods, the measurement range of AE and UT is relatively small, and the measurement cost is high.10–12 The strain sensors demonstrate abilities for detecting fatigue cracks by sensing the abrupt strain change caused by cracking, but these sensors, once installed, are not easily transferable to other structures. In addition, extra work on sensor installation and cabling are needed since such methods rely on sensors physically deployed on structures. 13 The SLDV and LiDAR can provide a wide range of measurements of the structure, but the disadvantages of these methods are costly, and measuring at high spatial resolution locations is time-consuming and labor-intensive. 14
Compared to manual-based methods and sensor-based methods, vision-based methods for crack detection technology have been developed in recent decades due to the benefits of non-contact, easy-to-install, and long-distance monitoring.15–17 It is based on the principle of crack identification. Existing vision-based methods can be classified into three categories: color-based methods, model-based methods, and motion-based methods. The color-based methods identify cracks based on the different colors of the cracked area and the complete area. This kind of methods is based on the assumption that the crack shape is thinner than the shape of other texture patterns, and that the color of the cracked pixel is darker than the background. Yeum et al. proposed a vision-based automated method that used prior knowledge of crack locations to remove unnecessary crack-like edges from steel beam images, thereby identifying real cracks. 18 Abdel et al. provided a method for crack detection based on edge-detection algorithms, and provided a comparison of the effectiveness of four crack detection techniques. 19 However, one common feature of the color-based recognition methods is that only static features are used for crack detection. In addition, these methods mainly rely on finding the edge characteristics of cracks, so it is difficult to distinguish real cracks from crack-like edges such as structural boundaries and corrosion marks.
The model-based methods mainly focus on deep learning, such as convolutional neural networks and residual convolutional neural. These methods usually need to use images to train the model and identify the crack through the trained model. Mohamad et al. developed robust crack detection models based on residual convolutional neural networks by joint training, sequential training, and ensemble learning to separate concrete and asphalt crack images. 20 Cha et al. proposed a classifier that uses deep learning technology to learn invariant features from a large number of crack images to detect concrete components under different lighting conditions. 21 Zhang et al. used deep learning through pre-trained models (transfer learning) for the detection of pavement cracks and sealed cracks and reported improvements over non-deep learning benchmarks. 22 However, these model-based methods need to collect a large amount images to train the model, which leads to certain limitations in real applications. Meanwhile, the model-based methods for crack identification only use static images, making it difficult to trace the crack’s development.
Instead of relying on single or multiple static images in color-based and model-based methods, the motion-based methods can not only detect cracks but also track their development. In general, the motion-based methods usually calculate the motion information to detect the crack by an image processing algorithm. Hu et al. presented a novel crack detection method for membranes under ambient excitation by combining Bayesian operational modal analysis and three-dimensional digital image correlation (DIC). 23 Dias et al. reported hundreds of circular targets with a 20 mm grid have to be painted on the surface of a concrete girder to apply the DIC method for crack detection. 24 Ngeljaratan et al. accurately captured the reinforced concrete structure’s dynamic response by the DIC method for different earthquake levels, including residual displacements and surface cracks. 25 However, DIC-based approaches require a speckle pattern on the surface, and the research has found that the pattern’s quality is important to DIC’s performance in fatigue crack detection, particularly when measuring strain and displacement. 26 This is a major drawback as it is not always possible or desirable to visually mark structures, especially detailed surface preparation for large-scale structures or even not practical if the structure under the hostile operating environment. Furthermore, some researchers have indicated that when employing the DIC to detect cracks, the displacement jump across the crack, and the size of the jump, directly determines whether the crack can be detected. 27 Instead of the marked method, Yang et al. developed a marker-free method which uses the optical flow algorithm to obtain the modal shape and then calculate the modal shape fractal dimension to indicate the crack. 28 Although cracks detection based on modal shape and optical flow does not require a speckle pattern on the surface, it does require expensive equipment to capture the high-order modal shapes, such as high-speed cameras.
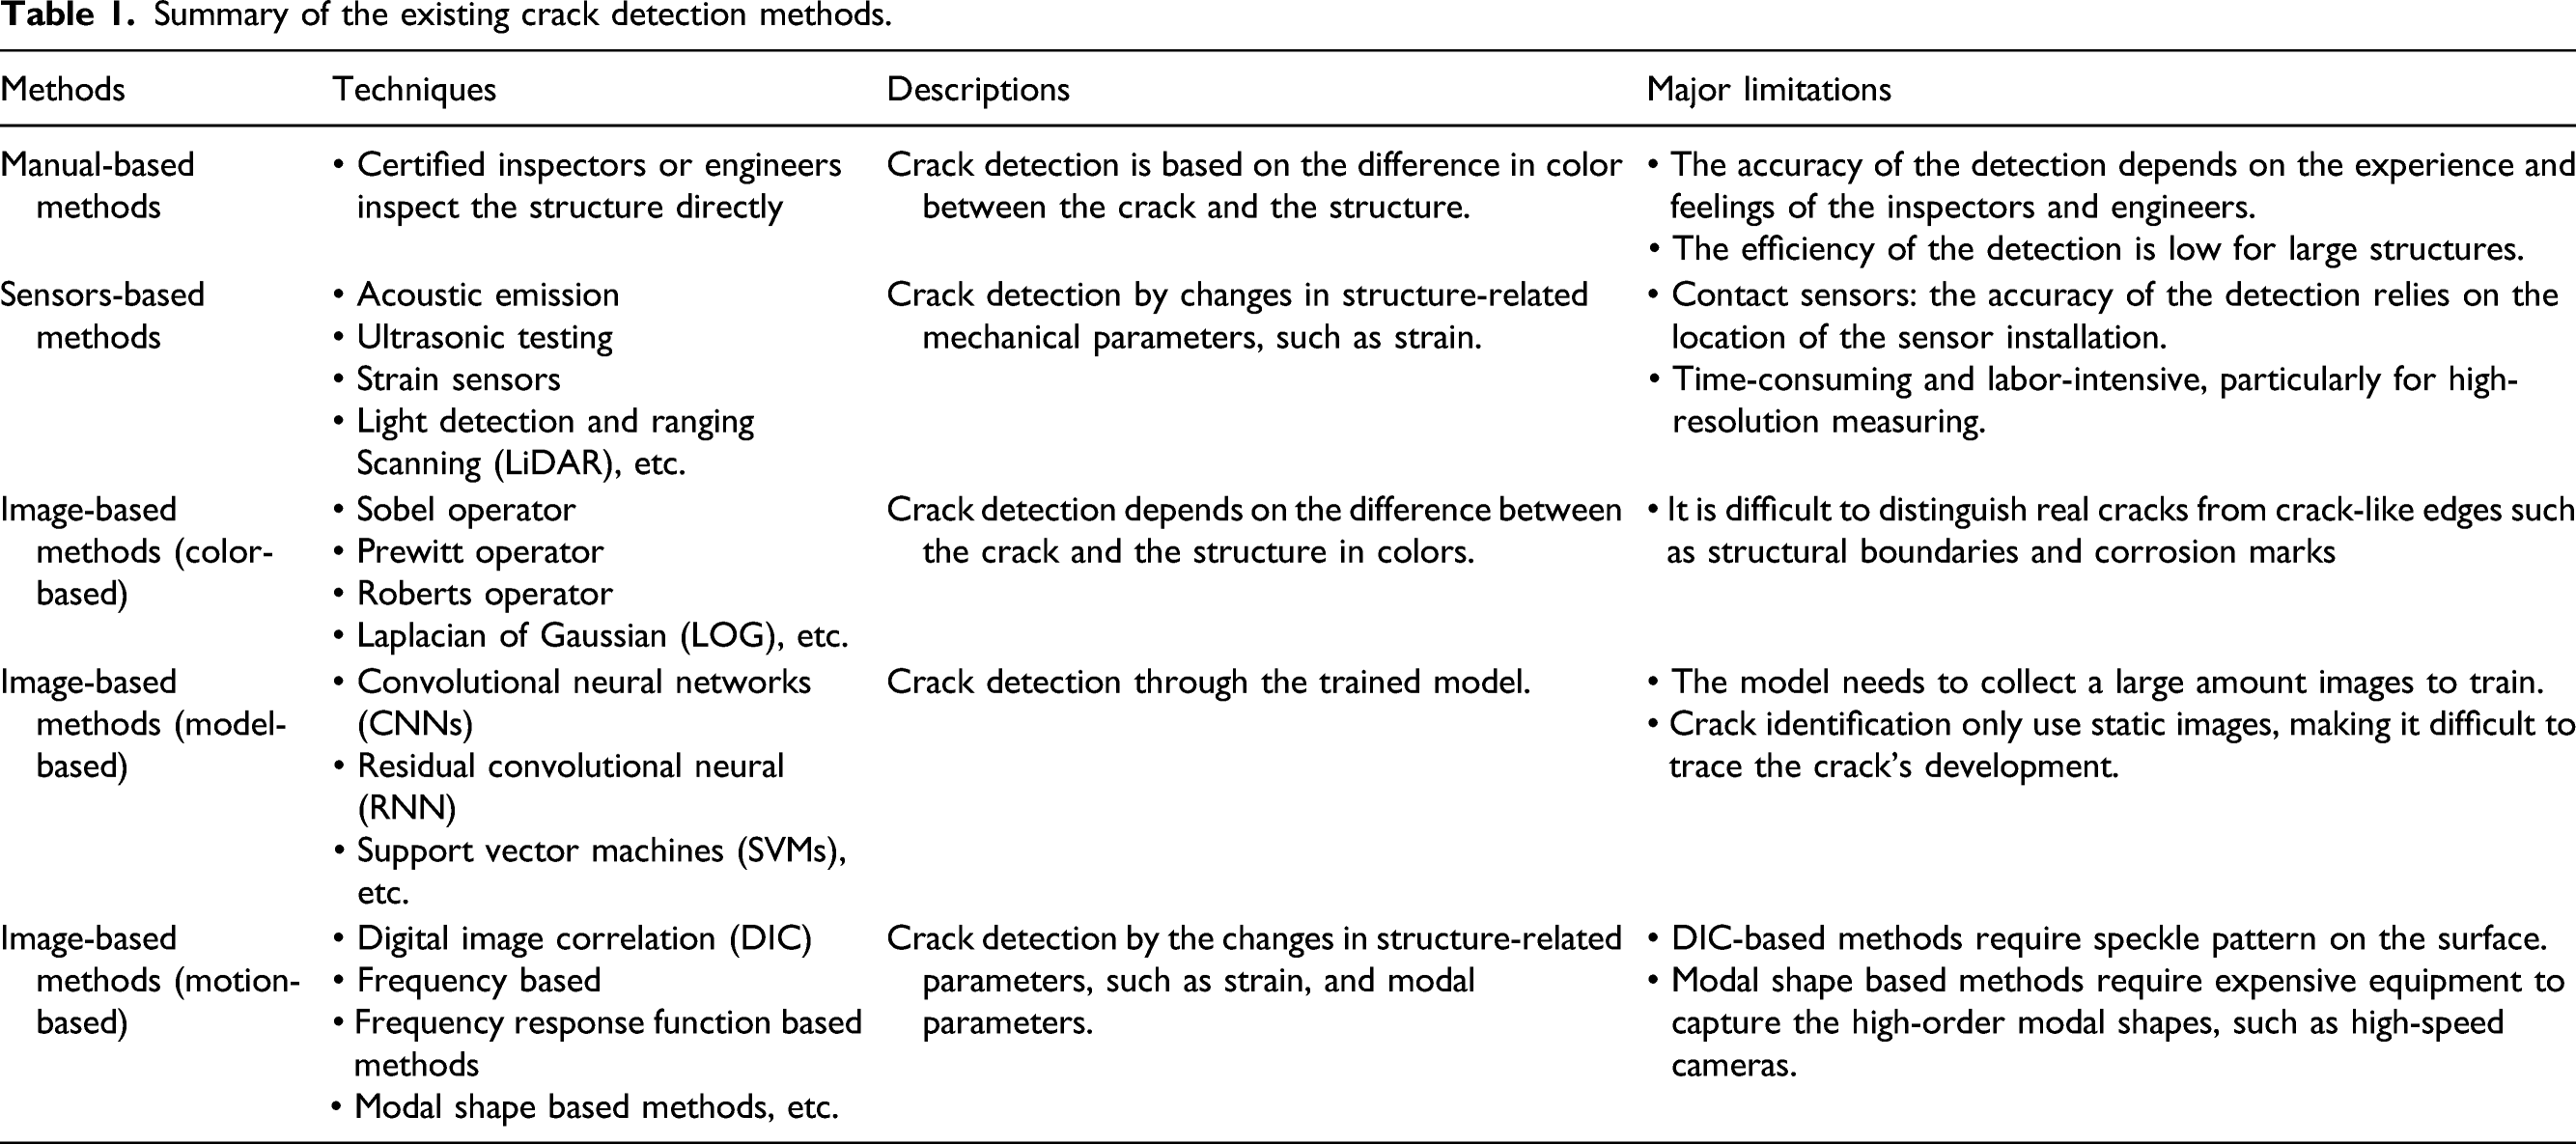
Summary of the existing crack detection methods.
In this article, we present a novel motion-based method for fatigue crack detection and localization by integrating the optical flow and information entropy, which aims to detect the fatigue crack with marker-free and high precision using a consumer-grade digital camera. Among the proposed method, in order to solve the restrictions of manual marking, the optical flow algorithm is applied to the video for tracking the surface motion of the monitored structure under repetitive load. Then, a crack detection and localization algorithm based on optical flow information entropy are developed to search differential features at different video frames caused by the crack opening and closing. This paper tests the efficiency and precision of the proposed method through two different crack situations by comparing it with the existing crack detection method. The results show that, when compared to the existing crack detection methods, the proposed method can accurately and efficiently identify the fatigue crack even when the crack is surrounded by other crack-like edges, covered by complex surface textures, or invisible to human eyes.
The workflow of the proposed crack detection and localization is shown in Figure 1, which mainly includes four parts: image acquisition and processing, image partitioned and features points selected, crack detection and localization, and industrial application. In image acquisition and processing, the video of the structure under load is acquired and digitalized. In image partitioned and features points selected, the image has been partitioned into several sub-regions and the features points in each sub-region are selected. In crack detection and localization, the sparse optical and dense optical flow information entropy are calculated to detect and locate the crack, respectively. In industrial applications, the crack length, the crack tip, and the stress intensity factor are calculated to evaluate the structure. The workflow of the proposed method for crack detection and localization.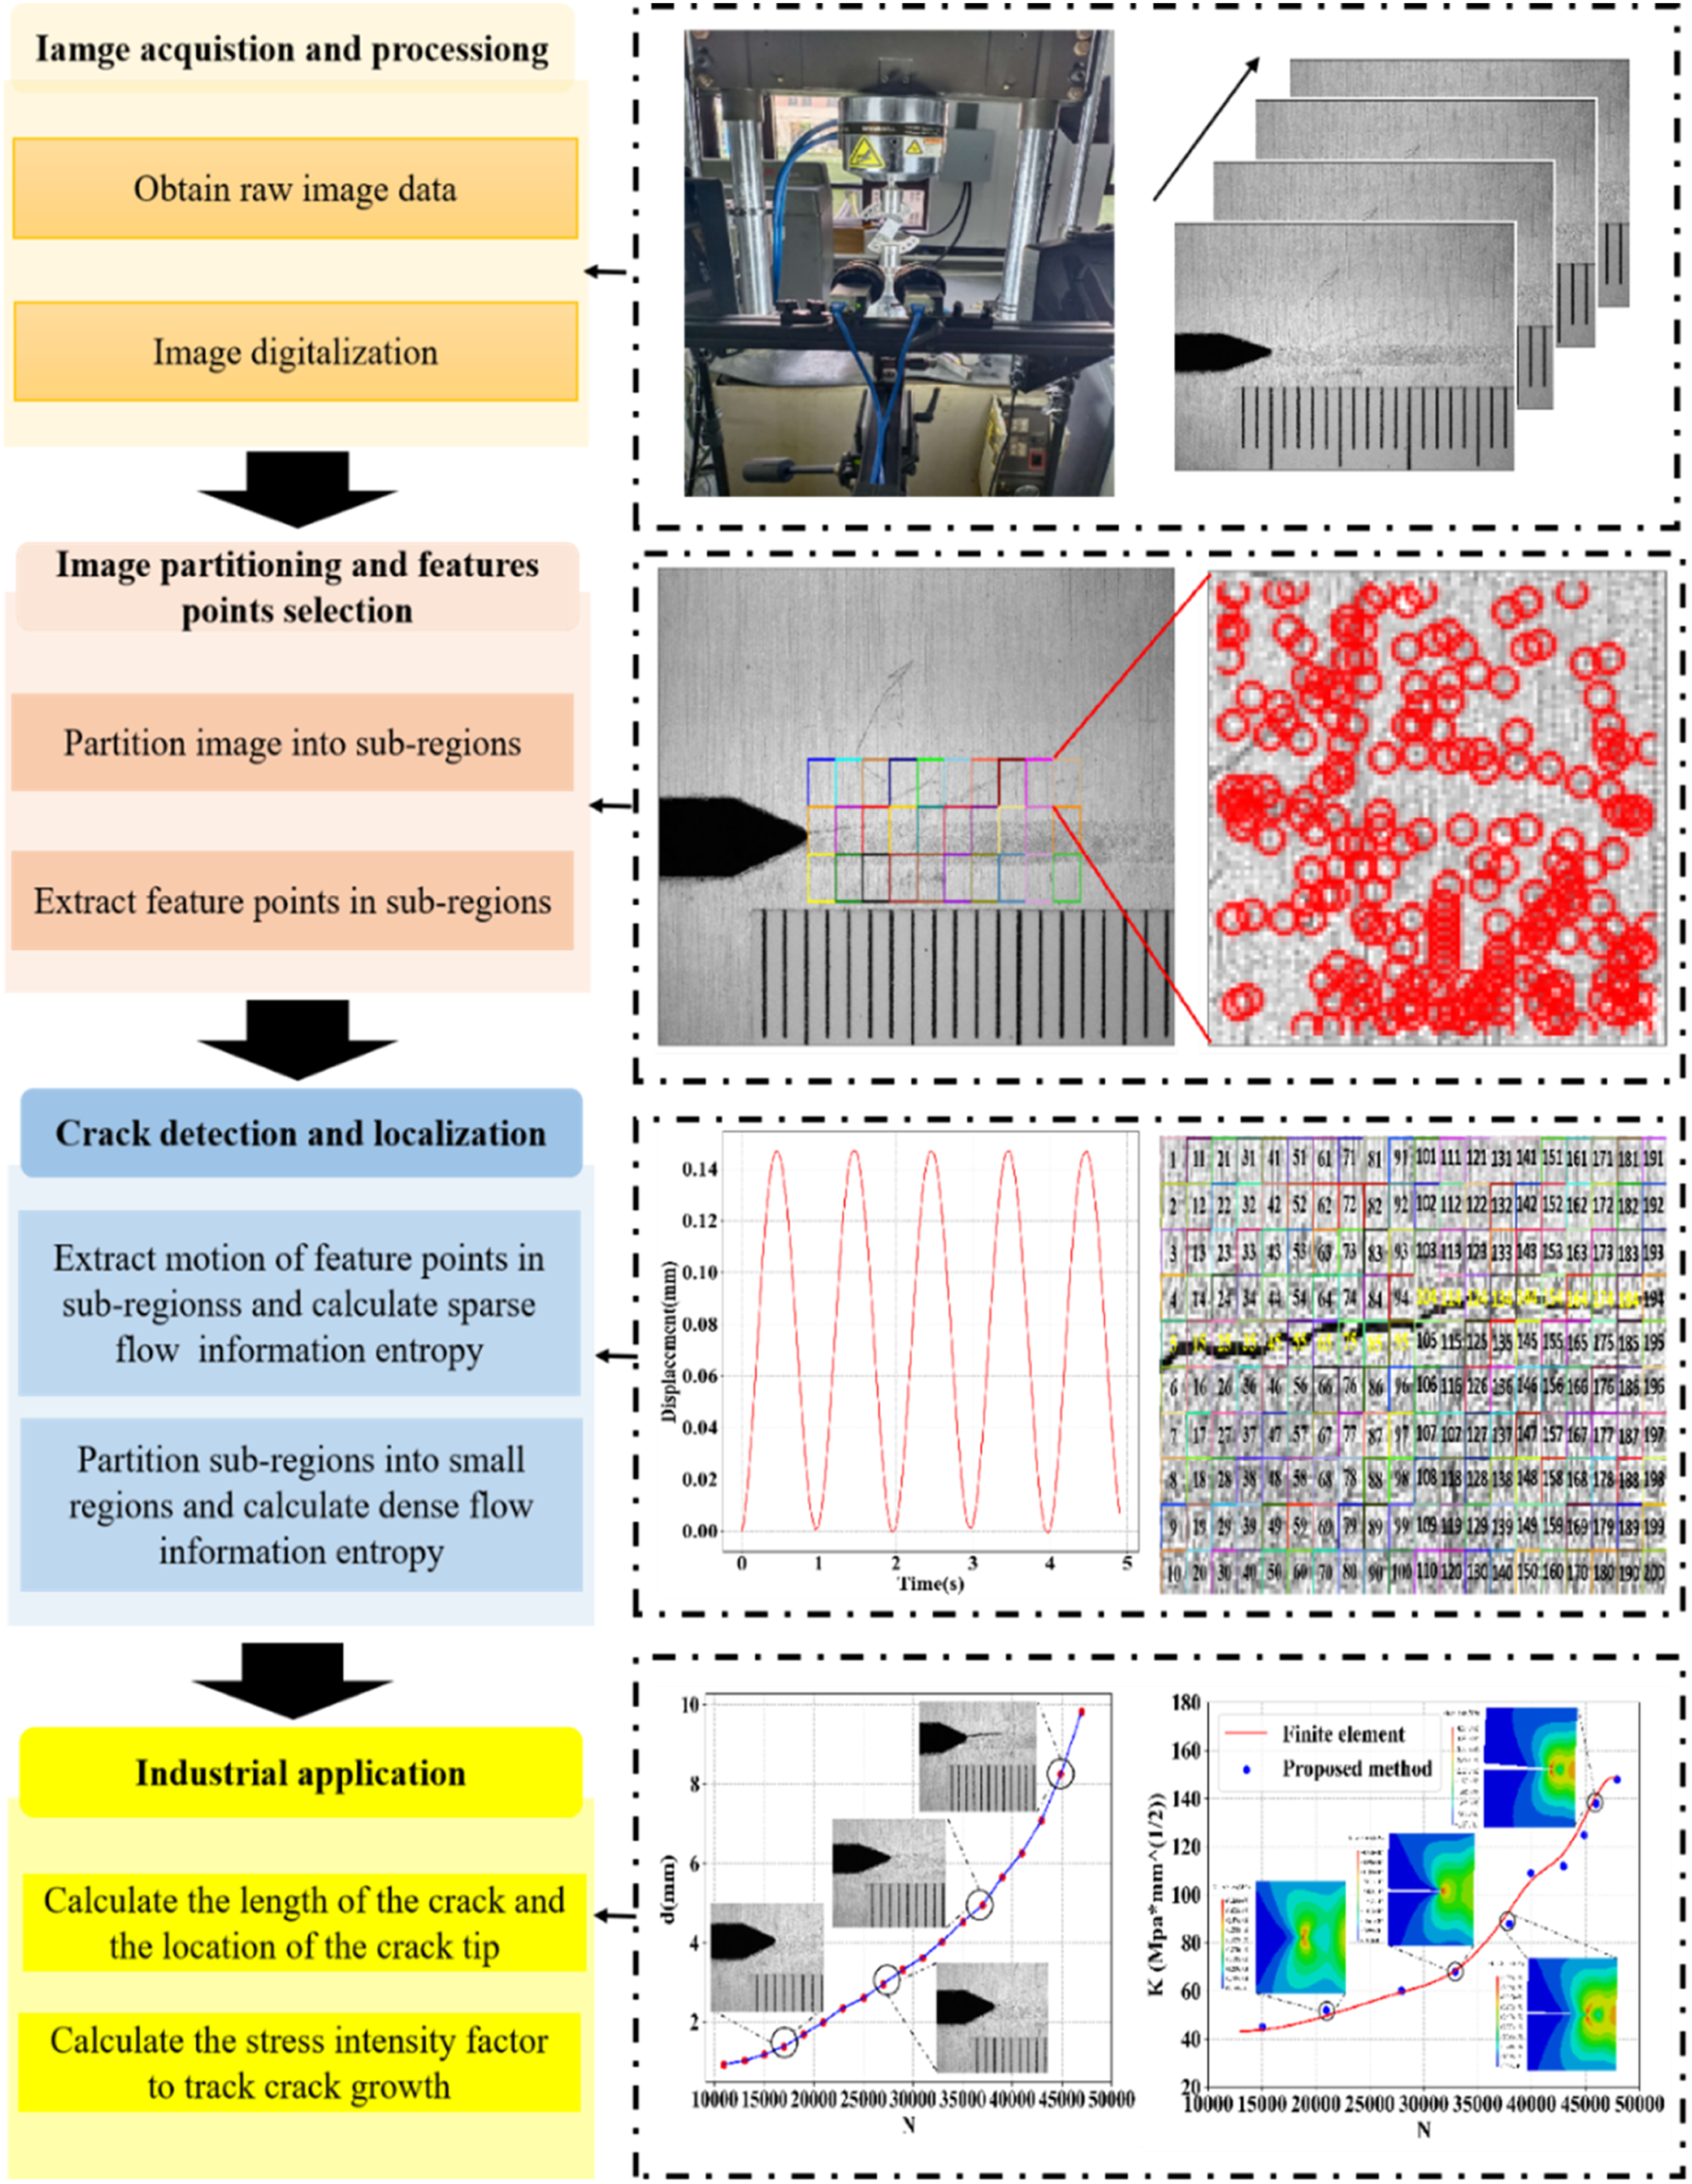
The rest of the paper is organized as follows. The second section illustrates the theory of the proposed method. The third section validates the proposed method by using two different experiments and comparing it to the existing crack detection method. A practical application of the proposed method for calculating the stress intensity factor is given in the fourth section. The advantages of the proposed method and future work are summarized in the fifth section.
The theory of the proposed method
The theory of sparse optical flow and dense optical flow algorithm
In this study, the optical flow method is used to solve the visual tracking task because it can calculate motion without spraying a speckle pattern or installing a distinct mark in the structure.
29
The optical flow refers to the estimation of a vector field of local displacement for a sequence of images. The optical flow algorithm established based on two basic assumptions: (a) Brightness constancy: The pixel intensities of an object in an image do not change between consecutive frames. (b) Temporal regularity: The between-frame time is short enough to consider the motion change between images, which assume a small motion between two consecutive images.
Considering a pixel 
Then, assuming I is a differentiable function: by expanding the second term using the Taylor series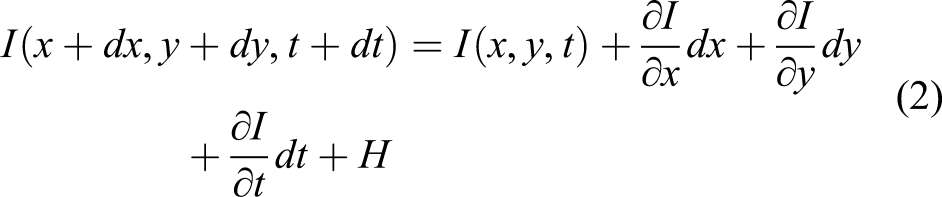
According to the second assumption, removing higher order terms H and dividing by 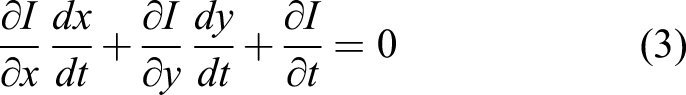

Equation (4) is called the optical flow equation, which is an aperture problem, u and v are the optical flow in x and y direction, a unique solution cannot be obtained from this equation with two unknown variables
In general, dense optical flow calculated all the pixels in an image at the same time, which can provide high spatial resolution measurements. The sparse optical flow calculated the optical flow of a pixel at once, which shows the advantages of high computational efficiency and real-time measurement. In this paper, in order to improve the efficiency of crack detection, the sparse optical flow algorithm and information entropy are first used to detect crack areas, and then the dense optical flow and information entropy are used to locate the crack.
The algorithm of sparse optical flow
Among all method in sparse optical flow, one of which was developed by Lucas and Kanade.
30
This solution operates under the assumption that the pixels around the feature point have similar motion, where the feature point is the pixel with distinguishing features from other pixels. As in equation (5), consider a feature point p and its neighborhood of k pixels; since the pixels in this window have the same motion, we have a total of k equations that satisfy the formula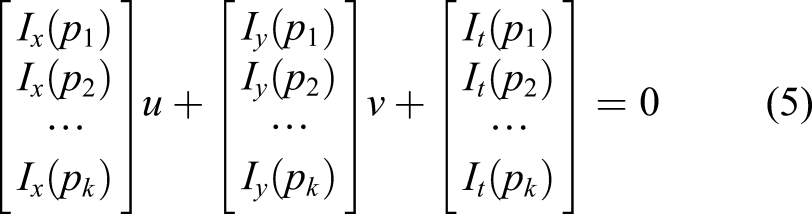
Denote that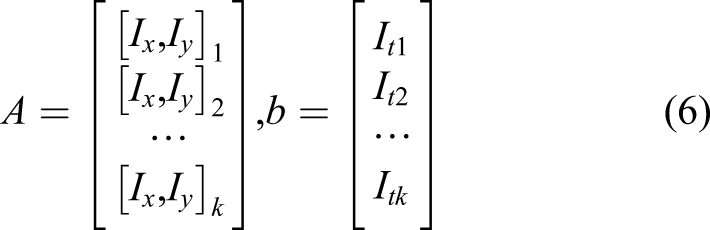
The equation (5) can be written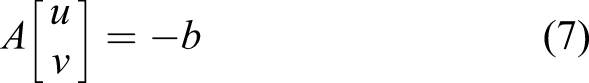
Equation (7) is over-determined since they have more equations than unknowns; the method of finding the least-squares solution to solve the linear equation is employed. The optical flow 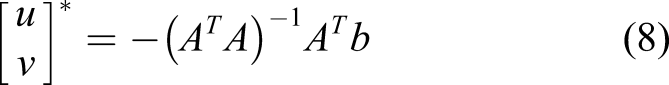
In a real-world application, the feature points are first selected in the current frame and instead of physical manual markers. Then, the optical flow vectors are calculated to track the locations of the feature points in the consecutive images. Finally, the motions of structural will be determined in terms of the feature points’ movements.
The algorithm of dense optical flow
Compared with the sparse optical flow, the dense optical flow calculated all the pixels in an image at the same time, one of which was developed by Horn–Schunck (H–S),
31
which involves evaluating first-order intensity differentials, but rather than evaluating in a local window. Horn and Schunck introduce a global smoothness constraint which assumes that brightness patterns within an image vary smoothly everywhere. The smoothness constraint is given by minimizing
which can also be expressed as
The optical flow is then determined by minimizing the squared error quantity of the equation (4) and smoothness constraint (9). The error to be minimized is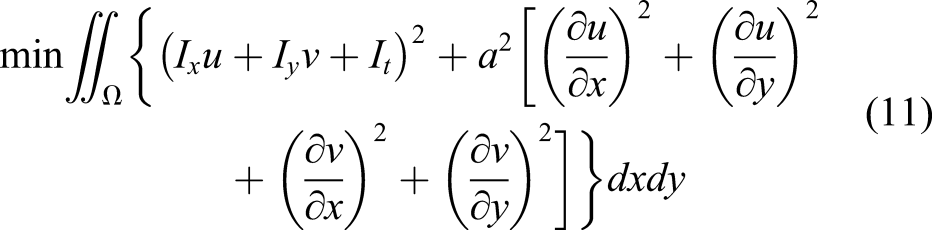
The minimization problem in equation (11) can be reduced to solving a set of differential equations. The equations are generated using calculus of variation, giving

A solution to equations (12) and (13) is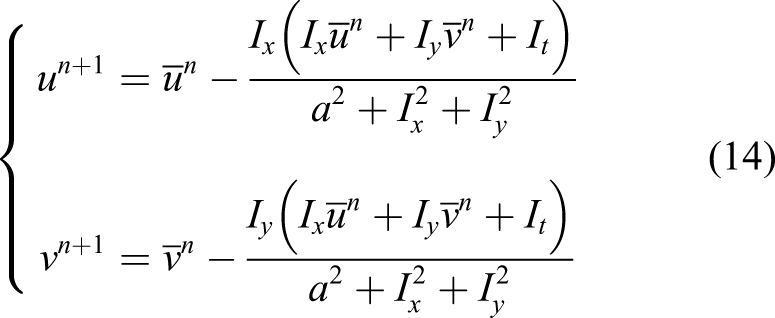
The algorithm of optical flow information entropy
In this paper, to improve the efficiency of crack detection, the sparse optical flow information entropy is first calculated to detect crack area, and then the dense optical flow information entropy is calculated to describe the morphology of the crack. The details are as follows:
Considering that structural cracks are a phenomenon of local structural damage, the first step in identifying the cracked area in the entire image is to divide the image into different sub-regions
To improve the efficiency of crack detection, instead of calculating the optical flow of all the pixels within the sub-region, the optical flow of the feature points within the sub-region is calculated to represent the motion state of the sub-region. According to equation (8) in the algorithm of sparse optical flow, if the matrix 
In real application, the pixels of index R within a sub-region are first calculated. Then, by sorting them by the value of index R, the feature points can be selected by choosing the pixels with the larger R. Finally, the optical flow of feature points is calculated using the sparse optical flow algorithm.
Assuming that the number of feature points detected in a sub-region 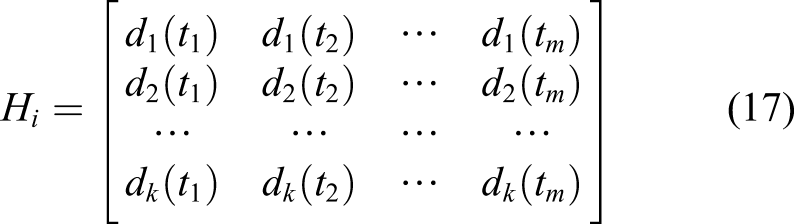

For the matrix H in equation (17), a singular value of the matrix can represent the distribution of singular value size. The singular value is also a characteristic inherent to the quaternary matrix that constitutes an index to measure the stability of the matrix; thus, when an element within the quaternary matrix changes, the singular value will change accordingly.
33
To quantitatively describe the matrix’s intrinsic properties, in this paper, the singular value decomposition (SVD) is used to obtain the singular value
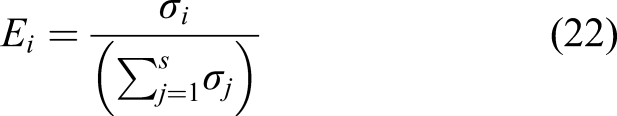
Consider the increase in vibration irregularity within the crack area when compared with the intact area. To quantitatively characterize the variation of the motion state of different sub-regions, an information entropy theory, which is a physical quantity that represents the degree of chaos of molecular states and is used to describe the uncertainty of information sources, can be introduced. The equation for information entropy is given as follows
By using the information entropy conditions in equation (19), the formula for calculating the sparse optical flow information entropy in a sub-region can be constructed as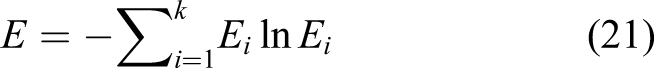
Once the sparse optical flow information entropy is calculated at different sub-regions, the crack area is detected by comparing the sparse optical flow information entropy among all sub-regions. Then, the sub-regions with cracks have been partitioned into small-regions, and the dense optical flow algorithm is applied to each small-region to calculate the dense optical flow information entropy to describe the morphology of cracks.
Methods validation
The proposed method for crack detection and localization is validated in this part through two experimental tests under various conditions. The experiment in case 1 refers to a structure with a simple surface texture. Case 2 refers to an experiment in which the structure’s surface texture is complex. The details are as follows.
Experiment validation
Case 1
In this section, the experiment on the fatigue crack is constructed with cyclic loading. The experiment is implemented with No.45 steel which is a carbon constructional quality steel (GB710-88) widely used in modern machinery field. The geometry dimensions of the specimens are 100 mm × 42 mm × 6 mm as shown in Figure 2(a). An initial U-notch is located at the edge of specimen and it is mechanically processed by electro-discharging machining with the length of 20 mm and the root radius 0.2 mm. (a) The geometry of the specimen adopted in the experiment (unit: mm) and (b) the experimental setup.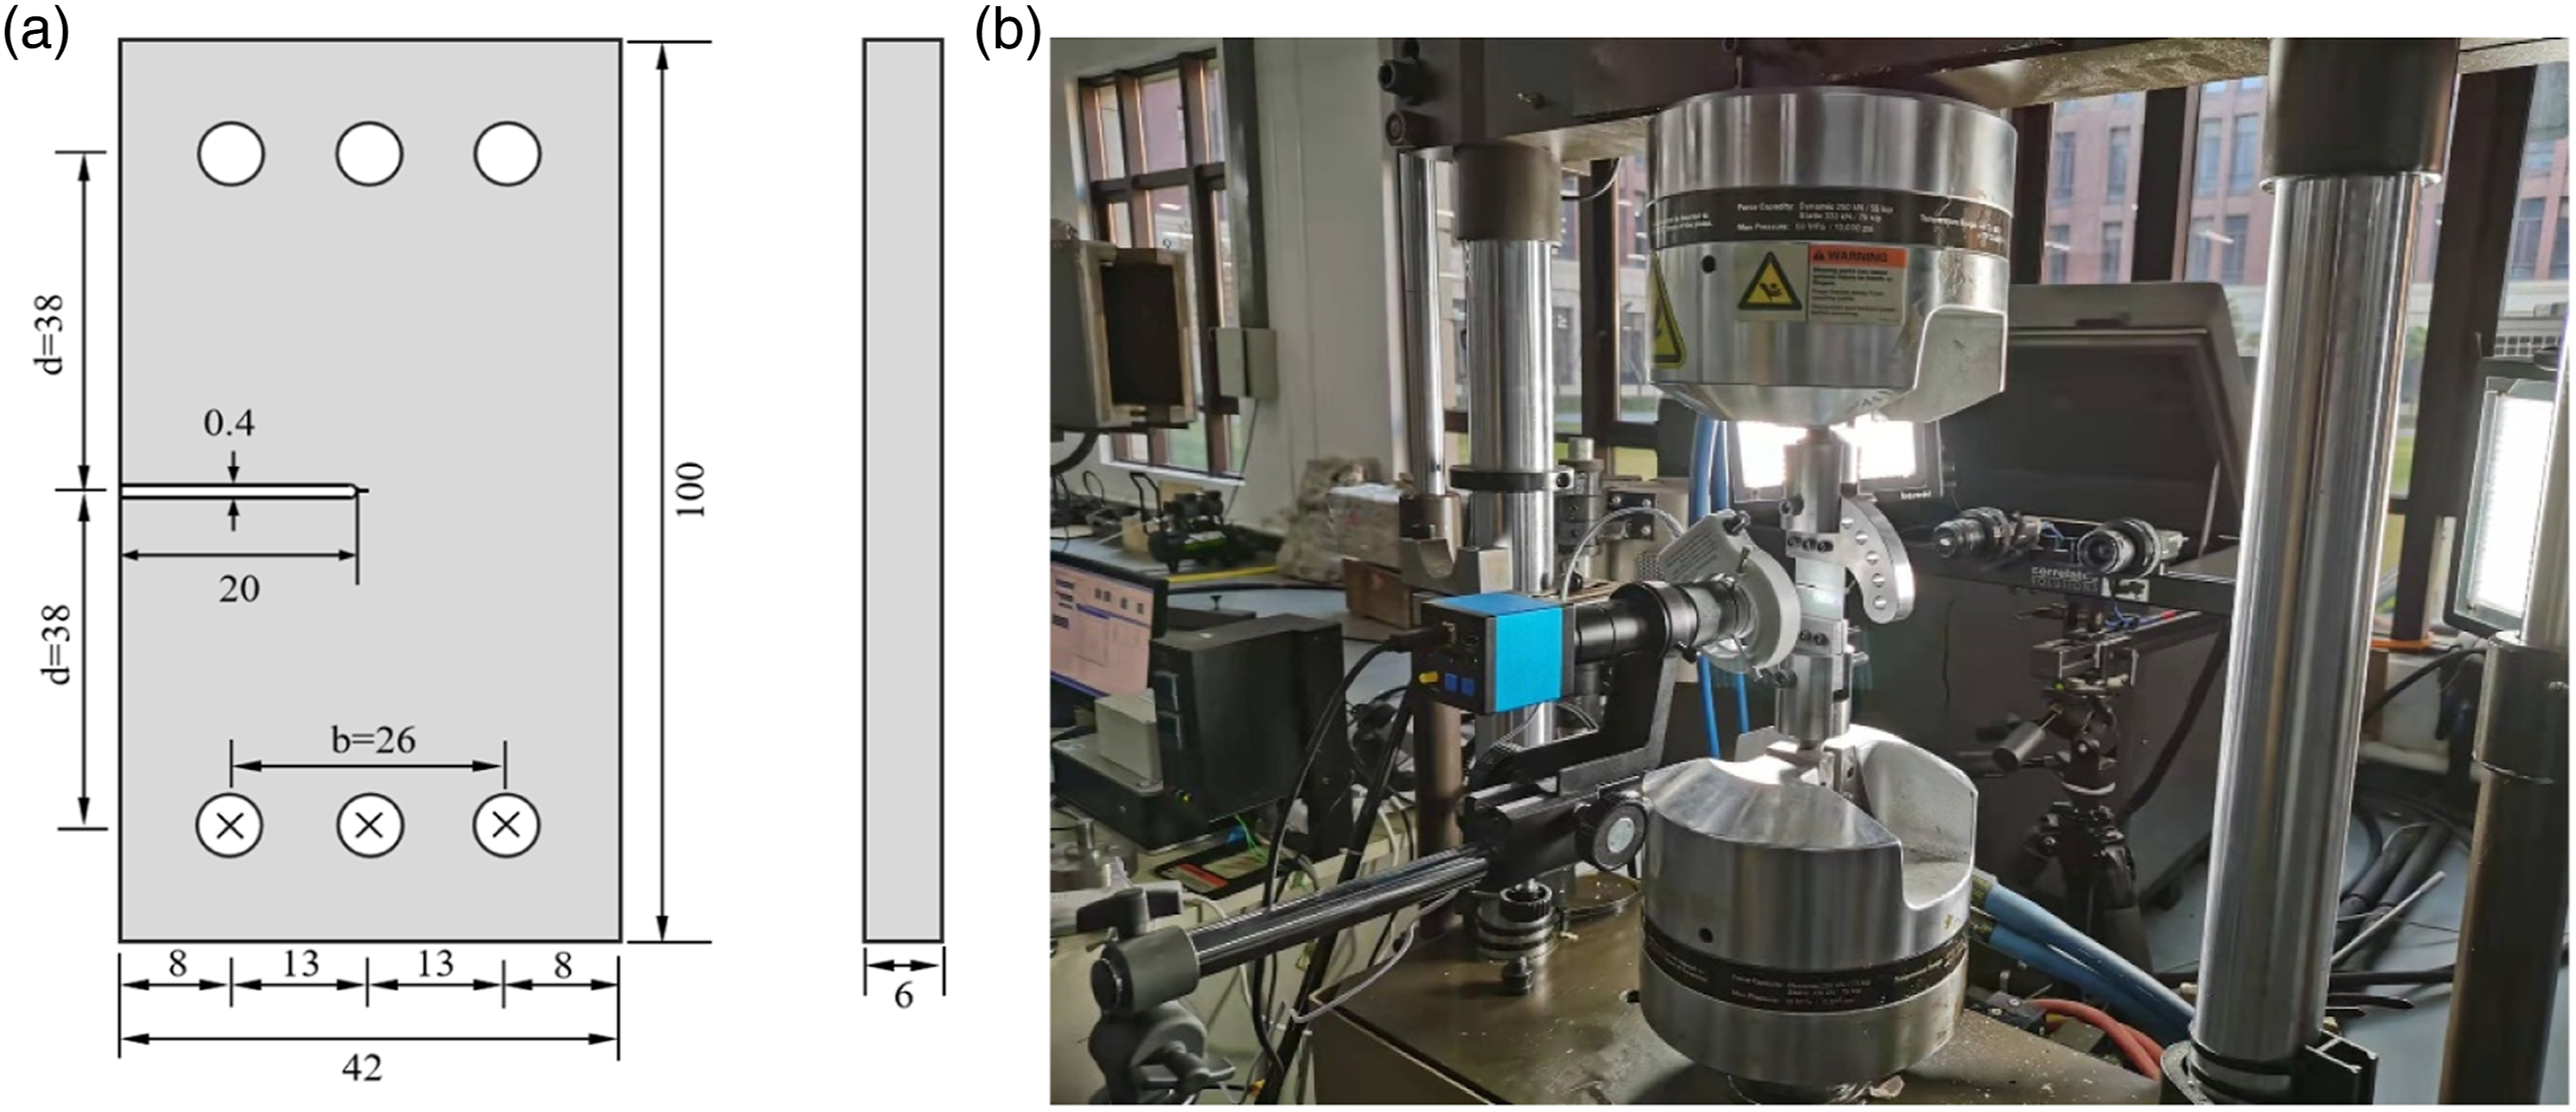
The experimental setup is shown in Figure 2(b), the fatigue crack test is carried out on a MTS 880 servo-hydraulic uniaxial test machine. The procedure is carried out with a maximum load of 9 kN with the loading cycles, the frame rate of cyclic loading is 1 Hz. The consumer-grade digital camera (industrial CCD camera Mars 5000s-160CM) is used to capture structure motion. The maximum frame rate is 160 frames per second, the cell size is 3.14 μm square, the operating temperature is 0–45 degrees Celsius, the chip type is Sony IMAX250, the image resolution is 2488*2048 pixels, and the internal memory is 16 GB. In this experiment, the speed of collecting photos is 40 frames per second, and 200 frames are recorded in 5 s. The distance between camera and specimen is 93 cm.
The captured image is shown in Figure 3(a), as it can be seen that the structure’s surface texture is simple. According to the scale between image and physical coordinate, the size of crack is microscale. In order to improve the efficiency of crack detection, the damage zone is chosen, and there are some false cracks in the damage zone. The blue arrow indicates the load direction. Figure 3(b) is the motion of the feature point P1 calculated by the sparse optical flow algorithm. (a) The loading direction and the dangerous zones and (b) the motion of the feature point by optical flow algorithm.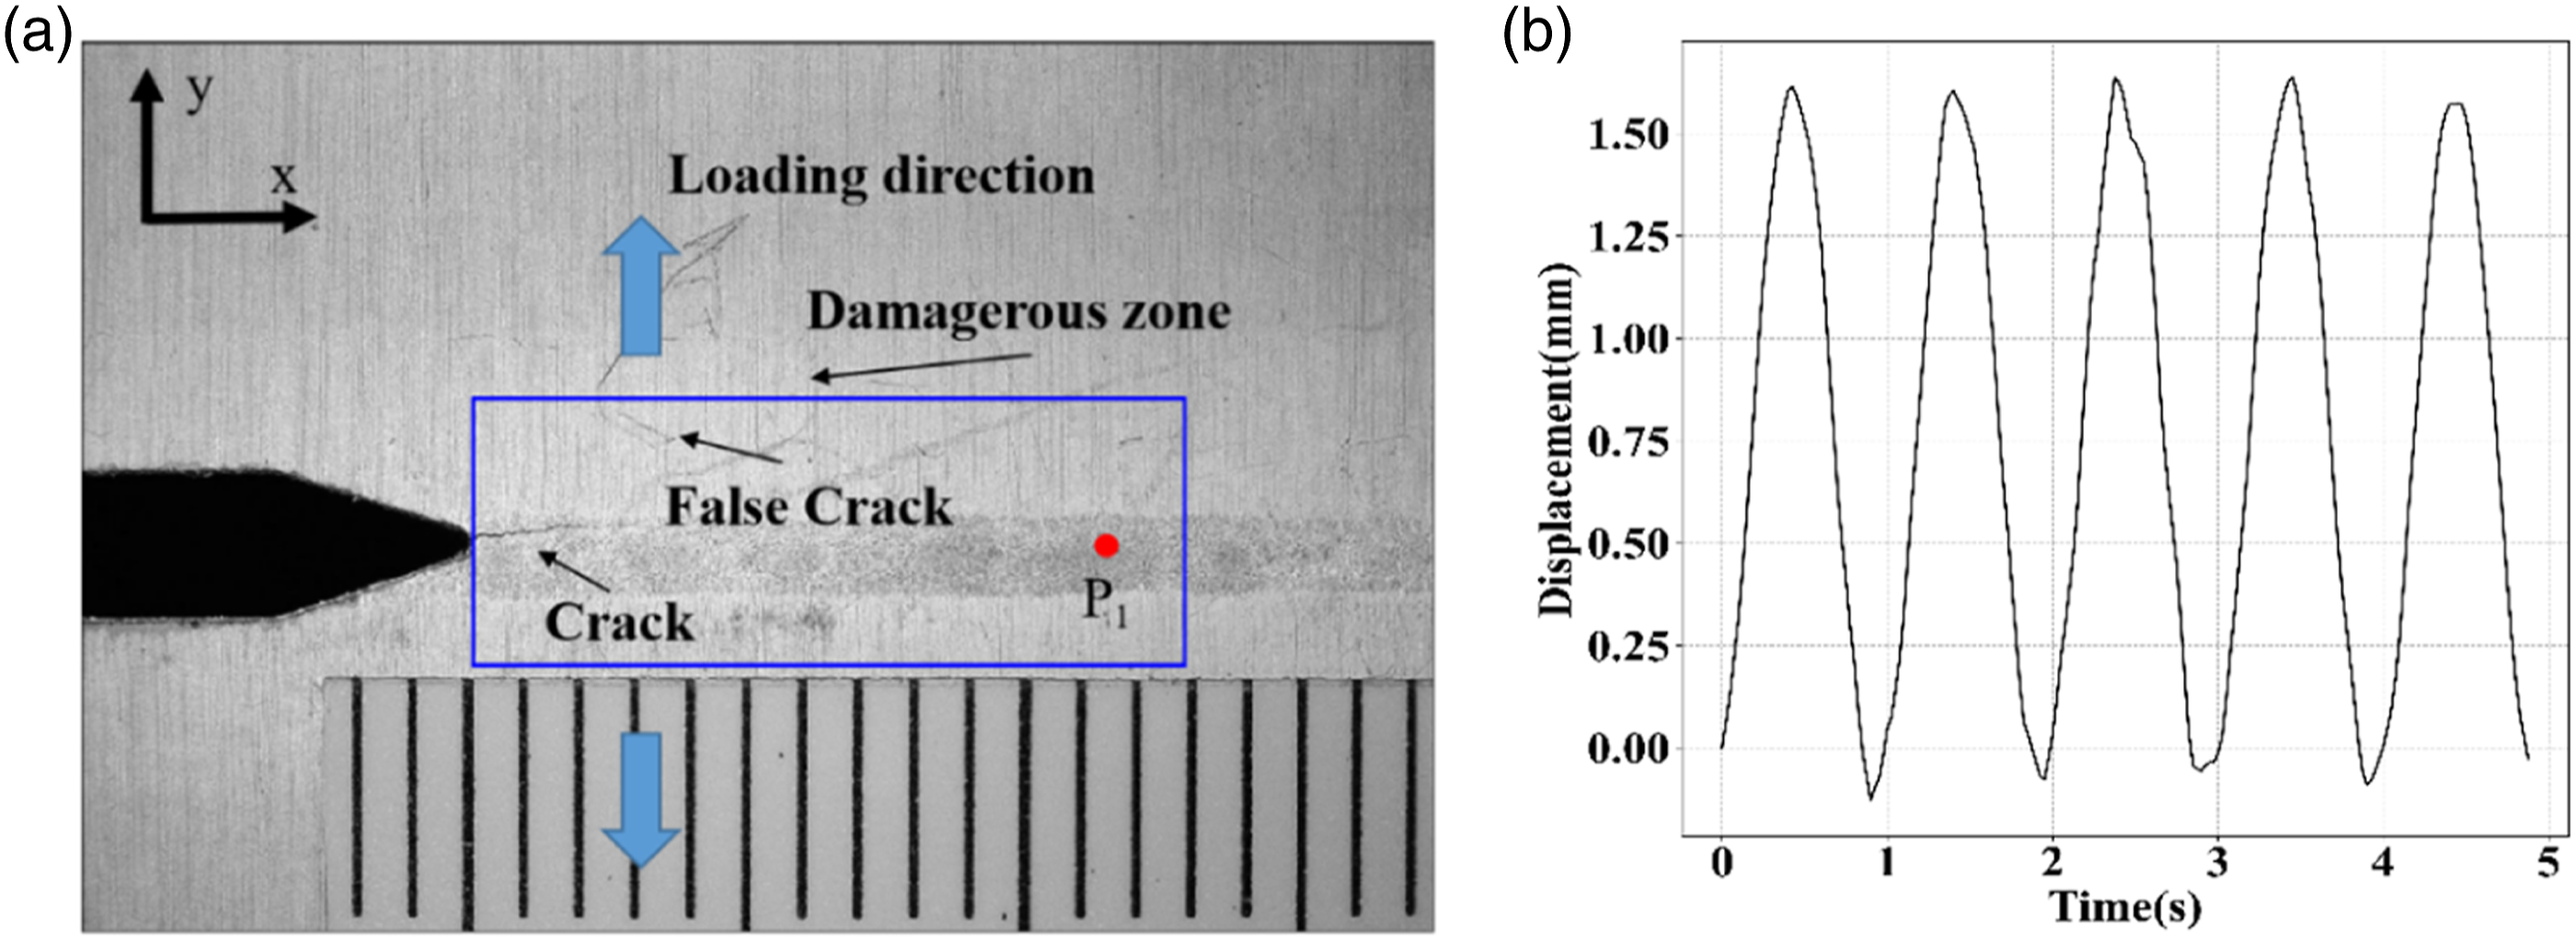
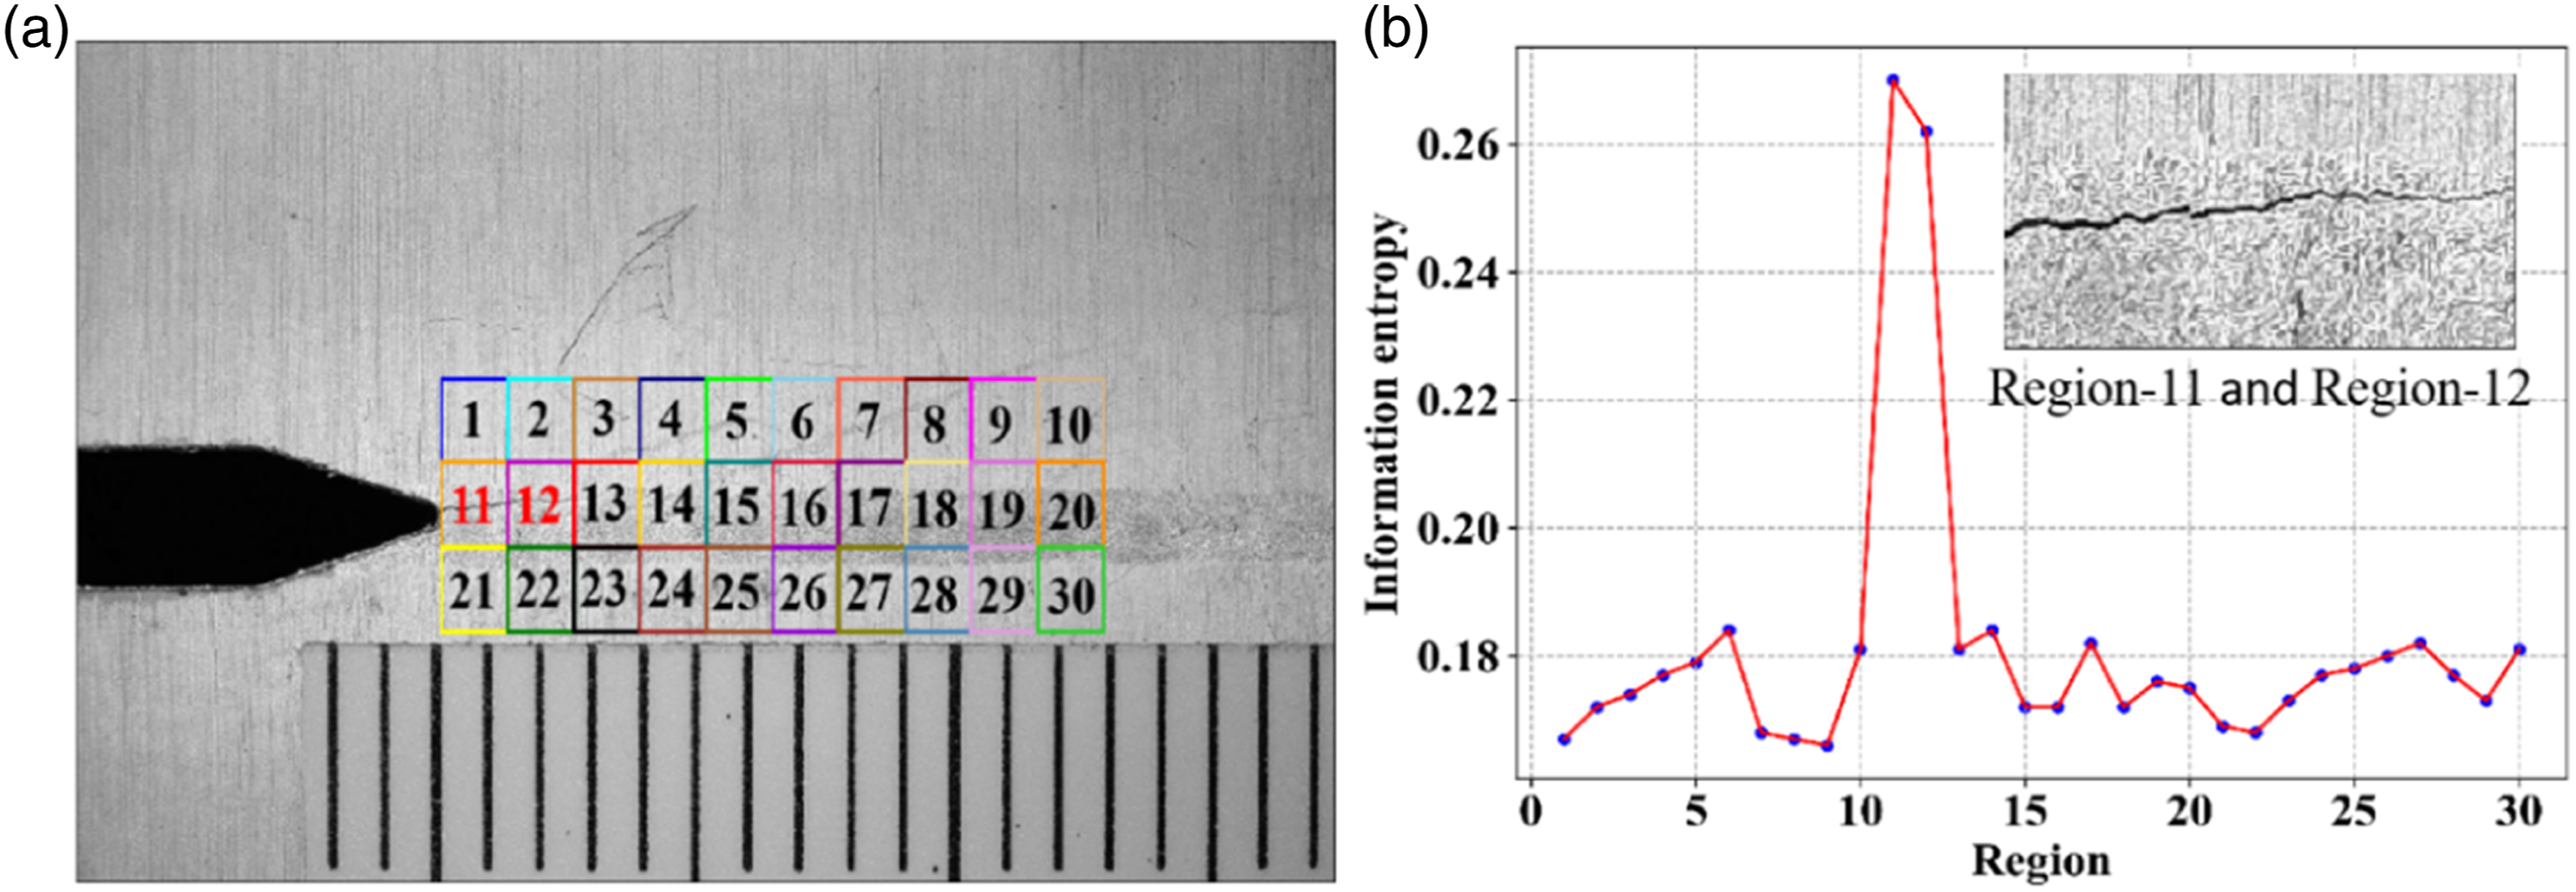
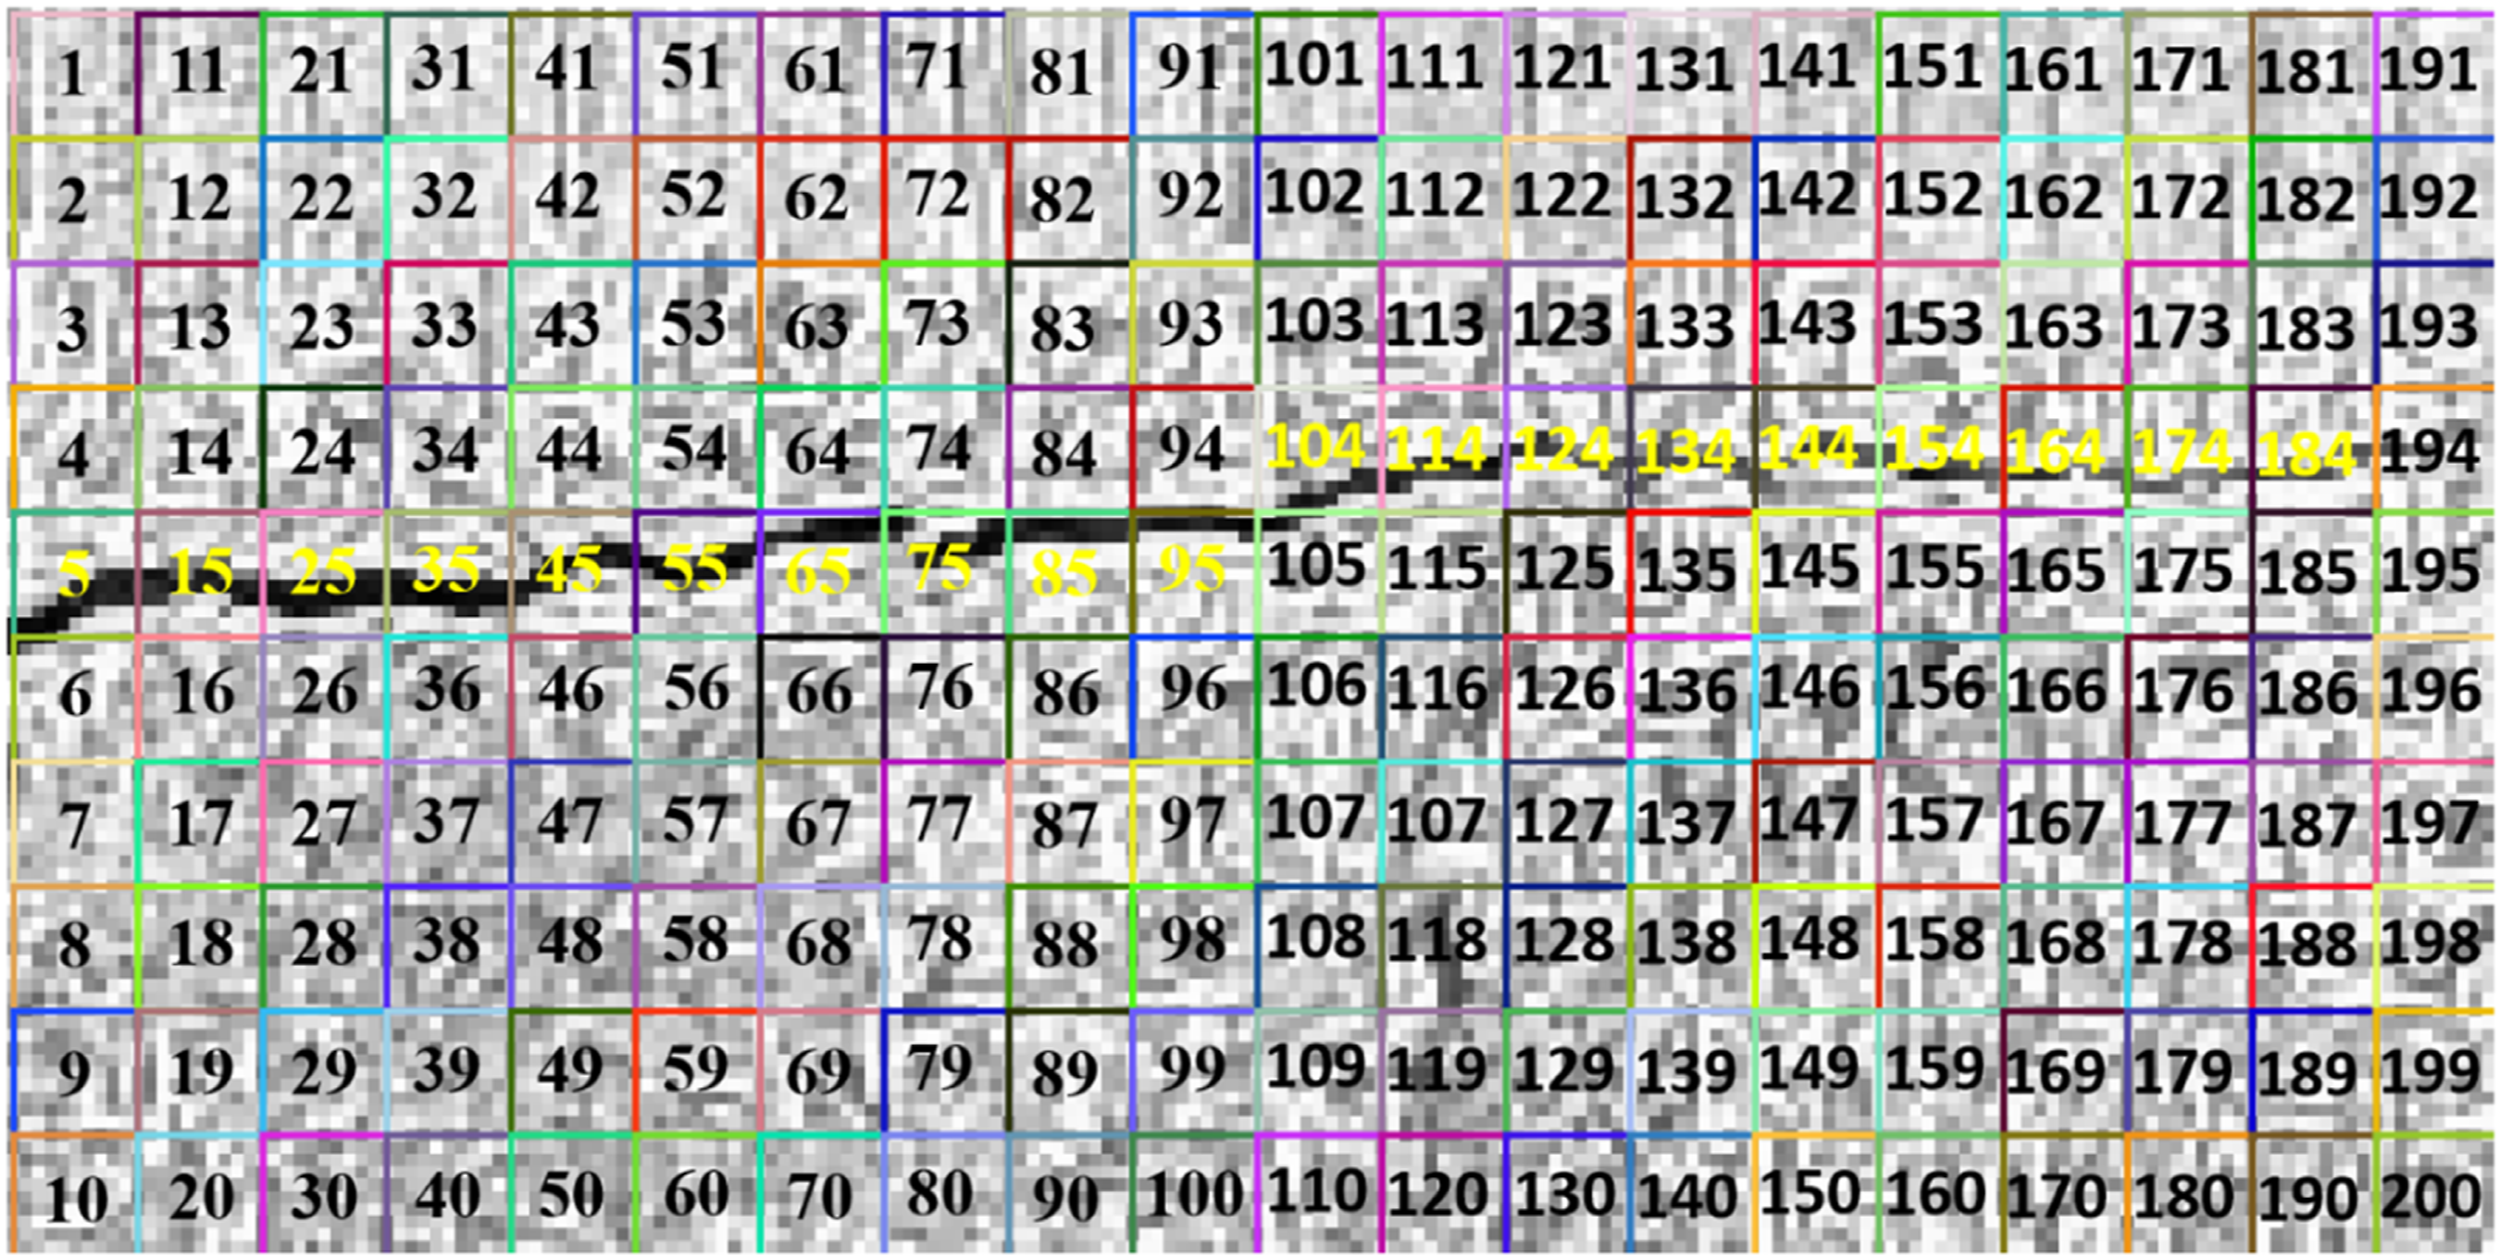
The first thing is to divide the dangerous zone into several sub-regions, as it can be seen in Figure 4(a), the 30 sub-regions have been partitioned, and the size of sub-region is 100 × 100 pixels. Then, the features points are selected from different sub-regions by applying the index R. The selected features points of one of the sub-regions are shown in Figure 4(b). Once the feature points have been selected from the different sub-regions, the sparse optical flow is applied to the feature points to calculate the optical flow and calculate the sparse optical flow information entropy for each sub-regions. Figure 5(a) is the label of sub-regions. The results of sparse optical flow information entropy at different sub-regions are shown in Figure 5(b), where it can be seen that sub-region-11 and sub-region-12 have relatively higher sparse optical flow information entropy than other sub-regions. The enlarge images of sub-regions-11 and sub-region-12 are shown in Figure 5(b). It can be seen that the sub-regions exist in the crack. The results show that the proposed method can detect the crack area effectively. (a) The partitioned sub-regions in damager zone and (b) the detected feature points. (a) The label of sub-regions and (b) the results of sparse optical flow information entropy at different sub-regions.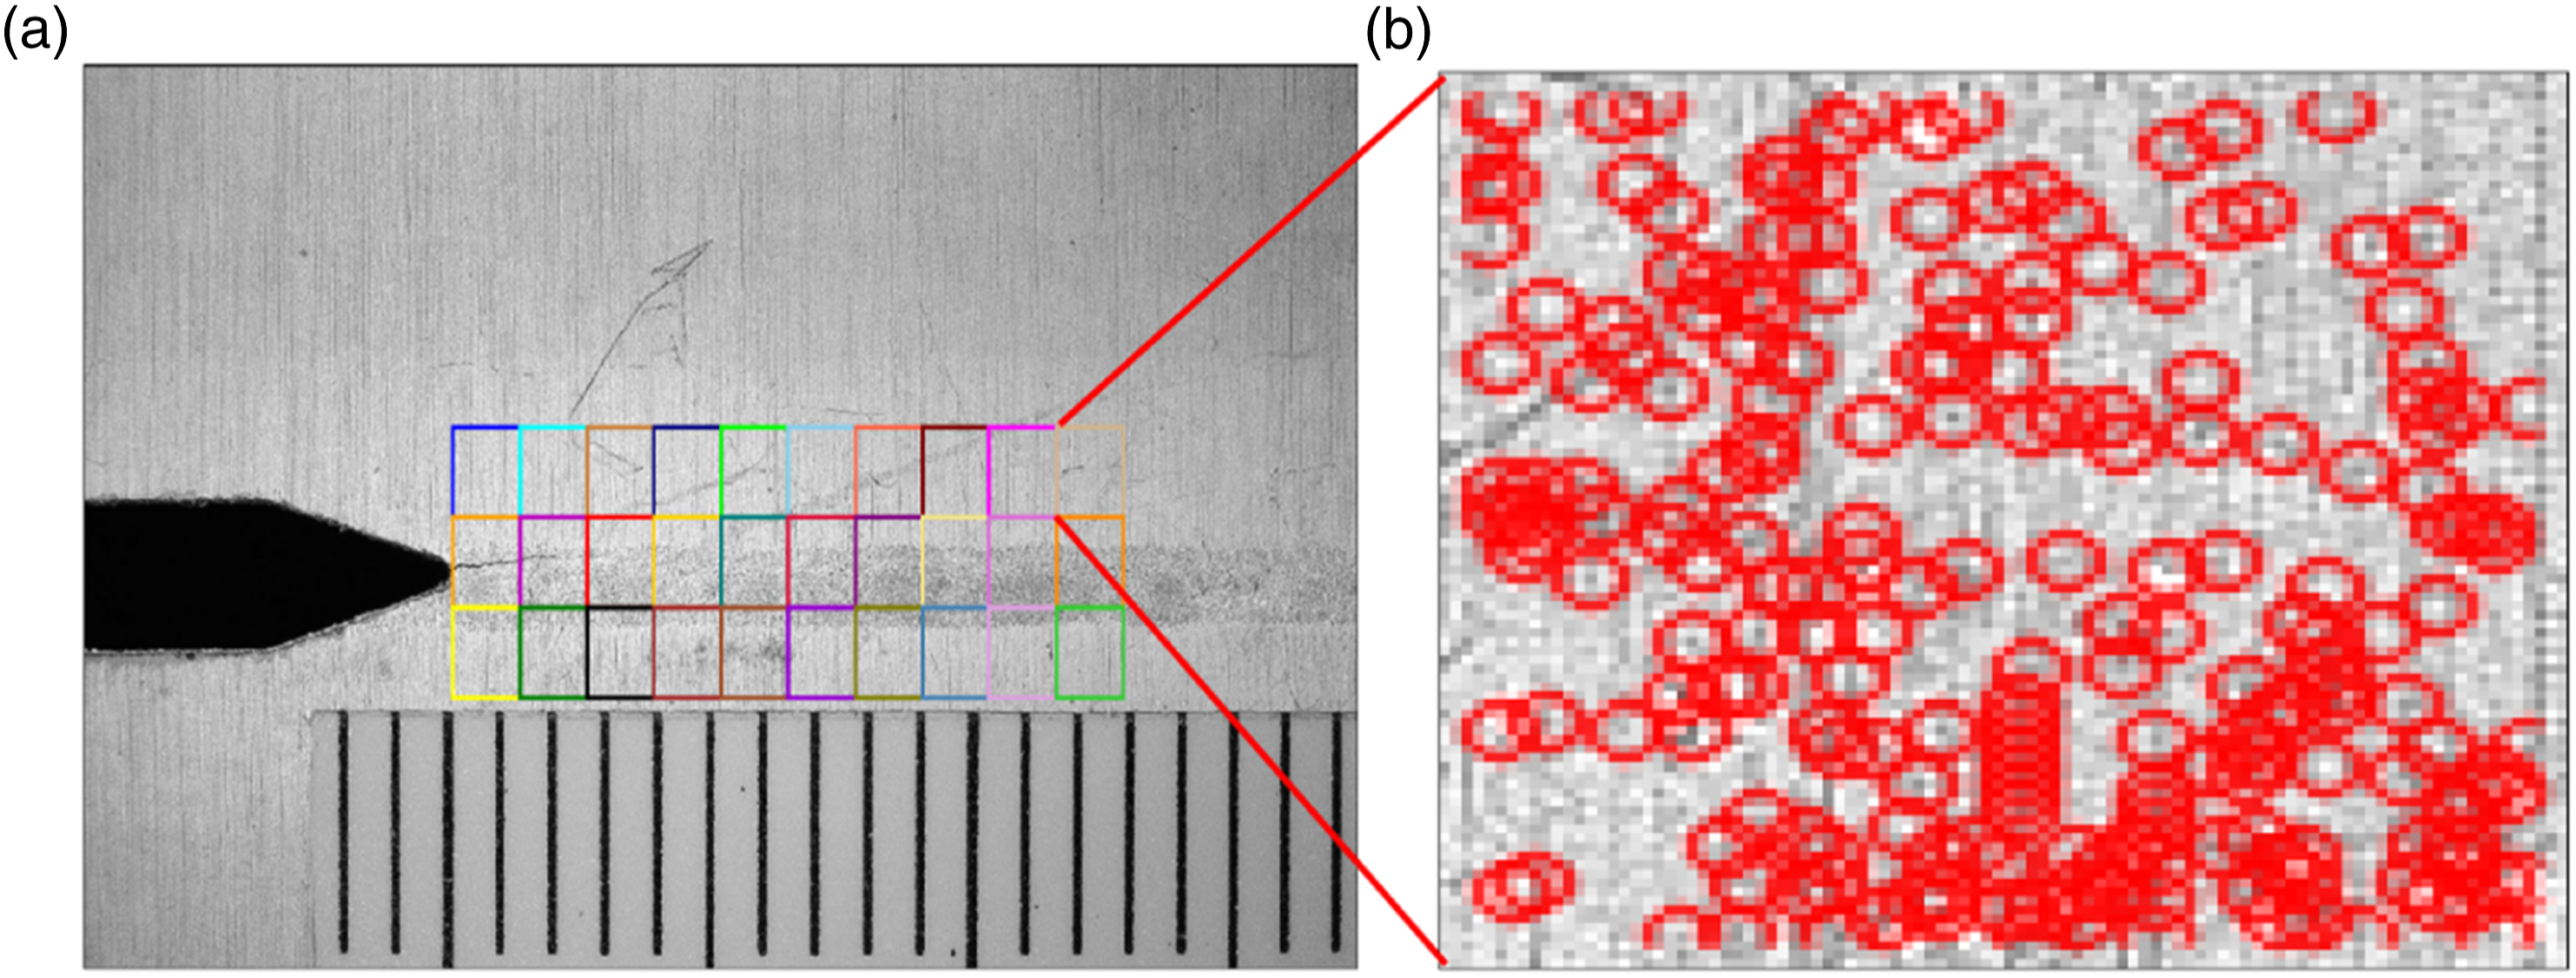
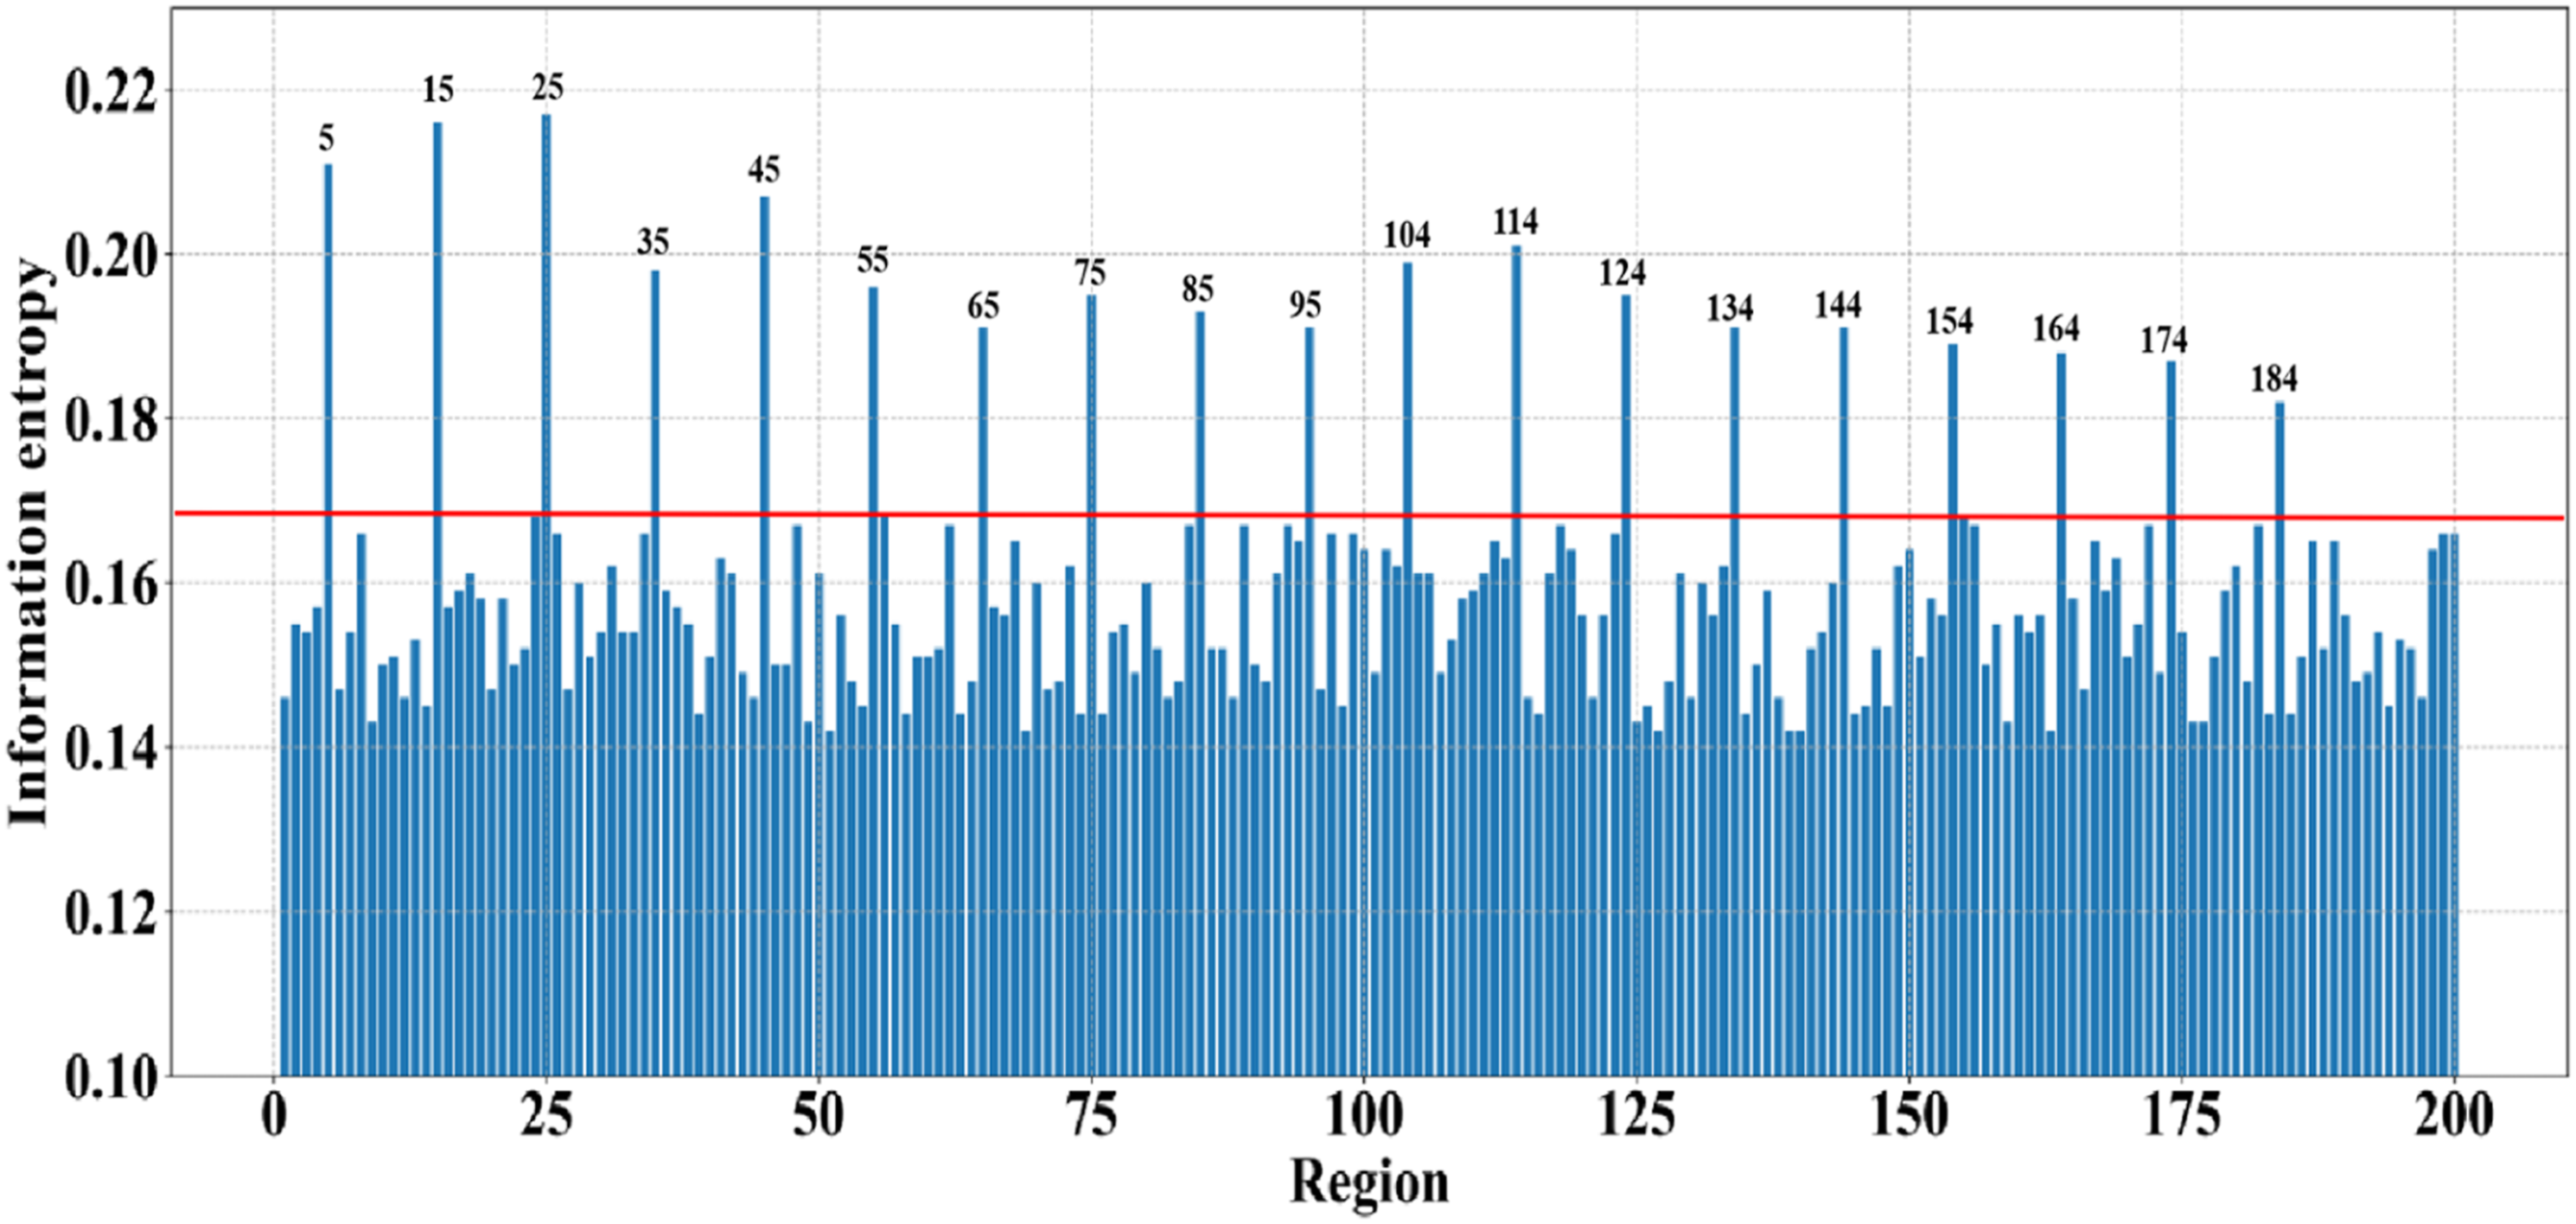
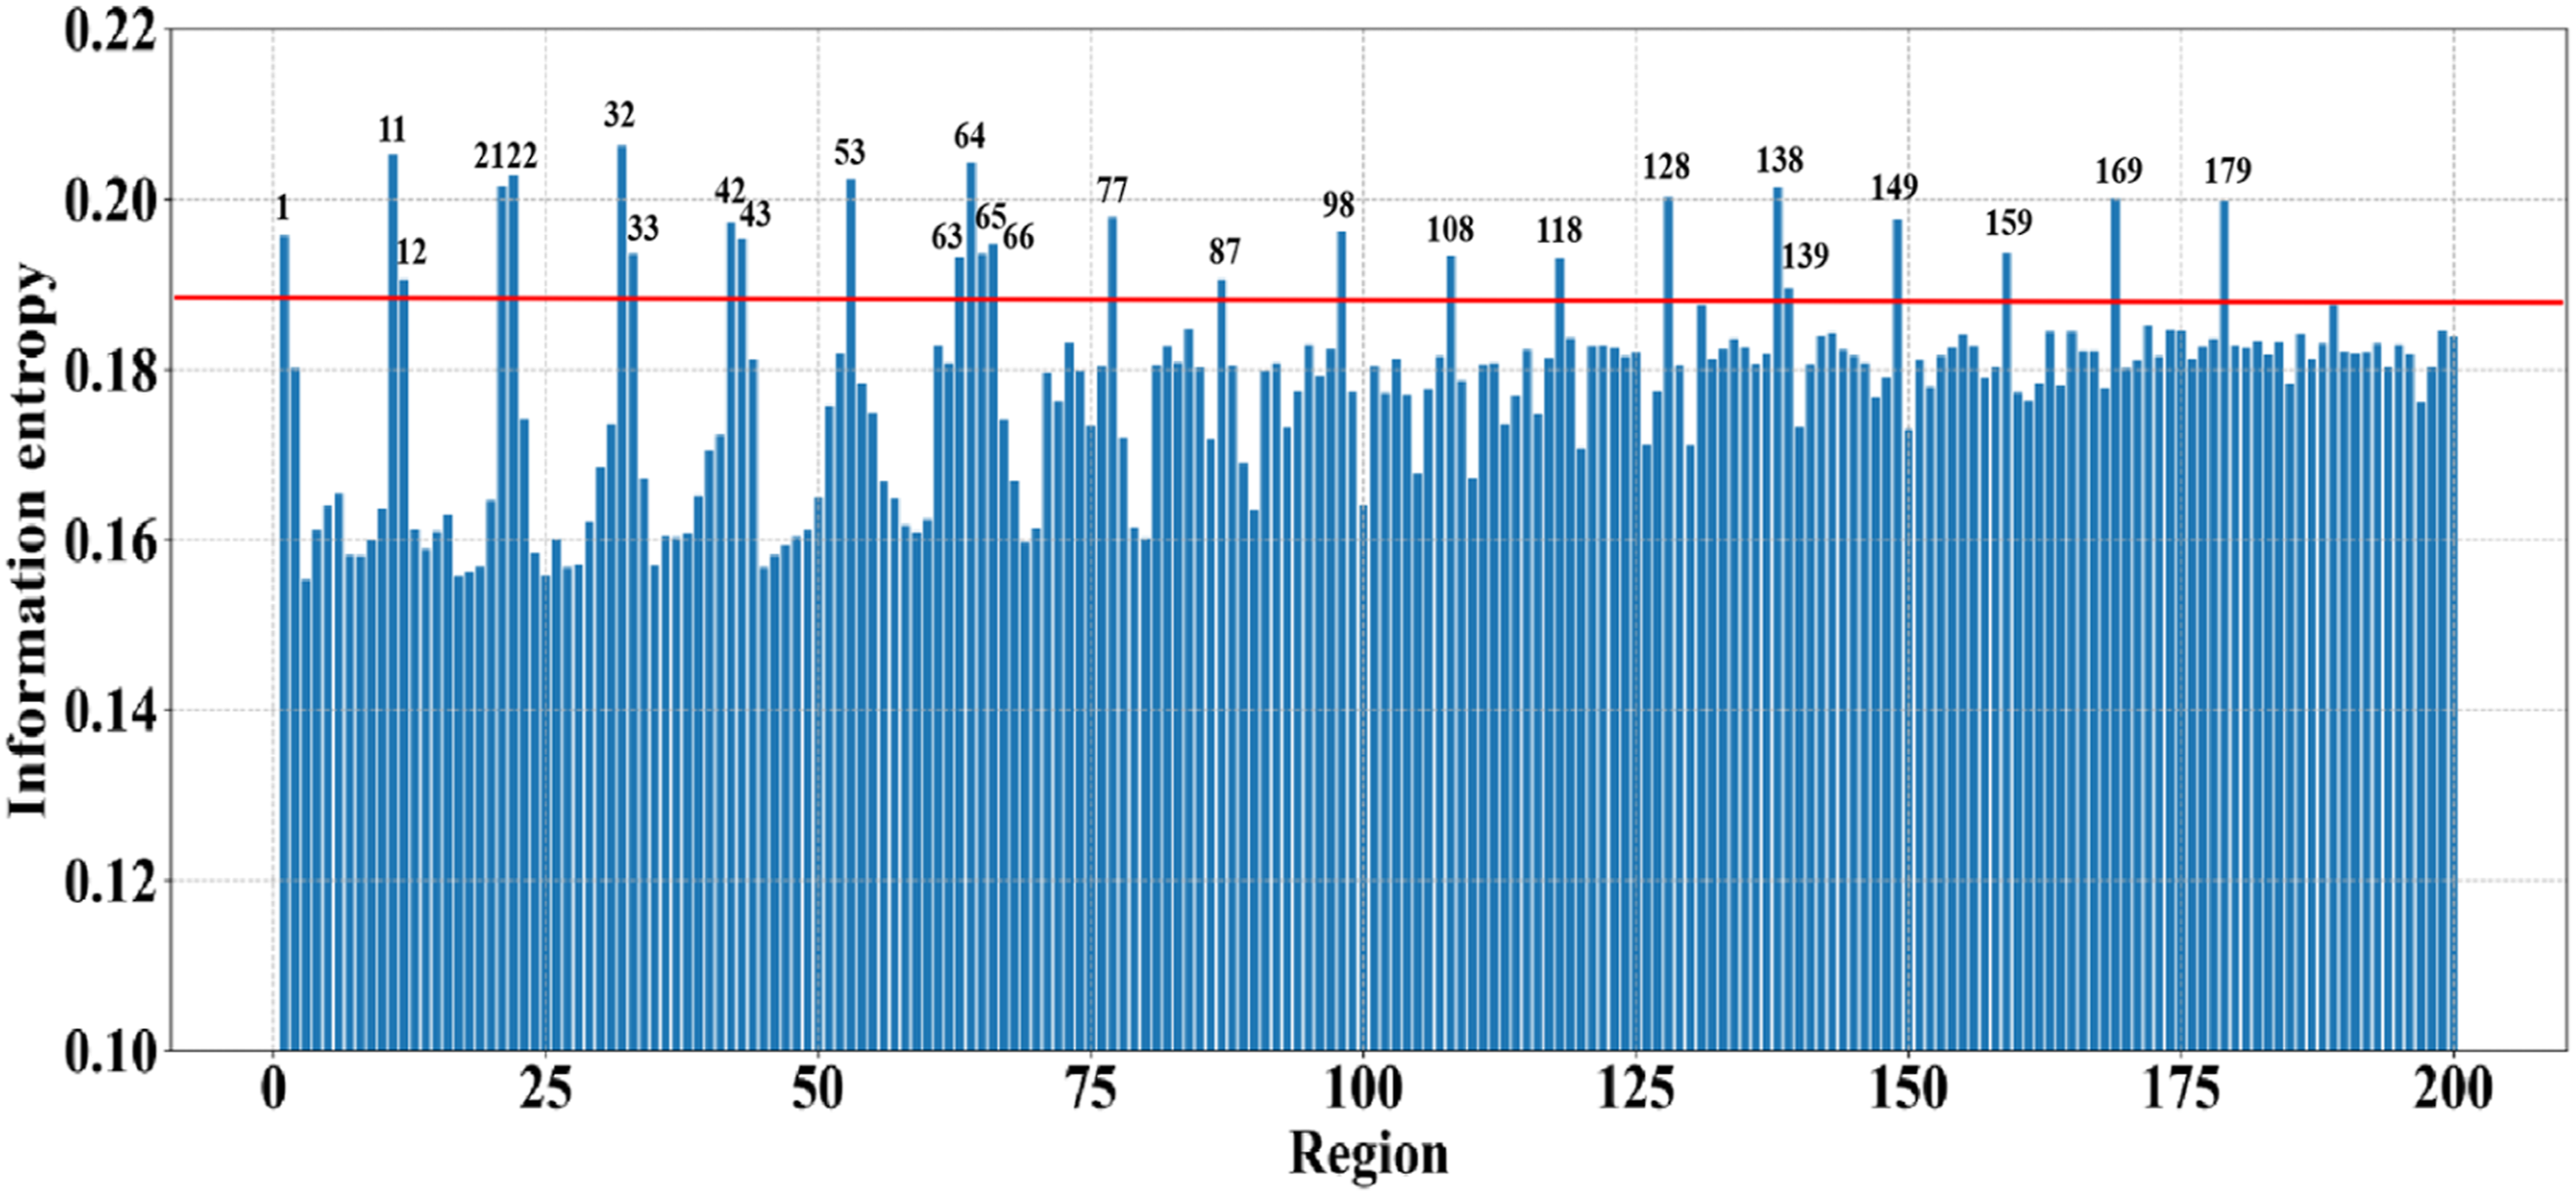
To further describe the morphology of cracks, the sub-region-11 and sub-region-12 have been partitioned into 200 small-regions as shown in Figure 6. The size of each small-region is 10*10 pixels. Then, the dense optical flow is applied to each small-region to calculate the dense optical flow information entropy. The results of dense optical flow information entropy are shown in Figure 7, as it can be seen that the different small-regions have different values. In this paper, the morphology of cracks can be described by small-regions that have higher dense optical flow information entropy than any other small-regions. The small-regions with higher information entropy than the threshold are marketed by the yellow number as shown in Figure 8. The results show that the proposed method for crack localization can describe the morphology effectively. The partitioned small-region in crack sub-regions. The results of information entropy of different small-regions. The located crack by dense optical flow information entropy.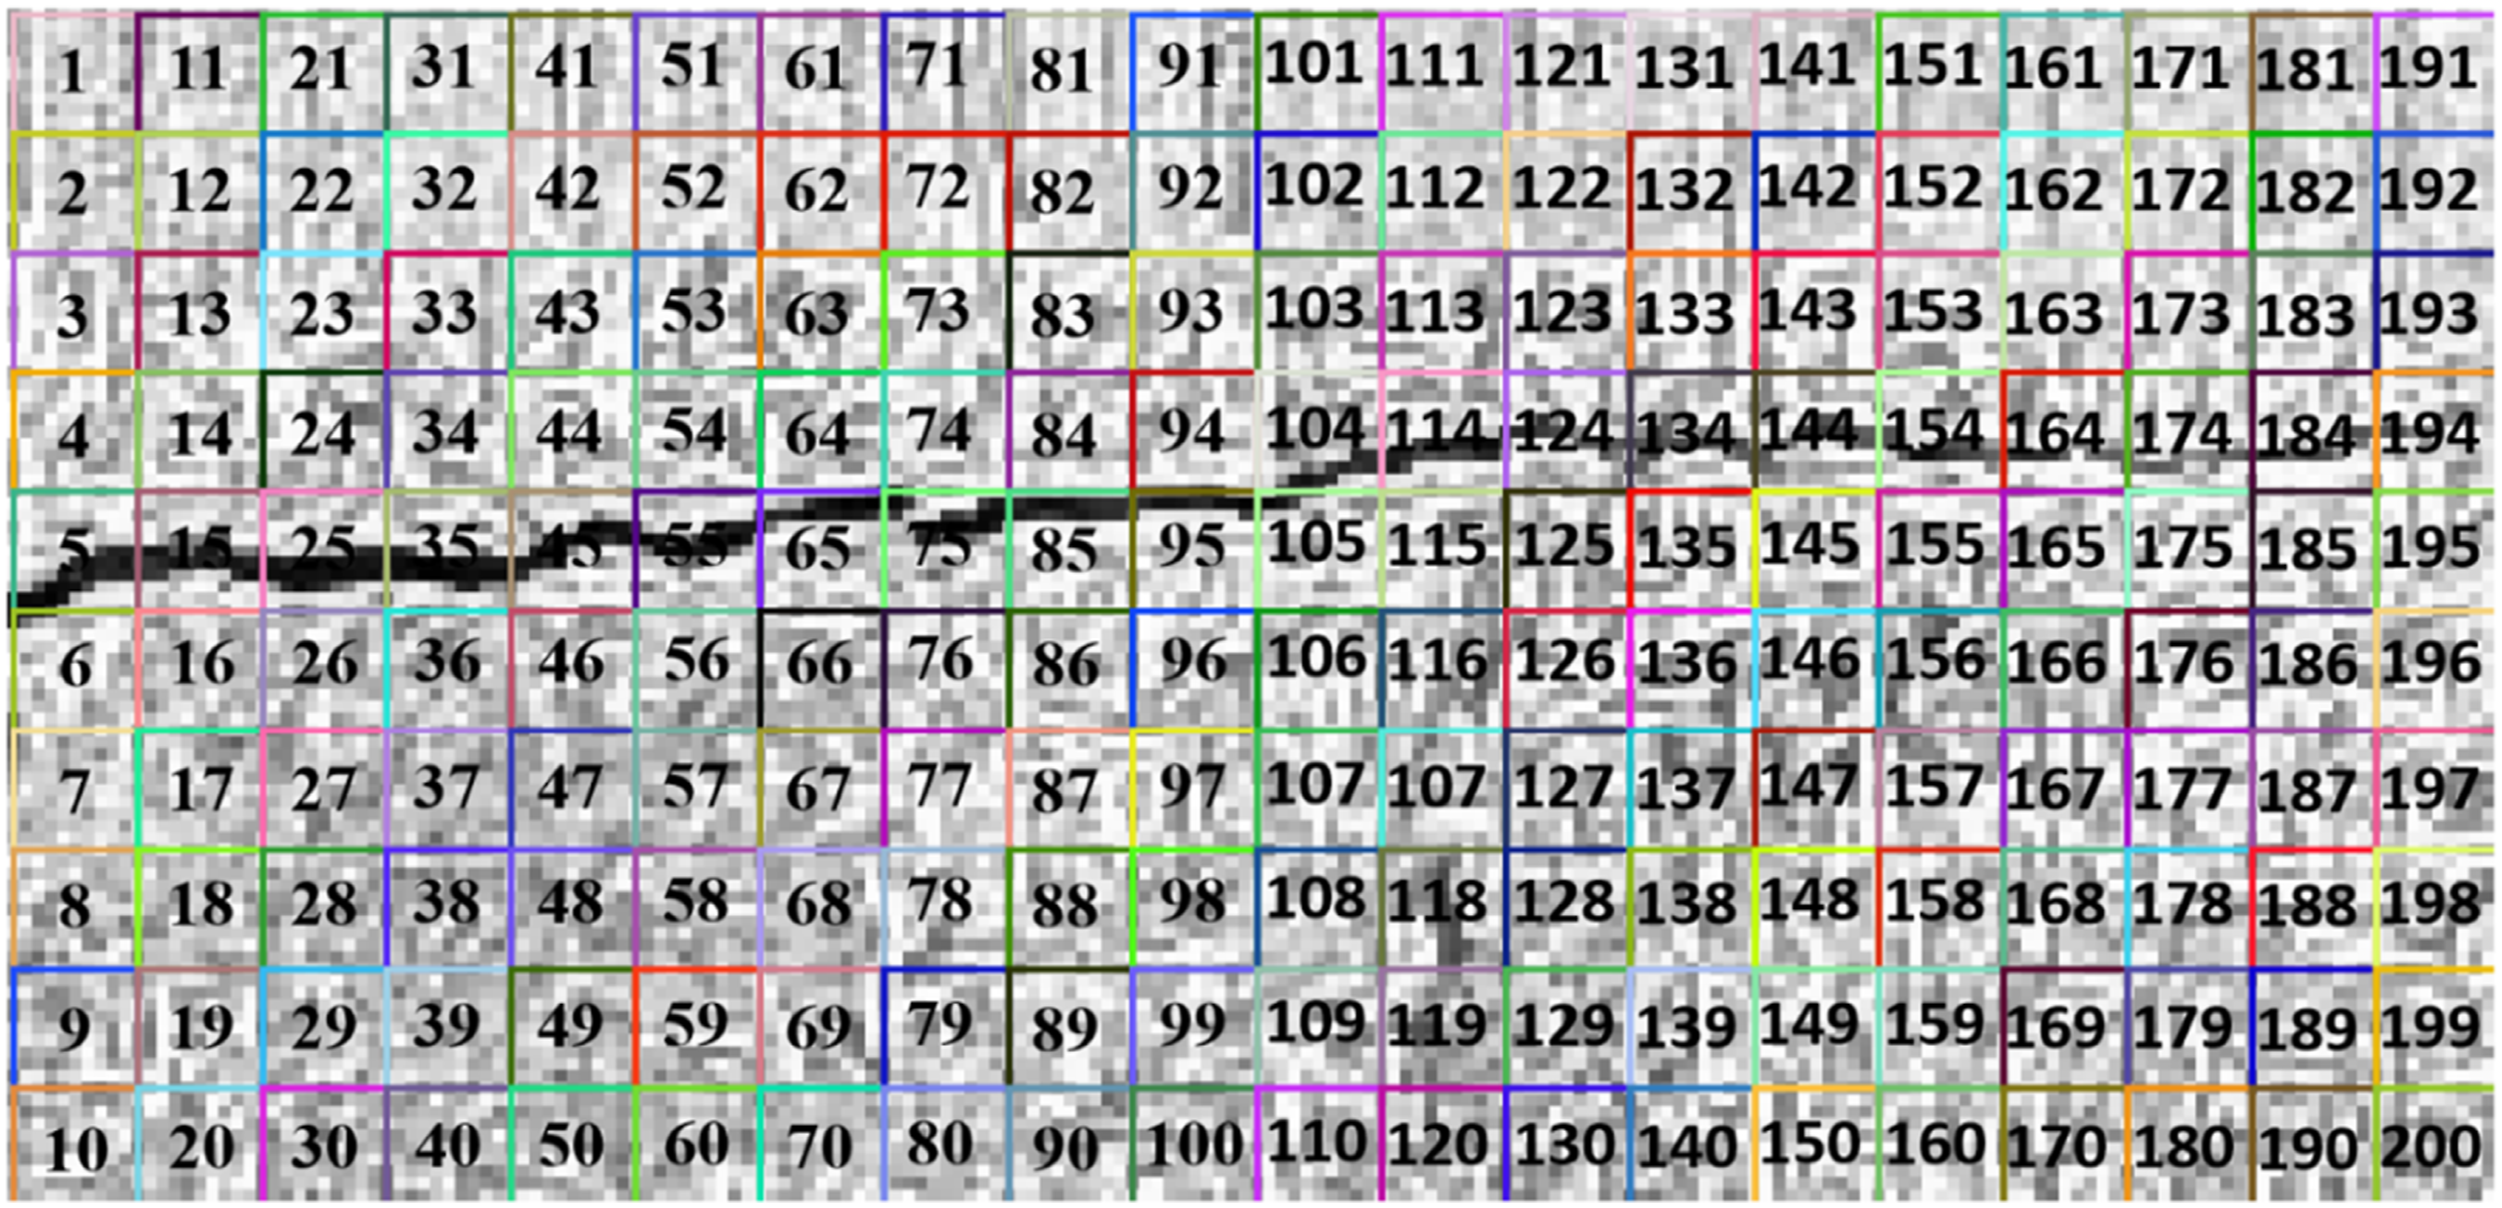
Case 2
In order to further validate the efficiency of the proposed method in a complex environment, the experiment is designed in this section. The geometry of the specimen and the experimental setup are shown in Figure 9(a) and Figure 9(b), respectively. There are two differences between the experiments in case 2 and case 1. 1. The crack features in cases 1 and 2 are different due to the different clamping methods. The crack in case 1 is straight, and the crack in case 2 is oblique. The enlarged image of the clamping method in case 2 is shown in Figure 9(b). 2. The structure’s surface texture is more complex than in case 1, and the speckle was sprayed on the surface of the specimen in case 2, making it difficult to directly observe the crack area. (a) The geometry of the specimen adopted in the experiment (unit: mm) and (b) the experimental setup.
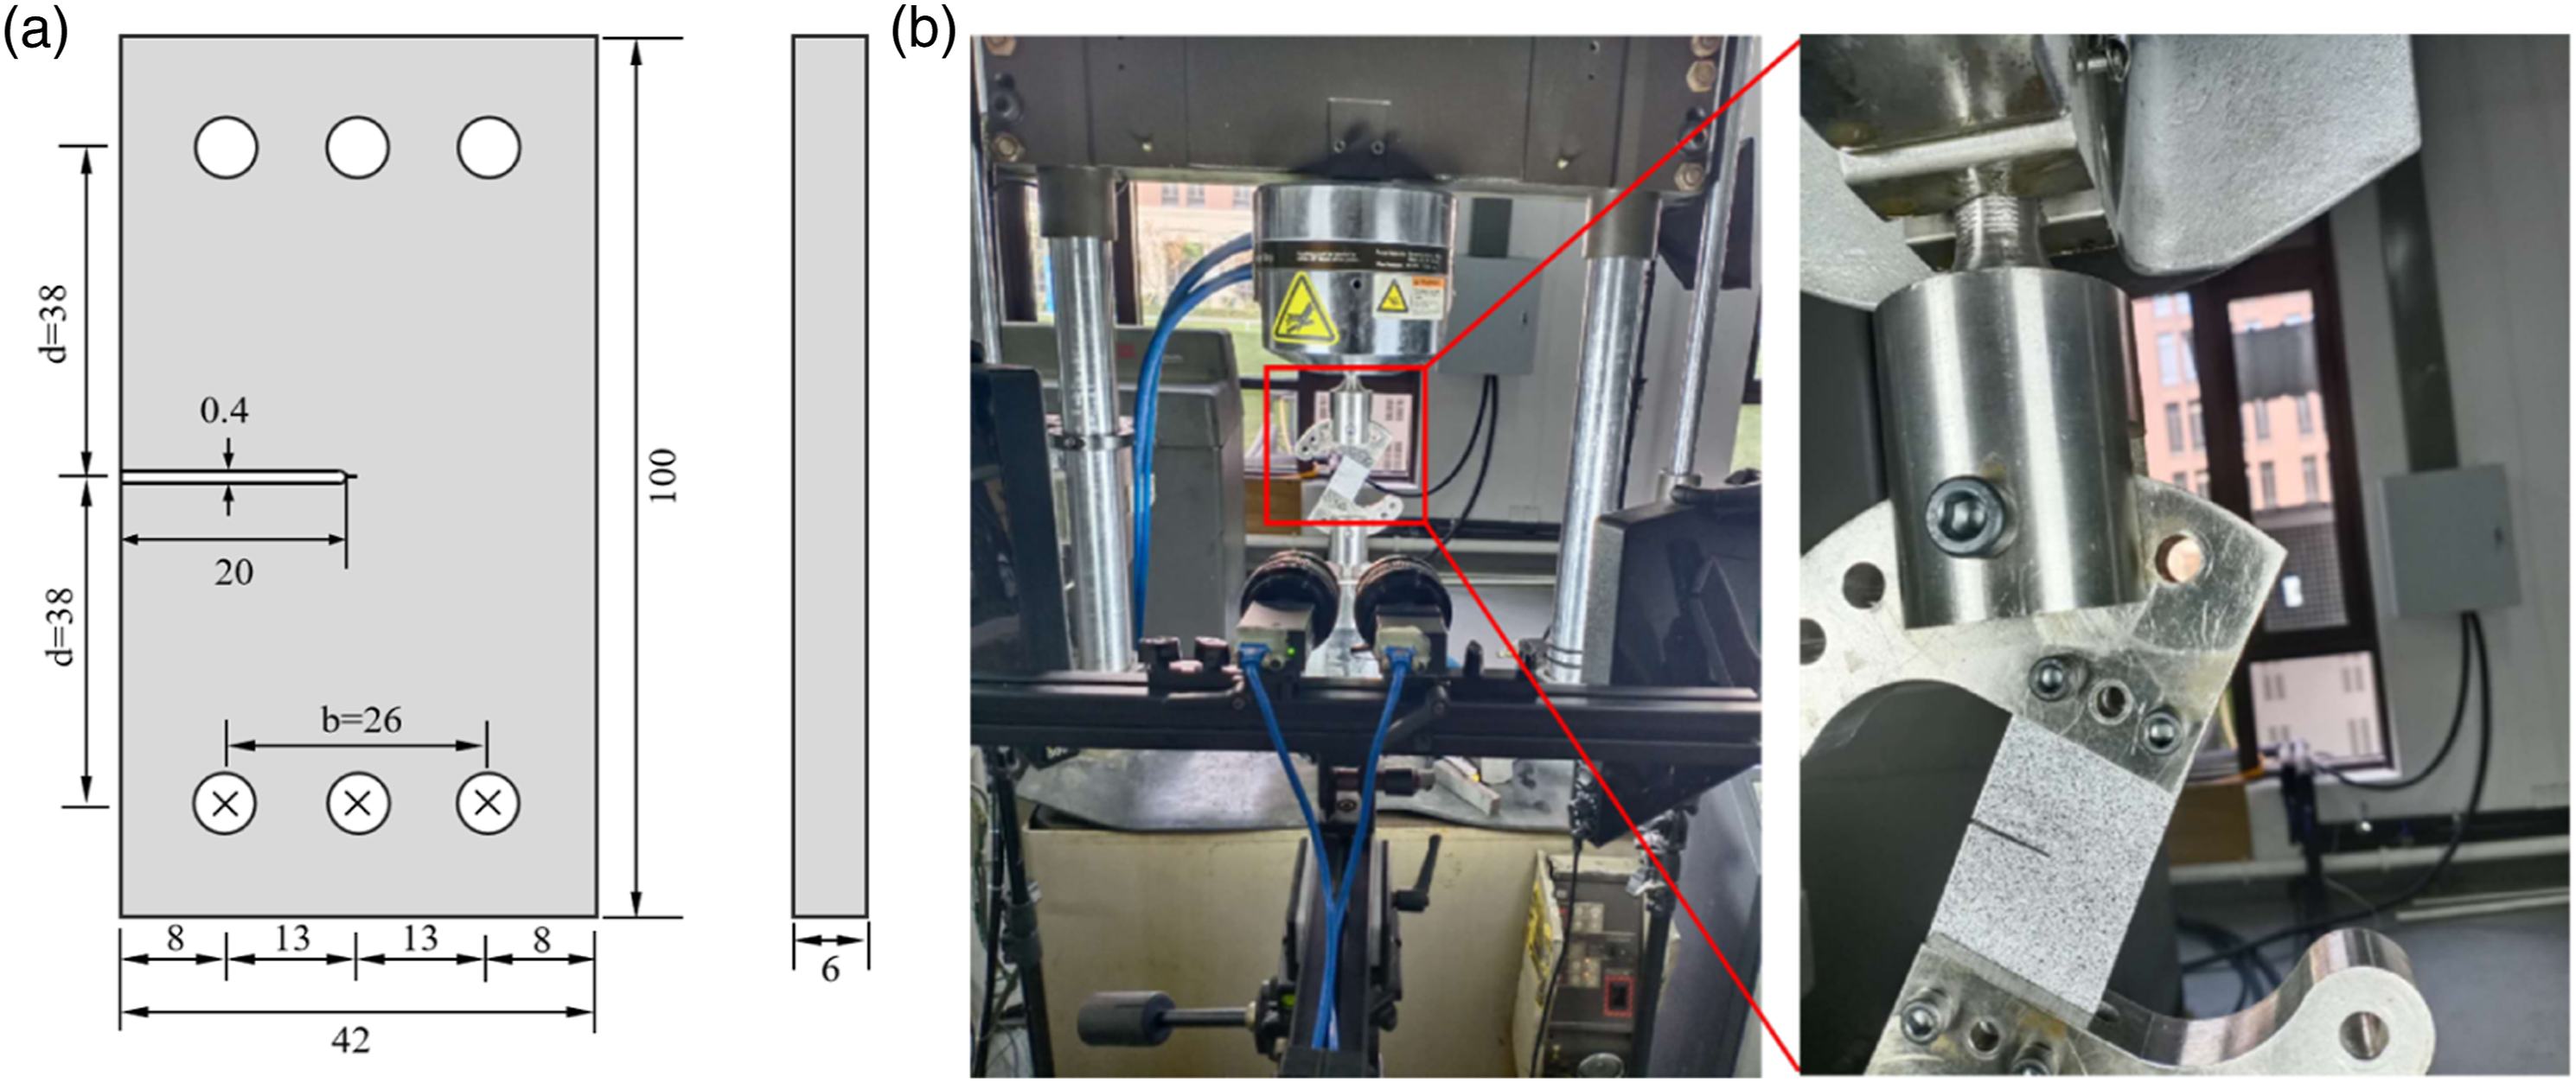
Figure 10(a) is the image obtained by a consumer-grade digital camera, where the yellow arrow indicates the loading direction. In this experiment, the image resolution is 2488*2048 pixels, the frame rate of the digital camera is 40 fps, and 200 frames are recorded in 5 s, the frame rate of cyclic loading is 2 Hz. The area within the white frame is the dangerous zone, as it can be seen the crack is difficult to be distinguished due to the influence of speckle on the surface. P1 is a feature point that selected from the image through the index R, the motion of P1 is calculated by the sparse optical flow algorithm as shown in Figure 10(b). (a) The loading direction and the dangerous zones and (b) the motion of the feature point by optical flow algorithm.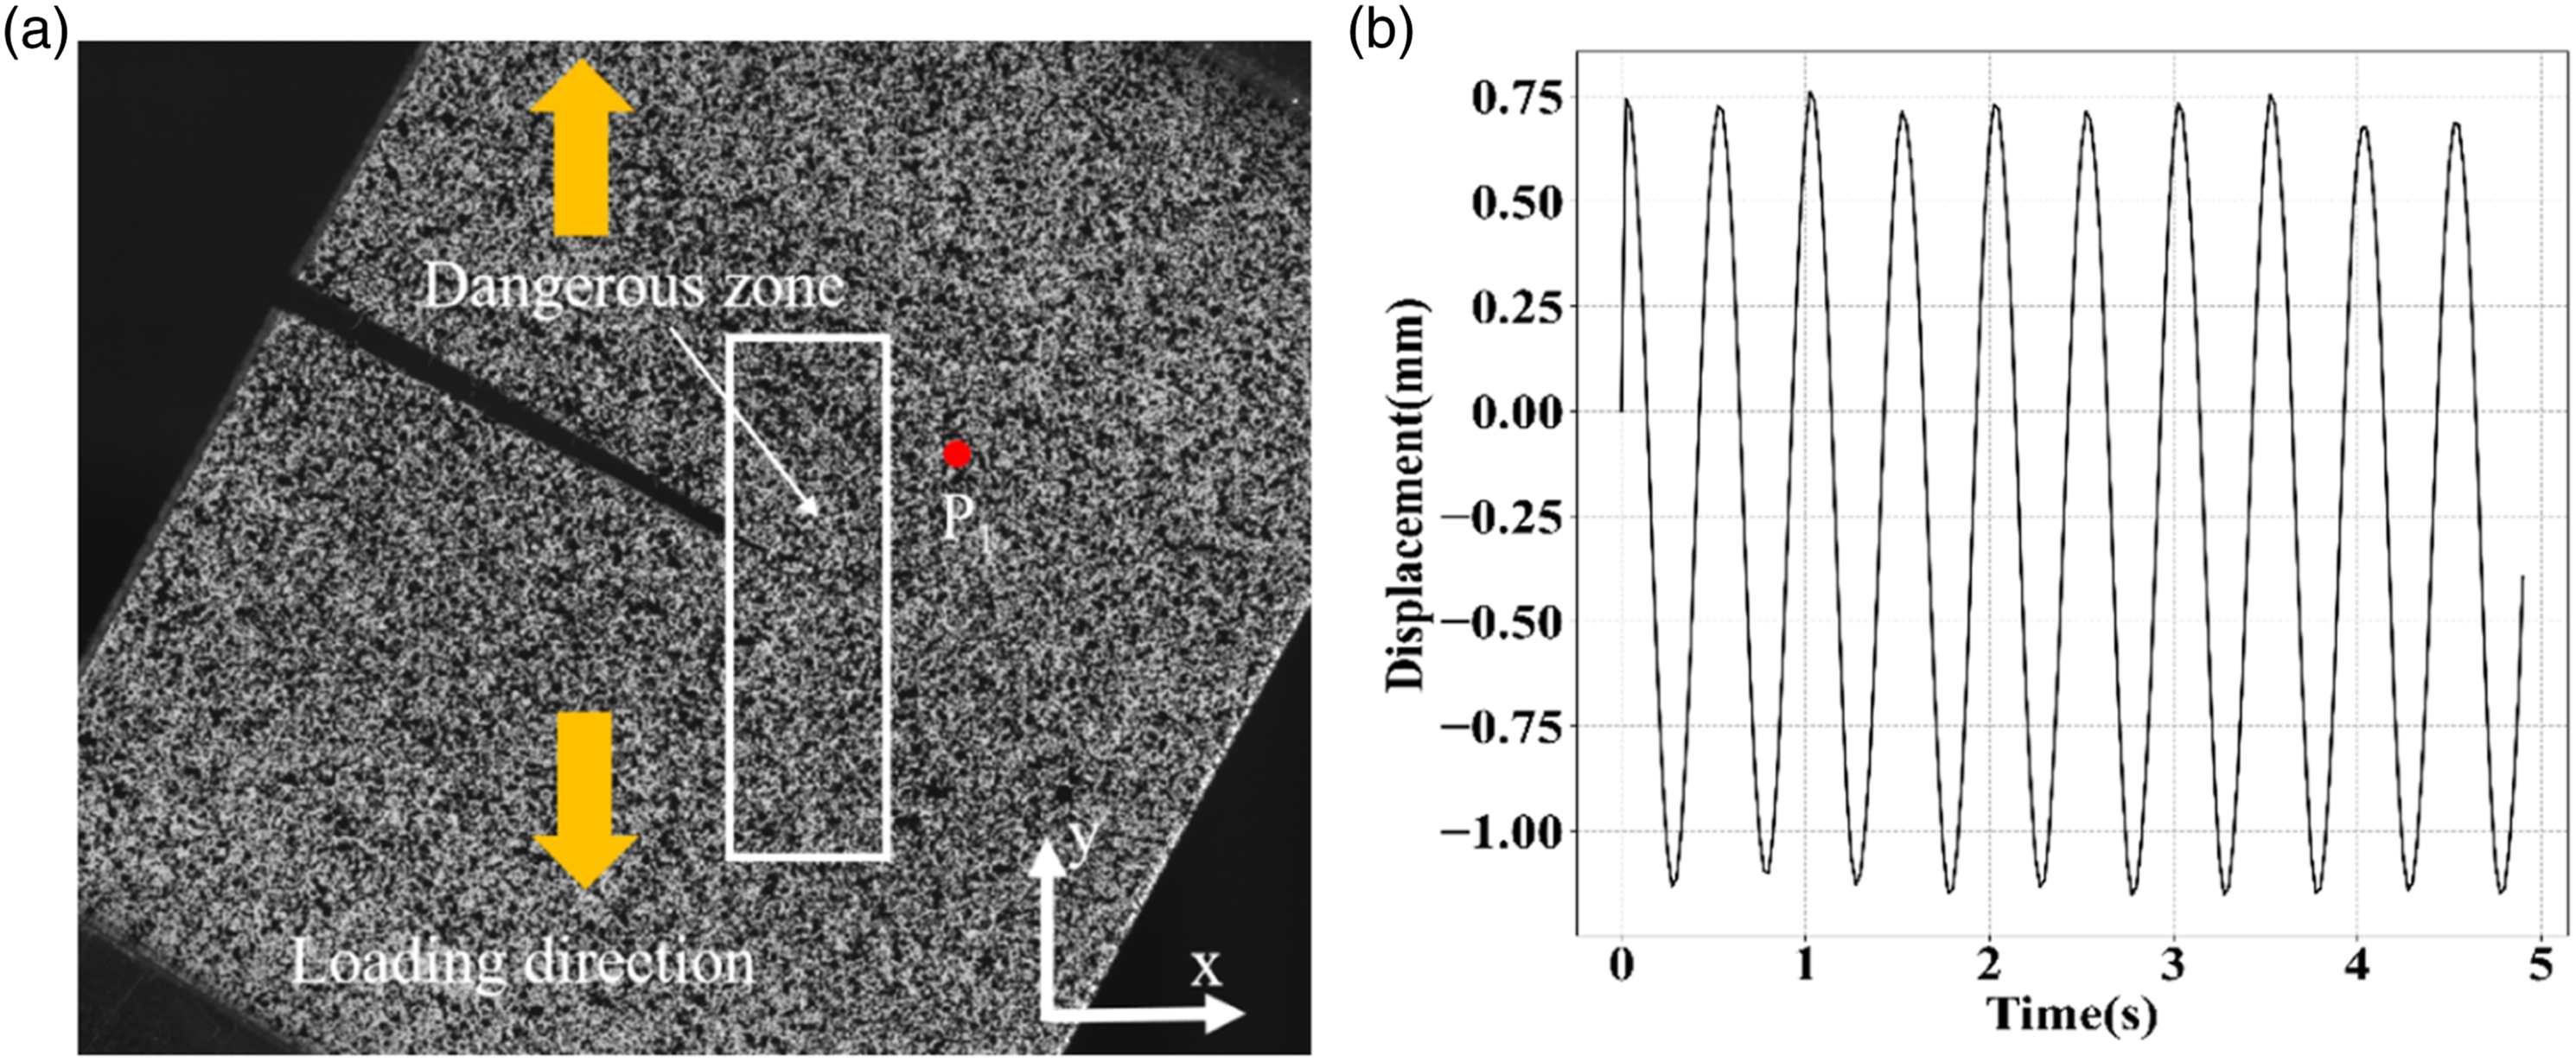
The partitioned sub-regions within the dangerous zone are shown in Figure 11(a). The 72 sub-regions have been partitioned, and the size of each sub-region is 100*100 pixels. Then, the index R is applied to different sub-regions to select the feature points. One of the sub-region’s feature points is shown in Figure 11(b). (a) The partitioned sub-regions in damager zone and (b) the detected feature points.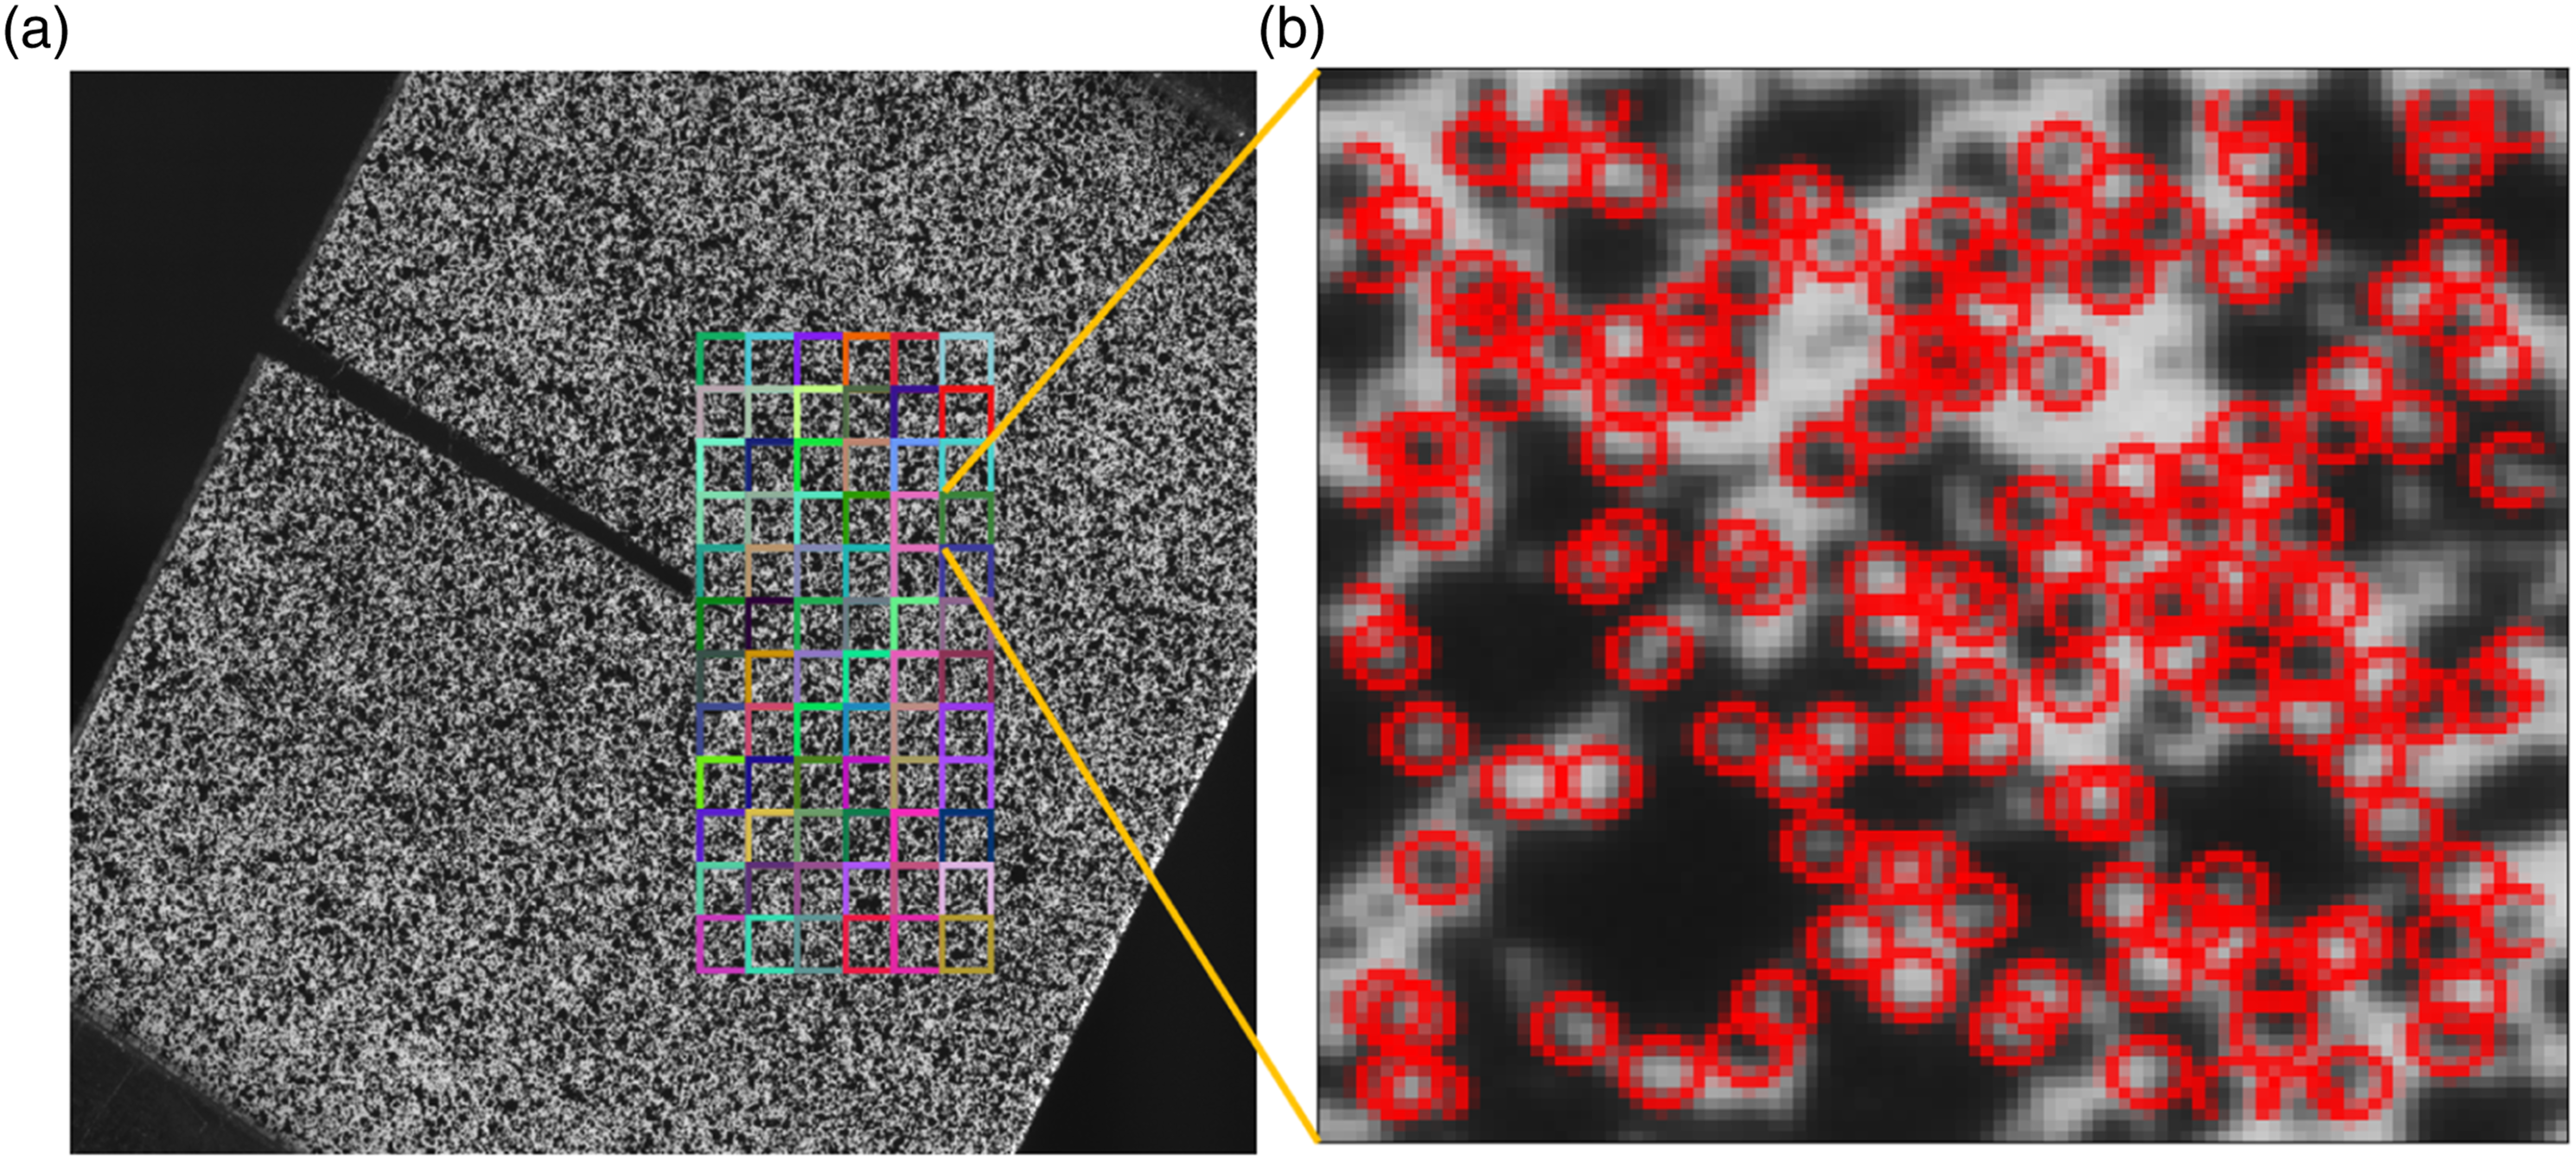
The labels of the sub-regions are shown in Figure 12(a). The results of the sparse optical flow information entropy at different sub-regions are shown in Figure 12(b). The results illustrate that sub-regions 6 and 8 have higher sparse optical flow information entropy compared with other sub-regions. The enlarged local images of sub-region-6 and sub-region-8 are shown in Figure 12(b), as it can be seen that the sub-region-6 and sub-region-8 contain crack information, which proves the effectiveness of the proposed method for crack area detection. (a) The label of sub-regions and (b) the results of sparse optical flow information entropy at different sub-regions.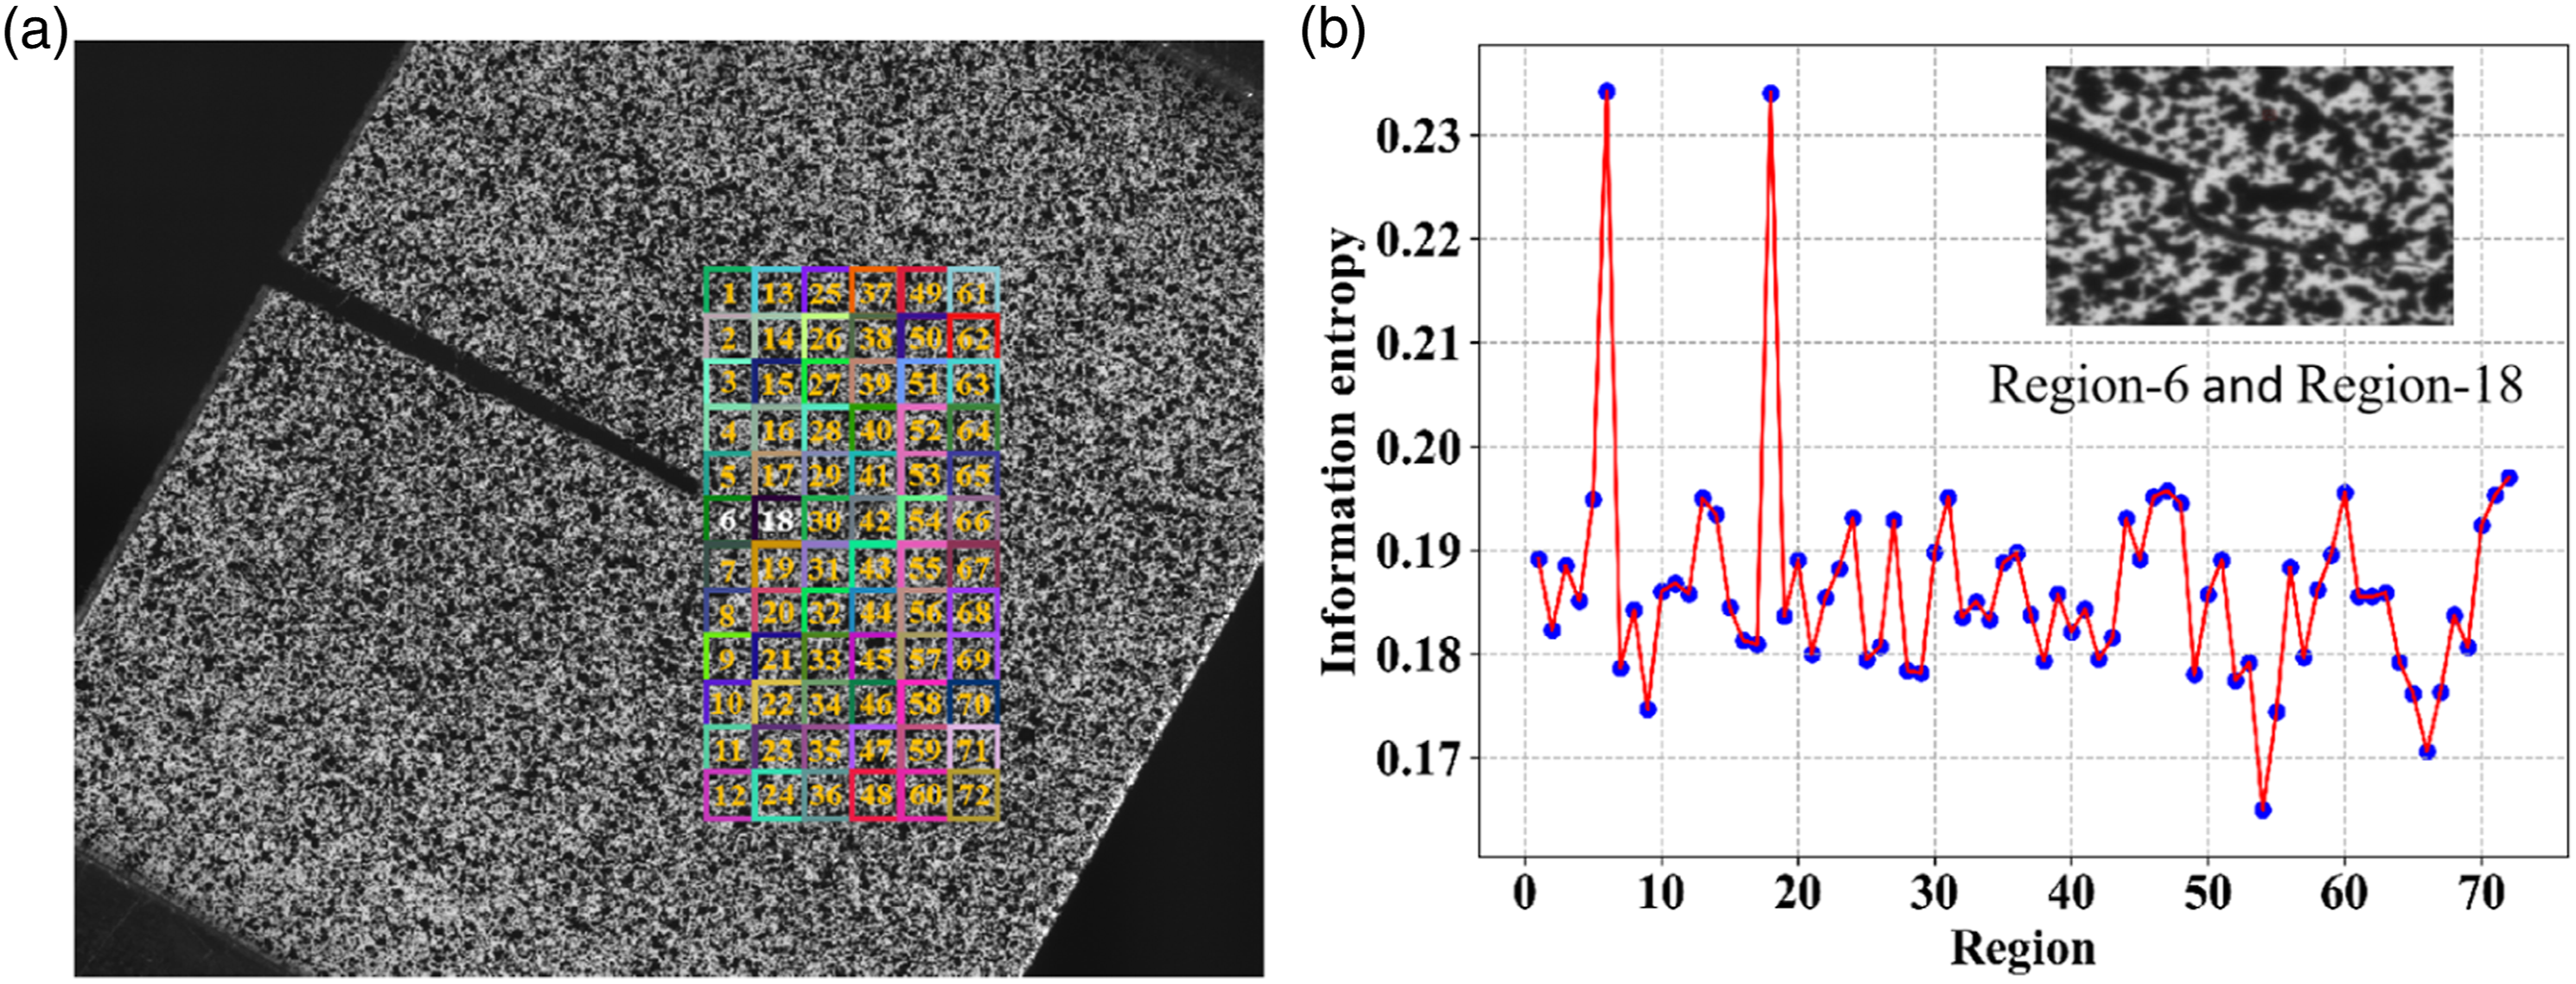
Once the sub-regions with crack area are detected by sparse optical flow information entropy, the next thing is to describe the morphology of the cracks. In this experiment, the sub-region-6 and sub-region-8 are shown in Figure 13, which is partitioned into 200 small-regions. The size of each small-region is 10*10 pixels. Then, the dense optical flow information entropy within the small-regions is calculated to describe the morphology of the cracks. The results of dense optical flow information entropy in different small-regions are shown in Figure 14, as it can be seen that different values of dense optical flow information entropy go along with the location of the small-regions. In this paper, the small-regions with the higher dense optical flow information entropy are used to describe the morphology of the cracks. The partitioned small-region in crack sub-regions. The results of information entropy of different small-regions.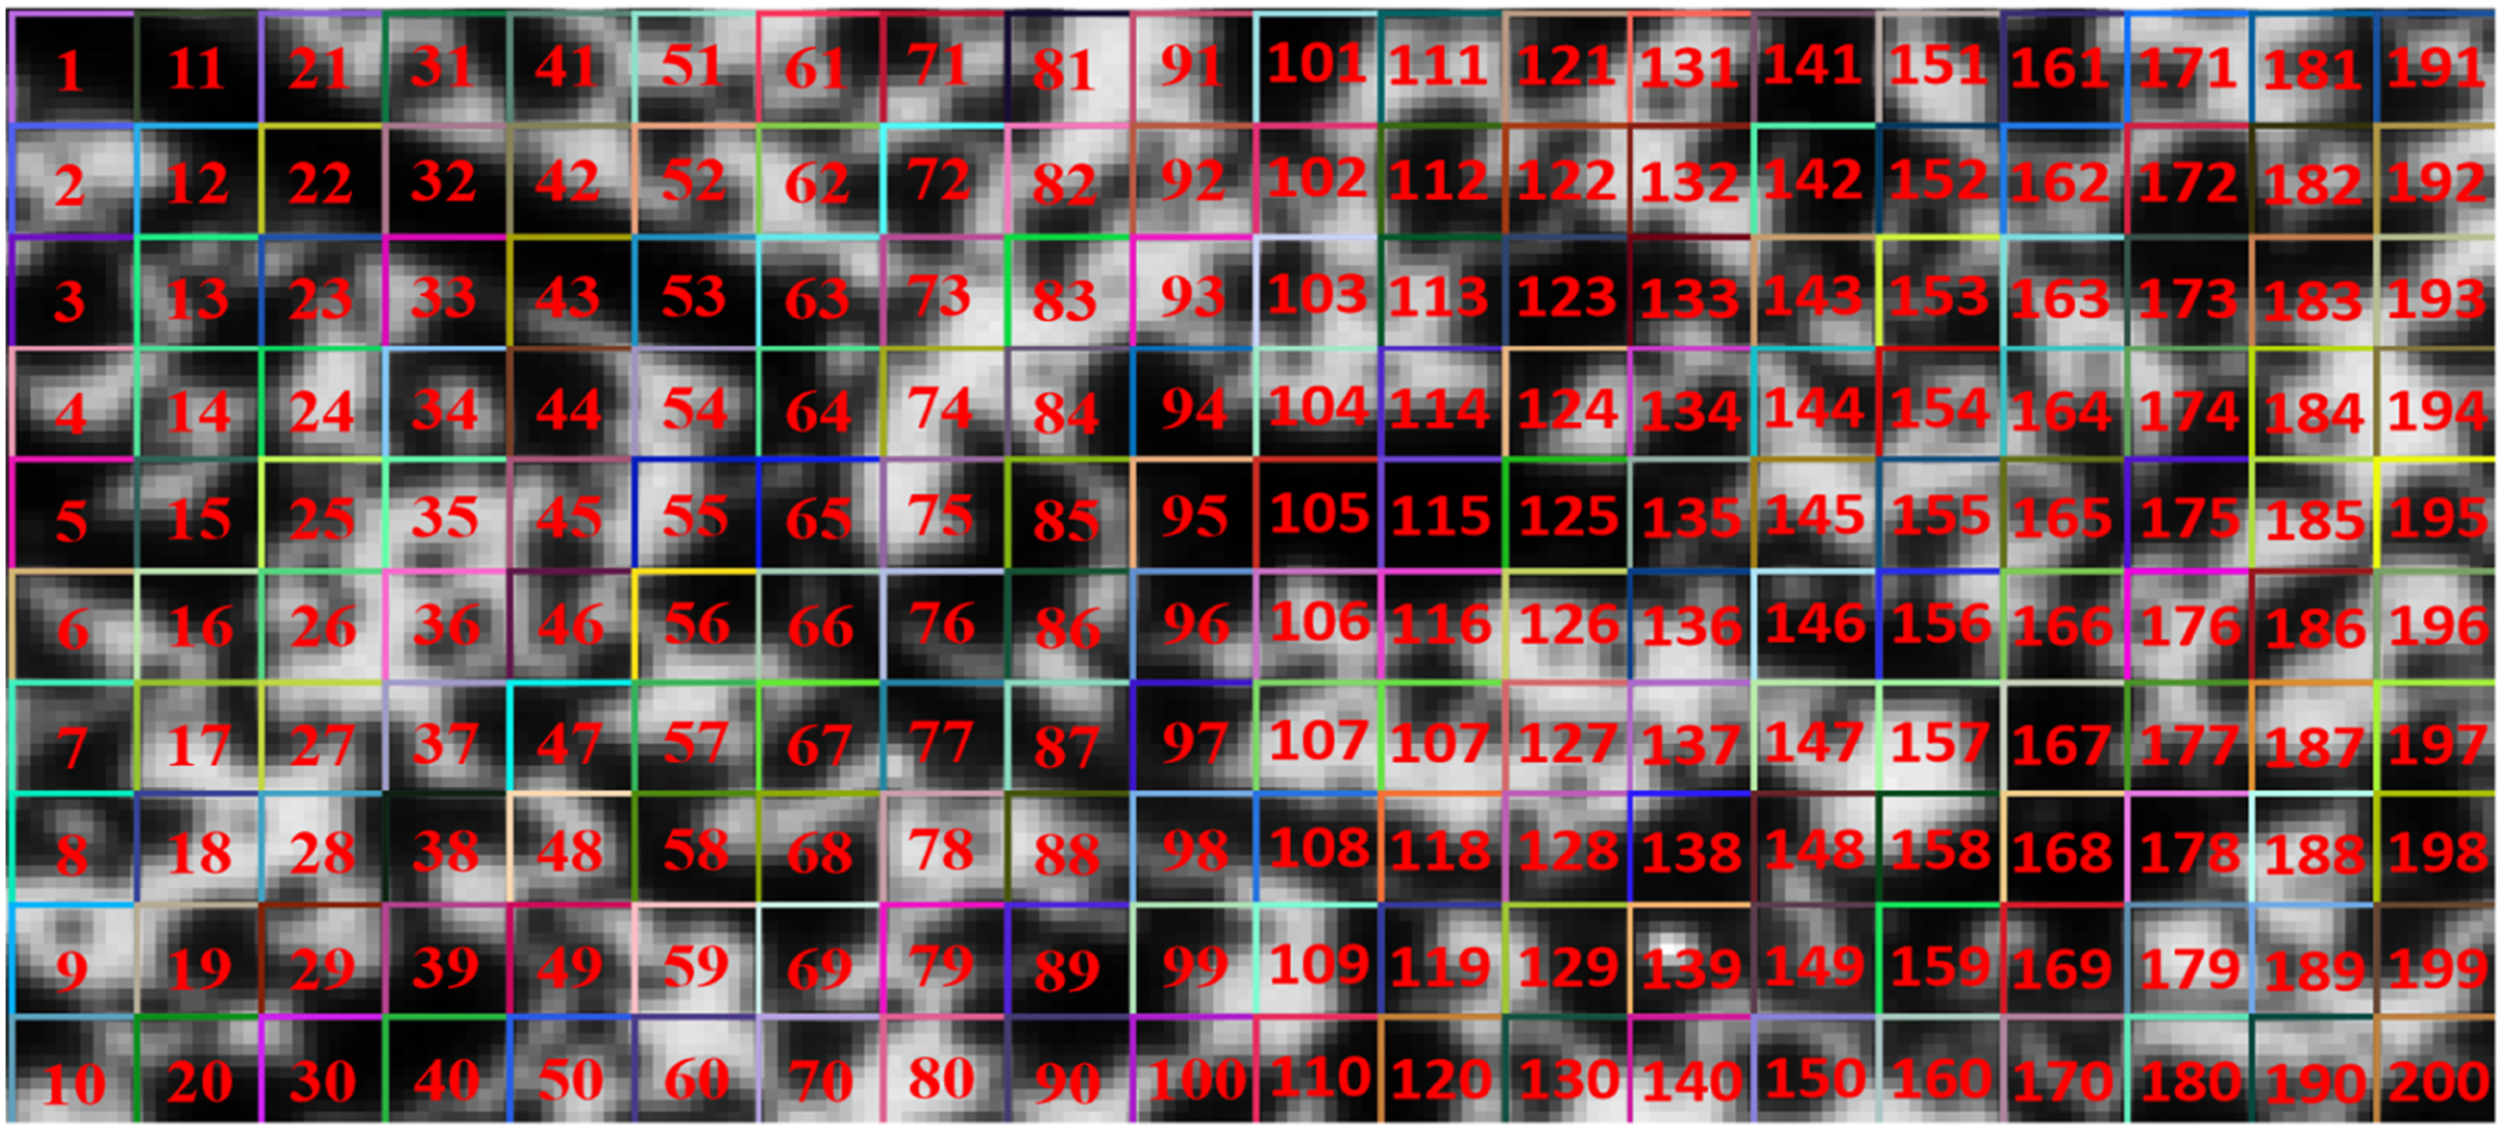
The results of crack localization by dense optical flow information entropy are shown in Figure 15. The small-region of the white number is the crack region. As shown in Figure 15, the small-region of the white number can describe the morphology of the crack well. The results show that the proposed method for crack localization can describe the crack effectively. The located crack by dense optical flow information entropy.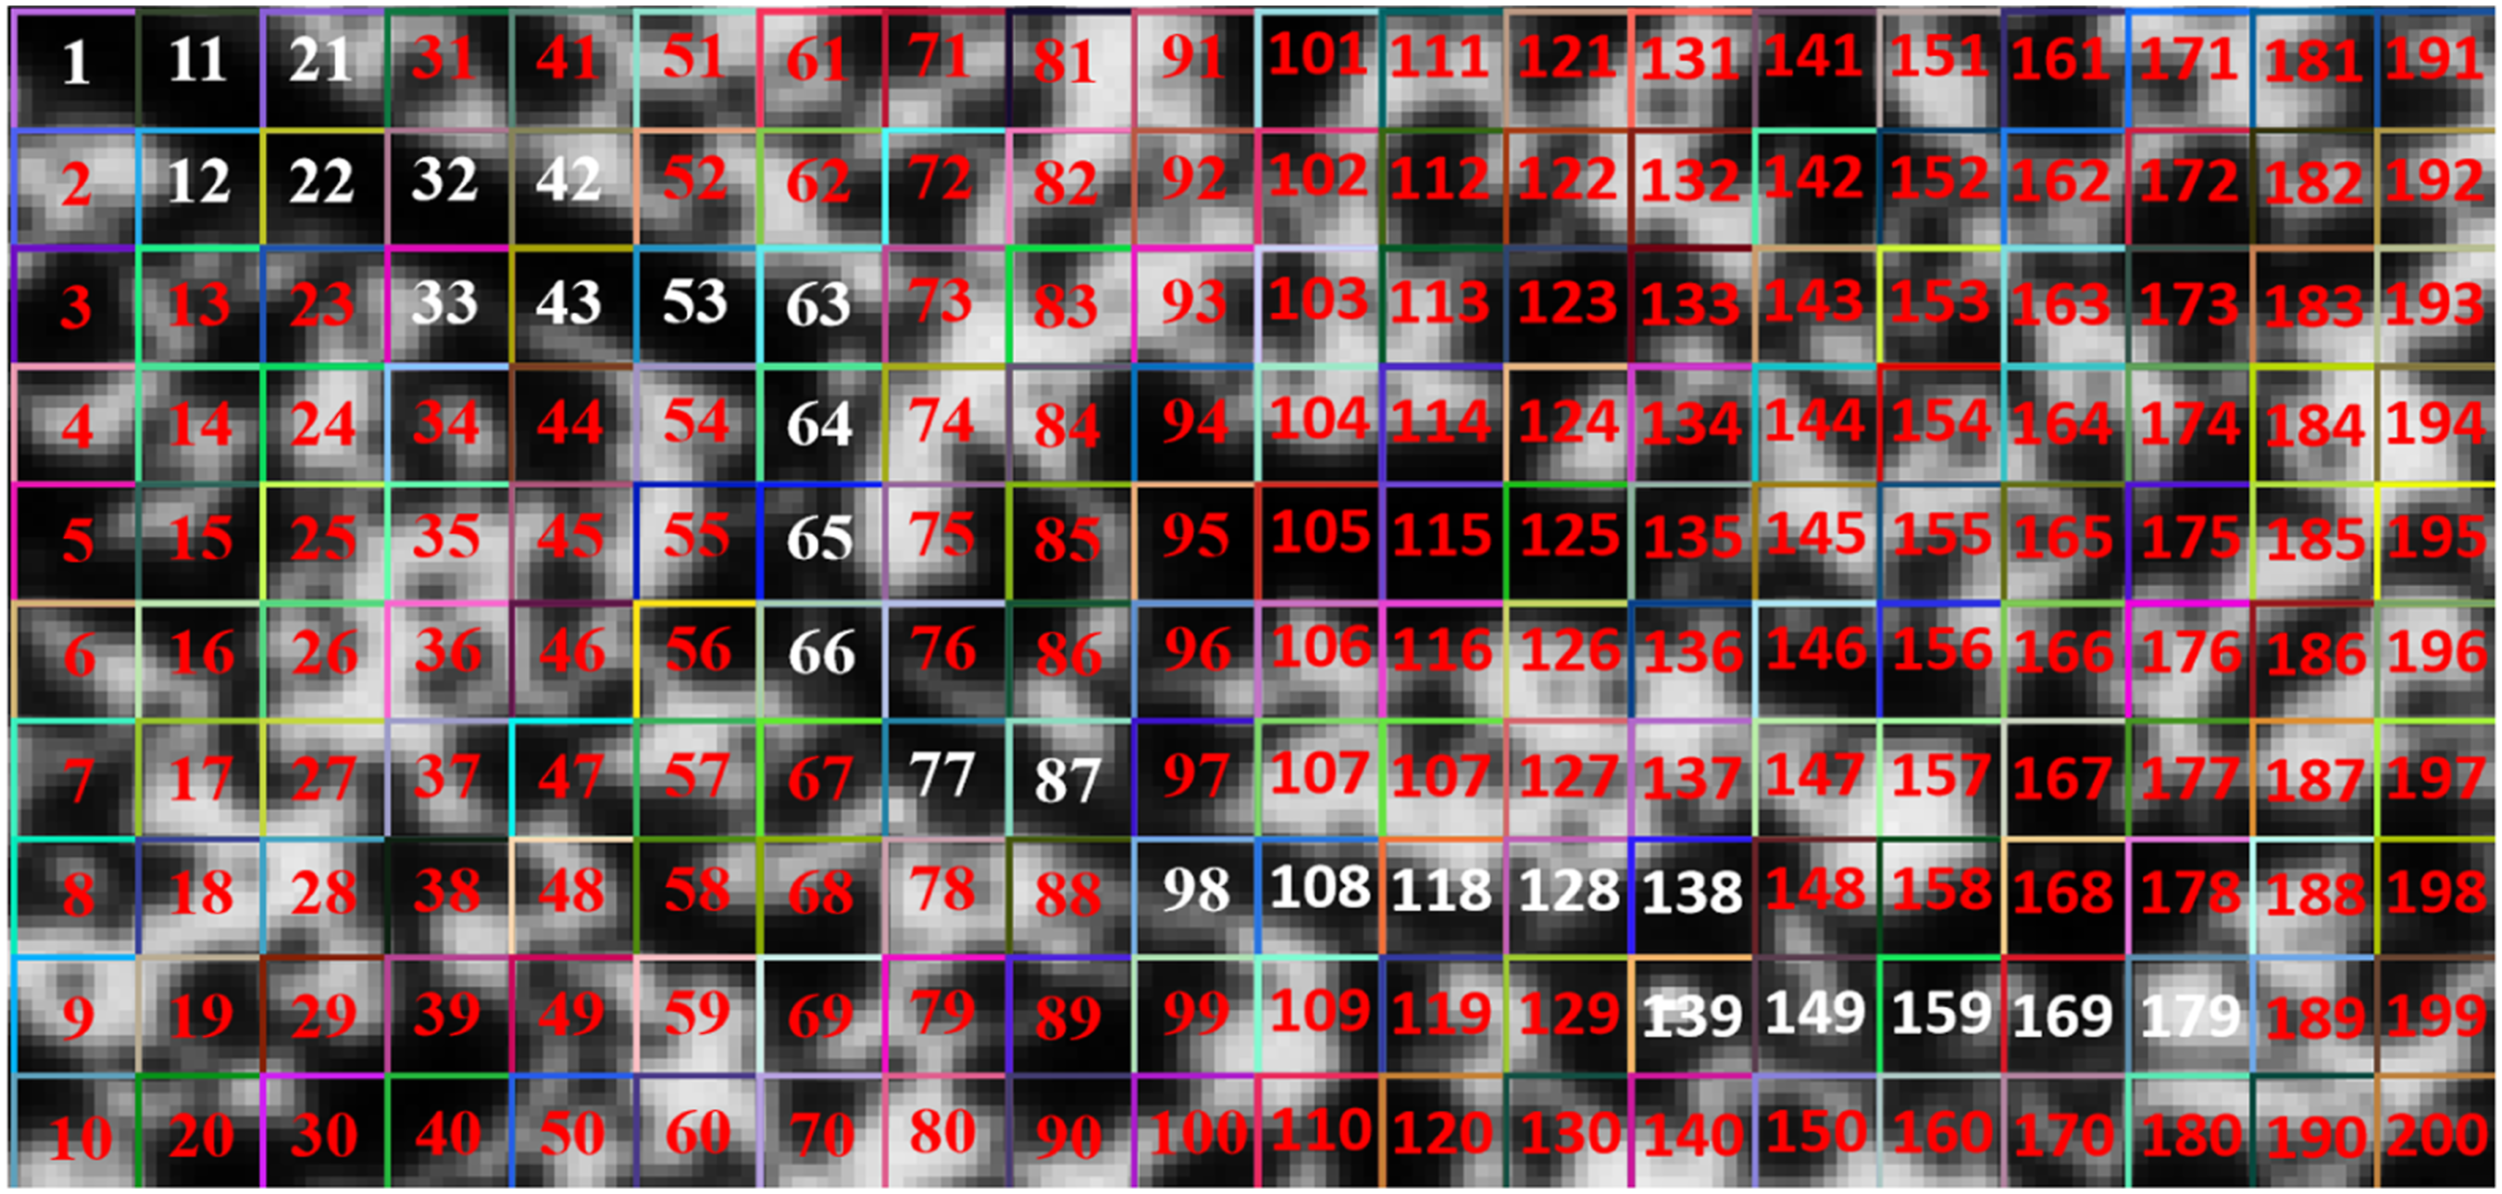
The comparison between the proposed method and existing method
In this section, the proposed method is compared to two existing related crack identification methods, image processing and DIC, to validate its effectiveness. Among them, the method of image processing mainly uses the difference in color between the crack and the non-crack area to realize crack detection. In comparison, the DIC algorithm primarily identifies structural cracks in video sequences by calculating the surface strain of the structure. The details contents are as follows:
Image processing-based crack detection methods consist primarily of two steps: Image grayscale processing and binary segmentation. 34 In image grayscale processing, the RGB color is translated into a mixed channel using a weighted technique, which can improve the distribution of pixel value to help subsequent image processing. The popular grayscale processing includes the linear stretching algorithm and the histogram equalization algorithm. In this paper, the linear stretching algorithm is used to process the image because the linear optimization preferably retains crack details and enhances the difference in gray value between crack and background, which can help with image noise filtering and crack identification. In binary segmentation, the crack is identified by the edge line along the junction of the crack and the background because of the difference between the crack and the background. Many methods have been proposed for edge identification, such as Otsu threshold, Kittler threshold, and Kapur threshold. In this paper, the method of Otsu threshold is employed because it can achieve a balance between computational efficiency and accuracy. 35
The results of crack detection are displayed in Figure 16 based on the image processing method. Where Figure 16(a) and (c) are the acquired images from cases 1 and 2, respectively, in the Experiment Validation section. The crack identification results are shown in Figure 16(b) and (d). As it can be seen from Figure 16(b), it is unable to discriminate between true and false cracks, necessitating the use of expertise or engineering to further distinguish the crack. In contrast, the crack in Figure 16(d) is difficult to identify because the texture of the structure is similar in color to the crack area. The results of crack detection by the image processing-based method; (a) the origin image in case 1; (b) the results by the image processing-based method; (c) the origin image in case 2; and (d) the results by the image processing-based method.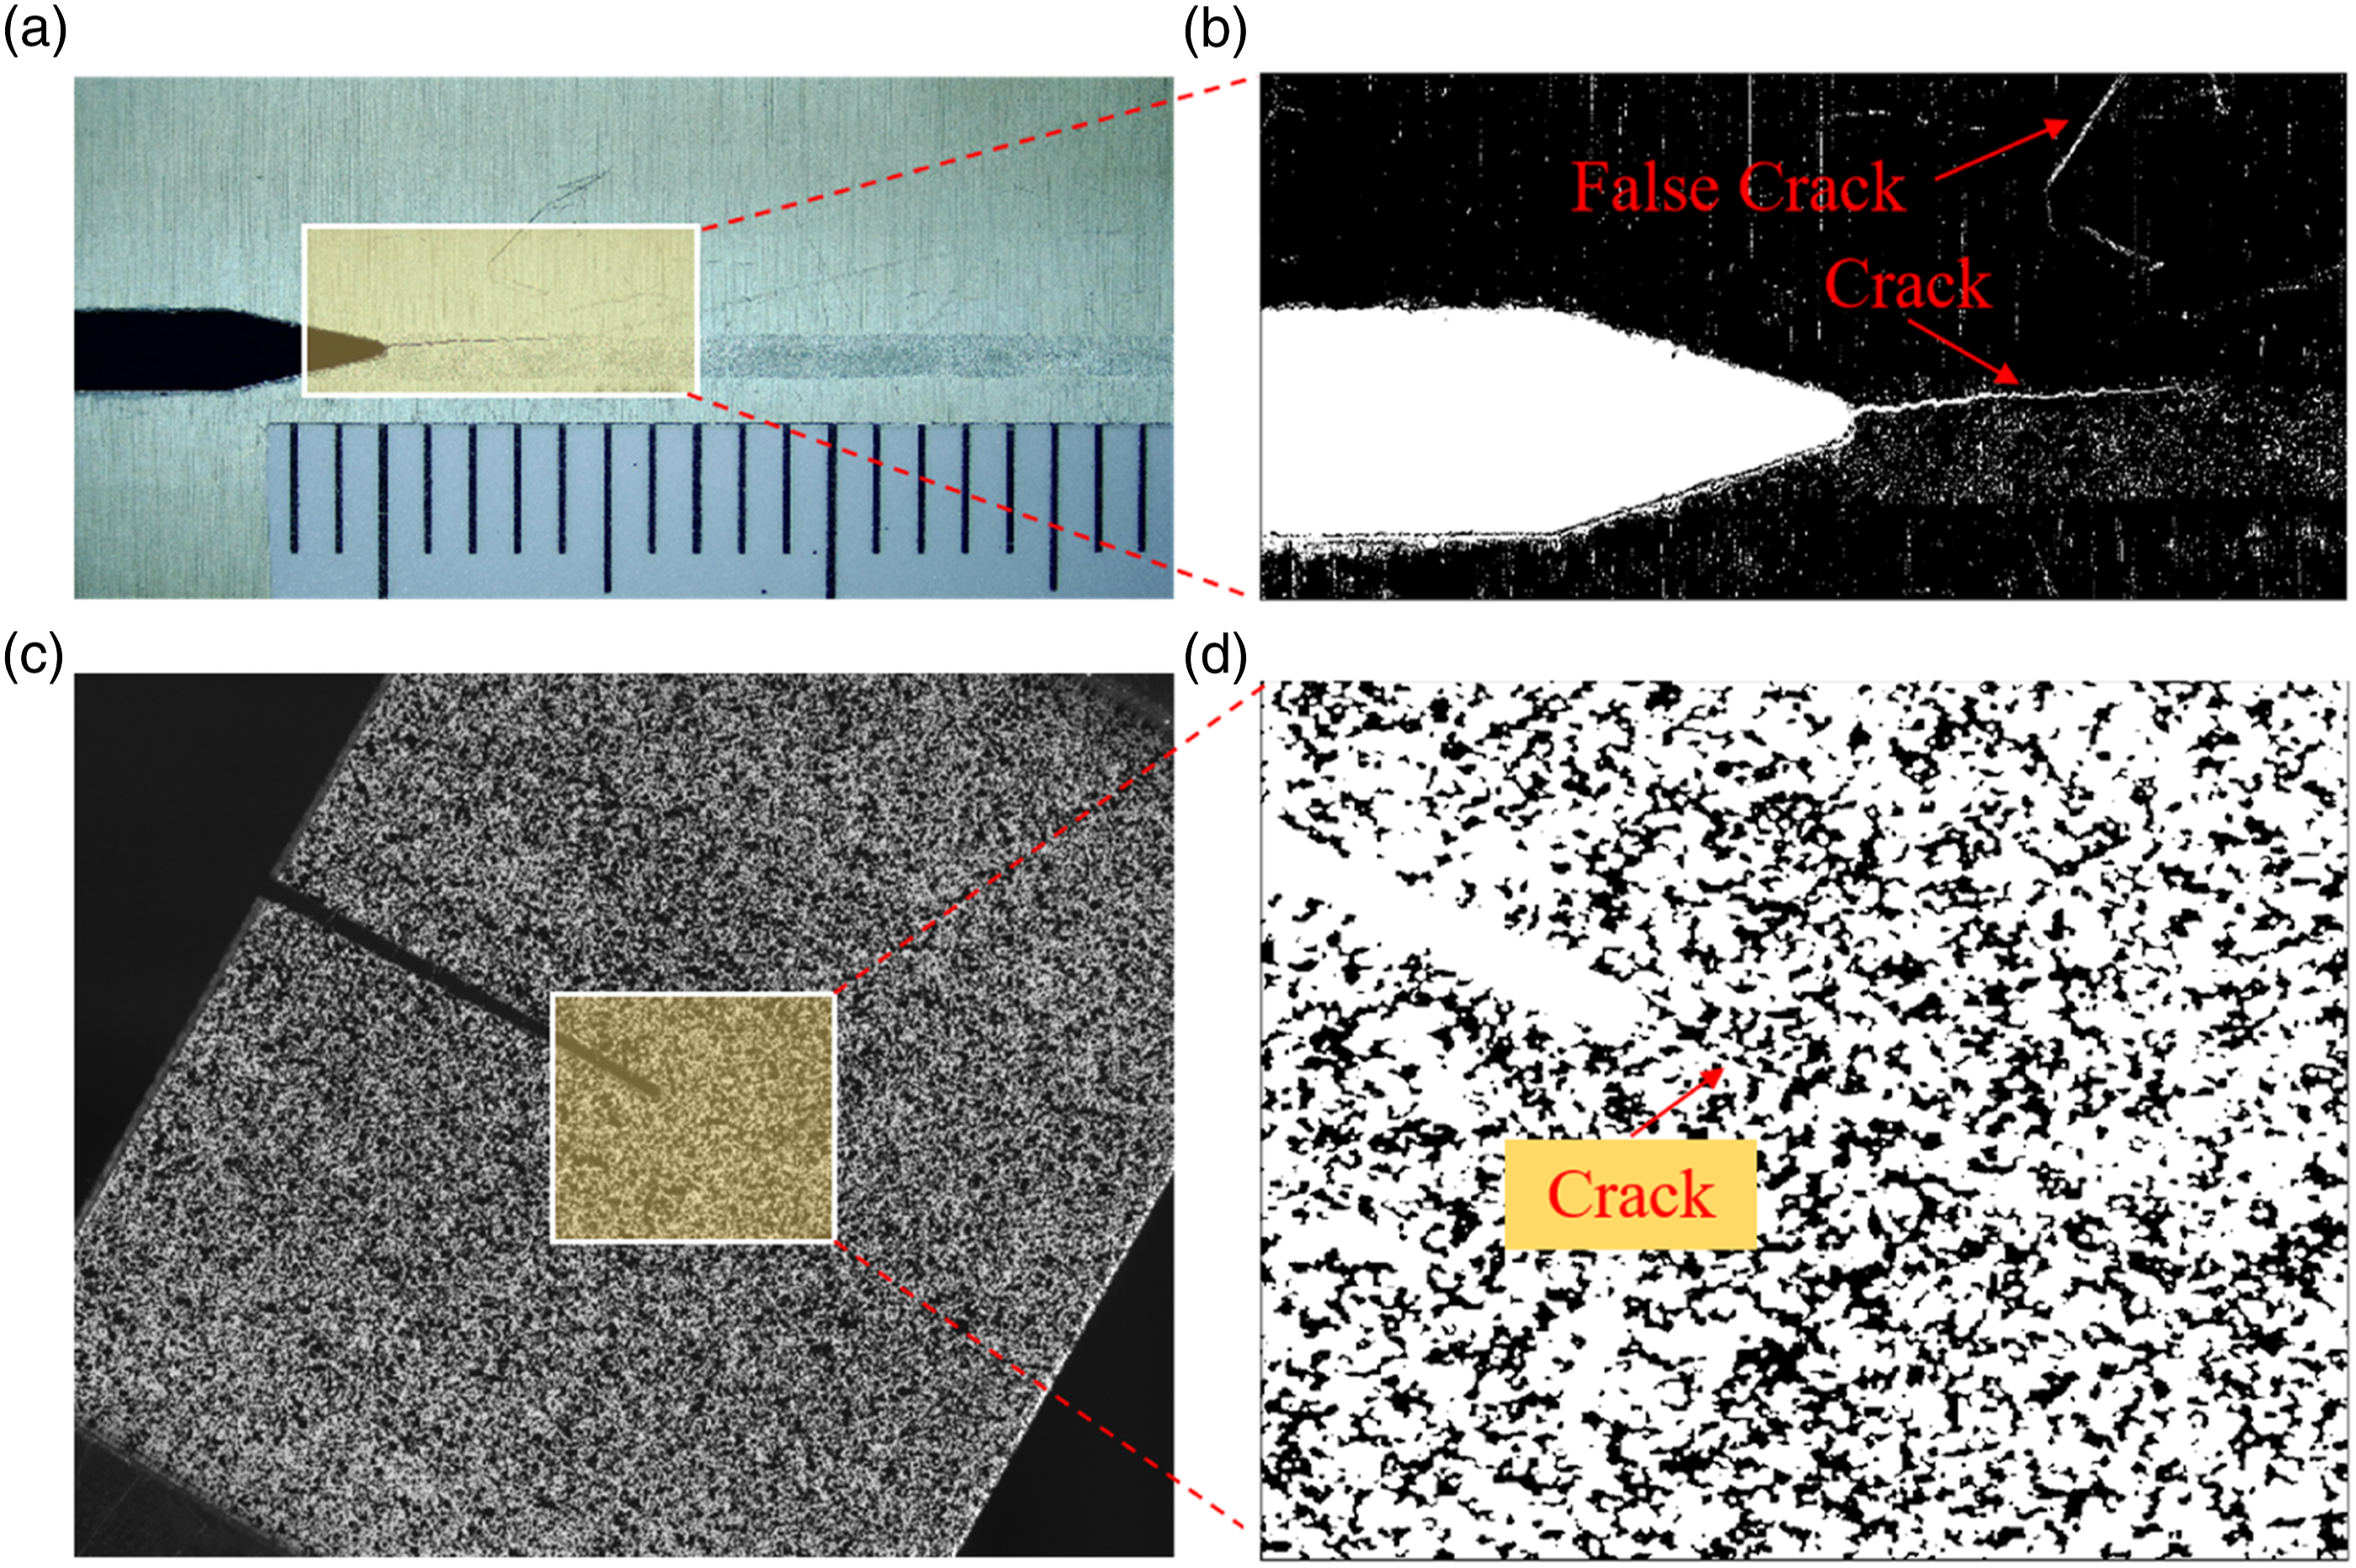
To further validate the effectiveness, the proposed method is compared with the DIC, which is used to monitor the crack behaviors in recent research. 16 The basic principle of DIC crack detection is that it can monitor the entire surface of the specimens and detect cracks based on strain from the DIC displacement field. The progress of calculating the strain in DIC can be divided into three steps. First, a subset from the undeformed image is chosen to find its location in the deformed images by calculating the similarity. To evaluate the similarity degree between the reference subset and the deformed subset, many criterion algorithms have been developed, including the cross-correlation criterion, sum-squared difference correlation criterion, and zero-normalized cross-correlation (ZNCC). The matching procedure is completed through searching for the peak position of the distribution of correlation coefficients. Second, the sub-pixel registration algorithm is then used to improve the registration accuracy of displacements, including the Correlation coefficient curve-fitting method, Newton–Raphson method, and gradient-based methods. Finally, the strain from the displacement field is calculated. The popular strain calculation methods include the numerical differentiation algorithm and local least-squares fitting technique. 36
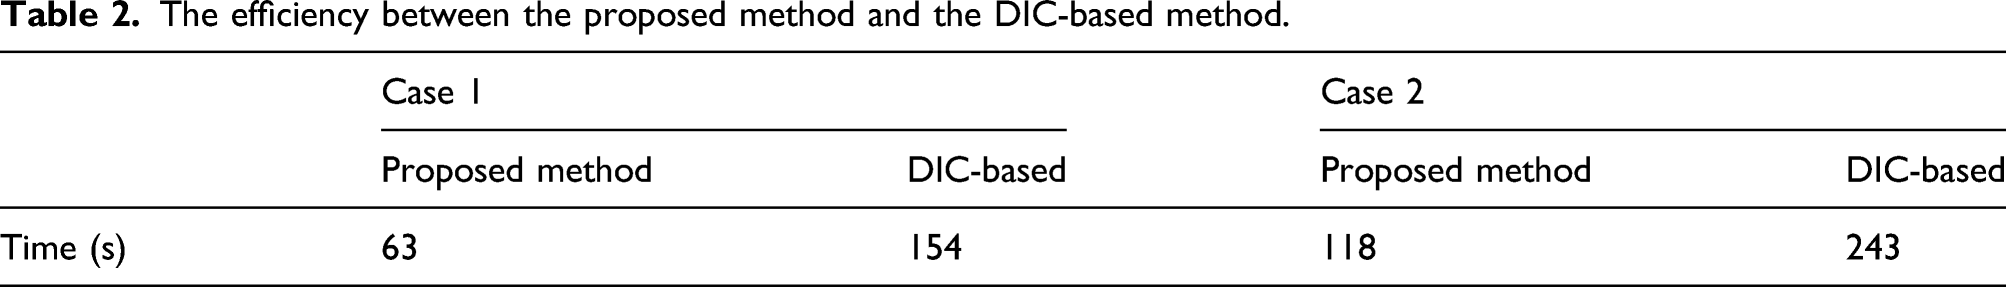
In this study, taking into account the need for measurement accuracy and efficiency, we chose the ZNCC criterion algorithm, the correlation coefficient curve-fitting method, and the local least-squares fitting technique to calculate the strain of a structure. All of the experiments used Python Version 3.7 on a PC with a 3.0 GHz Intel CORE i7 processor. The PC had 32 GB of RAM and ran the Microsoft Windows 10 operating system.
The strain of the structure based on the DIC from the video in cases 1 and 2 are shown in Figure 17. The origin image in cases 1 and 2 are shown in Figure 17(a) and (c), respectively. As it can be seen, the image of texture in case 1 is simpler than in case 2. The calculated strains are shown in Figure 17(b) and (d), respectively. The calculated results show that the crack is not easily identified in case 1 and can be detected in case 2. These results demonstrate that when applying the DIC technique for studying surface displacements, a high-contrast surface pattern is required and the effectiveness of the DIC computation depends mostly on the quality of the high-contrast surface pattern. Furthermore, as shown in Figure 17(d), while the DIC-based method can detect the crack, it is difficult to detect the crack morphology. The results of strain calculation based on DIC: (a) the origin image in case 1; (b) the results by DIC; (c) the origin image in case 2; and (d) the results by DIC. DIC: digital image correlation.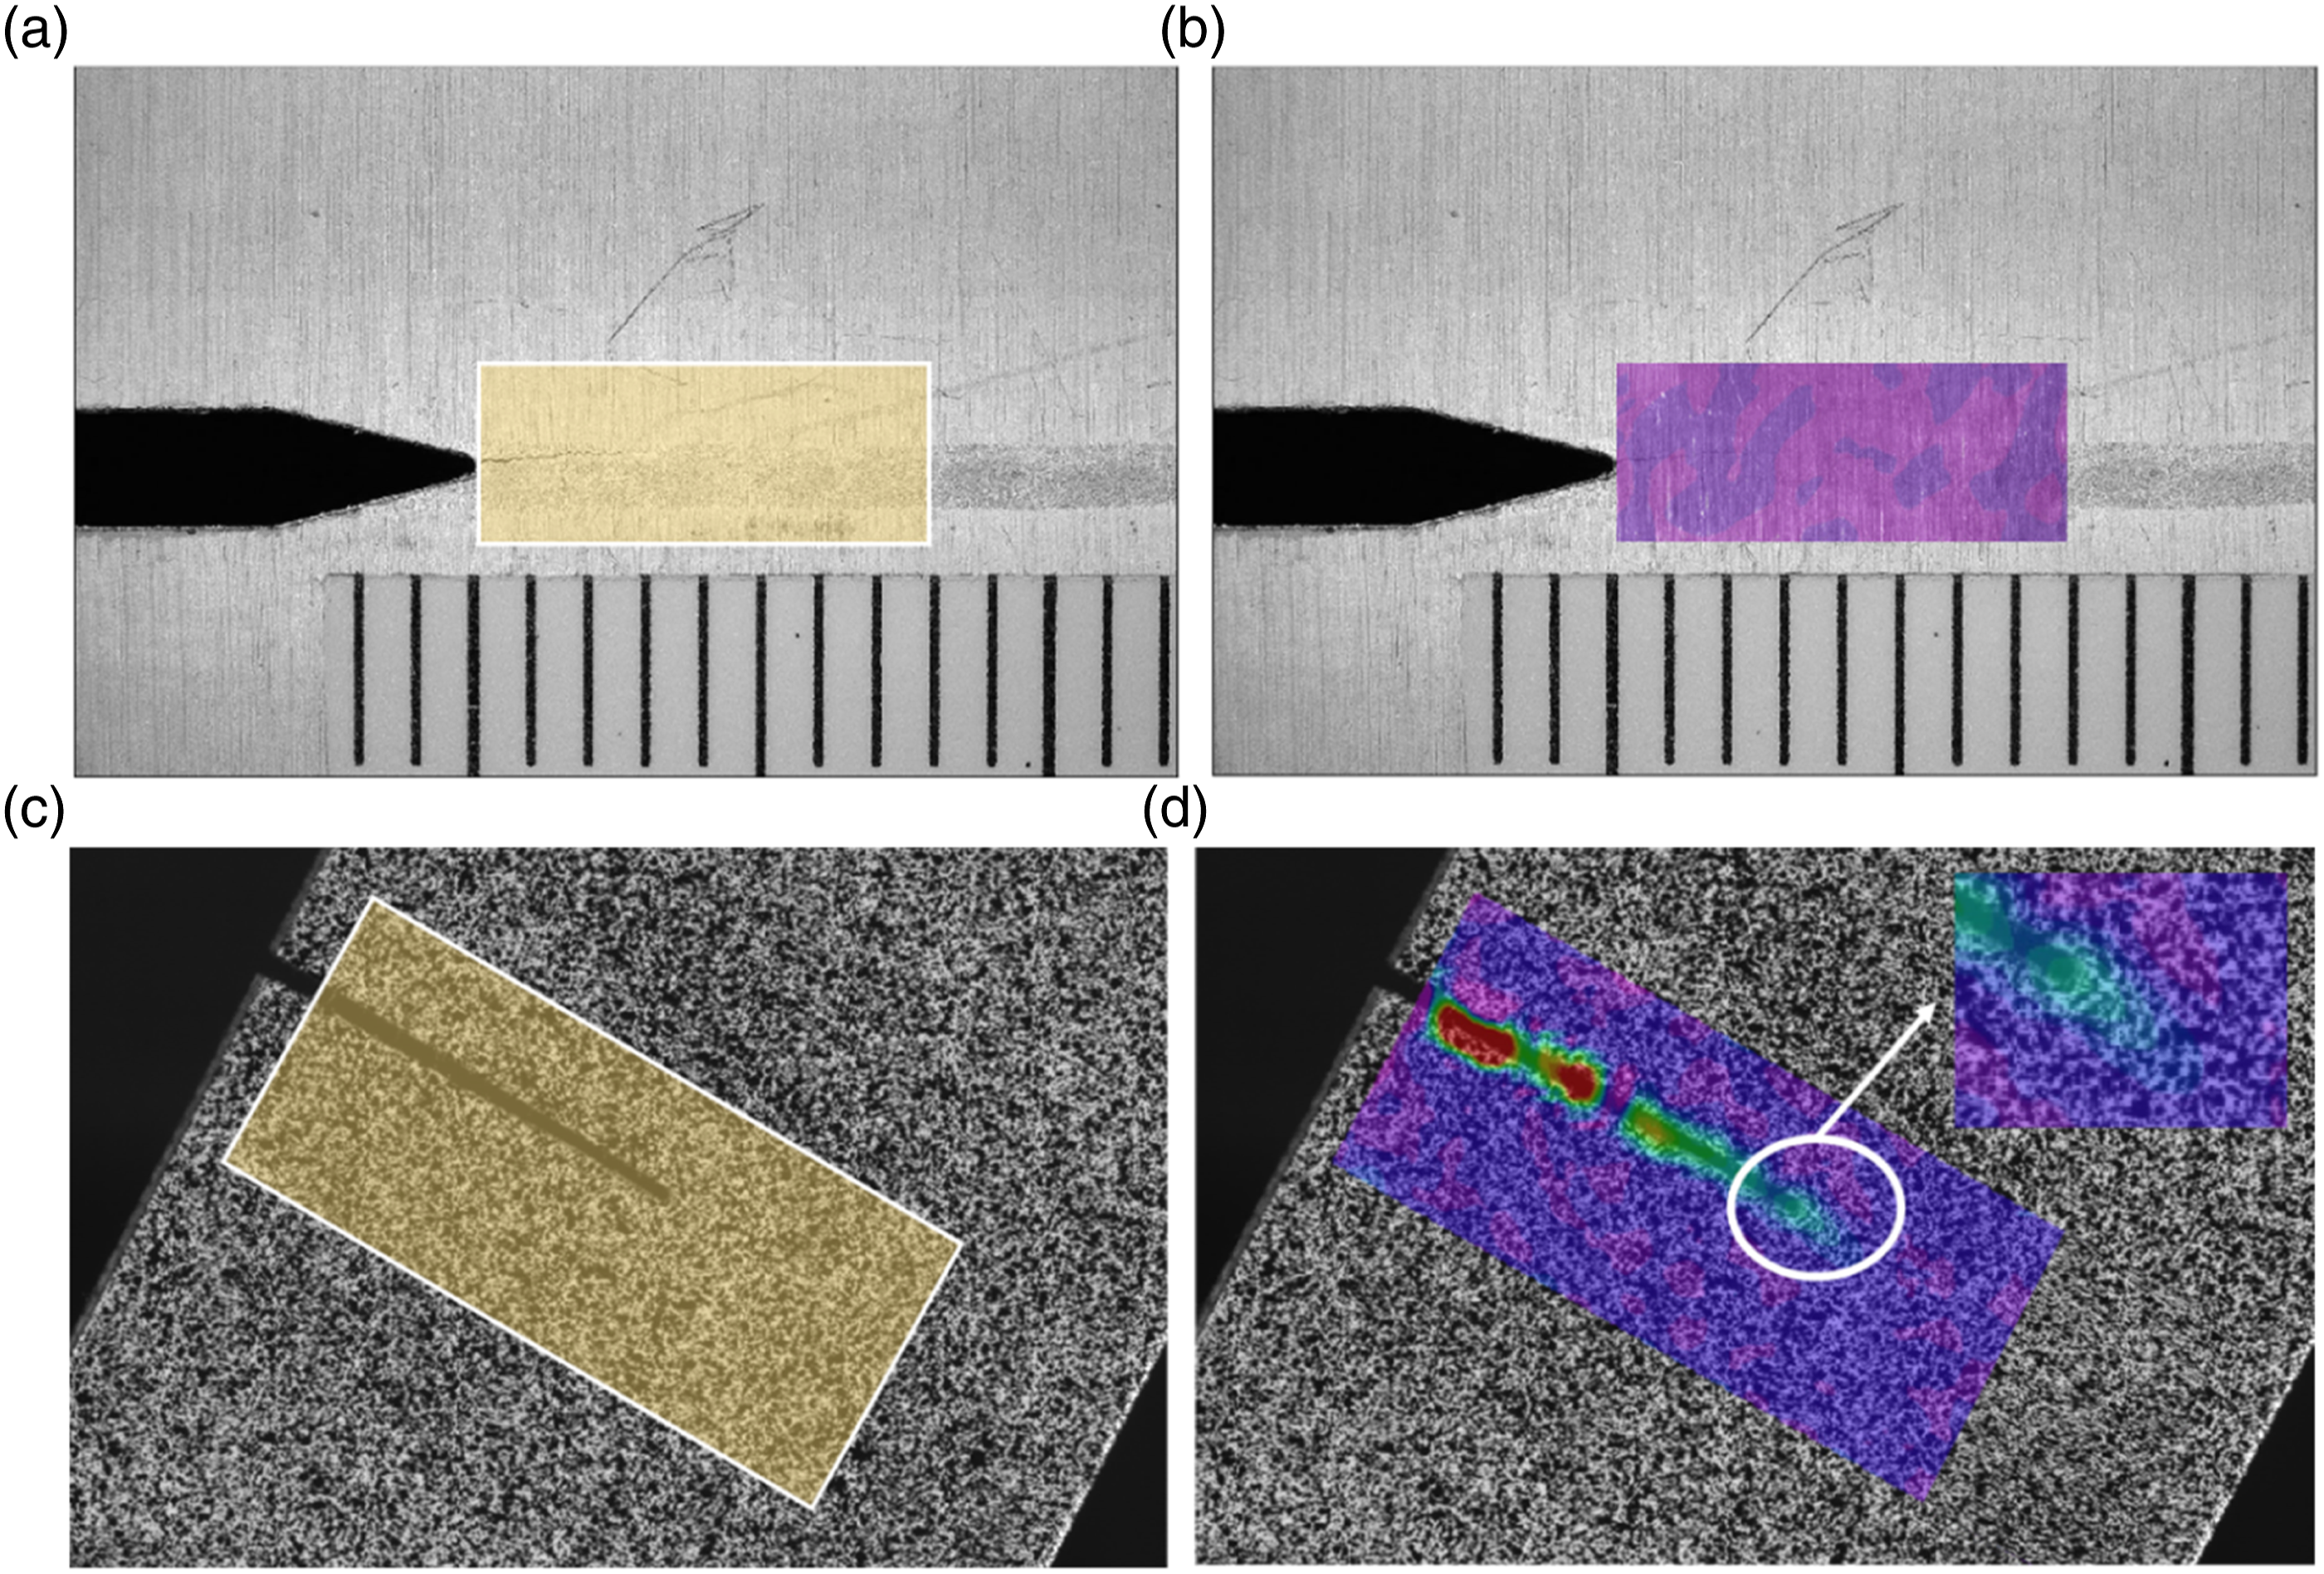
The efficiency between the proposed method and the DIC-based method.
The calculation of stress intensity factor
Stress intensity factor is a physical quantity that reflects the strength of the stress field at the tip of a structural crack. It is related to crack size, structural geometry, and external stress and is a key parameter for judging the fracture of cracked components or calculating the residual fatigue life of structures. Thus, determination of the K-factors for actual cracks is of great practical implication. With the development of fracture mechanics, different methods have been developed to calculate the stress intensity factors, including the displacement-based methods, the stress-based methods, and the energy-based methods. 37 In all models for calculating stress intensity factor, the determination of crack size and crack tip position is the core issue and the key factor affecting the calculation accuracy. 38
The nodal displacement extrapolation method is used to compute the crack’s stress intensity factor in this work because it has the advantages of high computing stability, simplicity, and ease of implementation when compared to other methodologies.
39
As described in nodal displacement extrapolation method, the stress intensity factor of the finite width plate with type I crack can be expressed as following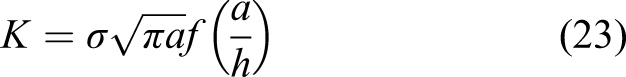
When a/h ≤ 0.6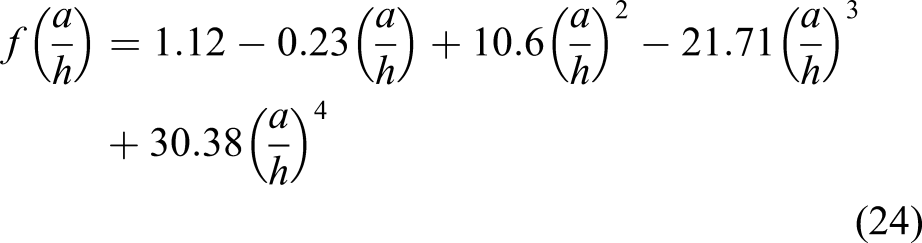
When a ≤ h
In this section, the crack in case 1 is used to calculate the stress intensity factor, the length of the I-type crack and the position of the crack tip at different times are measured by the proposed method based on optical flow information entropy. The captured image and the definition of the crack length is shown in Figure 18(a). The results of the crack length based on the proposed method and corresponding the load periods are shown in Figure 18(b), which results show that the proposed method can identify the crack when the size of crack is less than 1 mm. (a) The definition of the crack length and (b) the results of the crack width based on optical flow information entropy.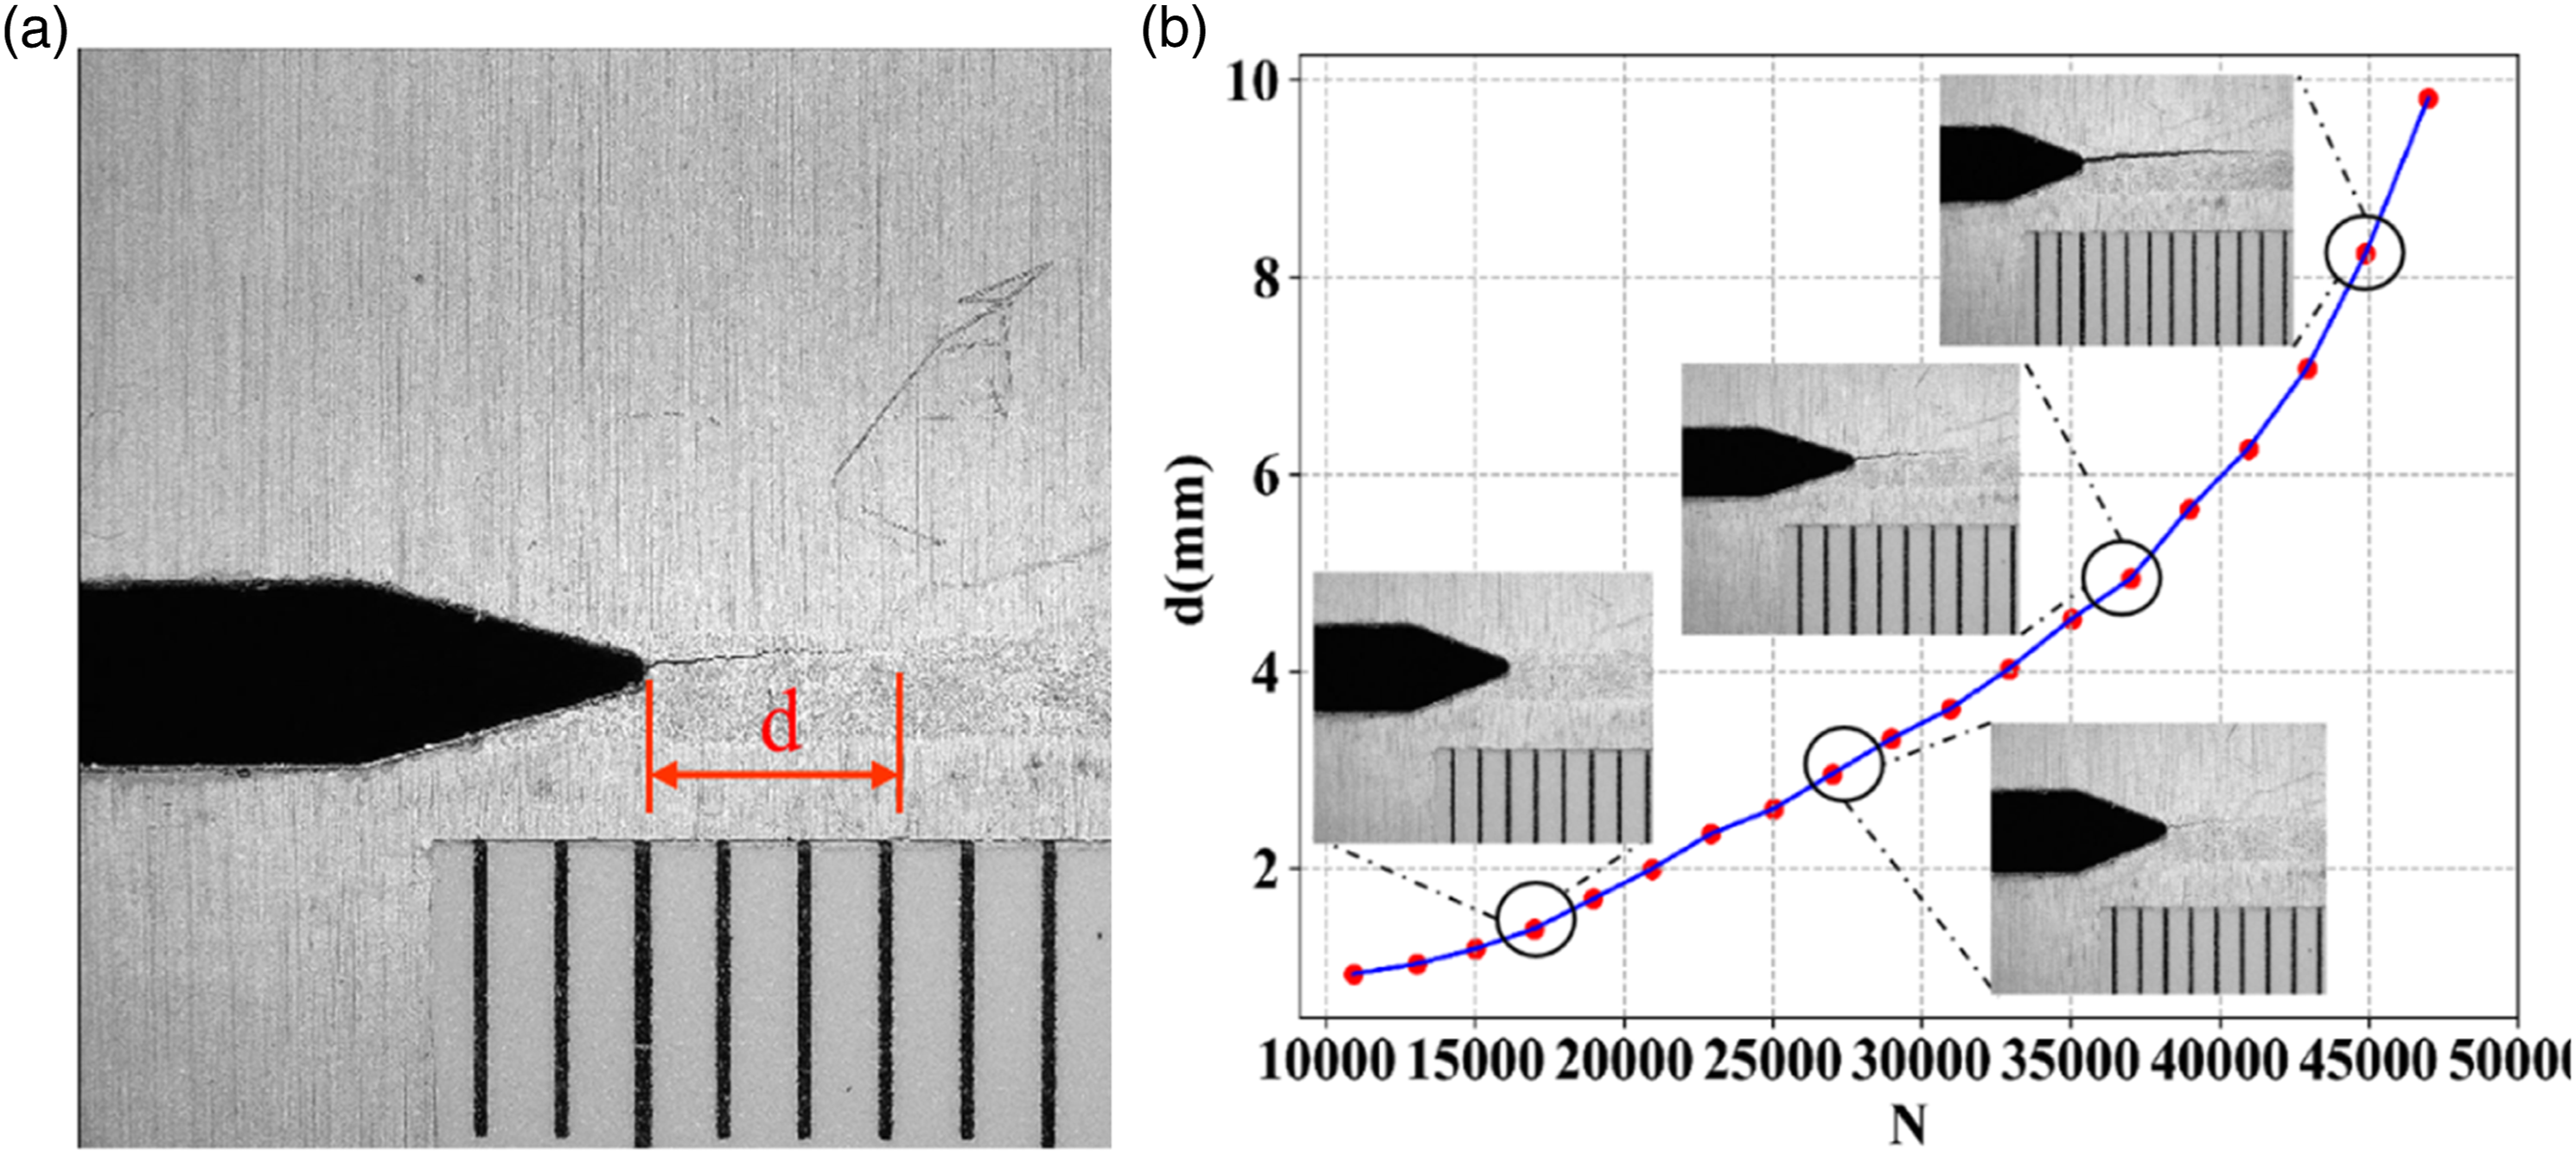
To verify the accuracy of the stress intensity factor based on optical flow information entropy, the results of the stress intensity factor obtained by the proposed method and the finite element method are compared. According to the geometric model mentioned in case 1, the finite element analysis software ABAQUS is used to model and solve the finite element method. The mechanical properties are as follows: elastic modulus E = 147 Gpa, Poisson’s ratio μ = 0.25, and yield strength The relationship between the true stress and true strain.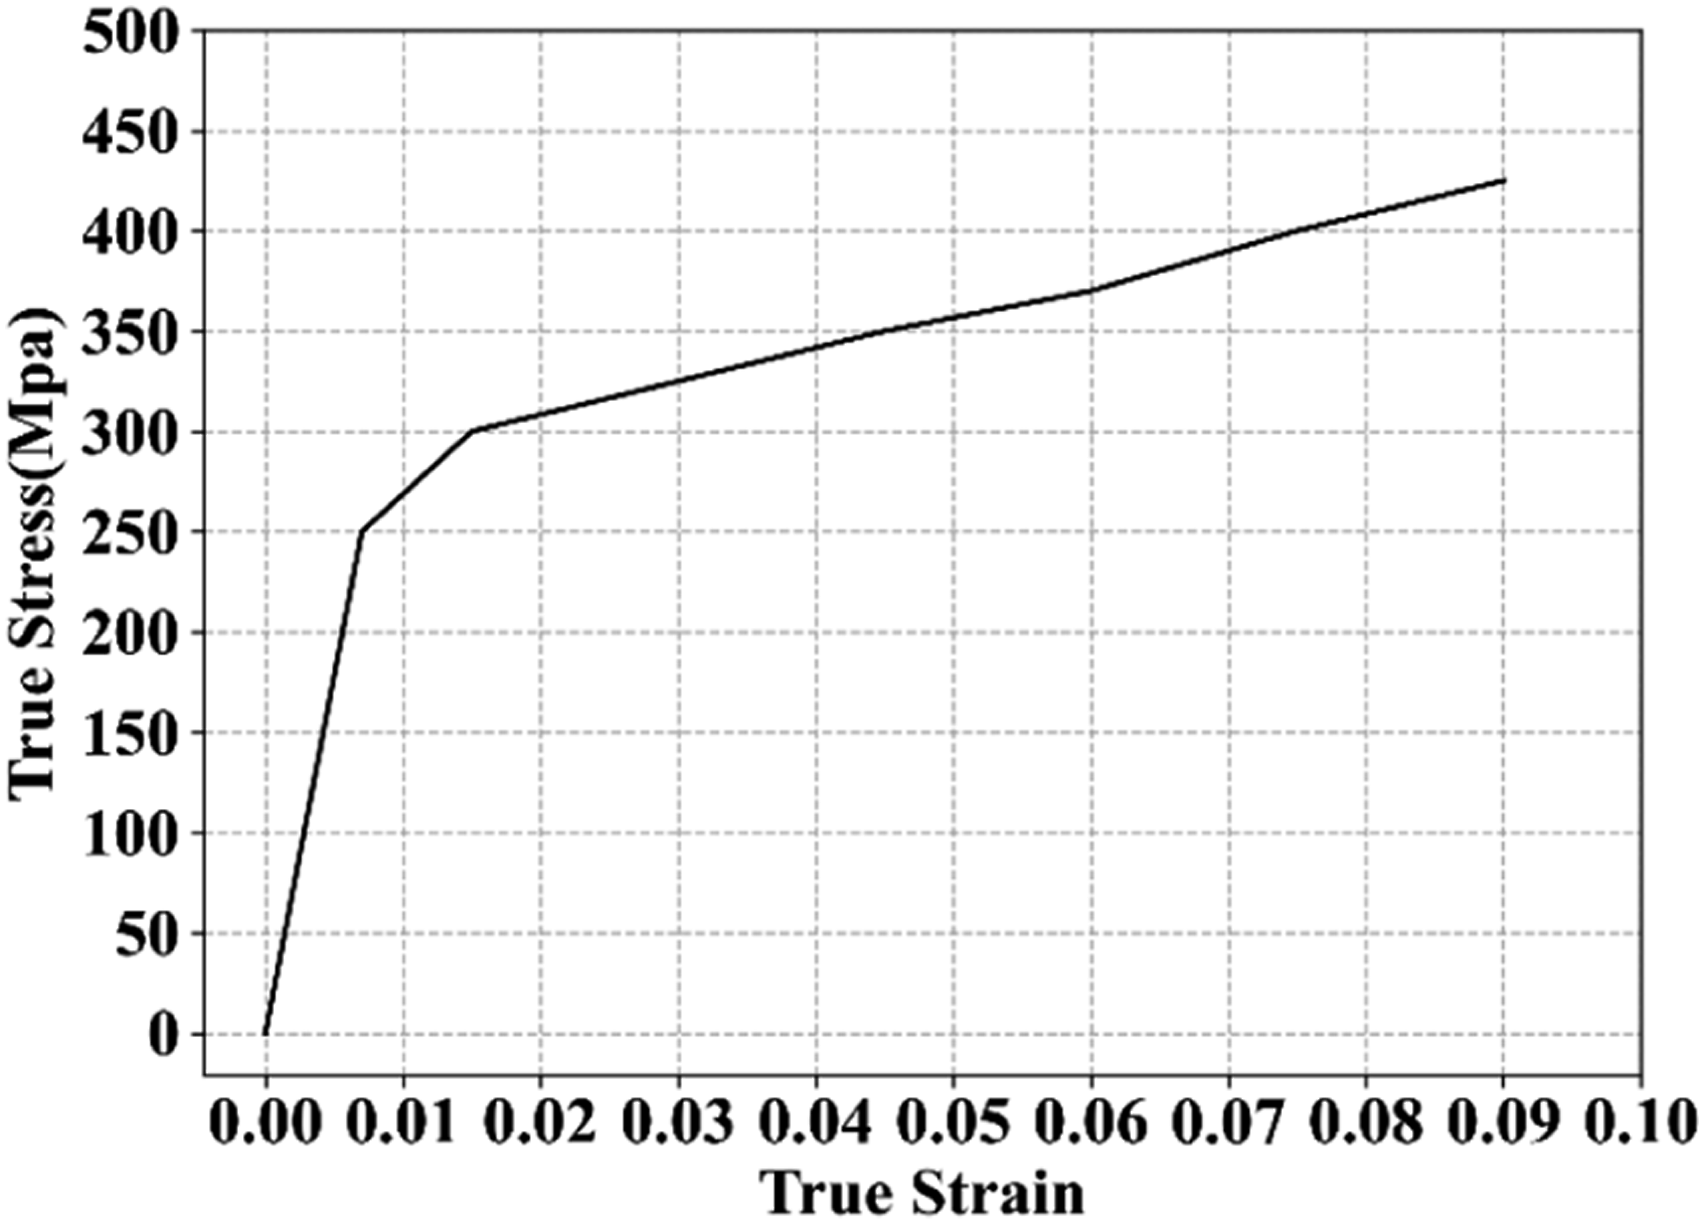
The boundary constraints and loading methods of the model is shown in Figure 20(a). Because of the higher stress gradient near the crack tip and the singularity at the crack tip, mesh refinement is needed near the crack tip. The whole mesh of the model and the local refined mesh near the crack tip are shown in Figure 20(b) and Figure 20(c), respectively. (a) The boundary constraints and loading methods; (b) the mesh; and (c) the local refined mesh near the crack tip.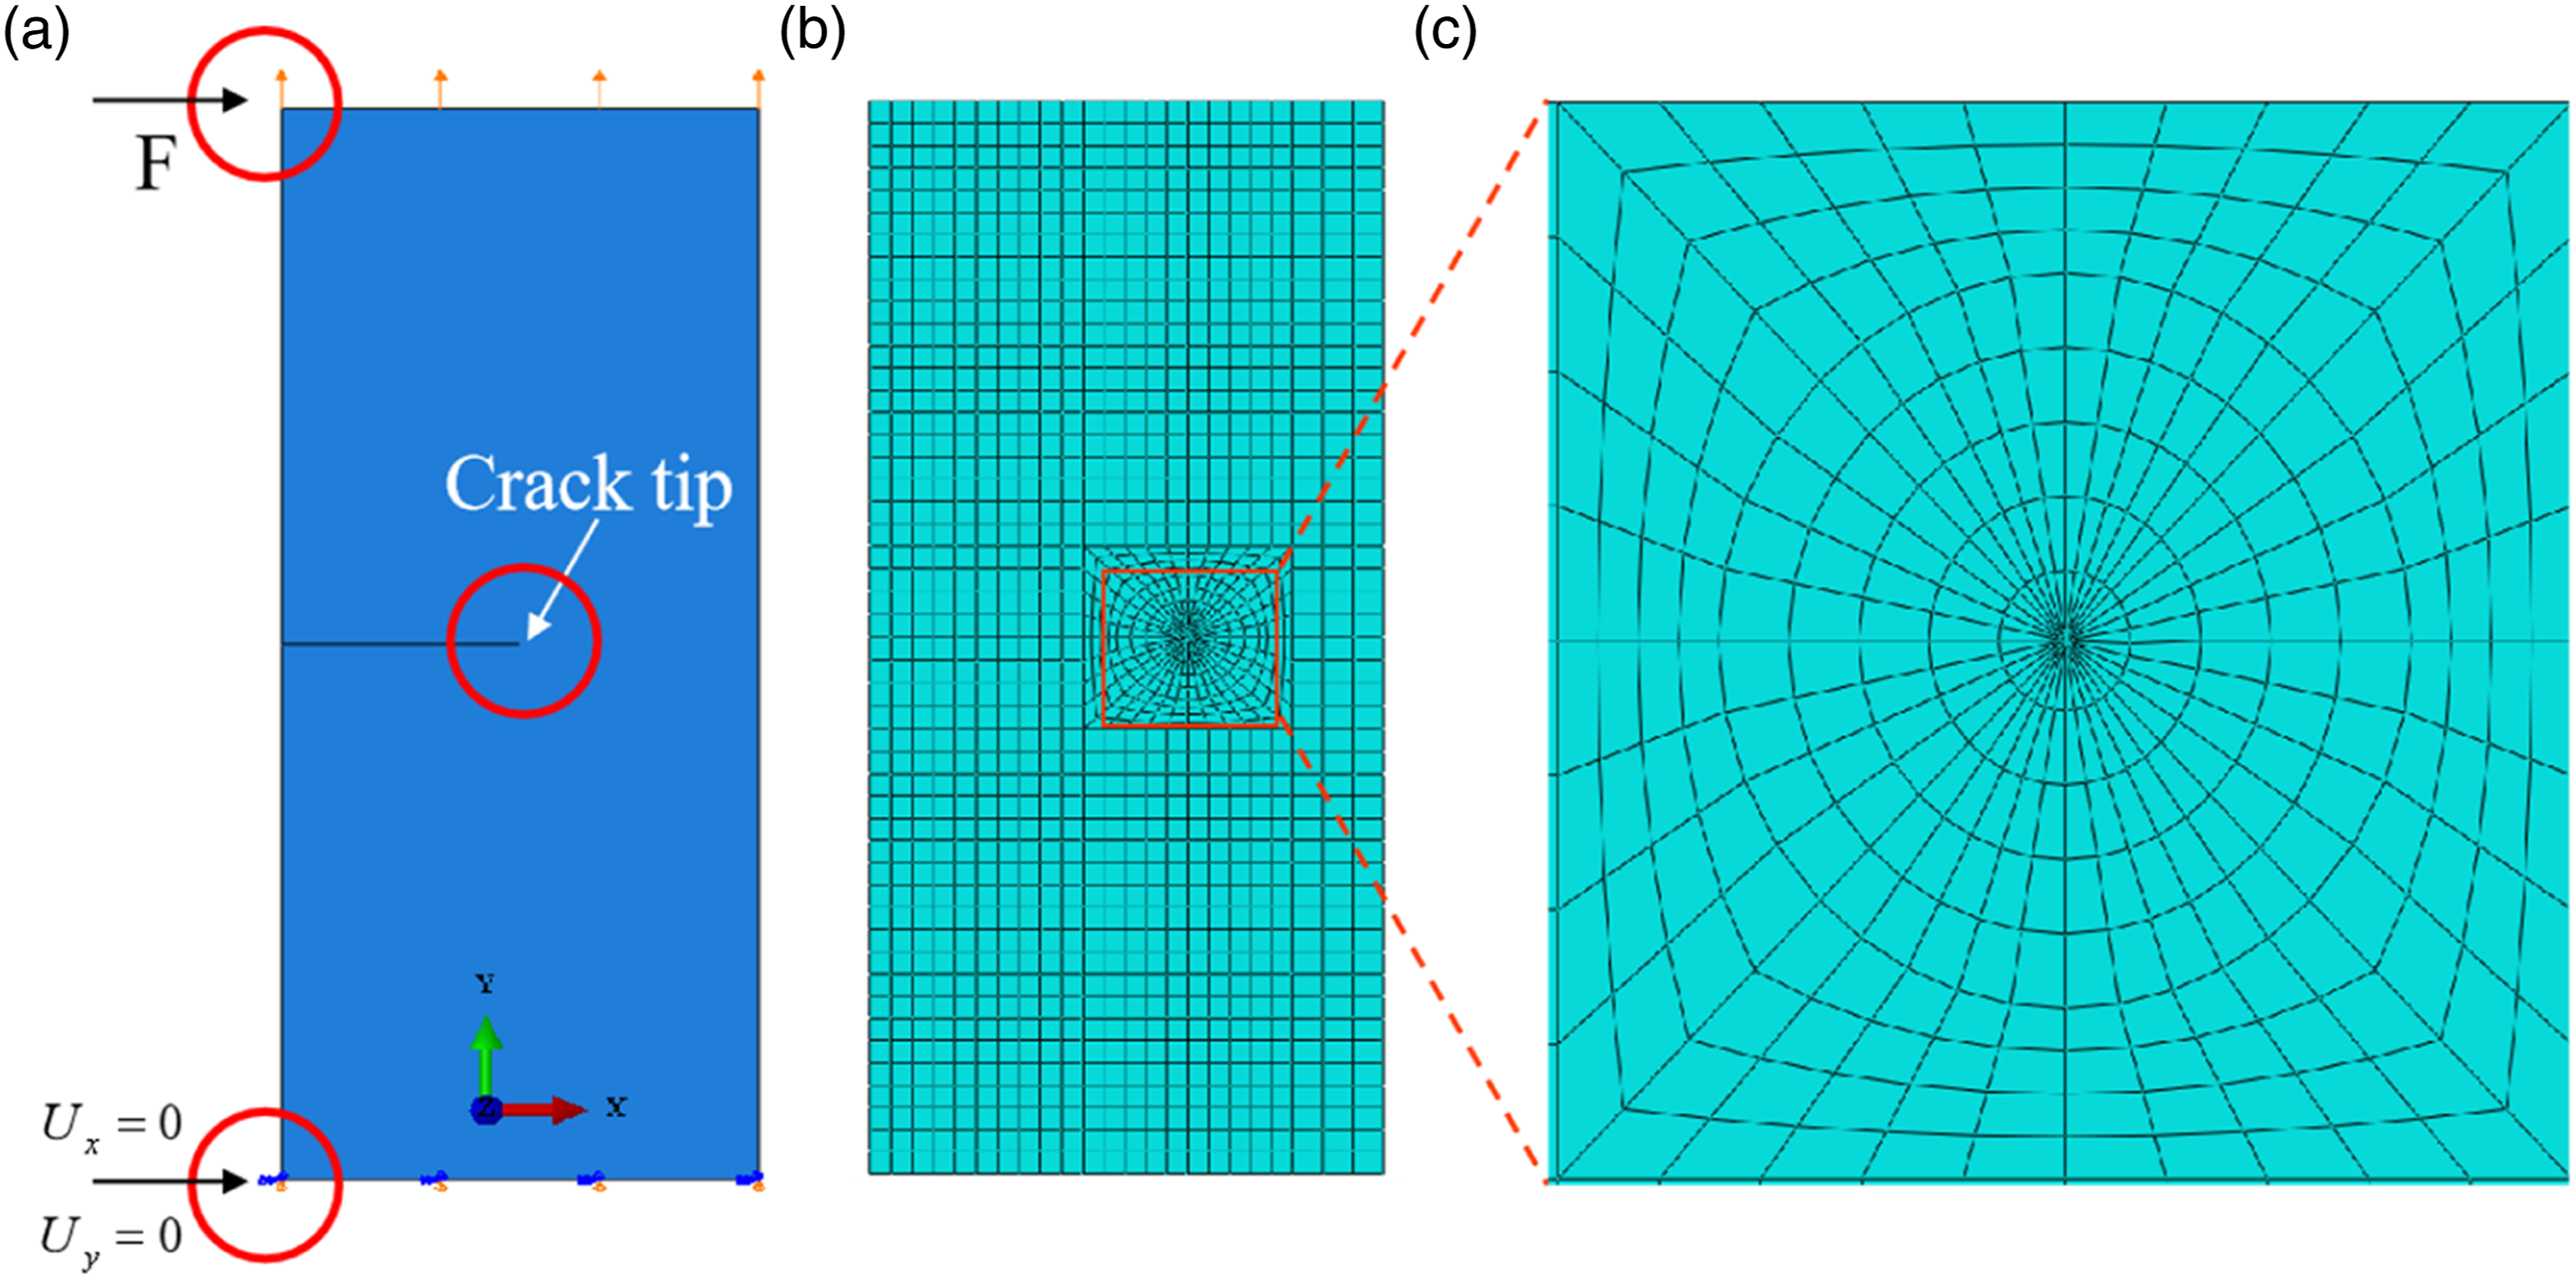
The results of the stress intensity factor based on the proposed method and the results from the finite element methods are shown in Figure 21. As it can be seen, the stress intensity factor of K increases with increasing load periods. In addition, the stress intensity factor from the proposed method and the finite element methods are in good agreement. The results show that the proposed crack detection and localization method enable measure the crack accurately and can provide support for structural safety assessment. The results of the stress intensity factor between the proposed method and the finite element methods.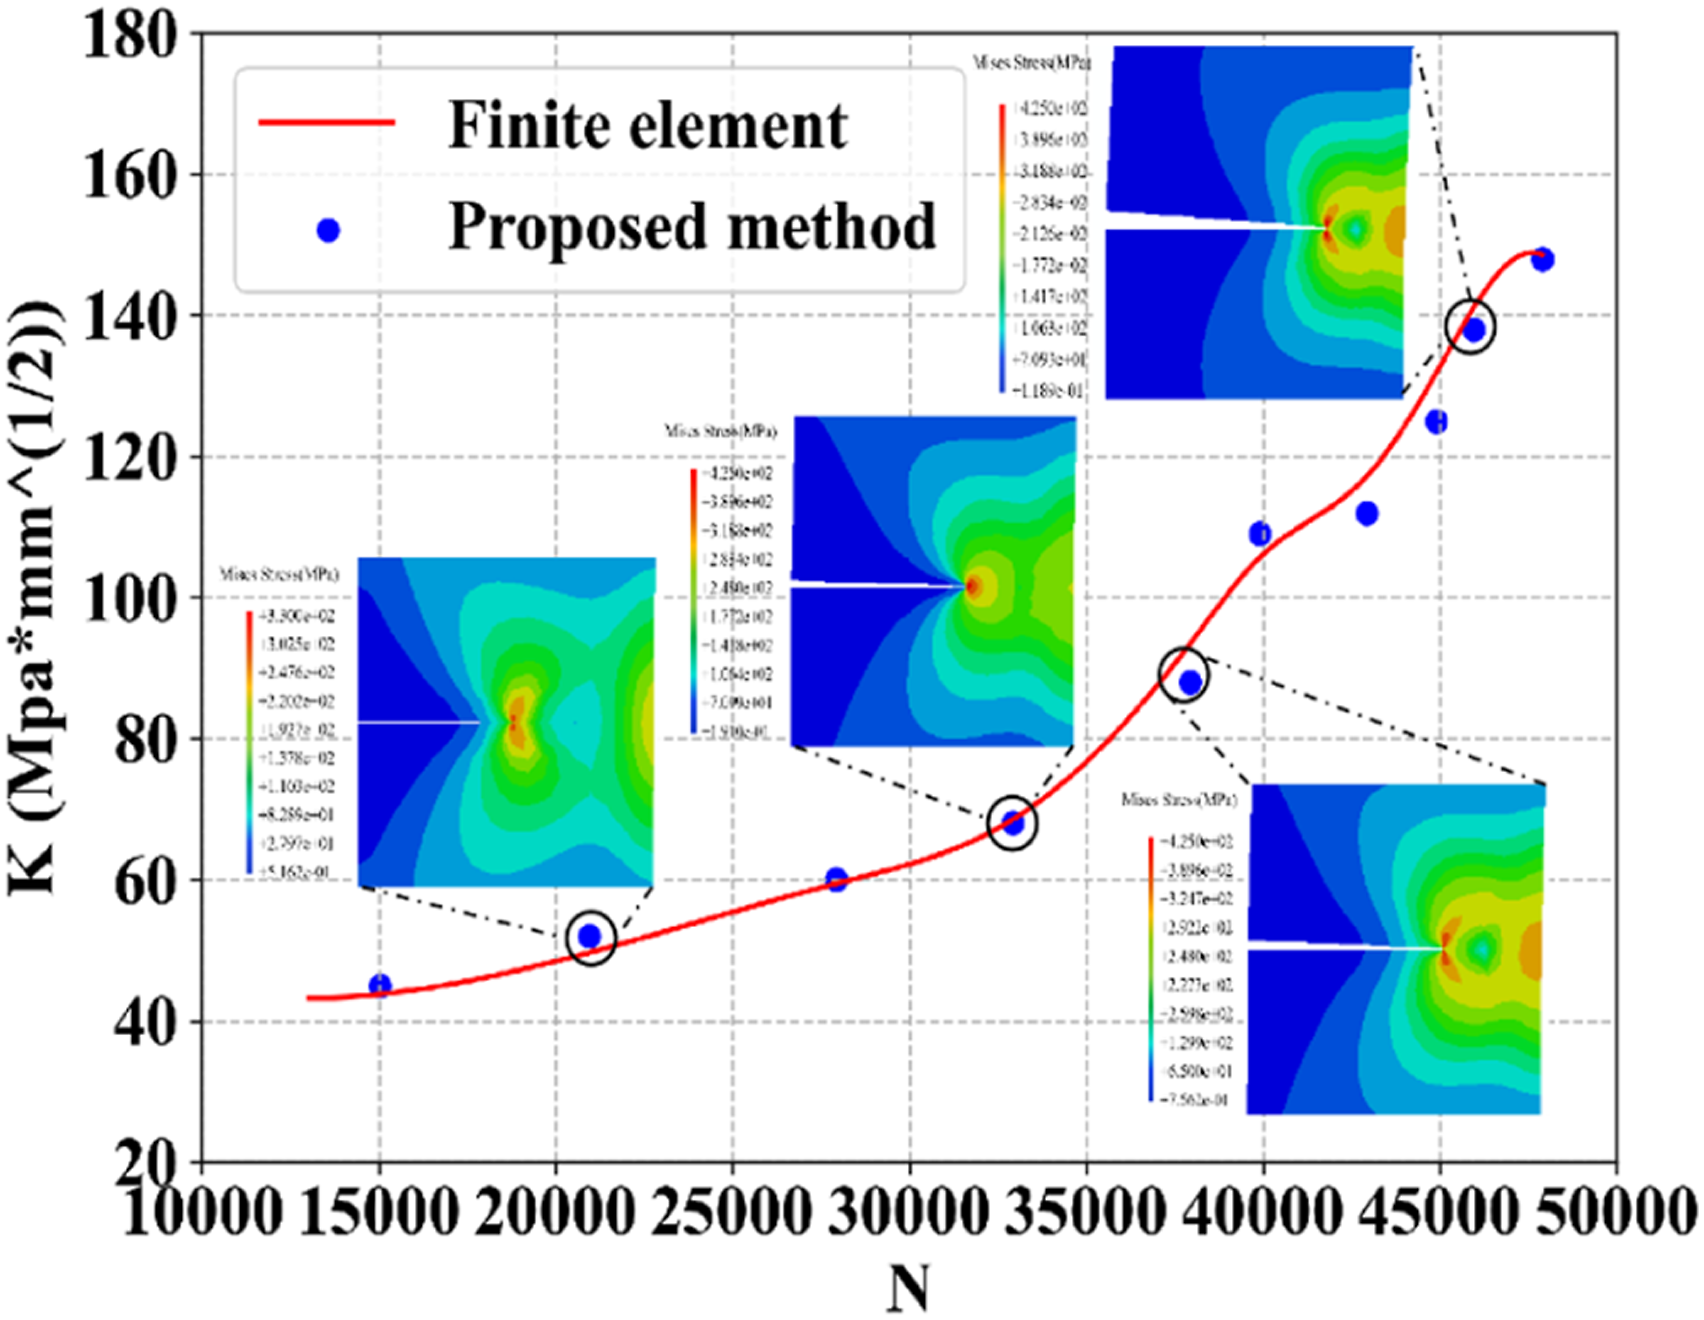
Conclusions and future work
This paper presents a new fatigue crack detection and localization method by integrating the optical flow and information entropy and tests its efficiency and precision through two different crack situations by comparing it with the existing crack detection method. In addition, based on the proposed method, the stress intensity factor has been calculated to track crack development. The following conclusions are drawn from this study: 1. The results of fatigue crack detection and localization in cases 1 and 2 show that the proposed method based on optical flow information entropy can identify fatigue cracks with complex shapes even when they are surrounded by other crack-like edges, covered by complex surface textures, or invisible to human eyes. 2. In comparison to the existing crack detection method for precision and efficiency, the proposed method outperforms that of image processing and digital image correlation. The results show that the proposed method can not only detect the crack without spraying a speckle pattern on the surface in advance, but also show high measurement accuracy and efficiency. Furthermore, the results of the stress intensity factor calculation show that the proposed method is capable of accurately measuring cracks and offering assistance for structural safety assessments.
Although the proposed crack detection and localization method has high measurement accuracy in experiments, there are still some limitations, including the fact that the structure in this study is a flat surface, and the performance of non-flat surfaces require further investigation. Furthermore, the experiments in this article are two-dimensional, and the effectiveness of the proposed method in three-dimensional space remains a challenge, particularly for the structure with complex geometry.
Footnotes
Declaration of conflicting interests
The author(s) declared no potential conflicts of interest with respect to the research, authorship, and/or publication of this article.
Funding
The author(s) disclosed receipt of the following financial support for the research, authorship, and/or publication of this article: This work is supported by the National Natural Science Foundation of China (NO. 51675406) and the Basic research project group (NO. 514010106-302).