






Abstract
The application of the electromechanical impedance (EMI) method to monitor the condition of structures is an actively researched area. This article extends the method to allow it to be incorporated into a wireless sensing device, which is embedded into freshly poured concrete to monitor initial curing and subsequent structural health. The results show that the hydrating concrete has an effect on the sensing system and that it is sensitive enough to monitor the strength development of concrete. Initial results also show that the embedded EMI method is sensitive to the removal of formwork. The response of the system to compressive testing is also investigated, and the initial results show a good correlation with previously published reports on compressive testing of concrete. Finally, the ability of the system to be incorporated into a previously developed wireless-sensing platform is investigated. The AD5933 impedance chip offers this possibility, and its response is investigated and compared with the response of the HP4192A. The results show that it is feasible to design a completely wireless-sensing device for the monitoring of the strength gain of concrete and its deterioration.
Keywords
Introduction
In the preface of his seminal book, Neville 1 contrasts the manufacture of concrete with that of steel. He states that if a designer requires a certain strength of steel, it is only required that the manufacturing process complies with the relevant standard. Even though the constituent contents of the concrete can adhere to rigorous standards, it is the concrete itself that must attain the properties specified. The main difference between the manufacture of concrete and steel is that the concrete is not manufactured in a controlled environment. As Neville memorably states, the ingredients of good concrete are the same as bad concrete and that great care is required in both making and placing to ensure that the concrete fulfils its design requirement. This statement highlights the importance of quality control in the manufacture of concrete structures, which is also evident in the number of ways that concrete, using both nondestructive and destructive methods, is monitored. 2 Properly created concrete significantly reduces maintenance costs and extends the design life of the structure.
A sensor that monitors the hydration process would provide information on instantaneous condition of the concrete and when critical actions can be taken, for example, shorework or formwork removal, which has the possibility of reducing construction times and reducing the overall costs of a project. This article presents the steps taken in the development of an embeddable wireless sensor for monitoring concrete strength development whose function can also be extended to monitor the concrete’s structural health over its lifetime.
Electromechanical impedance method
The design of any embeddable sensing device requires that a sensing method is chosen, which is easily adaptable to a sensing platform. The system should be robust, an uncomplicated inexpensive system with the minimum amount of parts and connections. As a sensing device, it should show good accuracy, sensitivity, and reproducibility. Piezoelectric materials fulfil all these requirements in a single sensing device. These materials display two phenomena – the direct and indirect piezoelectric effects. The direct piezoelectric effect is when the material is deformed, a potential difference is produced between the two electrodes, and the indirect piezoelectric effect occurs when a mechanical strain is induced when an electric field is applied.
The fundamental piezoelectric relations in matrix form are given by Brockmann. 3




where S is strain, s is the compliance matrix, T is the Cauchy stress tensor, d is the strain coefficient matrix, E is the electric field strength, D is the electric flux density, ε is the dielectric permittivity matrix and its inverse is β, and g = d/εεo, where ε is the piezoelectric material’s relative permittivity and εo is the vacuum permittivity. The mechanical conditions of constant strain are denoted by the superscript ε and those of constant stress by the superscript σ; the electrostatic conditions of constant field strength are given by the superscript E and those of constant flux density by the superscript D. The superscript T represents a transposed matrix. These equations show how the coupling of the mechanical and electrostatic fields allows the electromechanical impedance (EMI) method to use both the direct and indirect effects in combination to monitor changes in the condition of a device. In the conventional EMI method, a piezoelectric patch is applied to the device being tested; if the properties of the device change, then this results in changes in the electrical signature of the piezoelectric material. The main benefit of using EMI method is that both the actuator and sensor are located on the same system which reduces the number of components in the designed sensor and the amount of wiring required. This makes it ideal for the use on a wireless sensor. Solving the equations for a patch bonded to the surface of a structure, Bhalla and Soh 4 developed the following form of the equation for the electrical admittance:
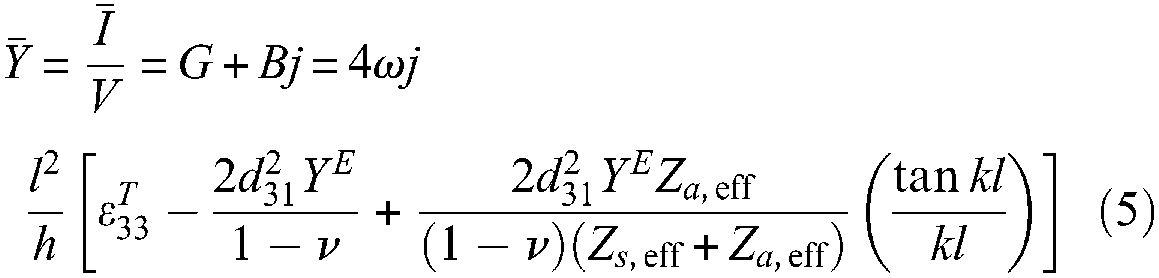
where
In concrete applications, this effect has been successfully applied by Tseng and Wang 7 to monitor incipient damage in a concrete beam. In this article, they incorporated the root mean square deviation (RMSD) method to monitor changes in the real value of admittance (Y) and conductance (G). The correlation of the RMSD index with the location and extent of the damage showed good potential as the RMSD index had the ability to detect the level of damage, as well as the depth in the beam. Park et al. 11 stated that the real part of the admittance (or impedance) is more suitable for monitoring changes as admittance signature is mainly capacitive. This means that the imaginary part plays a dominant role and is more sensitive to the temperature changes, so the real part is more suitable for monitoring purposes. Tseng and Wang 7 worked at a frequency range of 20–25 kHz, and at this frequency range, they achieved a sensing distance of 360 mm.
Shin et al. 9 examined the feasibility of using piezoelectric patches bonded to the surface of the concrete to monitor the strength development of concrete. In this test, the frequency range of 100–400 kHz was examined. The first readings were taken after 3 days with subsequent readings taken after 5, 7, 14, and 28 days. In this article, the effects of the bonding between the concrete and the patch were highlighted. The limitation of the RMSD method for monitoring the hydration is also outlined, 11 as it cannot distinguish between strength gain and loss as all changes are positive.
Bhalla and Soh 12 monitored hydration and loading using the same method. Again the patch was bonded after 3 days and was examined in the range of 100–150 kHz. The peak in conductance was found to move to the right as time passed and became sharper. This was due to an increase in stiffness and a reduction in damping, respectively. The opposite was observed when the concrete was compressively tested. Shin et al. 9 showed similar results in all but one of their compressive tests.
Strength development has also been monitored by Tawie and Lee 10 using this method. They presented three methods of monitoring the changes in the electrical signature of a piezoelectric patch attached to the structure – the RMSD method, the mean absolute percentage deviation (MAPD) method, and the correlation coefficient deviation (CCD) method. They found that the MAPD method was more sensitive to strength gain than the other methods.
A disadvantage of the described methods is that the patches must be attached after the concrete has hardened and moulds removed. This neglects an extremely important time in the strength development of the concrete – the first 36 h. It is in this time that the microstructure of the concrete is formed. Another disadvantage would be the fact that if the system is used on an onsite situation, it would be difficult to achieve standardised results as the application of adhesive, while accurate in a laboratory situation, may not be possible onsite. The drawbacks of the EMI method are well known. 13 An option would be to embed the sensors into concrete at the initial pour. This has obvious benefits – the effects of the bonding issues are reduced, although it does increase the complexity of the sensor as increased packaging is required. Chen et al. 8 characterised a PZT ceramic transducer embedded in concrete. Using an impedance analyser, they attempted to characterise the transducer as loads were applied. From this analysis, it was found that the anti-resonance showed greater monotonicity than the equivalent resonant curve.
Qin and Li 14 embedded a piezoelectric actuator and sensor into concrete to monitor the curing process using the ultrasonic pulse velocity method and noted that one of the advantages was that good coupling with the surrounding matrix, which ensured a reliable measurement. This presented a clear improvement on the patch method. It also showed that piezoelectric patches were robust enough to function when embedded into concrete. Analysis of the sensitivity of the receiver over time also indicated that it may be possible to monitor the strength using this method.
The EMI patch method described previously was advanced to allow it to be used in an embedded situation by the study of Annamdas and Rizzo, 15 whereby the patch was adhesively bonded between two steel washers. In this case, the frequency range of 0–500 kHz was examined. The sensitivity of the embedded method was found to be less than that of the surface-bonded patches. This may be due to the fact that the package developed had an adverse effect of the sensitivity of the system.
The above articles provide evidence that it is possible to use the EMI method to monitor both concrete strength development and deterioration. The aim of the research presented here is to advance the method and increase its sensitivity in an embedded platform. The frequency of sensing has been increased so as to take readings every 1 h over the first 10 days and every 6 h in the remaining 18 days. This represents an increase in the measurement increments of previous articles, where measurements were taken at a maximum rate of once a day. This article also introduces an improvement on the packaging system developed by Annamdas and Rizzo. 15 In addition to the monitoring of the strength development, the sensitivity of the method is tested by monitoring the effects of the removal of the formwork. Finally, the ability of the sensor to monitor applied loads is investigated. The loads are applied until failure to ensure that the sensing system has no effect on the overall strength of the concrete.
In this article, the sensitivity of the AD5933 is also investigated. The AD5933 is an impedance chip developed by Analog Devices. The AD5933 offers the possibility of accurate impedance measurements from a chip. If proven suitable, the method can be applied to a wireless sensor platform previously developed by the authors 16 to enable embedded wireless sensing from within concrete.
Materials and methods
The analysis of the strength gain of concrete was carried out to examine the feasibility of the embedded EMI method. This section describes the preparation of the specimens, experimental setup, and the various parameters monitored.
Specimen preparation
Four samples were created. Each sample was composed of ordinary Portland cement, sand, and coarse aggregate. The concrete was then placed into 150-mm cube moulds. Each specimen was cured in the same fashion; when poured, the concrete was immediately covered with a plastic waterproof sheet to limit moisture loss. This covering was removed after 24 h, and the concrete was allowed to cure at environmental conditions.
Sensor design
The sensors were specially designed for application to a wireless sensor previously developed by the authors. 16 The AD5933 impedance chip 17 offers the opportunity to reduce the measurement system to such a degree that it can be applied to a wireless sensing platform. The chip can be programmed to take an impedance measurement over the frequency range of 1–100 kHz. Park et al. 11 defined the most suitable frequency ranges as between 70 and 500 kHz. It is stated that less than 70 kHz may be too low as it monitors too large an area, while greater than 500 kHz results in the sensor being more sensitive to its own condition than that of the concrete. The use of the AD5933 further limits the frequency range of the sensor to between 70 and 100 kHz. It was decided to choose a material with a resonant frequency within the frequency range selected as at resonance, the material is most sensitive to the surrounding matrix. The study by Chen et al. 18 found that the anti-resonance shows greater monotonicity, so it was decided to select a material with an anti-resonance located within the frequency range of 70–100 kHz. The material selected was a soft PZT with a high mechanical quality (Q) factor. 18
Packaging of sensor
To protect the piezoceramic from the aggressive conditions within concrete, a package was required. The package comprised an epoxy coated onto the piezoceramic. The epoxy chosen was Robnor Resin PX314ZG, 19 which was a two-component cold-curing encapsulating resin. The resin and hardener were mixed in a volume ratio of 5.3:1, which required 48 h at 25°C to cure fully. A specialised mould was fabricated to carefully coat the epoxy onto the piezoceramic with a maximum wall thickness of 2 mm. The compressive strength of the package was reported as 79–86 MPa, which is much greater than the concrete being tested. This coupled with the compressive strength of the PZT ensured that the sensor would not cause premature failure within the specimen. Figure 1 shows the effect of the package on impedance signature of the concrete in the region being tested. Figure 2(c) shows the final sensor and package combination.

Effect of package on sensor response.

Experimental setup (a) schematic, (b) actual, and (c) final packaged sensor.
Measurement system
The complete measurement system consisted of an impedance analyser (Agilent HP4192A 17 ), the packaged sensor, and a personal computer. The HP4192A has a frequency range of 5 Hz–13 MHz at an accuracy of 0.005%. A LabVIEW program was designed to control the HP4192A. The HP4192A was connected to LabVIEW via a LabVIEW GPIB interface card and cable. A frequency sweep of 50–150 kHz was chosen with the frequency steps of 0.5 and 0.25 kHz. Each sweep was carried out three times and the averages read. Figures 2(a) and (b) show the complete setup. An impact GD10 hydraulic compression testing machine was used to perform the compression tests on the concrete. The machine had the ability to incrementally increase the load being applied to the concrete.
Experimental data analysis
The HP4192A reads the magnitude and phase of the impedance (Z) at each frequency. From this, it was possible to calculate the resistance (R) and reactance (X) values (Z = R + jX). It was decided to monitor the strength development through the impedance components as the anti-resonance was seen as the main region of interest. The peak resistance was monitored and the frequency at which this resistance occurred was recorded. It was also decided to use the reactance graph to monitor the anti-resonance, that is, where the reactance crossed the x-axis.
To statistically monitor the changes in the graph, the RMSD index was employed:
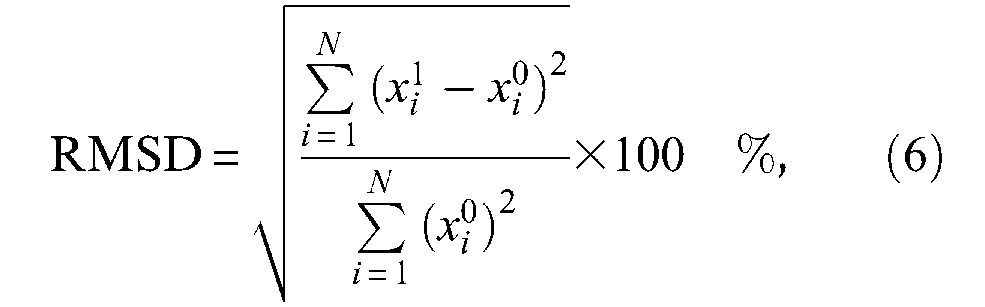
where
Strength development
The described concrete mix was prepared using a concrete mixer. When the mix was completely prepared, it was placed into the mould along with the packaged sensor. The first sweep was then run immediately. This initial sweep was taken as the base value for the RMSD method. The frequency sweeps were run every hour for the first 10 days and then subsequently reduced to every 6 h. Each specimen used a different mix, resulting in a different compressive strength.
Formwork striking
The removal of the formwork imposes new stresses which the concrete must support. These include any loading which is subsequently applied and also the weight of concrete itself. It is essential to perform the formwork striking at a time when the risk of damage due to deflections and creep is at a minimum. The effect of striking of the formwork was monitored by removing the formwork at different stages. In the first experiment, the mould was removed after 48 h. In the second specimen, the formwork was removed after 8 days. A reading was taken before and after the removal of the formwork to determine whether the method is sensitive enough to detect the removal of formwork and whether it was possible to determine an optimum time for formwork removal.
Compressive testing
The sensor system embedded within the concrete was loaded in a hydraulic compression tester. The base value for the RMSD was defined as the sweep taken before the compression testing commenced. The sensor was first loaded to 1 MPa and a sweep taken. The load was subsequently increased to 5.6 MPa and increased in steps of 1–2 MPa until complete failure. This test also determined the effect of the sensor on the strength of the concrete.
AD5933 testing
During the second strength development test, the suitability of the AD5933 to measure changes in the impedance was examined. A reading was taken each day and recorded. The RMSD was applied to these results to determine the sensitivity of the sensor. A 12-kΩ resistor was used as a calibration resistor. The peak resonance was different but as described by Mascarenas et al., 20 this was to be expected due to the internal impedance of the sensor. This was not a significant issue as changes in the impedance graph were of greater interest than shifts in the peak impedance.
Results and discussion
Strength development
Figures 3(a) and (b) show the development of the impedance components, resistance, and reactance as the concrete hydrates and hardens around the sensor. At 1 h, the resistance peak is at a frequency between 87 and 88 kHz. The reactance graph also crosses the x-axis at 87–87.5 kHz. It can be clearly seen that as the concrete hydrates, the sweep curve shifts from the left to the right as the strength develops, and after 648 h (27 days), the resistance peak is reached at a frequency between 95 and 96 kHz. The bandwidth of the curve is also seen to decrease. The reactance crosses the x-axis at a frequency between 94.5 and 95 kHz. The shift in the resistance curve peak is caused by the changes in the stiffness of the structure while the change in the bandwidth is related to the damping of the structure. 21

Impedance components as concrete hydrates: (a) resistance and (b) reactance.
Figure 4 shows the development of the anti-resonance as the concrete hydrates by monitoring both the resistance and reactance curves. It can be seen in the graph that the position of the resistance peak over the duration of curing (the red line in Figure 4), while increasing as expected, displays slightly inconsistent behaviour. The damping in the structure, although decreasing as the concrete hydrates, makes it difficult to select an exact peak position. This problem was accentuated by the fact that a 0.5-kHz sweep step was selected, and this results in an approximate position for the peak. The remaining tests were carried out using 0.25 kHz steps, and this showed an improvement. As mentioned previously, the real part of the impedance is selected due to its advantage over the imaginary part in thermally changing environments. 11 The piezoelectric material selected in this experiment was chosen as it has good temperature stability in the temperature ranges typical during the hydration of concrete. Taking this into account, it was decided to include the reactance data in the analysis. The reactance data as shown in Figure 4 show a more gradual development as the point where the reactance graph crosses the x-axis can be approximated more closely using a linear analysis.

Anti-resonance examination from resistance data and reactance data.
Using the RMSD approach, the changes in both the resistance and the reactance graph have been monitored successfully. Figure 5 shows the development of the strength of the concrete using the RMSD index. Examination of the anti-resonant frequency development and the RMSD index in the first 2 days shows similar responses in each test and so do not seem to be greatly influenced by the increased temperatures in the early stages. Further investigation is required, but this may indicate that using the reactance data may be possible for monitoring the anti-resonant peak. For this analysis, Figure 5 was separated into three stages. Stage 1 is witnessed over the first 1–2 days when the concrete is freshly mixed. In this stage, the reactions between the cement and the water proceed quickly. Stage 2 occurs over the next 3–5 days where the reactions proceed at a slower rate until stage 3, which is generally seen to start between days 5 and 8. A detailed analysis of the strength development may indicate the ideal time for formwork removal.

RMSD index versus time over curing period.
An interesting phenomenon was witnessed in both the resistance and reactance graphs whereby the value of the RMSD index drops between days 1 and 2. This effect is detailed in Figure 6. The experiment was repeated a number of times to determine whether this was a problem caused by the setup or whether it occurred in each case to different degrees and at different stages. The package material was also changed to determine whether it was caused by the package, but the effect was witnessed in each case. Further study of this effect is required. This change was displayed by an increase in the peak resistance of the graph with a slight retardation of the anti-resonant shift of the structure. It may be possible that this is caused by debonding cracks, probably caused by the hardening process – for example, by differential shrinkage. 22

Detail of interesting phenomenon.
Compression testing
Figure 7 shows the effect that the loading regime had on the resistance sweep. The graph shows samples of the sweeps as a percentage of the final failure load (32.2 MPa). A 50% of failure is 16.1 MPa. Very little change in the graph can be seen from the graph until 50% of the maximum load the sample can withstand. It can be seen that the peak then shifts to the left as loading continues to increase. This is the opposite to what occurs when the concrete is in its hydration stages when the concrete is stiffening, and this can be seen as increased loss in the stiffness of the structure as the load is further increased. At complete failure, the peak resonance shifts to the left by almost 4 kHz. This trend in the development of the impedance signatures was also seen by Bhalla and Soh. 12

Compression test effects on frequency sweep.
Analysis of the RMSD index (Figure 8) and the development of the peak resistance (Figure 9) allow the failure development to be broken into three stages. The first stage is the 0- to 7-MPa stage where the resistance peak increases with the application of the load. In the RMSD index, this is shown by the linear region of the graph. This section is represented by the 20% failure point in Figure 7. There is very little change in the anti-resonant frequency at this stage. Stage 2 is seen in the RMSD index as a change in the slope of the graph over the range of 7–24 MPa. In the development of the resistance peak as seen in Figure 9, the value starts to decrease for the first time. This is matched by a slow shift to the left of the anti-resonant frequency. Further increasing of the load (24–32 MPa) shows an increase in the slope of the RMSD index with a rapid drop in the impedance peak. This is matched by an increase in the rate of the resonant shift. Above 25 MPa, the larger visible cracks begin to appear, which seriously undermine the strength of the concrete. As the loading continues, these cracks propagate rapidly, resulting in a largely weakened structure. It may be possible to describe the development of the graphs taking into account the current knowledge of failure processes in concrete22–24 and the condition of the concrete in the immediate vicinity of the sensor. The dynamics of failure at the aggregate–cement interface have been described by Hsu et al. 23 and Vile. 24 In the initial stages, microcracks are induced in the concrete but do not have a large effect on the condition of the concrete. These microcracks occur in the aggregate–cement interface 23 (in this case also represented by the sensor–cement interface). In this region, testing has shown that the stress–strain curve is almost straight 22 but that this microcracking causes a slight curvature in the stress–strain curve. This is witnessed until at the 7-MPa stage where the change in the response of the sensor may be caused by the microcracks beginning to grow in the vicinity of the sensor. As the load is further applied, the occurrence of these microcracks increases, and they also increase in size. This can be seen in the 7- to 24-MPa stage of both graphs. After 24 MPa, these cracks grow and form continuous macrocracks, which propagate leading to failure.

RMSD (%) of compression testing.

Development of peak resistance with loading.
As the concrete was designed to have a 28-day strength of 25 MPa, and complete failure occurred at 32.2 MPa, it can be concluded that the sensor and package had limited effect on the concrete strength. The minimal change in the shape of the curve in Figures 8 and 9 also indicates that failure did not occur in the vicinity of the sensor until the design strength was achieved. As expected, this is the case at 100% failure, but at 75% of the failure load the first indication of failure throughout the concrete specimen is witnessed. Analysis of the results shows that failure at the sensor -cement interface (which represents the condition of the surrounding aggregate-cement condition) began between 24 and 27 MPa and quickly propagated until failure at 31 MPa. This may indicate that the failure of the structure was due to failure at the aggregate–cement interfaces throughout the structure and can account for the changes in the resistance peak of the sensor.
Formwork striking analysis
The sensitivity of the method to detect changes in the structure was investigated by examining the effects of the removal of formwork. Two tests were carried out – on one sample, the formwork was removed after 2 days, and on the second sample, the formwork was removed after 8 days. Figures 10(a) and (b) show the effect that the formwork removal had on the RMSD index. Analysis of the frequency shift and the RMSD index of the structure show a change in the condition of the structure. Figure 10(a) shows the response of the sensor after the formwork was removed after 2 days, while Figure 10(b) shows the response from the second test where the formwork was removed after 8 days. Figure 10(a) also shows clearly the phenomenon discussed in the previous section, which occurs after 1.3 days. As can be seen from both figures, the RMSD index drops in both graphs – by almost 1% in Figure 10(a) and by 0.8% in Figure 10(b).

Analysis of formwork removal times: (a) 2 days and (b) 8 days.
The analysis of the resistance and reactance graphs gives the source of the changes in the RMSD index graphs. This change was caused by a decrease in the anti-resonant frequency and a change in the peak resistance. The analysis also showed that when the formwork was removed after 2 days, the system took 8 h to return a situation where the anti-resonant frequency increases, while the specimen in which the formwork was removed after 8 days returned to its normal condition almost immediately. This can also be seen in Figure 10. The cause of this phenomenon may be due to two possibilities. The first is that the frequency range employed means that the sensor is sensitive to the presence of the formwork. Reapplication of the formwork seems to rule this possibility out as this had no effect on either of the impedance signatures. The second possibility is that when the formwork is removed, the concrete that is no longer supported ‘relaxes’ under its own weight. If this occurs in the early stages, then it may exacerbate the debonding issue described in the previous section.
AD5933 analysis
The ability of the AD5933 to be incorporated into a wireless-sensing platform developed previously by the authors 16 was also investigated. To use the AD5933, a calibration resistor is required to set the sensitivity of the system. The choice of the correct calibration resistor determines the overall accuracy of the system. In this case, AD5933, after a number of preliminary tests, was calibrated using a 12-kΩ resistor. The analysis of the structure with the AD5933 did not take place until day 2 due to issues with selecting a suitable resistor. Figure 11 shows the development of the magnitude of the impedance as the concrete hydrates. Similar to the response of the HP4192A as can be seen in Figure 11, the sweep graph shifts to the right as the concrete hardens around the material. The sweep shows a different magnitude to the HP4192A, but the actual magnitude is less important than that of changes. For this reason, the impedance graph was also analysed using the RMSD index and compared with that of the HP4192A. The changes were more important as to limit the amount of data being sent wirelessly. To transmit enough data to rebuild the entire resistance or reactance curve would require a large amount of data to be transmitted at each reading. The importance of summary information to define the condition of the structure can be seen in the fact that the wireless system developed by Mascarenas et al., 25 the radio used 70% of the power consumed in each read and transmit sequence.

Response of AD5933 to the strength development.
Figures 12(a) and (b) show the comparison of the AD5933 with the HP4192A. Figure 12(a) compares the RMSD index of the impedance curve of the HP4192A and the AD5933. Both graphs show the same slope, which shows that each graph changes at the same rate, which indicates that the AD5933 accurately follows the strength development. To determine whether the AD5933 can monitor the changes in stiffness, the phase graph was compared with that of the HP4192A, more specifically where the phase graph crosses the 0° axis. The results of this analysis are shown in Figure 12(b). It can be seen again that the graphs follow one another accurately with the largest difference being a difference of 0.8 kHz. What is of greater interest is that both systems show a similar response, which indicates that the AD5933 can be used to accurately follow the strength development of the concrete as it hydrates and that it would be possible to create a monitoring algorithm incorporating a statistical index (in this case the RMSD) with the frequency shift analysis. The errors in the readings are due to the internal impedance of the chip itself and the calibration resistor used. Due to the range of impedances encountered by the PZT at resonance during the sweep and the changes as the concrete hydrates, it is important to select the correct calibration resistor. Further investigation into the choice of calibration resistors is currently being carried out.

Comparison of AD5933 with HP4192A: (a) RMSD index and (b) anti-resonant frequency.
Conclusion
Testing has shown that it is possible to further develop the EMI method as an embedded method of monitoring the strength development and deterioration of concrete. The analysis of the impedance of the system over time has shown that it is very sensitive to the development of the strength of the concrete as it hydrates. The responses are similar to those recorded in the literature regarding the development of the respective impedance signatures. The method is sensitive enough to sense the removal of formwork and possibly debonding effects on aggregate and the effect that these have on the concrete. If the formwork is removed too early, the peak resistance and the peak frequency change and do not recover for a number of hours. When removed after 8 days, the sensor shows a similar change but recovers these values much more quickly. Compressive testing of the concrete also shows promising results. The response of the sensor can be compared with that in the literature and the response described by current failure models. The observed resistance peak shows good potential as indicating the condition of the sensor-cement bond, while anti-resonant frequency shows a good indication of the stiffness of overall structure. Finally, for application to a wireless sensor, the AD5933 impedance chip was analysed as a possible replacement for the HP4192A impedance analyser. The results of this testing show that the chip shows a similar response to the HP4192A and can be used in a wireless-sensing device. The use of the RMSD method in conjunction with monitoring the impedance peak and anti-resonant shift via either the resistance or reactance graph shows promise as a method of monitoring concrete hydration and structural health with the monitoring of reactance showing a much more reliable method of monitoring resonant shift. Initial results show that reactance is not any more sensitive to the temperature than resistance, but further study is required to confirm this observation. More detailed package design and choice of the package material are required to ensure that the package–cement interface does not initiate failure of the concrete.
Footnotes
Acknowledgements
Funded in part by the Technological Sector Research (TSR) Strand III 2006 project ‘Smart Systems Integration’ funded by the Higher Education Authority. The support of the technical staff in Cork Institute of Technology, Ms M. Shorten and Mr J. Morgan in the Civil Engineering Department and Mr T. Forde and Mr G. Rasmussen in the Mechanical Engineering Department, is also gratefully acknowledged.